Embed Size (px)
Citation preview
Introduction
One of the most challenging analytical problems with increasing importance is the possibility to analyze soil polluted by the dispersion of organic fluids which sometimes features particularly high boiling points. The current techniques used solvent extraction and headspace chromatographic analysis, have shown their limits. Solvent extraction needs time consuming sample preparation. Headspace makes it impossible to heat the sample at temperatures exceeding 200 °C, which risks not being able to identify the heaviest fractions of the polluting agents.
The TG-IR technique allows to overcome both limitations, allowing the sample to be analyzed without any preliminary preparation, and easily heated up to 1000 °C.
The problem
PerkinElmer’s lab receives a sample of soil, containing unknown pollutants with the indication that diesel fuel could be the eventual pollutant. The objective is to determine if the sample is actually polluted, and to possibly identify the chemical nature of the polluting agent.
Thermogravimetric Analysis –Infrared Spectroscopy
A P P L I C A T I O N N O T E
Author
M.G. Garavaglia
PerkinElmer, Inc. Shelton, CT USA
Analysis of Polluted Soil by TG-IR Technique
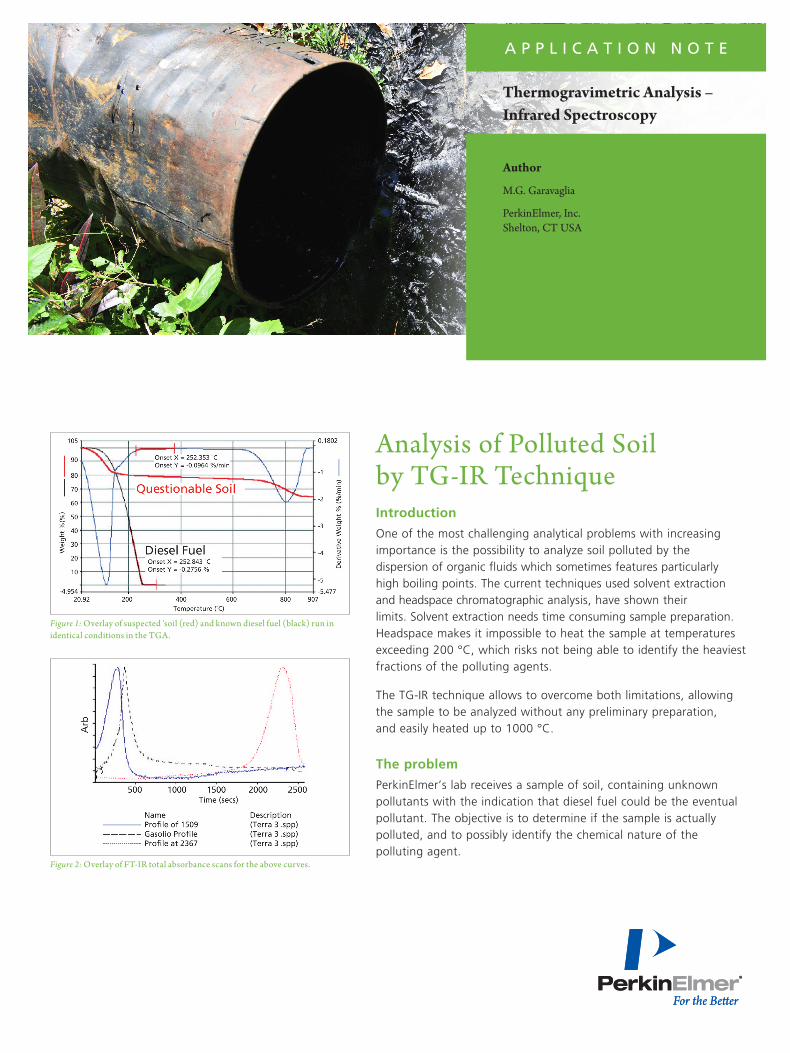
Figure 1: Overlay of suspected 'soil (red) and known diesel fuel (black) run in identical conditions in the TGA.
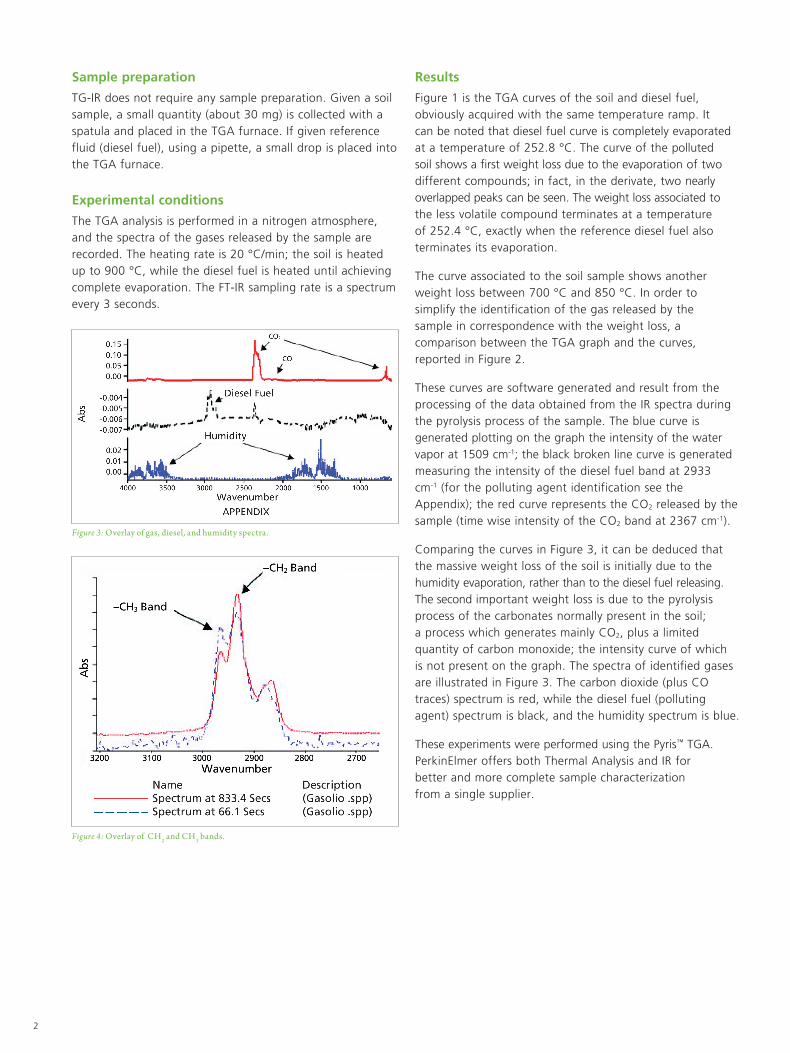
Figure 2: Overlay of FT-IR total absorbance scans for the above curves.
2
Results
Figure 1 is the TGA curves of the soil and diesel fuel, obviously acquired with the same temperature ramp. It can be noted that diesel fuel curve is completely evaporated at a temperature of 252.8 °C. The curve of the polluted soil shows a first weight loss due to the evaporation of two different compounds; in fact, in the derivate, two nearly overlapped peaks can be seen. The weight loss associated to the less volatile compound terminates at a temperature of 252.4 °C, exactly when the reference diesel fuel also terminates its evaporation.
The curve associated to the soil sample shows another weight loss between 700 °C and 850 °C. In order to simplify the identification of the gas released by the sample in correspondence with the weight loss, a comparison between the TGA graph and the curves, reported in Figure 2.
These curves are software generated and result from the processing of the data obtained from the IR spectra during the pyrolysis process of the sample. The blue curve is generated plotting on the graph the intensity of the water vapor at 1509 cm-1; the black broken line curve is generated measuring the intensity of the diesel fuel band at 2933 cm-1 (for the polluting agent identification see the Appendix); the red curve represents the CO2 released by the sample (time wise intensity of the CO2 band at 2367 cm-1).
Comparing the curves in Figure 3, it can be deduced that the massive weight loss of the soil is initially due to the humidity evaporation, rather than to the diesel fuel releasing. The second important weight loss is due to the pyrolysis process of the carbonates normally present in the soil; a process which generates mainly CO2, plus a limited quantity of carbon monoxide; the intensity curve of which is not present on the graph. The spectra of identified gases are illustrated in Figure 3. The carbon dioxide (plus CO traces) spectrum is red, while the diesel fuel (polluting agent) spectrum is black, and the humidity spectrum is blue.
These experiments were performed using the Pyris™ TGA. PerkinElmer offers both Thermal Analysis and IR for better and more complete sample characterization from a single supplier.
Sample preparation
TG-IR does not require any sample preparation. Given a soil sample, a small quantity (about 30 mg) is collected with a spatula and placed in the TGA furnace. If given reference fluid (diesel fuel), using a pipette, a small drop is placed into the TGA furnace.
Experimental conditions
The TGA analysis is performed in a nitrogen atmosphere, and the spectra of the gases released by the sample are recorded. The heating rate is 20 °C/min; the soil is heated up to 900 °C, while the diesel fuel is heated until achieving complete evaporation. The FT-IR sampling rate is a spectrum every 3 seconds.
Figure 3: Overlay of gas, diesel, and humidity spectra.
Figure 4: Overlay of CH2 and CH3 bands.
3
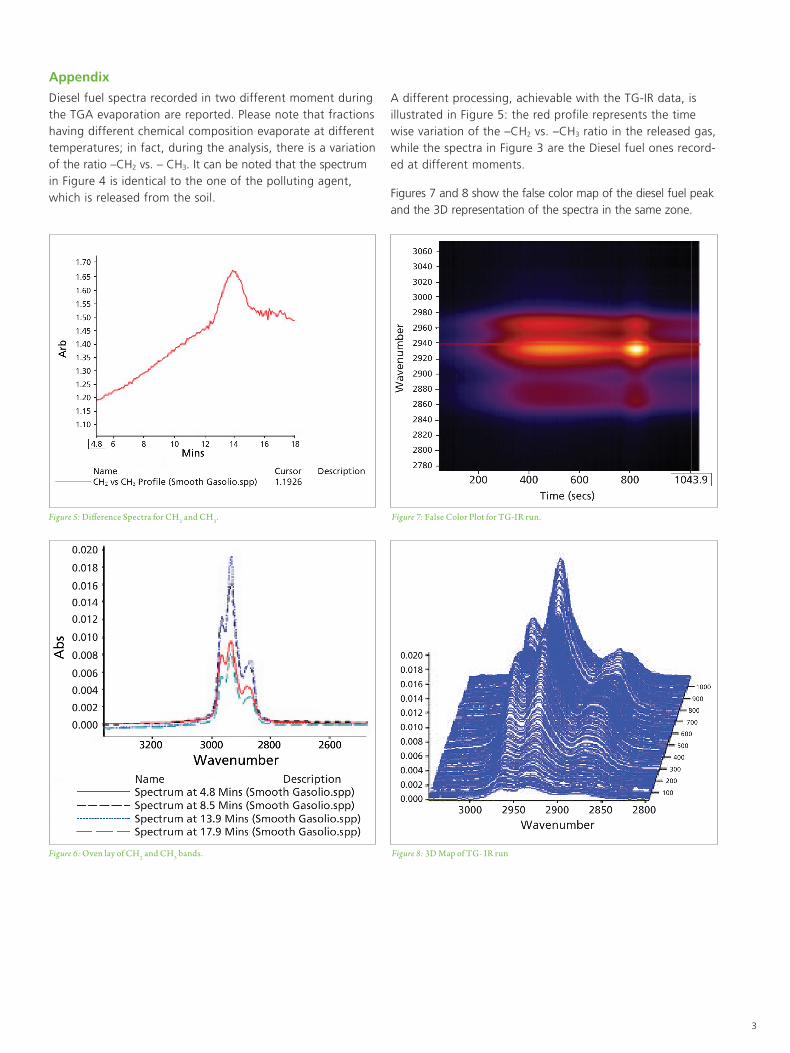
A different processing, achievable with the TG-IR data, is illustrated in Figure 5: the red profile represents the time wise variation of the –CH2 vs. –CH3 ratio in the released gas, while the spectra in Figure 3 are the Diesel fuel ones record-ed at different moments.
Figures 7 and 8 show the false color map of the diesel fuel peak and the 3D representation of the spectra in the same zone.
Appendix
Diesel fuel spectra recorded in two different moment during the TGA evaporation are reported. Please note that fractions having different chemical composition evaporate at different temperatures; in fact, during the analysis, there is a variation of the ratio –CH2 vs. – CH3. It can be noted that the spectrum in Figure 4 is identical to the one of the polluting agent, which is released from the soil.
Figure 5: Difference Spectra for CH2 and CH3.
Figure 6: Oven lay of CH2 and CH3 bands.
Figure 7: False Color Plot for TG-IR run.
Figure 8: 3D Map of TG- IR run

For a complete listing of our global offices, visit www.perkinelmer.com/ContactUs
Copyright ©2011-2014, PerkinElmer, Inc. All rights reserved. PerkinElmer® is a registered trademark of PerkinElmer, Inc. All other trademarks are the property of their respective owners. 009930_01
PerkinElmer, Inc. 940 Winter Street Waltham, MA 02451 USA P: (800) 762-4000 or (+1) 203-925-4602www.perkinelmer.com