Embed Size (px)
Citation preview
biomolecules
Communication
Analysis of Protein Disorder Predictions in the Lightof a Protein Structural Alphabet
Alexandre G. de Brevern
INSERM, UMR_S 1134, DSIMB, Univ Paris, INTS, Laboratoire d’Excellence GR-Ex, 75015 Paris, France;[email protected]; Tel.: +33-1-44493000
Received: 15 June 2020; Accepted: 18 July 2020; Published: 20 July 2020�����������������
Abstract: Intrinsically-disordered protein (IDP) characterization was an amazing change of paradigmin our classical sequence-structure-function theory. Moreover, IDPs are over-represented in majordisease pathways and are now often targeted using small molecules for therapeutic purposes. This hashad created a complex continuum from order-that encompasses rigid and flexible regions-to disorderregions; the latter being not accessible through classical crystallographic methodologies. In X-raystructures, the notion of order is dictated by access to resolved atom positions, providing rigidityand flexibility information with low and high experimental B-factors, while disorder is associatedwith the missing (non-resolved) residues. Nonetheless, some rigid regions can be found in disorderregions. Using ensembles of IDPs, their local conformations were analyzed in the light of a structuralalphabet. An entropy index derived from this structural alphabet allowed us to propose a continuumof states from rigidity to flexibility and finally disorder. In this study, the analysis was extended tocomparing these results to disorder predictions, underlying a limited correlation, and so openingnew ideas to characterize and predict disorder.
Keywords: protein structures; intrinsic disorder proteins; intrinsic disorder regions; X-ray structures;nuclear magnetic resonance; molecular dynamics; protein blocks; protein flexibility; mobility
1. Introduction
Analyses of protein structures have been extensively done in light of classical repetitive secondarystructures, namely the α-helices and the β-sheets, connected by loops [1]. Since the end of the1980s, more complex structural alphabets (SAs) entirely describing protein structures, have beendeveloped [2,3] and applied to multiple tasks e.g., protein superimposition [4–6], molecular dynamicsanalysis [7], binding site detections [8], flexibility prediction [9], or threading approaches [10,11].In this field, protein blocks (PBs), structural alphabets have been particularly successful [12]. Recently,they have been used to analyze flexibility of protein structures [13,14] and molecular dynamicssimulations [15], e.g., integrins [16], HIV-1 capsid protein [17], and the N-methyl-D-aspartate receptor(NMDA) receptor channel gate [18]. Nonetheless, all these studies did not look at an essential part ofthe proteins. They only focused on ordered regions.
Intrinsic disorder is characterized by lack of stable tertiary structure under physiologicalconditions [19]. Approximately 19% of residues in these proteins are disordered and essentialfor multiple cellular functions that involve protein-protein, protein-nucleic acid, and virus-hostinteractions [20]. The intrinsically-disordered proteins (IDPs) [21–24] do not have a well-defined 3-Dstructure but rather adopt an ensemble of conformations that are functional in solution [25]. IDPs existas dynamic ensembles, within which atom positions and backbone angles exhibit random temporalfluctuations [26,27].
Both experimental and computational approaches have been used to address the questions ofIDPs. Nuclear magnetic resonance (NMR) provides quantitative residue-level information on structure
Biomolecules 2020, 10, 1080; doi:10.3390/biom10071080 www.mdpi.com/journal/biomolecules
Biomolecules 2020, 10, 1080 2 of 13
and dynamics of IDPs as structural ensembles [28]. Small-angle X-ray scattering (SAXS) and electronmicroscopy (EM) gives an in-situ ensemble model describing the conformational behavior of thedisordered region. Molecular dynamics (MDs) is used to refine and propose such ensembles [29–31].
Another important point is that the classical sequence-structure-function dogma was questionedby these extremely fast movements and the rigid, flexible, and deformable dynamic states that it mayacquire or lose [32,33], but is can be also be a patchwork of ordered and disordered regions [34].
Hence, within the analyses of flexibility in globular proteins, PBs were applied to an ensembleof structural models of IDPs, provided in a dedicated database named PED3 (Protein EnsembleDatabase) [35]. Using Neq, an entropy index derived from this structural alphabet, we underlinedits interest to measure these local dynamics, and to quantify the continuum of states from rigidityto flexibility, and finally disorder. Non-disordered regions in the ensemble of disordered proteinswere also underlined [36,37]. PBs had been efficiently used to highlight rigid local domains withinflexible regions and so discriminate deformability and mobility concepts. To access IDP structuralinformation is sometimes complex. A large number of prediction approaches exist. A remainingquestion was the question of the relationship between this new quantification and the quality ofdisorder prediction approaches. Indeed, through our different researches, rigid regions (i.e., mobileregions) were underlined between two flexible regions (i.e., deformable regions); these domains canbe interpreted as disordered when they are not entirely disordered. This peculiarity can bias theprediction of disorder regions. In this study, two distinct prediction methodologies were used in thisway and the correlation named Neq was evaluated.
2. Materials and Methods
2.1. Dataset
The IDP ensembles of structures were taken from Protein Ensemble Database (PED3). This databaseof conformational ensembles describes flexible proteins (http://pedb.vib.be/index.php, accessed on 25May 2020) [35] and has 24 entries. The different IDPs came from different techniques, i.e., SAXS andNMR, NMR alone, SAXS alone and molecular dynamics [38–48] and have been analyzed in [36].
2.2. Neq Entropy Index
Protein blocks (PBs) are the most widely-used structural alphabet composed of 16 localprototypes [12]. It is employed to analyze local conformations of protein structures from the ProteinData Bank (PDB) [49] (see [3] for a review of the structural alphabet and [50] for information on PBs).Each PB is characterized by the ϕ and ψ dihedral angles of five consecutive residues. PBs give areasonable approximation of all local protein 3D structures and are very efficient for analyzing proteinflexibility, i.e., molecular dynamics (MDs) analyses [16,18,51]. PB assignment was carried out forevery residue from every structure/structural model extracted from PED3 using the PBxplore tool [52].To quantify local protein flexibility, PB-derived entropy measure Neq (equivalent number of PBs) [12]was used. It represents the average number of PBs a residue may adopt at a given position. Neq iscalculated as follows [12]:
Neq = exp(−16∑
x=1
fxln fx) (1)
where, fx is the frequency of PB x at the position of interest. Neq value can vary between 1 and 16.A Neq value of 1 indicates that only one type of PB is observed, while a value of 16 indicates an equalprobability for each of the 16 PBs, i.e., random distribution.
2.3. Disorder Prediction from the Sequence
Two different approaches were initially used to predict protein disorder from the sole informationof the sequence, namely Disopred3 (used through http://bioinf.cs.ucl.ac.uk/psipred/webserver) [53,54]
Biomolecules 2020, 10, 1080 3 of 13
and Protein DisOrder Prediction System (PrDOS, through http://prdos.hgc.jp/cgi-bin/top.cgi) [55],see [37]. Disopred3 combined two predictors of intrinsic disorder, one module that combined theintermediate results and one component that annotated protein-binding IDRs; their neural networksused evolutionary information encoded in a position-specific score matrix (PSSM) [53]. PrDOS alsocombined two separate predictors; the first one was a support vector machine algorithm usingevolutionary information again with PSSMs. The second one assumed the conservation of intrinsicdisorder in protein families [55]. Results were finally also compared to a physics-based approach.IUPred2A and ANCHOR2 were used [56]. IUPred2A used an energy estimation method at its core.This approach utilized a low-resolution statistical potential to characterize the tendencies of amino acidpairs to form contacts, observed in a collection of globular protein structures. ANCHOR2 followed thesame principle for disordered binding regions [57].
A prediction rate was used in the analysis. This prediction rate used (a) the predicted state (orderand disorder) taken directly from Disopred3 and PrDOS and (b) the ‘true’ state defined by Neq, i.e.,if the Neq is lower that the threshold value, it is an order state while if it is higher, it is a disorder state.
2.4. Analyses
The analyses were done using Python programming language v.2.7.10 [58], and R softwarev.3.3.3 [59] while 3D visualization was done using MacPyMOL software v.1.7.2.2 [60,61]. Differentcorrelations are calculated, they are all based on the use of values coming from Disopred3 and/orPrDOS (in a range from 0 to 1), or with Neq (in a range from 1 to 16), and all done with continuousvalues and not binary classes. A perfect correlation is equal to 1.0, while a value of 0 corresponds to anabsence of correlation.
3. Results
3.1. Data Analyses
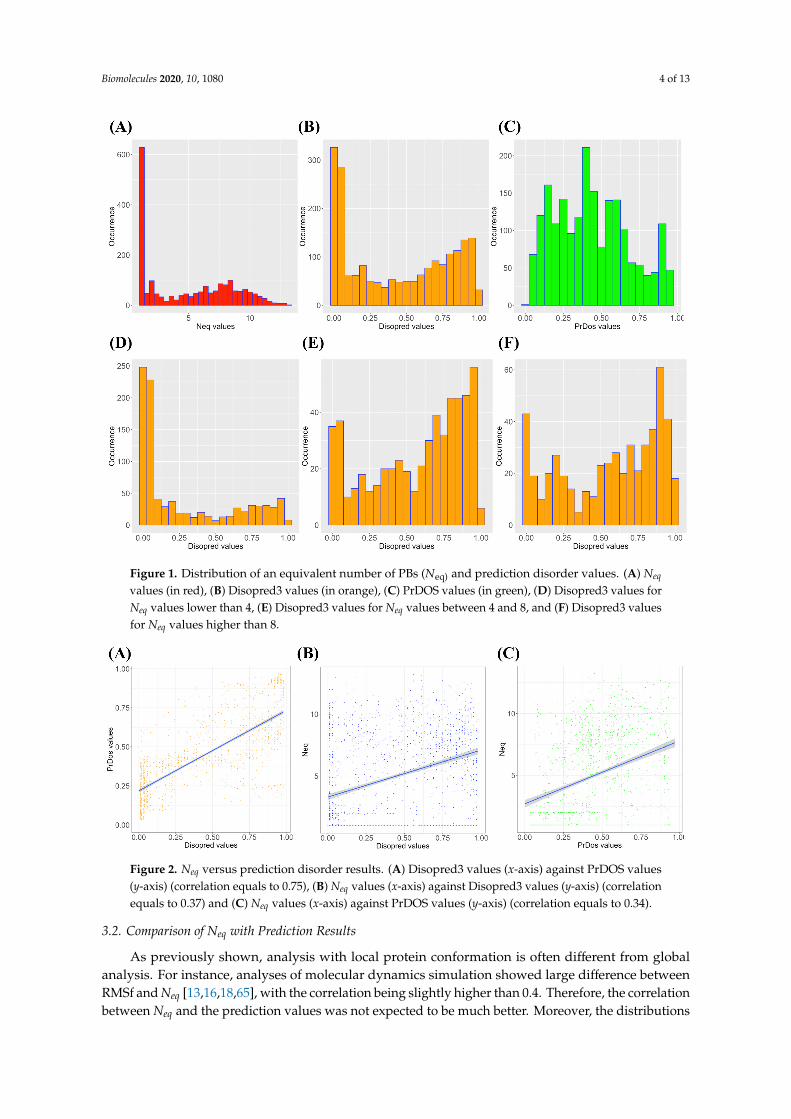
The PED3 database encompasses an interesting set of structural behaviors. Figure 1A showsthe Neq distribution. 58% of the positions are entirely rigid with a Neq of 1.0. In previous studies,we have analyzed ordered structures using a large dataset of molecular dynamics simulations. Hence,this number is equivalent to the one observed for ordered structures (60% for Neq of 1.0) [62]. However,these behaviors between order and disorder dataset evolved very rapidly. The disorder state had 36%of residues with an Neq higher 2 when it was only 8% for ordered structures. An Neq higher than 8 canbe considered as entirely disordered state. The PED3 database had 15% of its residues with this featurewhile there were only 0.01% in ordered structures. The PED3 database allowed a very interestingcontinuum from rigidity to flexibility to high flexibility and finally disorder [36].
In protein structures obtained from X-ray crystallography, the definition of a disordered regioncan be considered as quite simple as it is linked to the absence of the atoms in a specific part of thesequence, i.e., they cannot be trapped as they are moving too fast [22]. Several physico-chemicaland structural properties of intrinsic disorder are now well established (e.g., high net-charge andlow hydrophobicity), and a large number of prediction methodologies use these physico-chemicalproperties linked with machine learning and evolutionary information [63,64].
Two distinct approaches were used to perform protein disorder predictions from the soleinformation of the protein sequences, (i) Disopred3 (Figure 1B) [53] and (ii) PrDOS (Figure 1C) [55].
The two distributions were quite different with more extreme values for Disopred3 and had a morecentered distribution for PrDOS (Figure 1B,C). From their raw values, both methods also proposedthe order/disorder two-states prediction, with 81.1% of predictions in common (32.9% of commondisordered predicted positions and 48.2% of ordered ones). Disopred3 predicted more disorderedpositions (46.1%) than PrDOS (38.6%). They had a correct correlation of 0.75 in regard to the differencesin the distribution of predicted values (Figure 2A).
Biomolecules 2020, 10, 1080 4 of 13
Biomolecules 2020, 10, x FOR PEER REVIEW 4 of 14
Figure 1. Distribution of an equivalent number of PBs (Neq) and prediction disorder values. (A) Neq values (in red), (B) Disopred3 values (in orange), (C) PrDOS values (in green), (D) Disopred3 values for Neq values lower than 4, (E) Disopred3 values for Neq values between 4 and 8, and (F) Disopred3 values for Neq values higher than 8.
Two distinct approaches were used to perform protein disorder predictions from the sole information of the protein sequences, (i) Disopred3 (Figure 1B) [53] and (ii) PrDOS (Figure 1C) [55].
The two distributions were quite different with more extreme values for Disopred3 and had a more centered distribution for PrDOS (Figure 1B,C). From their raw values, both methods also proposed the order/disorder two-states prediction, with 81.1% of predictions in common (32.9% of common disordered predicted positions and 48.2% of ordered ones). Disopred3 predicted more disordered positions (46.1%) than PrDOS (38.6%). They had a correct correlation of 0.75 in regard to the differences in the distribution of predicted values (Figure 2A).
Figure 1. Distribution of an equivalent number of PBs (Neq) and prediction disorder values. (A) Neq
values (in red), (B) Disopred3 values (in orange), (C) PrDOS values (in green), (D) Disopred3 values forNeq values lower than 4, (E) Disopred3 values for Neq values between 4 and 8, and (F) Disopred3 valuesfor Neq values higher than 8.Biomolecules 2020, 10, x FOR PEER REVIEW 5 of 14
Figure 2. Neq versus prediction disorder results. (A) Disopred3 values (x-axis) against PrDOS values (y-axis) (correlation equals to 0.75), (B) Neq values (x-axis) against Disopred3 values (y-axis) (correlation equals to 0.37) and (C) Neq values (x-axis) against PrDOS values (y-axis) (correlation equals to 0.34).
3.2. Comparison of Neq with Prediction Results
As previously shown, analysis with local protein conformation is often different from global analysis. For instance, analyses of molecular dynamics simulation showed large difference between RMSf and Neq [13,16,18,65], with the correlation being slightly higher than 0.4. Therefore, the correlation between Neq and the prediction values was not expected to be much better. Moreover, the distributions of both structural information (namely Neq, see Figure 1A) and disorder predicted values (Figure 1B,C) were not well spread. Hence, the correlation of Neq and Disopred3 was 0.37 (Figure 2B), and of Neq and PrDOS it was 0.34 (Figure 2C).
It is possible to divide Neq values into different clusters to have a better view of the prediction methods. Neq values of less than 4 correspond to the most rigid and the least flexible positions. Corresponding prediction values of Disopred3 and PrDOS were, respectively, 0.28 (Figure 1D) and 0.35 (Figure S1A). For intermediate Neq values (between 4 and 8, corresponding to flexible regions to the border of disorder [36]), average prediction values were 0.57 (Figure 1E) and 0.48 (Figure S1B), respectively. While for the disorder region (Neq higher than 8), these prediction values were 0.56 (Figure 1E) and 0.54 (Figure S1C), respectively.
These results showed clear and significant differences. Interestingly, both prediction methods displayed different distribution values, but often went to the same predictions and behaviors. For instance, in the disorder region (Neq higher than 8), their correlation was still excellent (0.76), as they both predicted high (disorder) and low (order) values (Figure S2).
3.3. General Tendencies
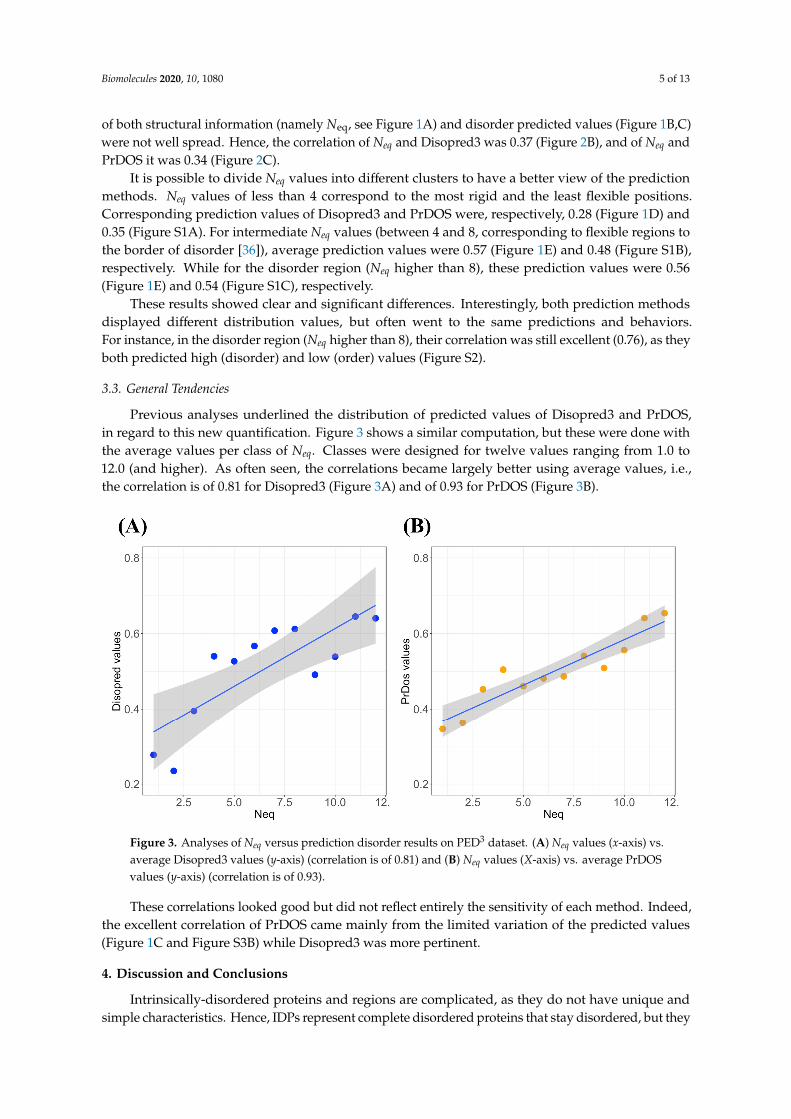
Previous analyses underlined the distribution of predicted values of Disopred3 and PrDOS, in regard to this new quantification. Figure 3 shows a similar computation, but these were done with the average values per class of Neq. Classes were designed for twelve values ranging from 1.0 to 12.0 (and higher). As often seen, the correlations became largely better using average values, i.e., the correlation is of 0.81 for Disopred3 (Figure 3A) and of 0.93 for PrDOS (Figure 3B).
These correlations looked good but did not reflect entirely the sensitivity of each method. Indeed, the excellent correlation of PrDOS came mainly from the limited variation of the predicted values (Figures 1C and A3B) while Disopred3 was more pertinent.
Figure 2. Neq versus prediction disorder results. (A) Disopred3 values (x-axis) against PrDOS values(y-axis) (correlation equals to 0.75), (B) Neq values (x-axis) against Disopred3 values (y-axis) (correlationequals to 0.37) and (C) Neq values (x-axis) against PrDOS values (y-axis) (correlation equals to 0.34).
3.2. Comparison of Neq with Prediction Results
As previously shown, analysis with local protein conformation is often different from globalanalysis. For instance, analyses of molecular dynamics simulation showed large difference betweenRMSf and Neq [13,16,18,65], with the correlation being slightly higher than 0.4. Therefore, the correlationbetween Neq and the prediction values was not expected to be much better. Moreover, the distributions
Biomolecules 2020, 10, 1080 5 of 13
of both structural information (namely Neq, see Figure 1A) and disorder predicted values (Figure 1B,C)were not well spread. Hence, the correlation of Neq and Disopred3 was 0.37 (Figure 2B), and of Neq andPrDOS it was 0.34 (Figure 2C).
It is possible to divide Neq values into different clusters to have a better view of the predictionmethods. Neq values of less than 4 correspond to the most rigid and the least flexible positions.Corresponding prediction values of Disopred3 and PrDOS were, respectively, 0.28 (Figure 1D) and0.35 (Figure S1A). For intermediate Neq values (between 4 and 8, corresponding to flexible regions tothe border of disorder [36]), average prediction values were 0.57 (Figure 1E) and 0.48 (Figure S1B),respectively. While for the disorder region (Neq higher than 8), these prediction values were 0.56(Figure 1E) and 0.54 (Figure S1C), respectively.
These results showed clear and significant differences. Interestingly, both prediction methodsdisplayed different distribution values, but often went to the same predictions and behaviors.For instance, in the disorder region (Neq higher than 8), their correlation was still excellent (0.76), as theyboth predicted high (disorder) and low (order) values (Figure S2).
3.3. General Tendencies
Previous analyses underlined the distribution of predicted values of Disopred3 and PrDOS,in regard to this new quantification. Figure 3 shows a similar computation, but these were done withthe average values per class of Neq. Classes were designed for twelve values ranging from 1.0 to12.0 (and higher). As often seen, the correlations became largely better using average values, i.e.,the correlation is of 0.81 for Disopred3 (Figure 3A) and of 0.93 for PrDOS (Figure 3B).Biomolecules 2020, 10, x FOR PEER REVIEW 6 of 14
Figure 3. Analyses of Neq versus prediction disorder results on PED3 dataset. (A) Neq values (x-axis) vs. average Disopred3 values (y-axis) (correlation is of 0.81) and (B) Neq values (X-axis) vs. average PrDOS values (y-axis) (correlation is of 0.93).
4. Discussion and Conclusion
Intrinsically-disordered proteins and regions are complicated, as they do not have unique and simple characteristics. Hence, IDPs represent complete disordered proteins that stay disordered, but they can also adopt one conformation when they bind to their ligands or partners [66,67] or participate in multiple systems [68], they are essential to functions [69,70], drug design [71], and protein design [72].
For instance, NMR spectroscopy was used to delineate the sites of pre-structured motifs (PreSMos) [73]. PreSMos are transient local structural elements that presage target-bound conformations and act as specific determinants for IDP recognition by their target proteins [74]. Related to PreSMos are the famous molecular recognition features (MoRFs) that were identified in the x-ray structures of complexes [75] between target proteins and short fragments of IDPs/IDRs (predicted to be disordered) [76–78]. They were also linked to short linear motifs (SLiMs) that were found four times out of five in IDRs. The lengths of SLiMs range from 3 to 11 residues, and they have often been associated with pathologies, and characterized as structured when they interact with repetitive structures [79,80].
In previous studies, it was observed that local protein conformation deformation could be quantified and defined more properly in terms of rigidity and flexibility [15,62]. The analyses were extended to IDPs leading to a definition of an entropy scale ranging between 1 and 16, i.e., the number of PBs. An Neq of 1 corresponded to a rigid position while 8 was a disordered one, extending this categorization led to a Neq of 4 for a flexible region and of 6 for a highly flexible region. The analysis of IDPs also underlined a large number of IDRs and rigid regions [36]. Neq was a great tool to locate the mobile region encompassed in deformable (flexible) regions, and this was the same mechanism in IDPs. The question raised was then the reaction of disorder predictions on these data.
Intrinsic disorder predictors have been created from a wide variety of architectures and data sets with three main categories based on their underlying models: (a) ab initio methods based on the physiochemical characteristics, (b) machine-learning methods, such as PrDOS [55], and (c) meta methods, such as Disopred3 [53]. The relative performance of intrinsic disorder predictors has been compared many times [64,81] and we note the recent DISOselect analyses [82]. These all underlined the specificity of each approach, with two different methodologies were used here.
Figure 3. Analyses of Neq versus prediction disorder results on PED3 dataset. (A) Neq values (x-axis) vs.average Disopred3 values (y-axis) (correlation is of 0.81) and (B) Neq values (X-axis) vs. average PrDOSvalues (y-axis) (correlation is of 0.93).
These correlations looked good but did not reflect entirely the sensitivity of each method. Indeed,the excellent correlation of PrDOS came mainly from the limited variation of the predicted values(Figure 1C and Figure S3B) while Disopred3 was more pertinent.
4. Discussion and Conclusions
Intrinsically-disordered proteins and regions are complicated, as they do not have unique andsimple characteristics. Hence, IDPs represent complete disordered proteins that stay disordered, but they
Biomolecules 2020, 10, 1080 6 of 13
can also adopt one conformation when they bind to their ligands or partners [66,67] or participate inmultiple systems [68], they are essential to functions [69,70], drug design [71], and protein design [72].
For instance, NMR spectroscopy was used to delineate the sites of pre-structured motifs(PreSMos) [73]. PreSMos are transient local structural elements that presage target-bound conformationsand act as specific determinants for IDP recognition by their target proteins [74]. Related to PreSMosare the famous molecular recognition features (MoRFs) that were identified in the x-ray structuresof complexes [75] between target proteins and short fragments of IDPs/IDRs (predicted to bedisordered) [76–78]. They were also linked to short linear motifs (SLiMs) that were found fourtimes out of five in IDRs. The lengths of SLiMs range from 3 to 11 residues, and they have oftenbeen associated with pathologies, and characterized as structured when they interact with repetitivestructures [79,80].
In previous studies, it was observed that local protein conformation deformation could bequantified and defined more properly in terms of rigidity and flexibility [15,62]. The analyses wereextended to IDPs leading to a definition of an entropy scale ranging between 1 and 16, i.e., the numberof PBs. An Neq of 1 corresponded to a rigid position while 8 was a disordered one, extending thiscategorization led to a Neq of 4 for a flexible region and of 6 for a highly flexible region. The analysisof IDPs also underlined a large number of IDRs and rigid regions [36]. Neq was a great tool to locatethe mobile region encompassed in deformable (flexible) regions, and this was the same mechanism inIDPs. The question raised was then the reaction of disorder predictions on these data.
Intrinsic disorder predictors have been created from a wide variety of architectures and datasets with three main categories based on their underlying models: (a) ab initio methods based onthe physiochemical characteristics, (b) machine-learning methods, such as PrDOS [55], and (c) metamethods, such as Disopred3 [53]. The relative performance of intrinsic disorder predictors has beencompared many times [64,81] and we note the recent DISOselect analyses [82]. These all underlinedthe specificity of each approach, with two different methodologies were used here.
Firstly, Disopred3 is a complex approach to performing protein disorder prediction andprotein-binding site annotation within disordered regions [53]. The tool first identifies disorderedresidues through a consensus of the output generated by Disopred2 [83] and two additionalmachine-learning-based modules trained on large IDRs. It then annotates them as protein bindingthrough an additional support vector machine (SVM) classifier. Secondly, PrDOS [55] is composed oftwo predictors: (i) a predictor based on the local amino acid sequence, using a SVM algorithm for theposition-specific score matrix, and (ii) one based on template proteins with the use of the conservationof intrinsic disorder in protein families using the Position specific iterative-Basic Local AlignmentSearch Tool (PSI-BLAST) approach [84].
As seen with Figures 1 and 2, both approaches presented similar tendencies with a strong differencein the range of predicted values. The final correlations with Neq were limited. These two predictionmethodologies were mainly controlled by the use of evolutionary information with effective neuralnetworks. To go further, physics-based approaches were used, namely IUPred2A and ANCHOR2 [56].Even if IUPred2A showed a distribution of prediction values close to the distribution of Disopred3(Figure S6A), ANCHOR2 displayed a surprising binomial distribution with few values close to zero(Figure S6B). The correlations of IUPred2A and ANCHOR2 with Neq were particularly weak (0.29 and0.25), leading to no particular improvements (Figure S6C,D). These approaches showed specificities,as (i) they had a correlation of 0.79 between them, but (ii) weak correlations with Disopred3 and PrDOS(between 0.65 and 0.44, see Table S1), underlying specific prediction patterns.
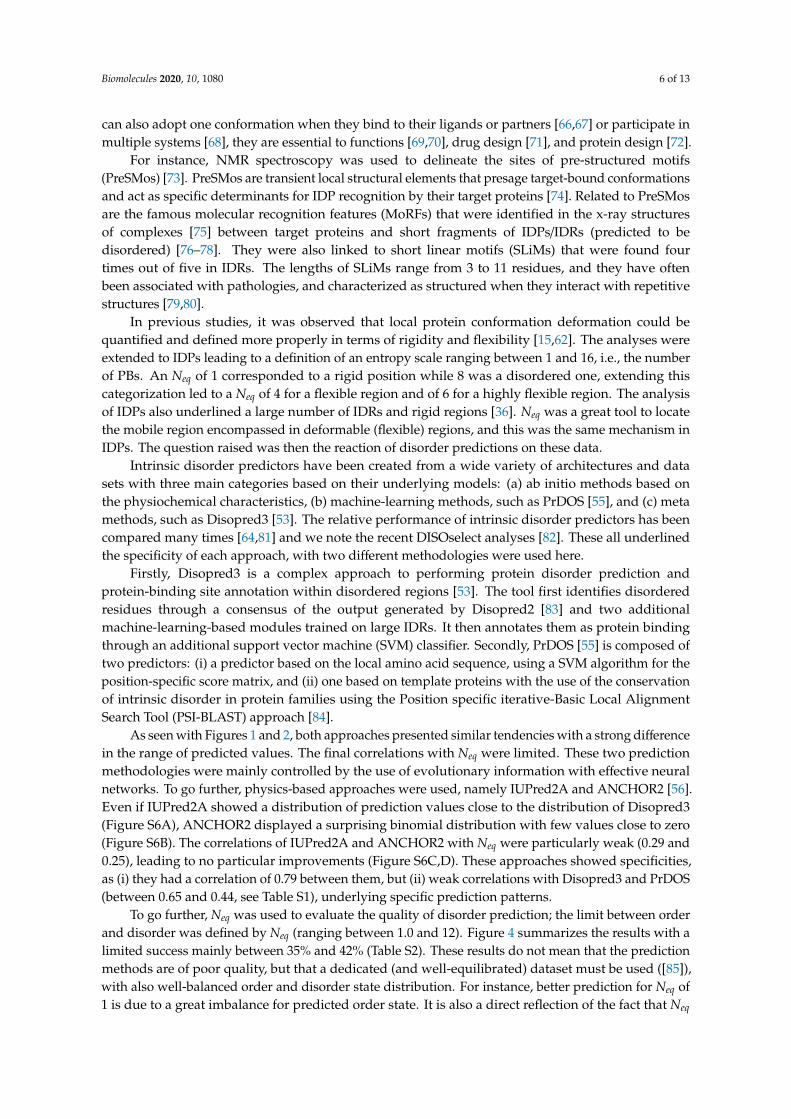
To go further, Neq was used to evaluate the quality of disorder prediction; the limit between orderand disorder was defined by Neq (ranging between 1.0 and 12). Figure 4 summarizes the results with alimited success mainly between 35% and 42% (Table S2). These results do not mean that the predictionmethods are of poor quality, but that a dedicated (and well-equilibrated) dataset must be used ([85]),with also well-balanced order and disorder state distribution. For instance, better prediction for Neq of1 is due to a great imbalance for predicted order state. It is also a direct reflection of the fact that Neq
Biomolecules 2020, 10, 1080 7 of 13
is a particular measure and that we need the development of a specific prediction approach, such asOPAL+ which is specialized for MoRF prediction, to predict this type of feature [75].
Biomolecules 2020, 10, x FOR PEER REVIEW 7 of 14
Firstly, Disopred3 is a complex approach to performing protein disorder prediction and protein-binding site annotation within disordered regions [53]. The tool first identifies disordered residues through a consensus of the output generated by Disopred2 [83] and two additional machine-learning-based modules trained on large IDRs. It then annotates them as protein binding through an additional support vector machine (SVM) classifier. Secondly, PrDOS [55] is composed of two predictors: (i) a predictor based on the local amino acid sequence, using a SVM algorithm for the position-specific score matrix, and (ii) one based on template proteins with the use of the conservation of intrinsic disorder in protein families using the Position specific iterative-Basic Local Alignment Search Tool (PSI-BLAST) approach [84].
As seen with Figures 1 and 2, both approaches presented similar tendencies with a strong difference in the range of predicted values. The final correlations with Neq were limited. These two prediction methodologies were mainly controlled by the use of evolutionary information with effective neural networks. To go further, physics-based approaches were used, namely IUPred2A and ANCHOR2 [56]. Even if IUPred2A showed a distribution of prediction values close to the distribution of Disopred3 (Figure S6A), ANCHOR2 displayed a surprising binomial distribution with few values close to zero (Figure S6B). The correlations of IUPred2A and ANCHOR2 with Neq were particularly weak (0.29 and 0.25), leading to no particular improvements (Figure S6C,D). These approaches showed specificities, as (i) they had a correlation of 0.79 between them, but (ii) weak correlations with Disopred3 and PrDOS (between 0.65 and 0.44, see Table S1), underlying specific prediction patterns.
To go further, Neq was used to evaluate the quality of disorder prediction; the limit between order and disorder was defined by Neq (ranging between 1.0 and 12). Figure 4 summarizes the results with a limited success mainly between 35% and 42% (Table S2). These results do not mean that the prediction methods are of poor quality, but that a dedicated (and well-equilibrated) dataset must be used ([85]), with also well-balanced order and disorder state distribution. For instance, better prediction for Neq of 1 is due to a great imbalance for predicted order state. It is also a direct reflection of the fact that Neq is a particular measure and that we need the development of a specific prediction approach, such as OPAL+ which is specialized for MoRF prediction, to predict this type of feature. [75].
Figure 4. Evaluation of Disopred3 predictions at the light of Neq values. Neq values ranging from 1.0 to 12 are provided with the prediction rate (in red). The contribution of disordered and ordered positions are defined by the Neq values.
Figure 4. Evaluation of Disopred3 predictions at the light of Neq values. Neq values ranging from 1.0 to12 are provided with the prediction rate (in red). The contribution of disordered and ordered positionsare defined by the Neq values.
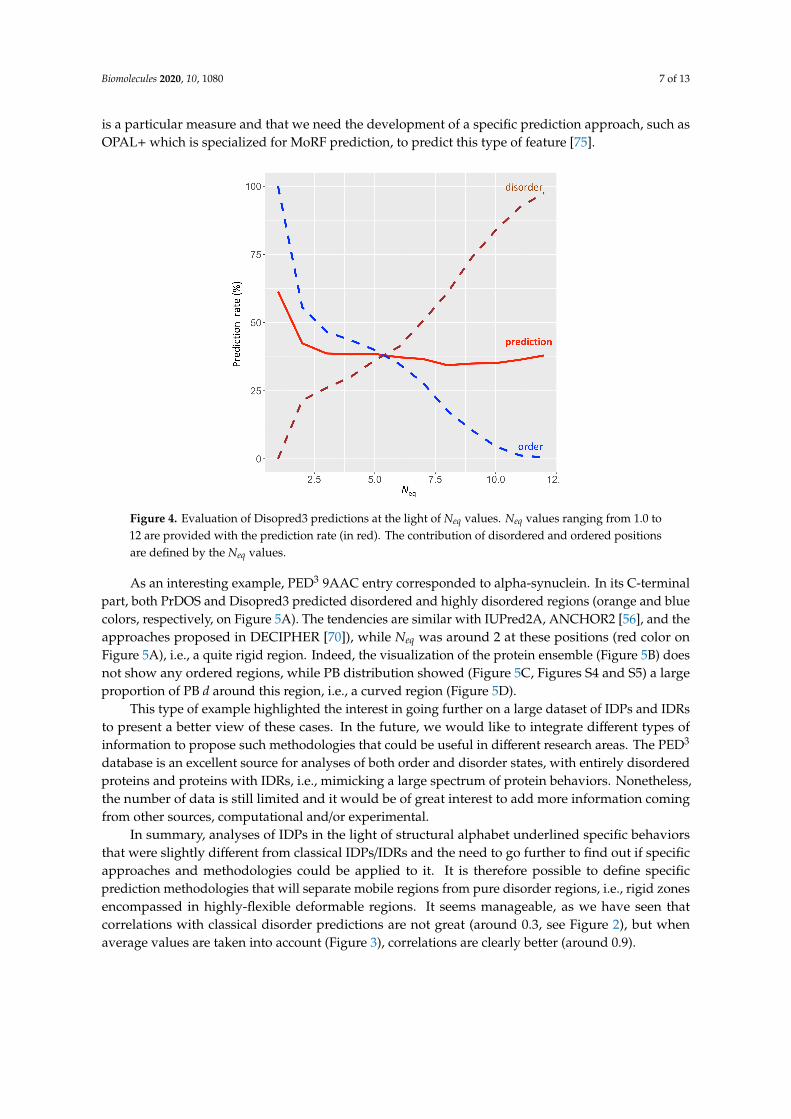
As an interesting example, PED3 9AAC entry corresponded to alpha-synuclein. In its C-terminalpart, both PrDOS and Disopred3 predicted disordered and highly disordered regions (orange and bluecolors, respectively, on Figure 5A). The tendencies are similar with IUPred2A, ANCHOR2 [56], and theapproaches proposed in DECIPHER [70]), while Neq was around 2 at these positions (red color onFigure 5A), i.e., a quite rigid region. Indeed, the visualization of the protein ensemble (Figure 5B) doesnot show any ordered regions, while PB distribution showed (Figure 5C, Figures S4 and S5) a largeproportion of PB d around this region, i.e., a curved region (Figure 5D).
This type of example highlighted the interest in going further on a large dataset of IDPs and IDRsto present a better view of these cases. In the future, we would like to integrate different types ofinformation to propose such methodologies that could be useful in different research areas. The PED3
database is an excellent source for analyses of both order and disorder states, with entirely disorderedproteins and proteins with IDRs, i.e., mimicking a large spectrum of protein behaviors. Nonetheless,the number of data is still limited and it would be of great interest to add more information comingfrom other sources, computational and/or experimental.
In summary, analyses of IDPs in the light of structural alphabet underlined specific behaviorsthat were slightly different from classical IDPs/IDRs and the need to go further to find out if specificapproaches and methodologies could be applied to it. It is therefore possible to define specificprediction methodologies that will separate mobile regions from pure disorder regions, i.e., rigid zonesencompassed in highly-flexible deformable regions. It seems manageable, as we have seen thatcorrelations with classical disorder predictions are not great (around 0.3, see Figure 2), but whenaverage values are taken into account (Figure 3), correlations are clearly better (around 0.9).
Biomolecules 2020, 10, 1080 8 of 13
Biomolecules 2020, 10, x FOR PEER REVIEW 8 of 14
As an interesting example, PED3 9AAC entry corresponded to alpha-synuclein. In its C-terminal part, both PrDOS and Disopred3 predicted disordered and highly disordered regions (orange and blue colors, respectively, on Figure 5A). The tendencies are similar with IUPred2A, ANCHOR2 [56], and the approaches proposed in DECIPHER [70]), while Neq was around 2 at these positions (red color on Figure 5A), i.e., a quite rigid region. Indeed, the visualization of the protein ensemble (Figure 5B) does not show any ordered regions, while PB distribution showed (Figures 5C, A4, and A5) a large proportion of PB d around this region, i.e., a curved region (Figure 5D).
Figure 5. Example of alpha-synuclein, a solution-state ensemble from paramagnetic relaxation enhancement-Nuclear magnetic resonance (PRE-NMR) ensemble-restrained MD simulations (PED3 9AAC entry). (A) A zoom on C-terminus of alpha-synuclein was done. Along the x-axis are shown, in orange, PrDOS prediction values and, in blue, Disopred3values. Neq values are represented in red. (B) A superimposition of hundreds of structural models from the ensemble. (C) Representation in terms of PBs shown with WebLogo [86], underlying the most contradictory position (low Neq and high disorder prediction values). (D) A dozen structural models superimposed on this region.
This type of example highlighted the interest in going further on a large dataset of IDPs and IDRs to present a better view of these cases. In the future, we would like to integrate different types of information to propose such methodologies that could be useful in different research areas. The PED3 database is an excellent source for analyses of both order and disorder states, with entirely disordered proteins and proteins with IDRs, i.e., mimicking a large spectrum of protein behaviors. Nonetheless, the number of data is still limited and it would be of great interest to add more information coming from other sources, computational and/or experimental.
Figure 5. Example of alpha-synuclein, a solution-state ensemble from paramagnetic relaxationenhancement-Nuclear magnetic resonance (PRE-NMR) ensemble-restrained MD simulations (PED3
9AAC entry). (A) A zoom on C-terminus of alpha-synuclein was done. Along the x-axis are shown,in orange, PrDOS prediction values and, in blue, Disopred3values. Neq values are represented in red.(B) A superimposition of hundreds of structural models from the ensemble. (C) Representation interms of PBs shown with WebLogo [86], underlying the most contradictory position (low Neq and highdisorder prediction values). (D) A dozen structural models superimposed on this region.
Supplementary Materials: The following are available online at http://www.mdpi.com/2218-273X/10/7/1080/s1,Figure S1: Prediction disorder results of PrDOS on PED3 dataset. For Neq (A) lower than 4. (B) between 4 and8 and (C) higher than 8. Figure S2: Prediction disorder results on PED3 dataset. (A) DisoPred3values (x-axis)against PrDOS values (y-axis) for Neq values higher than 8 (correlation is of 0.76). Figure S3: Analyses of predictiondisorder results on PED3 dataset per class of Neq. (A) DisoPred3values (x-axis) and Neq classes (y-axis). (B) PrDOSvalues (x-axis) and Neq classes (y-axis). Figure S4: Neq values for the alpha-synuclein, a solution-state ensemblefrom PRE-NMR ensemble-restrained MD simulations (PED3 9AAC entry). Computation done with PBxploresoftware. Figure S5: PB distribution for the alpha-synuclein, a solution-state ensemble from PRE-NMR ensemble-restrained MD simulations (PED3 9AAC entry). Computation done with PBxplore software and representedwith WebLogo. Figure S6: Distribution of Neq and prediction disorder values & Neq versus prediction disorderresults. Distribution of (A) IUPred2A values (in purple), and (B) ANCHOR2 values (in pink), (C) Neq values(x-axis) against IUPred2A values (y-axis) (correlation equals to 0.29). (C) Neq values (x-axis) against ANCHOR2values (y-axis) (correlation equals to 0.25). Table S1: Correlation between Neq, Disopred3, PrDOS, IUPRed2Aand ANCHOR2 values on PED3 dataset. Table S2: Evaluation of prediction rate according to Neq values forDisopred3 approach.
Author Contributions: A.G.d.B. conceived, designed, and proposed the methodology, curated the data, performedthe predictions, analyzed the results, wrote, reviewed, and edited the draft. The author has read and agreed to thepublished version of the manuscript.
Biomolecules 2020, 10, 1080 9 of 13
Funding: This work was supported by grants from the Ministry of Research (France), University de Paris,University Paris Diderot, Sorbonne, Paris Cité (France), National Institute for Blood Transfusion (INTS, France),National Institute for Health and Medical Research (INSERM, France), IdEx ANR-18-IDEX-0001, and labex GR-Ex.The labex GR-Ex, reference ANR-11-LABX-0051 is funded by the program “Investissements d’avenir” of theFrench National Research Agency, reference ANR-11-IDEX-0005-02. AGdB acknowledges the French NationalResearch Agency for grant ANR-19-CE17-0021 (BASIN) and the Indo-French Centre for the Promotion of AdvancedResearch/CEFIPRA for collaborative grant (number 5302-2). The author was granted access to high-performancecomputing (HPC) resources at the French National Computing Centre CINES under grants no. c2013037147, no.A0010707621, no. A0040710426, and no. A0070710961 funded by the GENCI (Grand Equipement National deCalcul Intensif). Calculations were also performed on an SGI cluster granted by Conseil Régional Ile de France andINTS (SESAME Grant). The APC was funded by National Institute for Health and Medical Research (INSERM,France).
Acknowledgments: A.G.d.B. thanks the reviewers who spent time evaluating this work and asked particularlyrelevant questions; their comments have greatly improved the manuscript. A.G.d.B. would also like to thankNenad Mitic, Catherine Etchebest, his former students, Pierrick Craveur, Agnel Praveen Joseph, Tarun J. Narwani,Snoopy de Brevern, Nicolas K. Shinada, and Akhila Melarkode Vattekatte, and the organizers and participantsof Belbi’2016 (Belgrade, Serbia), International Conference on IDP’2017 (IISER Mohali, Chandigarh, India) andBelbi’2018 (Belgrade, Serbia) for fruitful discussions.
Conflicts of Interest: The author declares no conflict of interest. The funders had no role in the design of thestudy; in the collection, analyses, or interpretation of data; in the writing of the manuscript, or in the decision topublish the results.
References
1. Eisenberg, D. The discovery of the alpha-helix and beta-sheet, the principal structural features of proteins.Proc. Natl. Acad. Sci. USA 2003, 100, 11207–11210. [CrossRef]
2. Unger, R.; Harel, D.; Wherland, S.; Sussman, J.L. A 3D building blocks approach to analyzing and predictingstructure of proteins. Proteins 1989, 5, 355–373. [CrossRef]
3. Offmann, B.; Tyagi, M.; de Brevern, A.G. Local Protein Structures. Curr. Bioinform. 2007, 3, 165–202.[CrossRef]
4. Liu, X.; Zhao, Y.P.; Zheng, W.M. CLEMAPS: Multiple alignment of protein structures based on conformationalletters. Proteins 2008, 71, 728–736. [CrossRef]
5. Tung, C.H.; Huang, J.W.; Yang, J.M. Kappa-alpha plot derived structural alphabet and BLOSUM-likesubstitution matrix for rapid search of protein structure database. Genome Biol. 2007, 8, R31. [CrossRef][PubMed]
6. Leonard, S.; Joseph, A.P.; Srinivasan, N.; Gelly, J.C.; de Brevern, A.G. mulPBA: An efficient multiple proteinstructure alignment method based on a structural alphabet. J. Biomol. Struct. Dyn. 2014, 32, 661–668.[CrossRef] [PubMed]
7. Pandini, A.; Fornili, A.; Fraternali, F.; Kleinjung, J. GSATools: Analysis of allosteric communication andfunctional local motions using a structural alphabet. Bioinformatics 2013, 29, 2053–2055. [CrossRef] [PubMed]
8. Dudev, M.; Lim, C. Discovering structural motifs using a structural alphabet: Application to magnesium-binding sites. BMC Bioinform. 2007, 8, 106. [CrossRef]
9. Narwani, T.J.; Etchebest, C.; Craveur, P.; Leonard, S.; Rebehmed, J.; Srinivasan, N.; Bornot, A.; Gelly, J.C.;de Brevern, A.G. In silico prediction of protein flexibility with local structure approach. Biochimie 2019, 165,150–155. [CrossRef] [PubMed]
10. Karchin, R.; Cline, M.; Mandel-Gutfreund, Y.; Karplus, K. Hidden Markov models that use predicted localstructure for fold recognition: Alphabets of backbone geometry. Proteins 2003, 51, 504–514. [CrossRef]
11. Ghouzam, Y.; Postic, G.; Guerin, P.E.; de Brevern, A.G.; Gelly, J.C. ORION: A web server for protein foldrecognition and structure prediction using evolutionary hybrid profiles. Sci. Rep. 2016, 6, 28268. [CrossRef][PubMed]
12. de Brevern, A.G.; Etchebest, C.; Hazout, S. Bayesian probabilistic approach for predicting backbone structuresin terms of protein blocks. Proteins 2000, 41, 271–287. [CrossRef]
13. Craveur, P.; Joseph, A.P.; Esque, J.; Narwani, T.J.; Noel, F.; Shinada, N.; Goguet, M.; Leonard, S.; Poulain, P.;Bertrand, O.; et al. Protein flexibility in the light of structural alphabets. Front. Mol. Biosci. 2015, 2, 20.[CrossRef] [PubMed]
Biomolecules 2020, 10, 1080 10 of 13
14. Craveur, P.; Narwani, T.J.; Rebehmed, J.; de Brevern, A.G. Investigation of the impact of PTMs on the proteinbackbone conformation. Amino Acids 2019, 51, 1065–1079. [CrossRef] [PubMed]
15. Narwani, T.J.; Craveur, P.; Shinada, N.K.; Floch, A.; Santuz, H.; Vattekatte, A.M.; Srinivasan, N.; Rebehmed, J.;Gelly, J.C.; Etchebest, C.; et al. Discrete analyses of protein dynamics. J. Biomol. Struct. Dyn. 2019, 1–15.[CrossRef] [PubMed]
16. Goguet, M.; Narwani, T.J.; Petermann, R.; Jallu, V.; de Brevern, A.G. In silico analysis of Glanzmann variantsof Calf-1 domain of alphaIIbbeta3 integrin revealed dynamic allosteric effect. Sci. Rep. 2017, 7, 8001.[CrossRef]
17. Craveur, P.; Gres, A.T.; Kirby, K.A.; Liu, D.; Hammond, J.A.; Deng, Y.; Forli, S.; Goodsell, D.S.; Williamson, J.R.;Sarafianos, S.G.; et al. Novel Intersubunit Interaction Critical for HIV-1 Core Assembly Defines a PotentiallyTargetable Inhibitor Binding Pocket. mBio 2019, 10, e02858-18. [CrossRef]
18. Ladislav, M.; Cerny, J.; Krusek, J.; Horak, M.; Balik, A.; Vyklicky, L. The LILI Motif of M3-S2 Linkers Is aComponent of the NMDA Receptor Channel Gate. Front. Mol. Neurosci. 2018, 11, 113. [CrossRef]
19. van der Lee, R.; Buljan, M.; Lang, B.; Weatheritt, R.J.; Daughdrill, G.W.; Dunker, A.K.; Fuxreiter, M.; Gough, J.;Gsponer, J.; Jones, D.T.; et al. Classification of intrinsically disordered regions and proteins. Chem. Rev. 2014,114, 6589–6631. [CrossRef]
20. Peng, Z.; Yan, J.; Fan, X.; Mizianty, M.J.; Xue, B.; Wang, K.; Hu, G.; Uversky, V.N.; Kurgan, L. Exceptionallyabundant exceptions: Comprehensive characterization of intrinsic disorder in all domains of life. Cell. Mol.Life Sci. 2015, 72, 137–151. [CrossRef]
21. Habchi, J.; Tompa, P.; Longhi, S.; Uversky, V.N. Introducing protein intrinsic disorder. Chem. Rev. 2014, 114,6561–6588. [CrossRef] [PubMed]
22. Wright, P.E.; Dyson, H.J. Intrinsically unstructured proteins: Re-assessing the protein structure-functionparadigm. J. Mol. Biol. 1999, 293, 321–331. [CrossRef] [PubMed]
23. Uversky, V.N. Cracking the folding code. Why do some proteins adopt partially folded conformations,whereas other don’t? FEBS Lett. 2002, 514, 181–183. [CrossRef]
24. Mitic, N.S.; Malkov, S.N.; Kovacevic, J.J.; Pavlovic-Lazetic, G.M.; Beljanski, M.V. Structural disorder ofplasmid-encoded proteins in Bacteria and Archaea. BMC Bioinform. 2018, 19, 158. [CrossRef] [PubMed]
25. Toto, A.; Malagrino, F.; Visconti, L.; Troilo, F.; Pagano, L.; Brunori, M.; Jemth, P.; Gianni, S. Templated foldingof intrinsically disordered proteins. J. Biol. Chem. 2020, 295, 6586–6593. [CrossRef]
26. Tompa, P. Intrinsically unstructured proteins. Trends Biochem. Sci. 2002, 27, 527–533. [CrossRef]27. Dunker, A.K.; Lawson, J.D.; Brown, C.J.; Williams, R.M.; Romero, P.; Oh, J.S.; Oldfield, C.J.; Campen, A.M.;
Ratliff, C.M.; Hipps, K.W.; et al. Intrinsically disordered protein. J. Mol. Graph. Model. 2001, 19, 26–59.[CrossRef]
28. Kragelj, J.; Blackledge, M.; Jensen, M.R. Ensemble Calculation for Intrinsically Disordered Proteins UsingNMR Parameters. Adv. Exp. Med. Biol. 2015, 870, 123–147.
29. Robustelli, P.; Piana, S.; Shaw, D.E. Developing a molecular dynamics force field for both folded anddisordered protein states. Proc. Natl. Acad. Sci. USA 2018, 115, E4758–E4766. [CrossRef]
30. Ezerski, J.C.; Zhang, P.; Jennings, N.C.; Waxham, M.N.; Cheung, M.S. Molecular Dynamics EnsembleRefinement of Intrinsically Disordered Peptides According to Deconvoluted Spectra from Circular Dichroism.Biophys. J. 2020, 118, 1665–1678. [CrossRef]
31. Chen, J.; Liu, X.; Chen, J. Targeting Intrinsically Disordered Proteins through Dynamic Interactions.Biomolecules 2020, 10, 743. [CrossRef] [PubMed]
32. Thorpe, M.F.; Lei, M.; Rader, A.J.; Jacobs, D.J.; Kuhn, L.A. Protein flexibility and dynamics using constrainttheory. J. Mol. Graph. Model. 2001, 19, 60–69. [CrossRef]
33. Carugo, O. Atomic displacement parameters in structural biology. Amino Acids 2018, 50, 775–786. [CrossRef][PubMed]
34. Uversky, V.N. Intrinsic disorder here, there, and everywhere, and nowhere to escape from it. Cell. Mol. LifeSci. 2017, 74, 3065–3067. [CrossRef]
35. Varadi, M.; Kosol, S.; Lebrun, P.; Valentini, E.; Blackledge, M.; Dunker, A.K.; Felli, I.C.; Forman-Kay, J.D.;Kriwacki, R.W.; Pierattelli, R.; et al. pE-DB: A database of structural ensembles of intrinsically disorderedand of unfolded proteins. Nucleic Acids Res. 2014, 42, D326–D335. [CrossRef] [PubMed]
Biomolecules 2020, 10, 1080 11 of 13
36. Melarkode Vattekatte, A.; Narwani, T.J.; Floch, A.; Maljkovic, M.; Bisoo, S.; Shinada, N.K.; Kranjc, A.;Gelly, J.C.; Srinivasan, N.; Mitic, N.; et al. A structural entropy index to analyse local conformations inintrinsically disordered proteins. J. Struct. Biol. 2020, 210, 107464.
37. Melarkode Vattekatte, A.; Narwani, T.J.; Floch, A.; Maljkovic, M.; Bisoo, S.; Shinada, N.K.; Kranjc, A.;Gelly, J.C.; Srinivasan, N.; Mitic, N.; et al. Data set of intrinsically disordered proteins analysed at a localprotein conformation level. Data Brief 2020, 29, 105383. [CrossRef]
38. Mittag, T.; Marsh, J.; Grishaev, A.; Orlicky, S.; Lin, H.; Sicheri, F.; Tyers, M.; Forman-Kay, J.D. Structure/functionimplications in a dynamic complex of the intrinsically disordered Sic1 with the Cdc4 subunit of an SCFubiquitin ligase. Structure 2010, 18, 494–506. [CrossRef]
39. Weeks, S.D.; Baranova, E.V.; Heirbaut, M.; Beelen, S.; Shkumatov, A.V.; Gusev, N.B.; Strelkov, S.V. Molecularstructure and dynamics of the dimeric human small heat shock protein HSPB6. J. Struct. Biol. 2014, 185,342–354. [CrossRef]
40. Allison, J.R.; Rivers, R.C.; Christodoulou, J.C.; Vendruscolo, M.; Dobson, C.M. A relationship betweenthe transient structure in the monomeric state and the aggregation propensities of alpha-synuclein andbeta-synuclein. Biochemistry 2014, 53, 7170–7183. [CrossRef]
41. Sivakolundu, S.G.; Bashford, D.; Kriwacki, R.W. Disordered p27Kip1 exhibits intrinsic structure resemblingthe Cdk2/cyclin A-bound conformation. J. Mol. Biol. 2005, 353, 1118–1128. [CrossRef] [PubMed]
42. Mertens, H.D.; Piljic, A.; Schultz, C.; Svergun, D.I. Conformational analysis of a genetically encoded FRETbiosensor by SAXS. Biophys. J. 2012, 102, 2866–2875. [CrossRef] [PubMed]
43. Bacot-Davis, V.R.; Ciomperlik, J.J.; Basta, H.A.; Cornilescu, C.C.; Palmenberg, A.C. Solution structures ofMengovirus Leader protein, its phosphorylated derivatives, and in complex with nuclear transport regulatoryprotein, RanGTPase. Proc. Natl. Acad. Sci. USA 2014, 111, 15792–15797. [CrossRef]
44. Sanchez-Martinez, M.; Crehuet, R. Application of the maximum entropy principle to determine ensemblesof intrinsically disordered proteins from residual dipolar couplings. Phys. Chem. Chem. Phys. 2014, 16,26030–26039. [CrossRef] [PubMed]
45. Sterckx, Y.G.; Volkov, A.N.; Vranken, W.F.; Kragelj, J.; Jensen, M.R.; Buts, L.; Garcia-Pino, A.; Jove, T.; VanMelderen, L.; Blackledge, M.; et al. Small-angle X-ray scattering- and nuclear magnetic resonance-derivedconformational ensemble of the highly flexible antitoxin PaaA2. Structure 2014, 22, 854–865. [CrossRef][PubMed]
46. De Biasio, A.; Ibanez de Opakua, A.; Cordeiro, T.N.; Villate, M.; Merino, N.; Sibille, N.; Lelli, M.; Diercks, T.;Bernado, P.; Blanco, F.J. p15PAF is an intrinsically disordered protein with nonrandom structural preferencesat sites of interaction with other proteins. Biophys. J. 2014, 106, 865–874. [CrossRef]
47. Ozenne, V.; Schneider, R.; Yao, M.; Huang, J.R.; Salmon, L.; Zweckstetter, M.; Jensen, M.R.; Blackledge, M.Mapping the potential energy landscape of intrinsically disordered proteins at amino acid resolution. J. Am.Chem. Soc. 2012, 134, 15138–15148. [CrossRef]
48. Marsh, J.A.; Forman-Kay, J.D. Structure and disorder in an unfolded state under nondenaturing conditionsfrom ensemble models consistent with a large number of experimental restraints. J. Mol. Biol. 2009, 391,359–374. [CrossRef]
49. Berman, H.M.; Westbrook, J.; Feng, Z.; Gilliland, G.; Bhat, T.N.; Weissig, H.; Shindyalov, I.N.; Bourne, P.E.The Protein Data Bank. Nucleic Acids Res. 2000, 28, 235–242. [CrossRef]
50. Joseph, A.P.; Agarwal, G.; Mahajan, S.; Gelly, J.-C.; Swapna, L.S.; Offmann, B.; Cadet, F.; Bornot, A.; Tyagi, M.;Valadié, H.; et al. A short survey on Protein Blocks. Biophys. Rev. 2010, 2, 137–145. [CrossRef]
51. Jallu, V.; Poulain, P.; Fuchs, P.F.; Kaplan, C.; de Brevern, A.G. Modeling and molecular dynamics simulationsof the V33 variant of the integrin subunit beta3: Structural comparison with the L33 (HPA-1a) and P33(HPA-1b) variants. Biochimie 2014, 105, 84–90. [CrossRef] [PubMed]
52. Barnoud, J.; Santuz, H.; Craveur, P.; Joseph, A.P.; Jallu, V.; de Brevern, A.G.; Poulain, P. PBxplore: A toolto analyze local protein structure and deformability with Protein Blocks. PeerJ 2017, 5, e4013. [CrossRef][PubMed]
53. Jones, D.T.; Cozzetto, D. DISOPRED3: Precise disordered region predictions with annotated protein-bindingactivity. Bioinformatics 2015, 31, 857–863. [CrossRef]
54. Buchan, D.W.A.; Jones, D.T. The PSIPRED Protein Analysis Workbench: 20 years on. Nucleic Acids Res. 2019,47, W402–W407. [CrossRef] [PubMed]
Biomolecules 2020, 10, 1080 12 of 13
55. Ishida, T.; Kinoshita, K. PrDOS: Prediction of disordered protein regions from amino acid sequence.Nucleic Acids Res. 2007, 35, W460–W464. [CrossRef] [PubMed]
56. Meszaros, B.; Erdos, G.; Dosztanyi, Z. IUPred2A: Context-dependent prediction of protein disorder as afunction of redox state and protein binding. Nucleic Acids Res. 2018, 46, W329–W337. [CrossRef] [PubMed]
57. Erdos, G.; Dosztanyi, Z. Analyzing Protein Disorder with IUPred2A. Curr. Protoc. Bioinform. 2020, 70, e99.[CrossRef]
58. Python Software Foundation. Available online: https://www.python.org/ (accessed on 14 June 2020).59. R Core Team. R: A language and environment for statistical computing. R Foundation for Statistical Computing,
Vienna, Austria. 2017. Available online: https://www.R-project.org/ (accessed on 14 June 2020).60. Schrodinger, LLC. The PyMOL Molecular Graphics System, Version 1.7.2.2; Schrodinger, LLC: New York, NY,
USA, 2015.61. DeLano, W.L.T. The PyMOL Molecular Graphics System; DeLano Scientific: San Carlos, CA, USA, 2002.
Available online: http://www.pymol.org (accessed on 14 June 2020).62. Narwani, T.J.; Craveur, P.; Shinada, N.K.; Santuz, H.; Rebehmed, J.; Etchebest, C.; de Brevern, A.G. Dynamics
and deformability of α-, 310- and π-helices. Arch. Biol. Sci. 2018, 70, 21–31. [CrossRef]63. Pavlovic-Lazetic, G.M.; Mitic, N.S.; Kovacevic, J.J.; Obradovic, Z.; Malkov, S.N.; Beljanski, M.V. Bioinformatics
analysis of disordered proteins in prokaryotes. BMC Bioinform. 2011, 12, 66. [CrossRef]64. Nielsen, J.T.; Mulder, F.A.A. Quality and bias of protein disorder predictors. Sci. Rep. 2019, 9, 5137. [CrossRef]65. de Brevern, A.G.; Bornot, A.; Craveur, P.; Etchebest, C.; Gelly, J.C. PredyFlexy: Flexibility and local structure
prediction from sequence. Nucleic Acids Res. 2012, 40, W317–W322. [CrossRef] [PubMed]66. Perdigao, N.; Rosa, A. Dark Proteome Database: Studies on Dark Proteins. High Throughput 2019, 8, 8.
[CrossRef] [PubMed]67. Lieutaud, P.; Ferron, F.; Uversky, A.V.; Kurgan, L.; Uversky, V.N.; Longhi, S. How disordered is my protein
and what is its disorder for? A guide through the “dark side” of the protein universe. Intrinsically DisordProteins 2016, 4, e1259708. [CrossRef] [PubMed]
68. Uversky, V.N.; Finkelstein, A.V. Life in Phases: Intra- and Inter- Molecular Phase Transitions in ProteinSolutions. Biomolecules 2019, 9, 842. [CrossRef] [PubMed]
69. Uversky, V.N. New technologies to analyse protein function: An intrinsic disorder perspective. F1000Res2020, 9, F1000 Faculty Rev-101. [CrossRef]
70. Barik, A.; Katuwawala, A.; Hanson, J.; Paliwal, K.; Zhou, Y.; Kurgan, L. DEPICTER: Intrinsic Disorder andDisorder Function Prediction Server. J. Mol. Biol 2020, 432, 3379–3387. [CrossRef]
71. Blundell, T.L.; Gupta, M.N.; Hasnain, S.E. Intrinsic disorder in proteins: Relevance to protein assemblies,drug design and host-pathogen interactions. Prog. Biophys. Mol. Biol. 2020. [CrossRef]
72. Nagibina, G.S.; Glukhova, K.A.; Uversky, V.N.; Melnik, T.N.; Melnik, B.S. Intrinsic Disorder-Based Design ofStable Globular Proteins. Biomolecules 2019, 10, 64. [CrossRef]
73. Lee, S.H.; Kim, D.H.; Han, J.J.; Cha, E.J.; Lim, J.E.; Cho, Y.J.; Lee, C.; Han, K.H. Understanding pre-structuredmotifs (PreSMos) in intrinsically unfolded proteins. Curr. Protein Pept. Sci. 2012, 13, 34–54. [CrossRef]
74. Kim, D.H.; Han, K.H. PreSMo Target-Binding Signatures in Intrinsically Disordered Proteins. Mol. Cells2018, 41, 889–899.
75. Sharma, R.; Sharma, A.; Raicar, G.; Tsunoda, T.; Patil, A. OPAL+: Length-Specific MoRF Prediction inIntrinsically Disordered Protein Sequences. Proteomics 2019, 19, e1800058. [CrossRef] [PubMed]
76. Mohan, A.; Oldfield, C.J.; Radivojac, P.; Vacic, V.; Cortese, M.S.; Dunker, A.K.; Uversky, V.N. Analysis ofmolecular recognition features (MoRFs). J. Mol. Biol. 2006, 362, 1043–1059. [CrossRef]
77. Vacic, V.; Oldfield, C.J.; Mohan, A.; Radivojac, P.; Cortese, M.S.; Uversky, V.N.; Dunker, A.K. Characterizationof molecular recognition features, MoRFs, and their binding partners. J. Proteome Res. 2007, 6, 2351–2366.[CrossRef]
78. Oldfield, C.J.; Cheng, Y.; Cortese, M.S.; Romero, P.; Uversky, V.N.; Dunker, A.K. Coupled folding and bindingwith alpha-helix-forming molecular recognition elements. Biochemistry 2005, 44, 12454–12470. [CrossRef][PubMed]
79. Ren, S.; Uversky, V.N.; Chen, Z.; Dunker, A.K.; Obradovic, Z. Short Linear Motifs recognized by SH2, SH3and Ser/Thr Kinase domains are conserved in disordered protein regions. BMC Genom. 2008, 9 (Suppl. 2),S26. [CrossRef]
Biomolecules 2020, 10, 1080 13 of 13
80. Van Roey, K.; Uyar, B.; Weatheritt, R.J.; Dinkel, H.; Seiler, M.; Budd, A.; Gibson, T.J.; Davey, N.E. Short linearmotifs: Ubiquitous and functionally diverse protein interaction modules directing cell regulation. Chem. Rev.2014, 114, 6733–6778. [CrossRef] [PubMed]
81. Hu, G.; Wu, Z.; Oldfield, C.J.; Wang, C.; Kurgan, L. Quality assessment for the putative intrinsic disorder inproteins. Bioinformatics 2019, 35, 1692–1700. [CrossRef]
82. Katuwawala, A.; Oldfield, C.J.; Kurgan, L. DISOselect: Disorder predictor selection at the protein level.Protein Sci. 2020, 29, 184–200. [CrossRef] [PubMed]
83. Ward, J.J.; Sodhi, J.S.; McGuffin, L.J.; Buxton, B.F.; Jones, D.T. Prediction and functional analysis of nativedisorder in proteins from the three kingdoms of life. J. Mol. Biol. 2004, 337, 635–645. [CrossRef]
84. Altschul, S.F.; Madden, T.L.; Schaffer, A.A.; Zhang, J.; Zhang, Z.; Miller, W.; Lipman, D.J. Gapped BLAST andPSI-BLAST: A new generation of protein database search programs. Nucleic Acids Res. 1997, 25, 3389–3402.[CrossRef]
85. Vincent, M.; Uversky, V.N.; Schnell, S. On the Need to Develop Guidelines for Characterizing and ReportingIntrinsic Disorder in Proteins. Proteomics 2019, 19, e1800415. [CrossRef] [PubMed]
86. Crooks, G.E.; Hon, G.; Chandonia, J.M.; Brenner, S.E. WebLogo: A sequence logo generator. Genome Res.2004, 14, 1188–1190. [CrossRef] [PubMed]
© 2020 by the author. Licensee MDPI, Basel, Switzerland. This article is an open accessarticle distributed under the terms and conditions of the Creative Commons Attribution(CC BY) license (http://creativecommons.org/licenses/by/4.0/).


![FFAS server: novel features and applications · 2017. 4. 14. · structural predictions using sequence information. Protein Science: a Publication of the Protein Society, 9, 232–241]](https://img.pdfslide.net/doc/110x75/5fd4a0ab4618f23b9c177df5/ffas-server-novel-features-and-applications-2017-4-14-structural-predictions.jpg)