Embed Size (px)
Citation preview
P.O. Box 1390, Skulagata 4
120 Reykjavik, Iceland Final Project 2007
ANALYSIS OF QUALITY DETERIORATION AT CRITICAL
STEPS/POINTS IN FISH HANDLING IN UGANDA AND
ICELAND AND SUGGESTIONS FOR IMPROVEMENT
Bataringaya Amos
Fisheries Sector
Kalangala District Local Government
P.O. Box 2 Kalangala
Uganda
Supervisors
Prof. Hjorleifur Einarsson, [email protected]
Arnheidur Eythorsdottir, [email protected]
ABSTRACT
In this report, fish handling steps prior to processing in Uganda and Iceland were
studied empirically. The effects of fish age (post-catch days) and mechanical load on
the sensory, microbiological and chemical qualities of cod (Gadus morhua) were also
investigated. The effects of mechanical load were investigated by subjecting one lot of
fish to mechanical load for seven days and the quality was then compared to the other
lot without load. Sensory results of post-catch days analysis showed increased quality
deterioration of cod on post-catch days 7-11 than post-catch days 1-7. Fish subjected
to mechanical load exhibited more sensory quality loss and higher total microbial
counts in the flesh and lower counts on the skin surface as opposed to fish that was
not exposed to mechanical load. TVB-N was also slightly higher in fish with load.
The overall results suggested that fish quality deterioration in Uganda is mostly due to
bacterial growth. It is thus recommended that fish shouldn’t be kept beyond six hours
at ambient temperature before it is iced if its shelf life is to be maintained to meet the
market’s quality demands.
Bataringaya
UNU-Fisheries Training Programme 2
TABLE OF CONTENTS
1 INTRODUCTION ................................................................................................ 5
2 LITERATURE REVIEW ................................................................................... 6
2.1 Forms of fish spoilage ........................................................................................ 6
2.1.1 Microbiological spoilage ........................................................................... 6
2.1.2 Chemical oxidation .................................................................................... 7
2.1.3 Autolytic spoilage ...................................................................................... 8
2.2 Factors that influence the rate of fish spoilage ................................................. 9
2.1.4 Effects of time/temperature conditions on microbial growth .................... 9
2.1.5 Effects of hygiene on fish quality during handling .................................... 9
2.1.6 Rough handling .......................................................................................... 9
2.1.7 Initial bacterial load ................................................................................. 10
2.1.8 Methods of capture .................................................................................. 10
2.1.9 Mode of storage ....................................................................................... 10
3 MATERIALS AND METHODS ...................................................................... 11
3.1 Fish handling steps in Uganda and Iceland .................................................... 11
3.2 Effects of post-catch storage time on fish quality ............................................ 11
3.3 Effects of mechanical load on fish quality ....................................................... 11
3.4 Sensory evaluation ........................................................................................... 12
3.5 Microbiological evaluation .............................................................................. 12
3.6 Chemical analysis ............................................................................................ 12
4 STUDY RESULTS ............................................................................................. 13
4.1 Fish handling steps in Uganda prior to processing ......................................... 13
4.1.1 On the lake ............................................................................................... 13
4.1.2 Landing sites on the islands ..................................................................... 13
4.1.3 Landing sites and containers on the islands ............................................. 14
4.1.4 Loading in trucks both on the islands and the mainland .......................... 14
4.1.5 Processing plant ....................................................................................... 15
4.2 Fish handling in Iceland .................................................................................. 17
4.1.6 Handling of catch on board ...................................................................... 18
4.1.6.1 Bleeding ........................................................................................... 19
4.1.6.2 Gutting ............................................................................................. 19
4.1.6.3 Chilling ............................................................................................ 19
4.1.7 Receiving, storage and quality assessment of fish at factory ................... 20
4.1.8 Auction market ......................................................................................... 20
4.1.9 Effects of post-catch storage time on fish quality .................................... 21
4.3 Effects of mechanical load on fish quality ....................................................... 23
5 DISCUSSION ..................................................................................................... 27
Bataringaya
UNU-Fisheries Training Programme 3
6 CONCLUSIONS ................................................................................................ 28
7 RECOMMENDATIONS/GUIDELINES FOR IMPROVING FISH
HANDLING IN UGANDA ........................................................................................ 29
Fishing boat on lake ................................................................................................. 29
Landing site, container and truck ............................................................................ 29
Processing plant ....................................................................................................... 30
ACKNOWLEDGEMENTS ...................................................................................... 31
LIST OF REFERENCES .......................................................................................... 32
APPENDICES ............................................................................................................ 34
Appendix 1: Sensory assessment sheet for whole Cod (QIM). ................................ 34
Appendix 2: Sensory assessment guide for Cod fillets (QIM). ................................ 35
Bataringaya
UNU-Fisheries Training Programme 4
LIST OF FIGURES
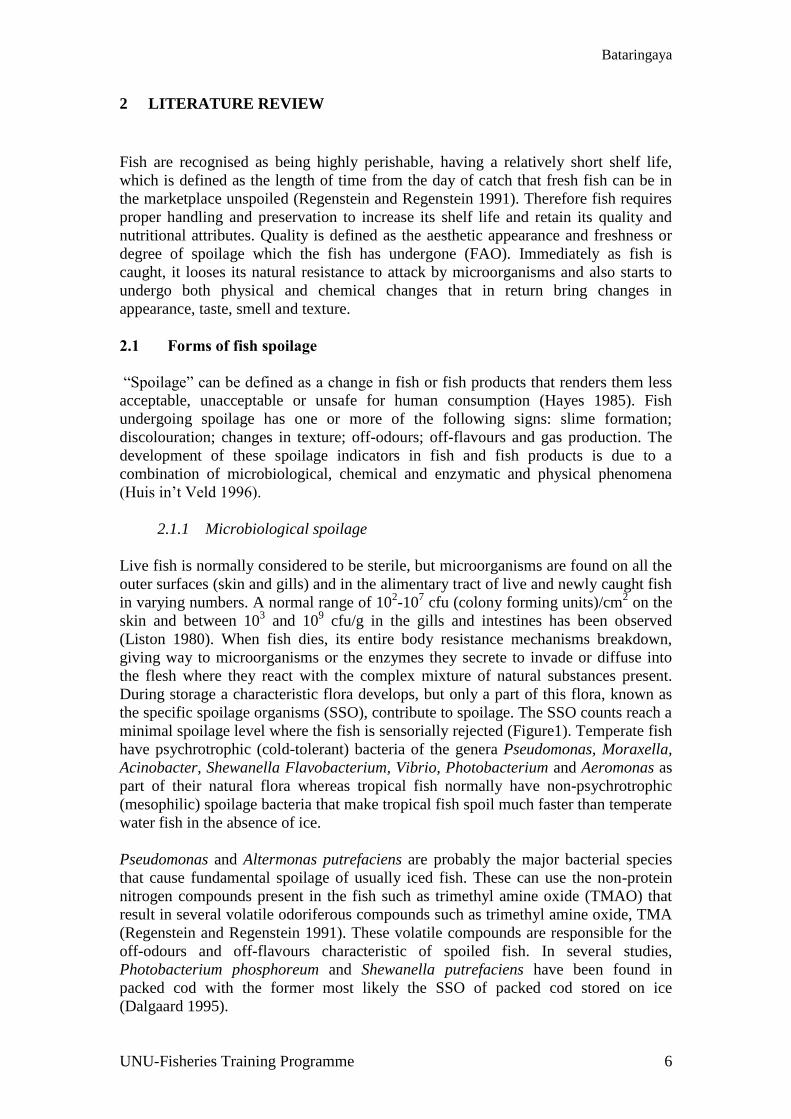
Figure 1: General pattern of microbial spoilage changes in total viable count (TVC),
specific spoilage organisms (SSO), and chemical spoilage indices during chilled
storage of a fish product (adapted from Dalgaard 1993). ....................................... 8
Figure 2: Flow diagram of fish catch from fishing boat to factory. ............................. 16
Figure 3: Raw material handling of demersal fish. ...................................................... 18
Figure 4: Sensory quality of gutted cod of different post-catch days. ......................... 21
Figure 5: Microbial counts from gutted cod of different post-catch days (TPC, total
plate count and SSO, specific spoilage organisms). .............................................. 22
Figure 6: TVB-N levels in gutted cod of different post-catch days. ............................ 23
Figure 7: Sensory quality changes in gutted cod iced with mechanical load (WL) and
without mechanical load (WOL) conditions. ........................................................ 24
Figure 8: Changes in surface bacterial counts of gutted cod iced under the different
mechanical load conditions. .................................................................................. 24
Figure 9: Changes in bacterial counts in the flesh of gutted cod iced under the
different mechanical load conditions. ................................................................... 25
Figure 10: Changes in TVB-N of gutted cod stored on ice under the different
mechanical load conditions. (WOL, with load and WL, without load) ................ 26
LIST OF TABLES
Table 1: A summary of what can go wrong at each of the handling steps………….. 17
Bataringaya
UNU-Fisheries Training Programme 5
1 INTRODUCTION
Currently, Uganda’s major source of foreign exchange comes from fish exports of
Nile perch (Lates niloticus) and to a lesser extent Nile tilapia (Oreochromis niloticus)
exported mainly to the European Union (EU). Fisheries annual production amounts to
approximately 371,000 metric tonnes with approximate exports worth USD 100
million, with over one million people directly or indirectly involved in fishing,
transportation, processing or employed as resource managers (FAO, Year of fishery
statistics 2007).
The main sources of fish for fish processing plants in Uganda are landing sites on the
islands of Lake Victoria. Kalangala district is one of them (a unique district in Lake
Victoria composed of 84 isolated islands) with about 2500 operational fishing boats.
On average, 40 kg per boat valued at 2400 Ugshs (about USD 1.3) per kg are landed
on a daily basis.
However, not all fish landed end up in factories, about 10-30% are regarded as
“rejects” both at landing sites and in fish processing factories. The rejected fish is
either of deteriorated quality or to a lesser extent under sized, which fetches only
about a quarter of the price. However, rejected fish always finds its way to local or
regional markets, and is often processed locally by frying, smoking or salting and
drying to minimise further spoilage during distribution.
EU regulation (EC) No852/2004, demands imported foods from exporting countries
to be of at least the same hygienic standards as food produced within the EU . Iceland
has more contacts with the EU as it is a member of the European Economic Area
(EEA) and also an exporter of fishery products to the EU market. Therefore, a study
of fish handling practices in Iceland is of paramount importance for improving fish
handling practices and fish quality in Uganda.
First class products can never be produced from defect raw materials. Therefore, a
study of the fish handling chain from catch prior to processing and factors for the best
storage conditions in insulated fish transport boats to maintain quality of fish for 2-7
days was conducted. The objectives of the study were to:
Identify major causes of fish quality deterioration in the handling chain in
Uganda.
Study fish handling practices in Iceland that can potentially be applicable in
Uganda to improve fish quality.
Analyse the quality of fish at each step in Iceland.
Come up with recommendations of both Good Hygiene Practices (GHPs)
and Sanitation Standard Operating Procedures (SSOPs) for fish handling
prior to processing in Uganda.
Bataringaya
UNU-Fisheries Training Programme 6
2 LITERATURE REVIEW
Fish are recognised as being highly perishable, having a relatively short shelf life,
which is defined as the length of time from the day of catch that fresh fish can be in
the marketplace unspoiled (Regenstein and Regenstein 1991). Therefore fish requires
proper handling and preservation to increase its shelf life and retain its quality and
nutritional attributes. Quality is defined as the aesthetic appearance and freshness or
degree of spoilage which the fish has undergone (FAO). Immediately as fish is
caught, it looses its natural resistance to attack by microorganisms and also starts to
undergo both physical and chemical changes that in return bring changes in
appearance, taste, smell and texture.
2.1 Forms of fish spoilage
“Spoilage” can be defined as a change in fish or fish products that renders them less
acceptable, unacceptable or unsafe for human consumption (Hayes 1985). Fish
undergoing spoilage has one or more of the following signs: slime formation;
discolouration; changes in texture; off-odours; off-flavours and gas production. The
development of these spoilage indicators in fish and fish products is due to a
combination of microbiological, chemical and enzymatic and physical phenomena
(Huis in’t Veld 1996).
2.1.1 Microbiological spoilage
Live fish is normally considered to be sterile, but microorganisms are found on all the
outer surfaces (skin and gills) and in the alimentary tract of live and newly caught fish
in varying numbers. A normal range of 102-10
7 cfu (colony forming units)/cm
2 on the
skin and between 103 and 10
9 cfu/g in the gills and intestines has been observed
(Liston 1980). When fish dies, its entire body resistance mechanisms breakdown,
giving way to microorganisms or the enzymes they secrete to invade or diffuse into
the flesh where they react with the complex mixture of natural substances present.
During storage a characteristic flora develops, but only a part of this flora, known as
the specific spoilage organisms (SSO), contribute to spoilage. The SSO counts reach a
minimal spoilage level where the fish is sensorially rejected (Figure1). Temperate fish
have psychrotrophic (cold-tolerant) bacteria of the genera Pseudomonas, Moraxella,
Acinobacter, Shewanella Flavobacterium, Vibrio, Photobacterium and Aeromonas as
part of their natural flora whereas tropical fish normally have non-psychrotrophic
(mesophilic) spoilage bacteria that make tropical fish spoil much faster than temperate
water fish in the absence of ice.
Pseudomonas and Altermonas putrefaciens are probably the major bacterial species
that cause fundamental spoilage of usually iced fish. These can use the non-protein
nitrogen compounds present in the fish such as trimethyl amine oxide (TMAO) that
result in several volatile odoriferous compounds such as trimethyl amine oxide, TMA
(Regenstein and Regenstein 1991). These volatile compounds are responsible for the
off-odours and off-flavours characteristic of spoiled fish. In several studies,
Photobacterium phosphoreum and Shewanella putrefaciens have been found in
packed cod with the former most likely the SSO of packed cod stored on ice
(Dalgaard 1995).
Bataringaya
UNU-Fisheries Training Programme 7
Bacteria are able to decompose proteins, other nitrogen containing compounds to
ammonia, hydrogen sulphide, which produce an unpleasant and disgusting flavour
(Herbert and Shewan 1975). Trimethyl amine oxide (TMAO), mostly found in marine
fish, is broken down to trimethyl amine (TMA), dimethyl amine (DMA) and ammonia
(NH3), which are responsible for off-odours in fish undergoing spoilage.
The main spoilage test of metabolite(s) produced during fish storage or distribution to
obtain a quantitative fish quality index is total volatile bases (TVB). It measures the
total content of TMA+DMA+ ammonia plus other basic nitrogenous compounds
associated with fish spoilage. TVB and TMA values of 30 mgN and 15 mgN/100 g
are the rejection spoilage levels respectively (Regenstein and Regenstein 1991). The
fishy odour of TMA when it reacts with lipid is generally detectable when the TMA
level reaches 4-6 mgN/100 g.
Microbiological quality evaluation of fish aims to quantify the hygienic quality of
fish, including temperature abuse and the possible presence of pathogenic
microorganisms in the fish. Total aerobic bacteria, also called total plate count (TPC);
specific spoilage organisms (SSO) and various pathogenic bacteria are examined
using appropriate agar media. Quality levels are based on the plate counts for
acceptance or rejection of fishery products for human consumption. With
representative sample units not less than five, plate counts below 5105 are
considered of good quality; between 75 10105 and marginally accepted quality
(sample units with plate counts between 5105 and 107
not exceeding three) and plate
counts at or above 107
are considered unacceptable in quality (ICMSF 1986).
2.1.2 Chemical oxidation
Chemical spoilage processes are changes taking place in the lipid fraction of the fish.
Lipids are oxidised to peroxides, aldehydes, ketones and lower aliphatic acids. The
hydro-peroxides are tasteless but can cause brown and yellow discolouration of the
fish tissue. The degradation of hydro-peroxides gives rise to the formation of
aldehydes and ketones that result in rancid off-flavours. All the chemical by-products
eventually reach a level where the fish is rejected (Figure 1).
High temperatures are partly responsible for the speed of the oxidation processes. In
addition, direct sunlight, wind, heat, light (especially UV-light) and several organic
and inorganic substances may also accelerate oxidative processes.
Living cells in fish have enzymatic protection mechanisms against lipid oxidation by
having an enzyme, glutathione peroxidase, which acts by reducing hydro-peroxides in
cellular membranes to corresponding hydroxyl-compounds. This reaction requires a
supply of the enzyme in a reduced form and thus the reaction stops when the fish die.
Bataringaya
UNU-Fisheries Training Programme 8
Figure 1: General pattern of microbial spoilage changes in total viable count (TVC),
specific spoilage organisms (SSO), and chemical spoilage indices during chilled
storage of a fish product (adapted from Dalgaard 1993).
2.1.3 Autolytic spoilage
As fish dies, its enzymatic activity doesn’t stop immediately but continues resulting in
proteolytic changes that are responsible for early quality loss in fresh fish. The more
these enzymes get in contact with the fish’s flesh the greater the spoilage. Adenosine
triphosphate (ATP) is broken down through a series of products such as adenosine
diphosphate (ADP), inosine monophosphate (IMP), inosine and hypoxanthine (HX)
as: HXIIMPenergyADPATP ) .
IMP and HX may be responsible for the sweet and mild tastes in the later stages of
shelf life and these products accumulate especially when the respective step is rate-
limiting (Regenstein and Regenstein 1991). From previous studies, these changes
precede microbiological spoilage and have been seen to contribute very little to
spoilage of chilled fish and fish products (Huss 1994).
Bataringaya
UNU-Fisheries Training Programme 9
2.2 Factors that influence the rate of fish spoilage
2.1.4 Effects of time/temperature conditions on microbial growth
The most crucial factors determining the quality of fishery products are time and
temperature tolerance. Proliferation of microorganisms requires appropriate high
temperatures, while at lower temperatures close to 0ºC, their activity is reduced,
thereby extending the shelf life of fish products. Temperature is the single most
important factor affecting post-harvest quality of the products. It is often critical to
reach the desired short-term storage temperature rapidly to maintain the highest visual
quality, flavour, texture, and nutritional content of fresh fish.
The rate of spoilage is dependent upon the holding temperature and is greatly
accelerated at higher temperatures, due to increased bacterial action.
The shelf life at different storage temperatures (t°C) has been expressed by the relative
rate of spoilage (RRS), defined by the equation (Spencer and Baines 1964):
CatTtimekeeping
Cattimekeepingspoilageofratelative
0Re
conditionsstorageactualtheatspoilageofRate
indicatorqualityaoflevelinitialFinalShelflife
2.1.5 Effects of hygiene on fish quality during handling
Apart from the microorganisms that fishes have at the time of capture, more is added
via unhygienic practices and contaminated equipment such as storage facilities. This
was demonstrated by studies that compared the quality and storage life of completely
aseptically treated fish (aseptic handling), washed fish, iced in clean plastic boxes,
with clean ice (clean handling) and with un-washed fish, iced in old, dirty wooden
boxes (normal handling). A considerable difference was found in the bacterial
contamination of the three batches, the latter heavily contaminated with a reduction in
storage life compared with the other samples (Huss et al. 1974).
The design of a fish hold is of great importance as far as hygiene in the hold is
concerned. Hold design should enable the purge (drip loss) to be collected easily. The
amount of purge was suggested to be higher at 5-7ºC; at which temperature there is
greater spoilage since the purge is a very good medium for bacterial growth
(Hermansen 1983).
2.1.6 Rough handling
Rough handling will result in a faster spoilage rate. This is due to the physical damage
to the fish, resulting in easy access for enzymes and spoilage bacteria. Physical
mishandling in the net, such as very large catches, fishermen stepping on fish or
throwing boxes, containers and other items on top of the fish, may cause bruises and
rupture of blood vessels.
Bataringaya
UNU-Fisheries Training Programme 10
When fish is in rigor mortis (a complicated series of chemical changes that result in
stiffening of the fish’s muscle shortly after death), rough handling can cause gaping
(Huss 1995).
2.1.7 Initial bacterial load
The microflora on tropical fish often carries a slightly higher load of Gram-positives
and enteric bacteria but otherwise is similar to the flora on temperate-water fish
(Liston 1980). Basically, bacteria populations on temperate fish are predominantly
psychrotrophic reflecting water temperatures of about 10оC while fish from the tropics
have largely mesophilic bacteria (Gram and Huss 1996).
2.1.8 Methods of capture
The fishing gear and method employed determines the time taken between capture
and death. Fish caught in gillnets struggle much to escape, and in so doing, they are
bruised by the net which increases exposure to microbial entry and subsequent
deterioration. Fish caught by hook and line methods, on the other hand, die relatively
quickly and therefore bruises and stresses are likely to be minimal. Physical
mishandling in the net due to long trawling nets and very large catches accelerates
spoilage. The large catches in the net are compacted against each other resulting in the
fish getting bruised and crushed (especially small sized fish) by the heavy trawl net.
2.1.9 Mode of storage
In bulk-storage, the weight of the pile may crush the fish at the bottom, leading to a
loss of weight (yield) as well as other physical damage. It has been reported that when
haddock is kept in a short, deep pile of about 3 ft, the bottom fish lose 15% of their
weight compared to a normal weight loss of 3-8%, which is entirely due to
biochemical changes that cause a loss of water holding capacity leading to drip
(Regenstein and Regenstein 1991). Crushing of the fish by ice or other fish can
seriously affect the quality of fish by releasing enzymes from the gut into the fish
muscle thereby accelerating autolytic processes.
Bataringaya
UNU-Fisheries Training Programme 11
3 MATERIALS AND METHODS
3.1 Fish handling steps in Uganda and Iceland
Using the author’s own experience, observation and previous studies, the fish
handling steps in Uganda were critically reviewed and described, pointing out major
practices that are likely to be responsible for fish quality deterioration, with an
emphasis on those that can potentially be improved. In Iceland, the same handling
steps were studied through study visits to a fish harbour and auction market in Dalvik
and the factory reception area at Brim factory limited so as to have a comparative
view.
3.2 Effects of post-catch storage time on fish quality
In an effort to have an insight into the degree of GHPs and SSOPs employed in fish
handling in Iceland, the sensory, microbiological and chemical quality parameters of
gutted iced cod of different post-catch days were evaluated. Five individual whole cod
of different post-catch days (PDs) 1, 7, and 11 were randomly picked from their
respective tubs in the reception area of fresh fish from vessels landing at Brim factory
limited. The fish sampled were from a trawler (Arbakur RE 205). The core
temperature of the fish at the time of sampling was -0.4оC and the ambient
temperature was -0.5оC to -0.2
оC in the reception area.
3.3 Effects of mechanical load on fish quality
In order to observe the effects of mechanical load (pressure) on bottom fish in a big
fish hold for several days, as is the case in Uganda, the approach used aimed at
assessing the effects of mechanical load on fish quality deterioration in fish that is
heavily loaded in a fish hold (container). Thirty-five individual whole gutted cod
(Gadus morhua) of one day post-catch (approximately 1 kg in weight per fish) from
Brim factory limited were used for the study.
Five individual fish were sensorially analysed and the other three fish samples iced in
polystyrene box and transported to the laboratory at the University of Akureyri, for
biological and chemical analysis in order to get the original quality of the fish.
Twenty whole fish were then weighed into two lots of 13.4 and 13 kg and then
handled under two different treatments:
Treatment one: One lot of 13 kg was properly iced in a fish-tub with a storage
capacity of 300 kg, with proper drainage from the tub .The tub was then kept at 0-2ºC
(temperature in the reception room) for seven days.
Treatment two: The other lot weighing 13.4 kg was iced in the same way as the first
lot . Unlike the other treatment, several layers of salmon bags filled with clean
portable water were added on top of the ice layer above the fish, which acted as fish,
alternating with ice layers until the tub was full. The approximate weight above the
fish layer was 200 kg. The second tub was kept in a similar environment for the same
period of time after which the sensory, microbiological and chemical parameters were
analysed.
Bataringaya
UNU-Fisheries Training Programme 12
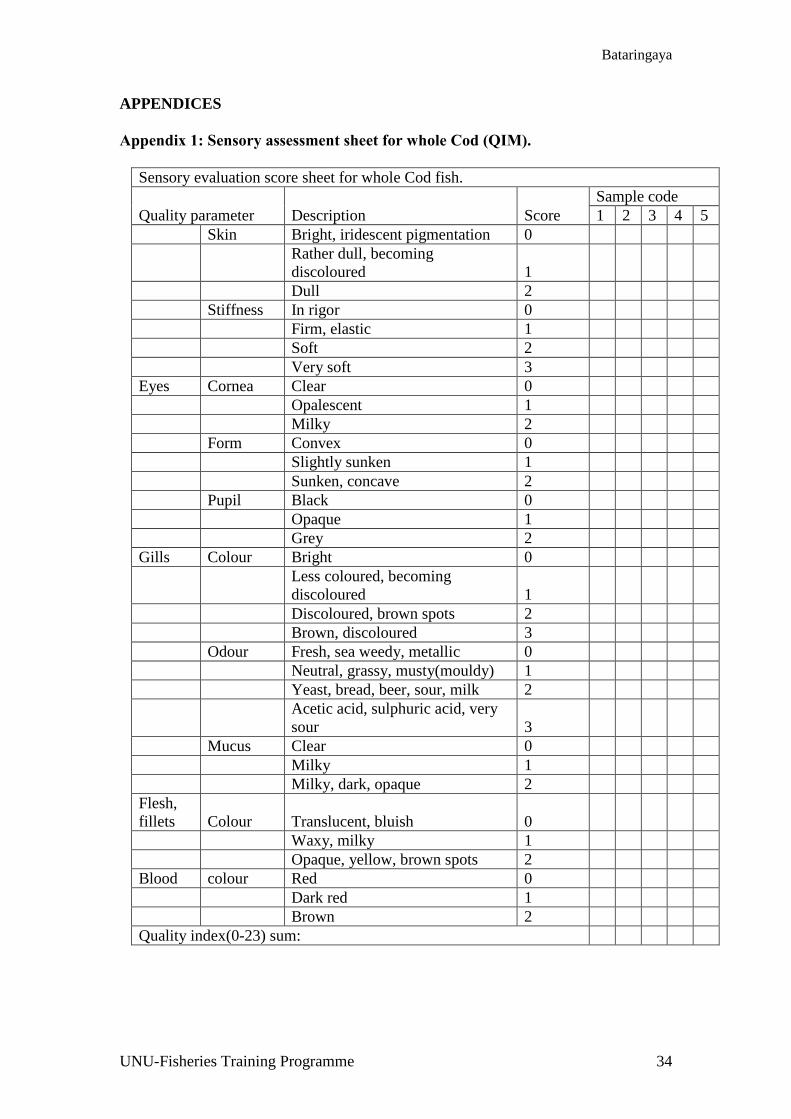
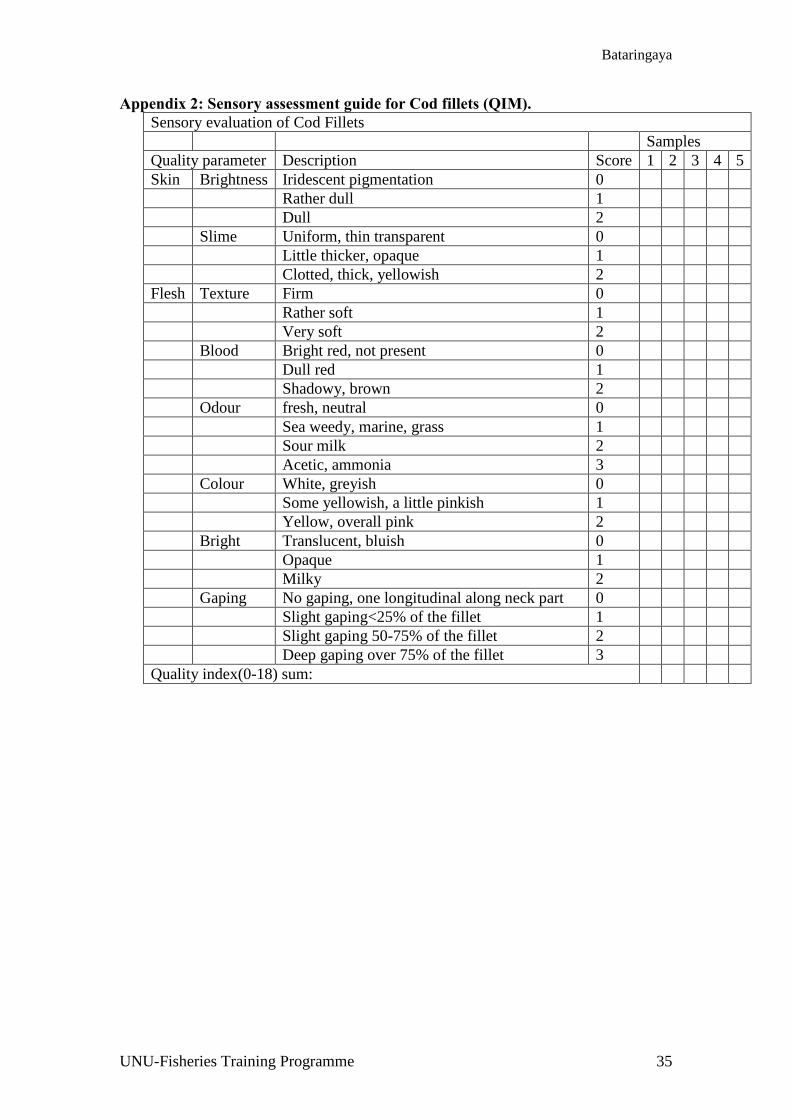
3.4 Sensory evaluation
Freshness is to a certain degree subjective but it can be “measured” against an agreed
scale by assessment of appearance, odour and taste. Sensory quality attributes of five
whole cod fish samples were evaluated by the author using the quality index method
(QIM) where each quality attribute was rated on a 0-3 demerit point score (with 0
being the highest and 3 the lowest) with a total score of 0-18 for cod fillets and 0-23
for whole cod (Larsen et al. 1992 and Bonilla et al. 2007) as shown in Appendix 1
and 2. Scores from each individual fish were added and the sum of the individual fish
averaged to give the overall sensory score (quality index) of the fish from the same
post-mortem age (post-catch days).
3.5 Microbiological evaluation
Three fish samples of 1, 7 and 11 post-catch days and three fish samples from each
treatment were iced in different polystyrene boxes and immediately taken to the
microbiological laboratory of the University of Akureyri for analysis. Bacterial counts
were made from the skin and flesh separately as follows:
Skin: An area of 20 cm2 was marked on the skin surface of each fish, swabbed clearly
several times and the swabs mixed thoroughly in 20 ml of buffer solution. Ten-fold
serial dilutions were made from 1 ml of the mixture, and 0.1 ml from each dilution
spread on prepared iron agar plates in duplicate and the plates incubated at 22ºC for
72 hours and thereafter the total viable bacteria were enumerated using the total plate
count method (TPC).
Flesh: The skin from individual fish was carefully removed, pieces cut from the flesh
and minced in a blender. Twenty-five grams (25 g) of the minced fish were weighed
in a stomacher bag, 225 ml of buffer solution added and the contents homogenised for
60 seconds in a laboratory stomacher-400 model. Serial ten-fold dilutions were made
from 1 ml of the homogenate and 0.1 ml of each dilution spread on iron agar in
duplicate and the plates incubated at room temperature (22оC) for 72 hours.
3.6 Chemical analysis
The same fish samples that remained after the microbial analysis were used to
determine the total volatile bases-nitrogen (TVB-N) of the initial quality of the fish
before treatment. Fish sample (100 g) was weighed and the corresponding 200 ml of
7.5% aqueous trichloroacetic acid solution added and the mixture homogenised in a
waring blender for 60 seconds. The mixture was then filtered through a white-filter
paper.
To 25 ml of filtrate in a distillation flask was added 6 ml of 10% sodium hydroxide
(NaOH) and the mixture steam- distilled against a beaker containing 10 ml of 4%
boric acid solution and 0.04 ml of methyl red and bromocresol green indicator using a
Kjeldahl-type distillator until the solution in the beaker rose to the 50 ml mark. Then
the alkalised boric acid solution was titrated with aqueous 0.025 M sulphuric acid
solution (H2SO4 (aq)). Complete neutralisation was obtained when the green colour
turned pink on the addition of a further drop of sulphuric acid.
Bataringaya
UNU-Fisheries Training Programme 13
4 STUDY RESULTS
4.1 Fish handling steps in Uganda prior to processing
Three major methods of fishing are used namely, gillnetting, long-lining and hook and
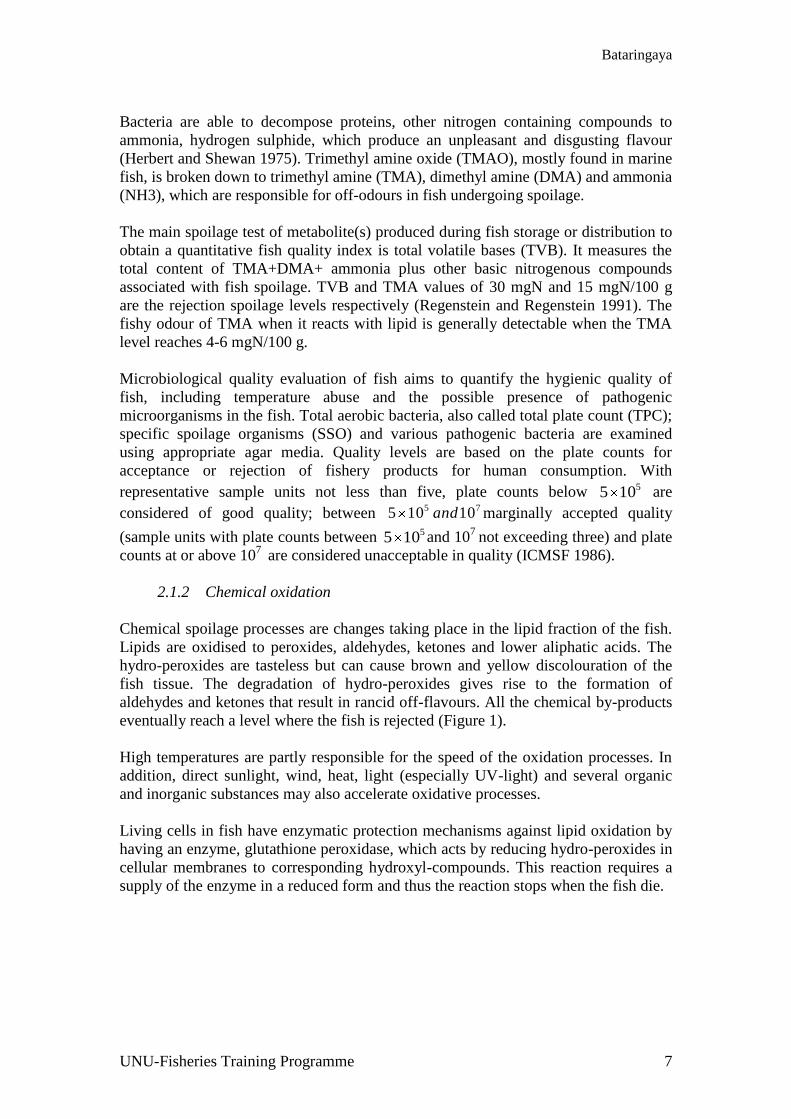
line. The complex chain through which the catch flows from fishing boat to the fish
processing plant is summarised in Figure 2. Fish for industrial processing is
transported by insulated boats from landing sites in the islands of Lake Victoria, and
from landing sites along the shores by insulated trucks. The time taken for catch to
reach processing plants ranges from 3-8 days for coming from the islands.
4.1.1 On the lake
For gillnetting, fishermen from fish landing sites go offshore (by motor or manual
propulsion) and cast their nets at around 4-5 pm. Hauling of nets starts at about 2 am
and landing of the catch (un iced) from 6 am onwards depending on the prevailing
lake weather conditions. The major reason why fishermen land un-iced fish is that
there is no ice plant in the district. Even the insulated fish transport boats have to get
ice from factories, which are far from the landing sites. On the other hand, long-lines
are set very early in the morning, hauled in the afternoon and catches landed in the
evening. Assuming that the first fish gets caught in the net at 6 pm, hauled from the
net at 3 am, transported and received by the container at the landing site at 8 am, this
means the fish would have spent about 14 hours from the time it got caught in the net.
This time interval may be responsible for most of the fish being rejected at the first
landing sites as a result of bacterial growth. This factor is exacerbated where landed
fish is not immediately iced but collected by “middlemen” and kept for an additional
1-3 hours before it is transferred to the container to be iced.
4.1.2 Landing sites on the islands
On landing, fish is sorted out of the nets, graded, weighed and sold to supplier/factory
agents. During removal of the fish from nets, fish is simply thrown into the boat haul
with little or no care. The rough handling can cause internal bruising and bleeding that
becomes visible either when the fish is filleted or eaten by the consumer. Such fillets
in factories are rejected or trimmed causing financial losses in terms of labour and
yield.
In most landing sites, there are middlemen locally referred to as “kachanga” who are
given money at landing site by suppliers or factory agents to buy and collect the fish
from different landing boats. They sometimes use unhygienic collection points such
as dirty, dilapidated boats. Thereafter, the fish is conveyed to the respective container
owner who gives them a commission based on kg of fish bought. It is at this point that
fish of low quality end up in the container and at factories because the middlemen
strive to get more fish by mixing in fish of different quality levels. Based on studies
conducted on the use of fish holds with different degrees of cleanliness (Huss et al.
1974), it is this step that poses the greatest potential danger to fish quality
deterioration due to bacterial contamination from dirty, unclean and un-disinfected
contact surfaces (dilapidated boats at landing sites).
Bataringaya
UNU-Fisheries Training Programme 14
4.1.3 Landing sites and containers on the islands
Fish gathered from boats is in some cases dragged through landing site water and
thrown on to an insulated container (always anchored on the lake). This practice leads
to fish being contaminated in the unclean landing site water and the throwing further
damages the fish’s skin because of sharp points of the container, making entry by
bacteria easy. However, lack of landing site facilities such as floating jettys/docks
makes transfer of fish from landing sites to containers difficult and thus fishermen to
behave in this way.
The size of the fish hold is so big that the person icing the fish stands on the fish as he
loads and ices it in the fish hold. The person and his boots may damage the fish and
also the overall weight of the person may cause the fish to “burst”. In addition, the
many layers of fish and ice can also cause crushing of fish especially on the bottom
layers. Another critical source of fish spoilage lies in the design and conditions of the
container where some are poorly designed and cannot allow proper cleaning and
drainage of purge. These factors promote contamination and growth of bacteria.
Buying and loading fish in the container is done by mixing fish of different post-catch
days. One of the disadvantages associated with this practice is that grading of fish at
the next landing site or factory reception area for size, species and degree of freshness
is considerably problematic and time consuming. From the first landing site, the boat
leaves for another established landing site on the mainland or in Kalangala district, or
directly to a factory on the mainland. The tonnage of the container can be 1-6 tonnes
of fish depending on: days spent buying, capacity of the container, availability of fish,
finance and amount of ice.
4.1.4 Loading in trucks both on the islands and the mainland
At the second landing site, fish is removed from the container, evaluated and quality
fish is re-iced in an insulated truck which buys and loads fish (for 2-3 days in the case
of Kalangala) and finally it is taken to the factory. De-icing and evaluation are done
on display tables and floors which are provided with a shade. The hygiene and
cleanliness of these contact surfaces is critical in the contamination of the fish. The
duration of transporting fish from the original landing site to next landing takes 2-6
hours depending on the distance and speed of the engine. The kind of loading in the
truck is bulky massive stowage where fish of different post-mortem days, sizes and
qualities are mixed. As said before, this makes grading fish at the factory difficult.
Improper icing, conditions of the truck insulation and the effects of mechanical load
are likely to affect the quality of the fish.
Bataringaya
UNU-Fisheries Training Programme 15
4.1.5 Processing plant
In order to identify fish that don’t meet the quality demands of processing plants, fish
are informally inspected at landing sites by buyers and at factories by factory
inspectors through organoleptic assessment of gill colour, skin texture, eye colour and
general appearance, with much emphasis on gill colour.
One of the weaknesses at this step is how well the fish is removed from insulated-
compartmentalised vessels (containers) to the factory’s raw material reception area.
Sometimes these boats may take several days to be off-loaded, without having and
considering the history of the fish, such as: post-mortem days, core temperature of the
fish, amount of ice used, general conditions of the container, and so on. This practice
contributes to fish spoilage rates especially if fish from the source was inadequately
iced. This affects the fishermen and factory suppliers since this culminates in more
fish being graded as “rejects”. In addition, there may be a lack of well trained
technical expertise (fish inspectors) that may grade quality fish as “rejects” or allow
deteriorated raw materials into the processing chain which could result in low prices
for exports. It is therefore important that, in the factory’s hazard analysis critical
control point (HACCP), the first critical control point for quality assurance should be
the control of raw materials so as to avoid substandard raw materials entering the
processing chain.
Bataringaya
UNU-Fisheries Training Programme 16
2 - 3hrs
1 - 3 hrs
3 - 8 hrs
1 - 3 hrs
2 - 8 hrs
1- 2hrs 2 - 8hrs
CATCH IN FISHING VESSEL
ON LAKE VICTORIA
INSULATED CONTAINER AT
LANDING SITE IN ISLANDS
(2-7 days)
TRUCK AT LANDING SITE
ON MAINLAND
(1 day)
TRUCK AT LANDING SITE
IN ISLANDS(e.g KALANGALA
DISTRICT):2-3 days
FISH PROCESSING PLANT
ON MAINLAND
HAULING NETS
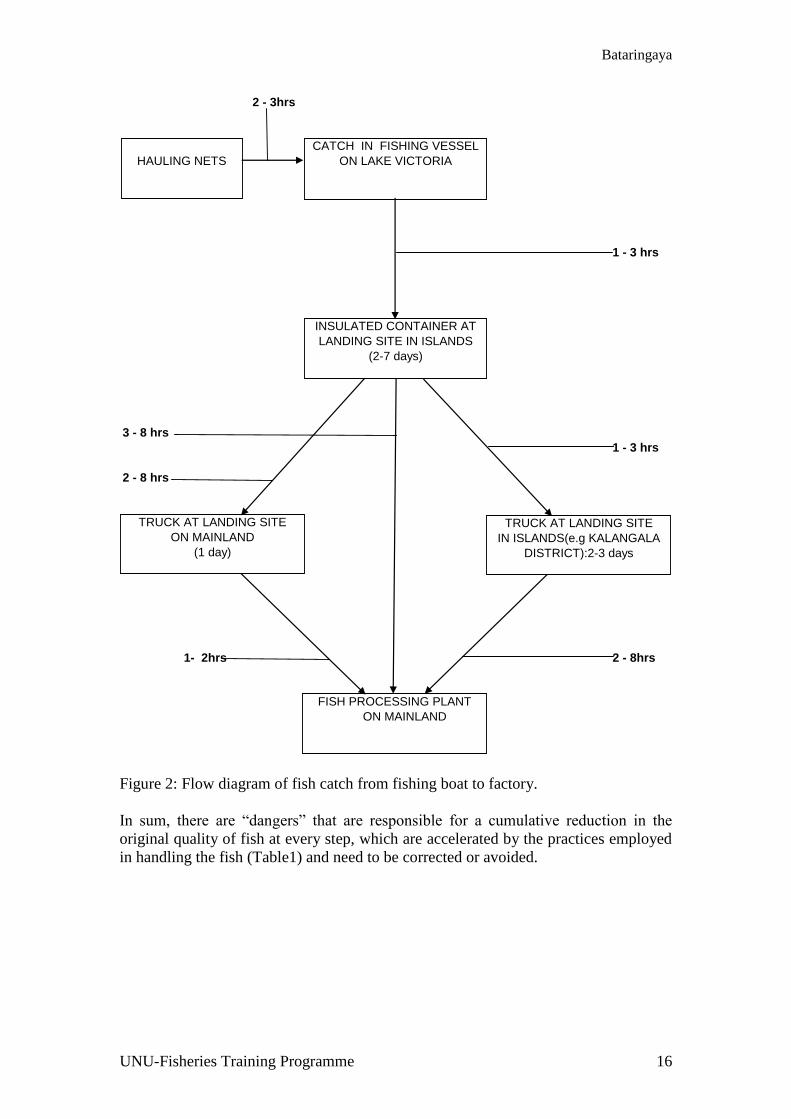
Figure 2: Flow diagram of fish catch from fishing boat to factory.
In sum, there are “dangers” that are responsible for a cumulative reduction in the
original quality of fish at every step, which are accelerated by the practices employed
in handling the fish (Table1) and need to be corrected or avoided.
Bataringaya
UNU-Fisheries Training Programme 17
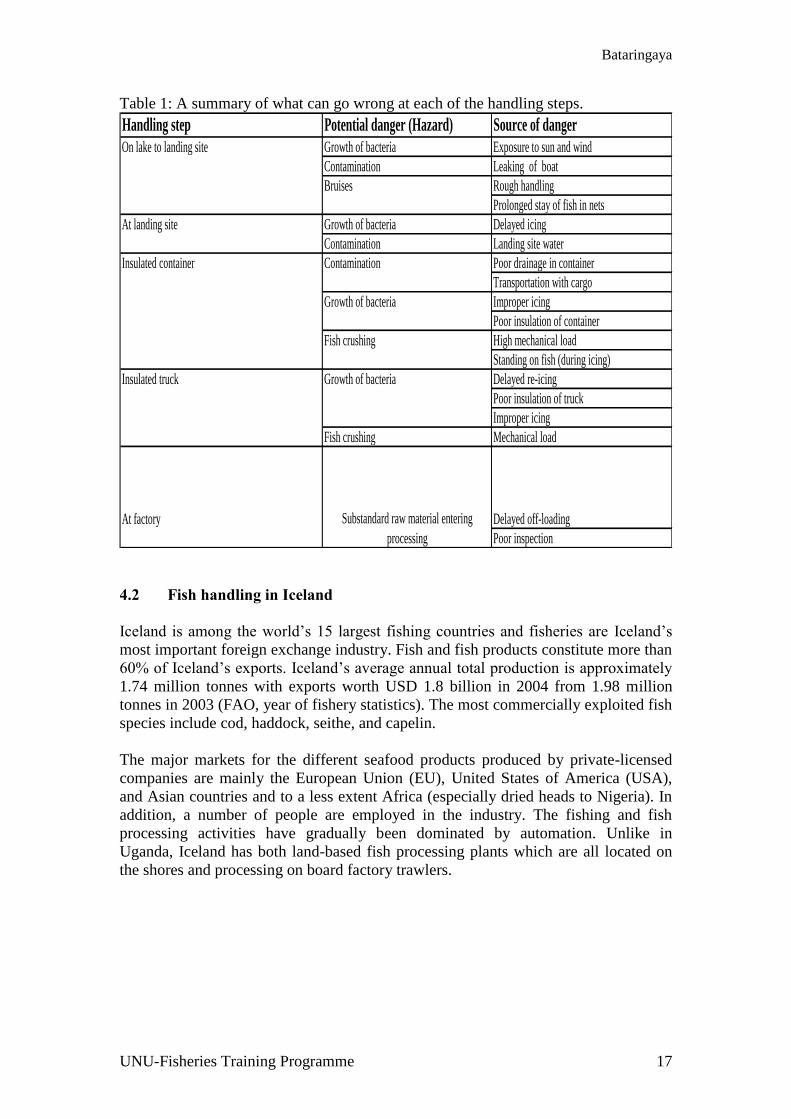
Table 1: A summary of what can go wrong at each of the handling steps.
Handling step Potential danger (Hazard) Source of danger
On lake to landing site Growth of bacteria Exposure to sun and wind
Contamination Leaking of boat
Bruises Rough handling
Prolonged stay of fish in nets
At landing site Growth of bacteria Delayed icing
Contamination Landing site water
Insulated container Contamination Poor drainage in container
Transportation with cargo
Growth of bacteria Improper icing
Poor insulation of container
Fish crushing High mechanical load
Standing on fish (during icing)
Insulated truck Growth of bacteria Delayed re-icing
Poor insulation of truck
Improper icing
Fish crushing Mechanical load
At factory Delayed off-loading
Poor inspection
Substandard raw material entering
processing
4.2 Fish handling in Iceland
Iceland is among the world’s 15 largest fishing countries and fisheries are Iceland’s
most important foreign exchange industry. Fish and fish products constitute more than
60% of Iceland’s exports. Iceland’s average annual total production is approximately
1.74 million tonnes with exports worth USD 1.8 billion in 2004 from 1.98 million
tonnes in 2003 (FAO, year of fishery statistics). The most commercially exploited fish
species include cod, haddock, seithe, and capelin.
The major markets for the different seafood products produced by private-licensed
companies are mainly the European Union (EU), United States of America (USA),
and Asian countries and to a less extent Africa (especially dried heads to Nigeria). In
addition, a number of people are employed in the industry. The fishing and fish
processing activities have gradually been dominated by automation. Unlike in
Uganda, Iceland has both land-based fish processing plants which are all located on
the shores and processing on board factory trawlers.
Bataringaya
UNU-Fisheries Training Programme 18
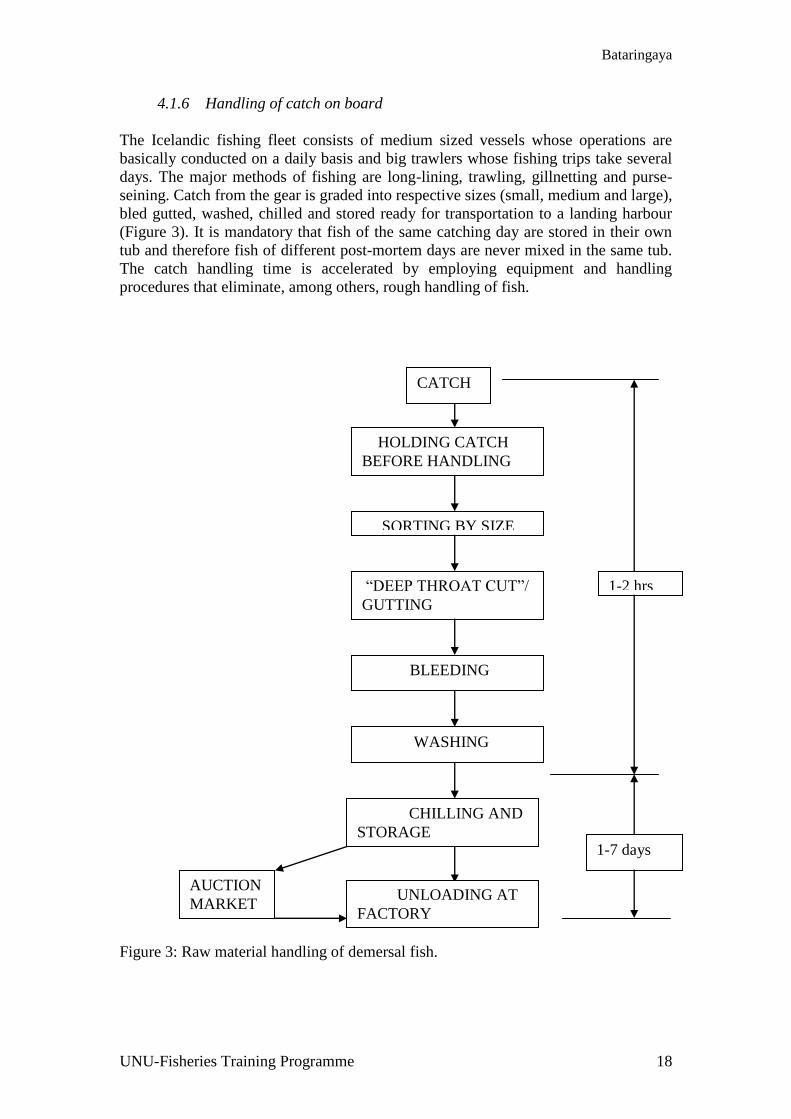
4.1.6 Handling of catch on board
The Icelandic fishing fleet consists of medium sized vessels whose operations are
basically conducted on a daily basis and big trawlers whose fishing trips take several
days. The major methods of fishing are long-lining, trawling, gillnetting and purse-
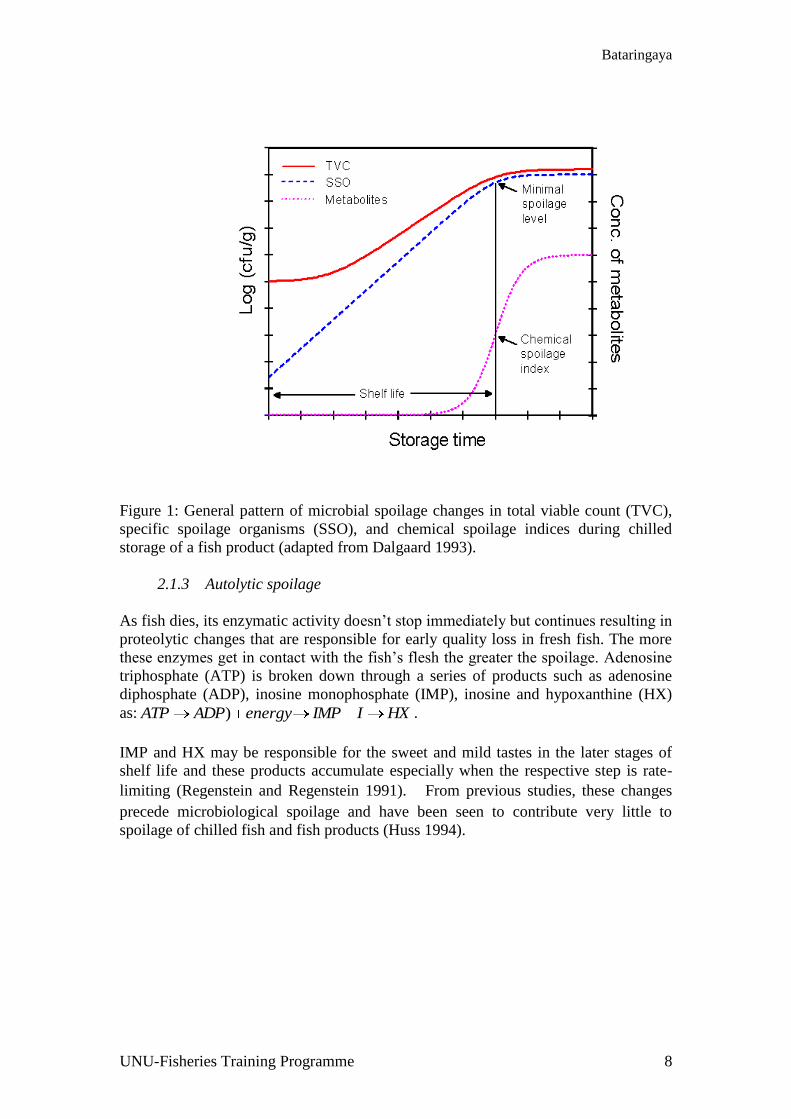
seining. Catch from the gear is graded into respective sizes (small, medium and large),
bled gutted, washed, chilled and stored ready for transportation to a landing harbour
(Figure 3). It is mandatory that fish of the same catching day are stored in their own
tub and therefore fish of different post-mortem days are never mixed in the same tub.
The catch handling time is accelerated by employing equipment and handling
procedures that eliminate, among others, rough handling of fish.
Figure 3: Raw material handling of demersal fish.
CATCH
HOLDING CATCH
BEFORE HANDLING
SORTING BY SIZE
“DEEP THROAT CUT”/
GUTTING
BLEEDING
WASHING
CHILLING AND
STORAGE
1-2 hrs
1-7 days
AUCTION
MARKET UNLOADING AT
FACTORY
Bataringaya
UNU-Fisheries Training Programme 19
4.1.6.1 Bleeding
In an effort to obtain optimal white fillets, (generally higher in value, white-fleshed
fish species) fish is bled by cutting the arteries just behind the gills and in front of the
heart. Bleeding is normally done when the fish is still alive in order to yield quality
white fillets. Therefore, the time between deaths and bleeding is vital. Some
fishermen make a “deep cut”, gut and then bleed the fish for 12-20 minutes, while
others first bleed for the same period and then gut the fish. This seems to complicate
the work and delay the chilling process. Red fish, pelagic fish and many flatfishes are
commonly not bled or gutted at sea.
However, previous studies have questioned the necessity of handling the fish in a two-
step procedure involving a special bleeding period. These studies have shown that the
time elapsed between deaths and bleeding is more vital for the overall quality than the
bleeding method (Valdimarsson et al. 1987 and Botta et al. 1986). Efficient removal
of blood was found to be dependent on muscle contraction, gravity and vasodilatation
in peripheral tissues of fish (Lambooij et al. 2004). Huss (1995) suggested blood to
drain more easily from muscle during the on set of rigor mortis since rigor would act
as “a sponge” and, in so doing physically squeeze blood out as the muscle contracts.
Contrary, other results showed that blood drain easily before the on set of rigor mortis
and recommended bleeding and gutting to be done at the same time in order to save
time, space and investments (Roth et al. 2005).
4.1.6.2 Gutting
Fish after feeding normally has a lot of viscera that contains various hydrolytic
(digestive) enzymes. Lean fish caught by large trawlers are usually gutted at sea
manually or by machines, the aim being to eliminate the potential contamination of
the edible flesh by the enzymes and also to prevent the inoculation of the flesh by
microbial populations found in the intestines. Gutting is done by cutting fish from
either the fish’s gill cleft to the anus or from the anus to the gills and then tearing
(“ripping”) out the viscera (guts), leaving no blood or viscera in the body cavity.
When un-gutted fish is mishandled, bile from the gallbladder may be released which
can cause a conspicuous discolouration referred to as “belly burn” that gives fish a
bitter flavour. The length of the belly cut is vital, and should be smooth and not
excessively long.
4.1.6.3 Chilling
Chilling reduces the activity and reaction rates of enzymes normally present in the gut
and tissues of fish and slows down the rate of microbial activity, though a population
of cold-tolerant bacteria can still thrive (Liston 1980). Ice keeps fish moist, has a large
cooling capacity, is safe, and is a portable cooling method that can be easily stored,
transported and used by distributing it uniformly around fish. Fish storage and chilling
are achieved through the use of plastic tubs with an average capacity of 300-400 kg
fish. Once fish is iced in the tubs, unloading fish from tubs only takes place in the
factory when taken for processing (in case of trawlers). This eliminates constant
handling of the fish that would result in fish bruises and exposure to risks of
contamination. Efficient cooling with ice depends on the weight of fish, species, fish
temperature, environmental temperature and the amount of ice.
Bataringaya
UNU-Fisheries Training Programme 20
4.1.7 Receiving, storage and quality assessment of fish at factory
Trawlers on arrival at the factory are unloaded from the fish tubs with a crane and
then carried by a fork-lift to the factory reception area. The removal of containers in
this way and refitting the trawler with clean iced containers allows a quick return of
the fishing vessel and also reduces the labour required for unloading. In the vessel, the
tubs are properly labelled for identification and grouped according to catch days. This
practice facilitates off-loading at the factory and subsequent grouping in the reception
area where the order of processing follows old-recent catch.
In assessing the quality of the raw materials, appropriate samples of fish tubs from
each post-mortem day are randomly picked and taken for organoleptic assessment.
Prior to this, the tub together with fish and ice is placed on a computerised pallet
where the weight is displayed on a small screen and manually entered into a
computer. Then the fish is removed from the tub and the following quality attributes
checked: ice on top, middle and bottom of the tub; outer cleanliness of the fish
(washing); degree of bleeding; gutting and cleanliness of viscera; weight of ice;
weight of fish and so on. Each attribute is given a quality grade and the assessed fish
is then put in the same tub and re-weighed to calculate the amount of ice that remains
on arrival at the factory:
).()( fishtubofweighticefishtubofweightremainingiceofmounta
The amount of ice that remains is recommended to be at least 18% of the weight of
the fish. It is worth noting that during evaluation of raw materials; emphasis is not
only put on how much ice remains but also how well it is distributed amongst the fish.
Loading more than 305 kg of fish in the tubs is discouraged so as to avoid mechanical
load (pressure) on the bottom fish. Thus, the attribute of the amount of fish in the tub
is given a grade one if the amount is not more than 305 kg. Results from assessment
are availed to the concerned trawler captain emphasising areas to be improved. As a
way of motivation, normally the trawler crew get a bonus based on the quality of their
fish.
4.1.8 Auction market
To speed up and shorten the time between catch and processing, most fishermen
especially those with trawlers, sell fish through computerised fish auctions and in
some cases fish is sold before it is landed, though buying fish that is not seen can be
difficult, as this requires information on the quality of fish (temperature and time from
catch) from a reliable supplier.
Fishing vessels that don’t land fish directly to fish processing plants land fish at a
harbour (with an auction market) where sales are done on the Internet. Fish on the
auction market is inspected together with the amount of ice that remains on landing.
Gutting is done on fish that is landed un-gutted and then reweighed. Fish is then
graded according to quality and catch days, iced in tubs and stored awaiting orders
from buyers. Information on the name of the harbour, fishing method, name of ship,
name of seller, landing date of catch and date re-weighed and general information on
the quality of the fish is availed on the auction market website. This information is
also vital for traceability. Each buyer has to be registered with the fish market and
with enough security on his/her account before an order can be placed. Once an order
Bataringaya
UNU-Fisheries Training Programme 21
is made, a card order (with the buyers address) is put on the respective tubs and then
transported by a transport company to the respective buyer. Payments are done on the
Internet within one week from reception of the ordered fish. The owner of the fish
market (middleman) receives a commission for the transactions made between the
seller (owner of fish) and the buyer.
SELLER AUCTION MARKET BUYER.
At fish markets, every fisherman (seller) strives to have good quality fish in the
auction market so as to maintain his image in the market.
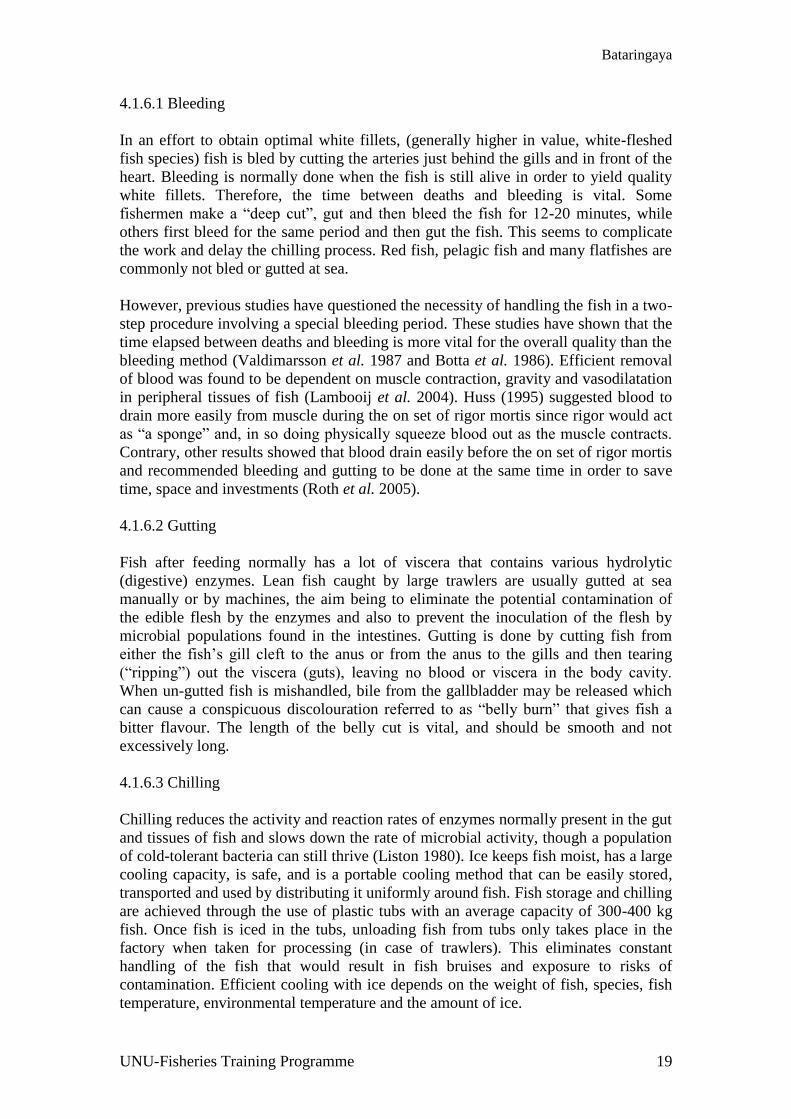
4.1.9 Effects of post-catch storage time on fish quality
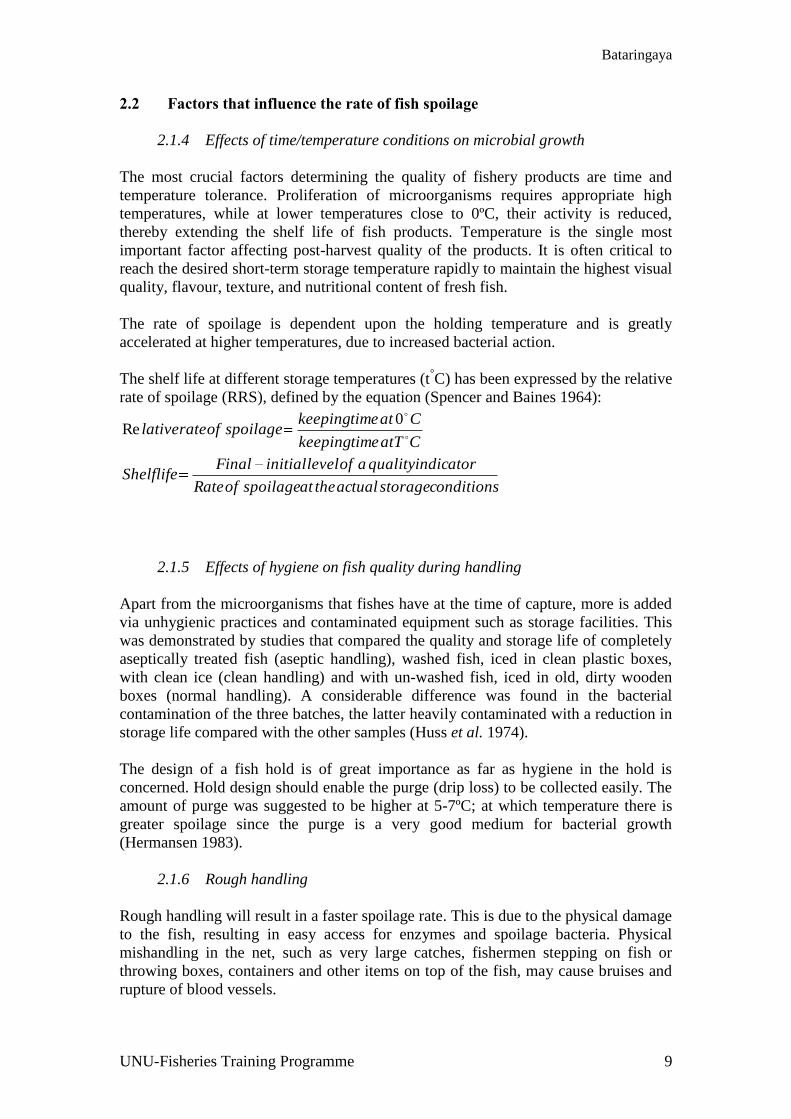
The sensory assessment results of whole cod and subsequently of fillets of different
post-catch days (PDs) are shown in Figure 4. The fish quality is reduced with
increased number of days from catch. The quality deterioration was greater between
PD 7 and 11 compared to the loss between PD 1 and 7 from both whole fish and fillet
organoleptic assessments. This is shown by the relatively small difference in sensory
scores from PD 1 to 7 after which the difference in quality between PD 7 and 11 was
greater.
0
2
4
6
8
10
12
14
16
18
0 2 4 6 8 10 12
Post-catch days
Qu
ality
in
dex
(QI)
....
..
Whole fish Fillets
Figure 4: Sensory quality of gutted cod of different post-catch days.
Bataringaya
UNU-Fisheries Training Programme 22
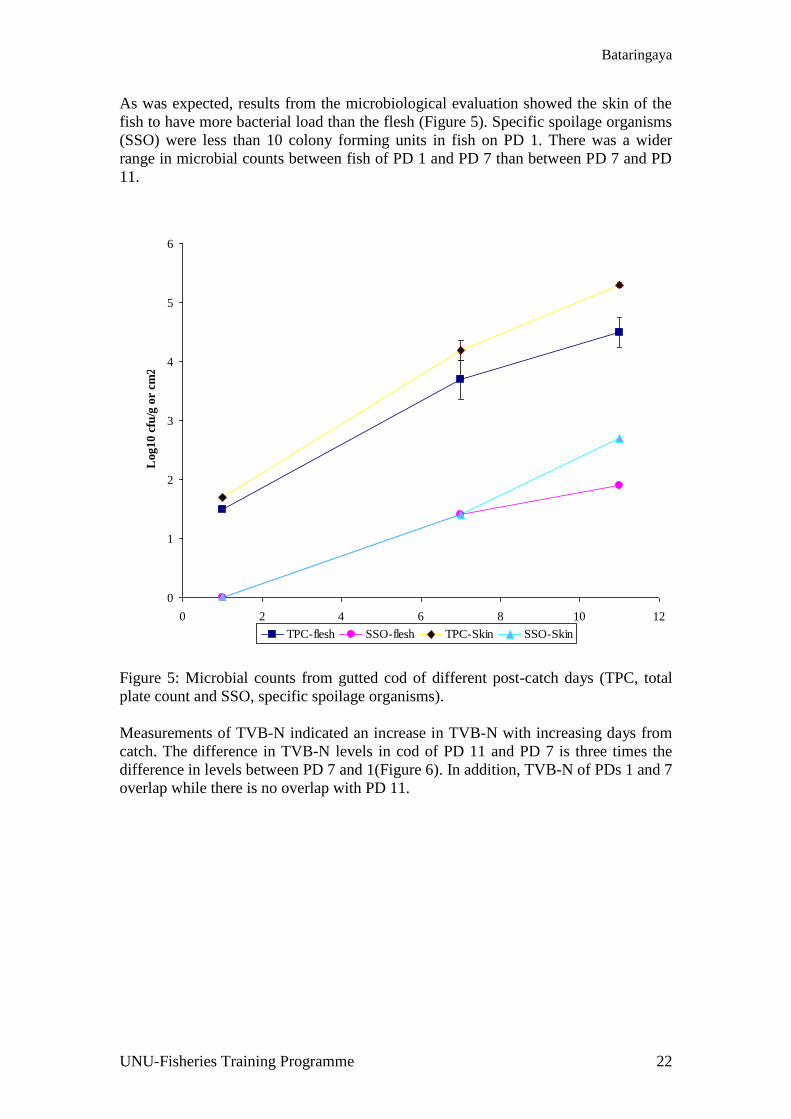
As was expected, results from the microbiological evaluation showed the skin of the
fish to have more bacterial load than the flesh (Figure 5). Specific spoilage organisms
(SSO) were less than 10 colony forming units in fish on PD 1. There was a wider
range in microbial counts between fish of PD 1 and PD 7 than between PD 7 and PD
11.
0
1
2
3
4
5
6
0 2 4 6 8 10 12
Post-catch days
Log10 c
fu/g
or
cm2......
TPC-flesh SSO-flesh TPC-Skin SSO-Skin
Figure 5: Microbial counts from gutted cod of different post-catch days (TPC, total
plate count and SSO, specific spoilage organisms).
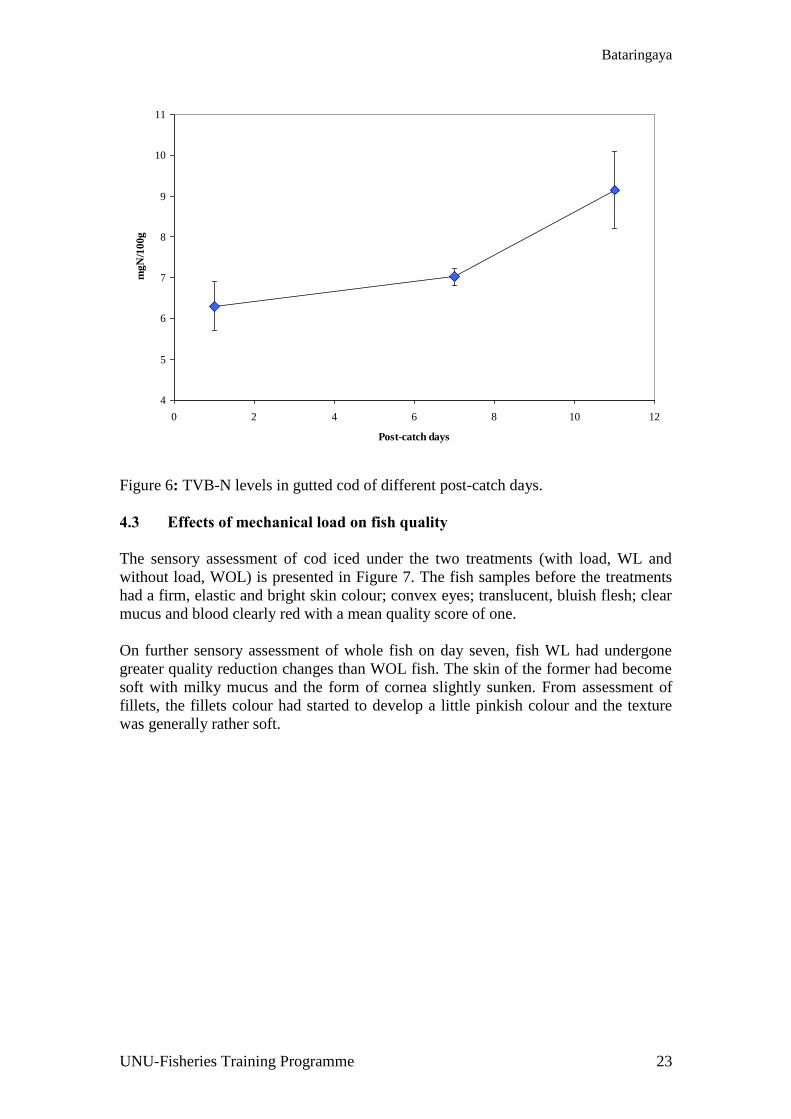
Measurements of TVB-N indicated an increase in TVB-N with increasing days from
catch. The difference in TVB-N levels in cod of PD 11 and PD 7 is three times the
difference in levels between PD 7 and 1(Figure 6). In addition, TVB-N of PDs 1 and 7
overlap while there is no overlap with PD 11.
Bataringaya
UNU-Fisheries Training Programme 23
4
5
6
7
8
9
10
11
0 2 4 6 8 10 12
Post-catch days
mgN
/100g...
Figure 6: TVB-N levels in gutted cod of different post-catch days.
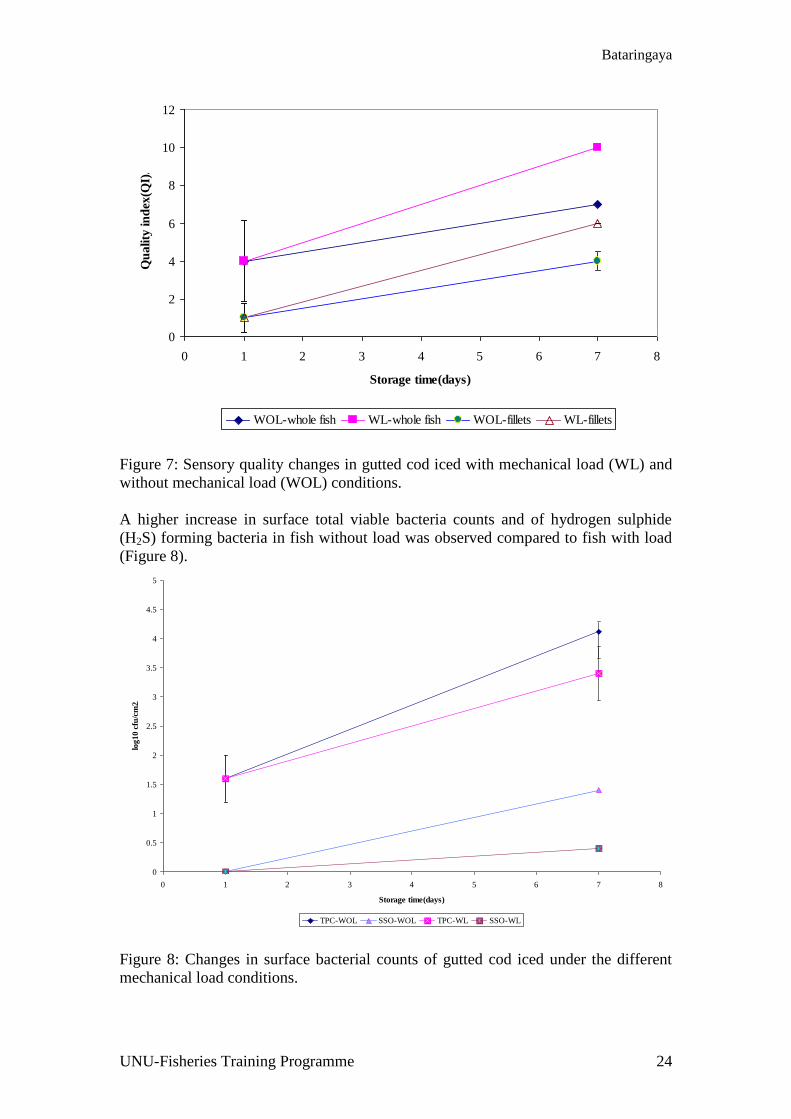
4.3 Effects of mechanical load on fish quality
The sensory assessment of cod iced under the two treatments (with load, WL and
without load, WOL) is presented in Figure 7. The fish samples before the treatments
had a firm, elastic and bright skin colour; convex eyes; translucent, bluish flesh; clear
mucus and blood clearly red with a mean quality score of one.
On further sensory assessment of whole fish on day seven, fish WL had undergone
greater quality reduction changes than WOL fish. The skin of the former had become
soft with milky mucus and the form of cornea slightly sunken. From assessment of
fillets, the fillets colour had started to develop a little pinkish colour and the texture
was generally rather soft.
Bataringaya
UNU-Fisheries Training Programme 24
0
2
4
6
8
10
12
0 1 2 3 4 5 6 7 8
Storage time(days)
Qu
ality
in
dex
(QI)
....
..
WOL-whole fish WL-whole fish WOL-fillets WL-fillets
Figure 7: Sensory quality changes in gutted cod iced with mechanical load (WL) and
without mechanical load (WOL) conditions.
A higher increase in surface total viable bacteria counts and of hydrogen sulphide
(H2S) forming bacteria in fish without load was observed compared to fish with load
(Figure 8).
0
0.5
1
1.5
2
2.5
3
3.5
4
4.5
5
0 1 2 3 4 5 6 7 8
Storage time(days)
log
10
cfu
/cm
2..
...
TPC-WOL SSO-WOL TPC-WL SSO-WL
Figure 8: Changes in surface bacterial counts of gutted cod iced under the different
mechanical load conditions.
Bataringaya
UNU-Fisheries Training Programme 25
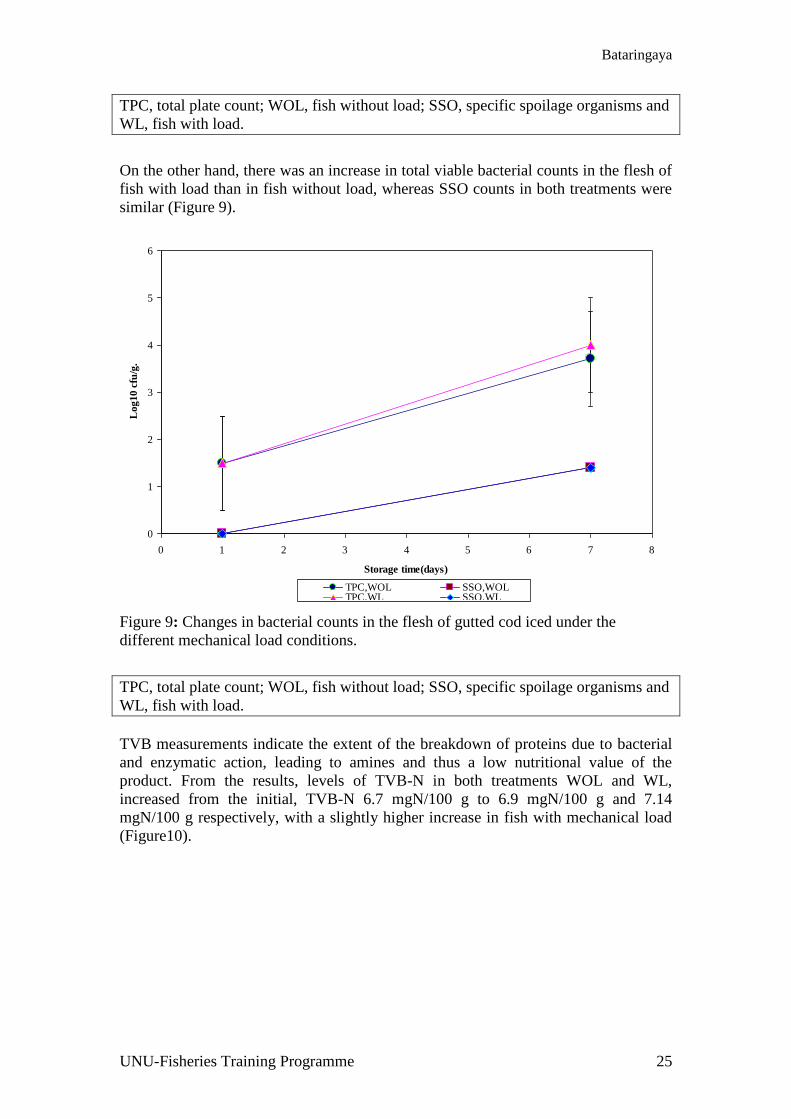
TPC, total plate count; WOL, fish without load; SSO, specific spoilage organisms and
WL, fish with load.
On the other hand, there was an increase in total viable bacterial counts in the flesh of
fish with load than in fish without load, whereas SSO counts in both treatments were
similar (Figure 9).
0
1
2
3
4
5
6
0 1 2 3 4 5 6 7 8
Storage time(days)
Log10 c
fu/g
.....
TPC,WOL SSO,WOLTPC,WL SSO,WL
Figure 9: Changes in bacterial counts in the flesh of gutted cod iced under the
different mechanical load conditions.
TPC, total plate count; WOL, fish without load; SSO, specific spoilage organisms and
WL, fish with load.
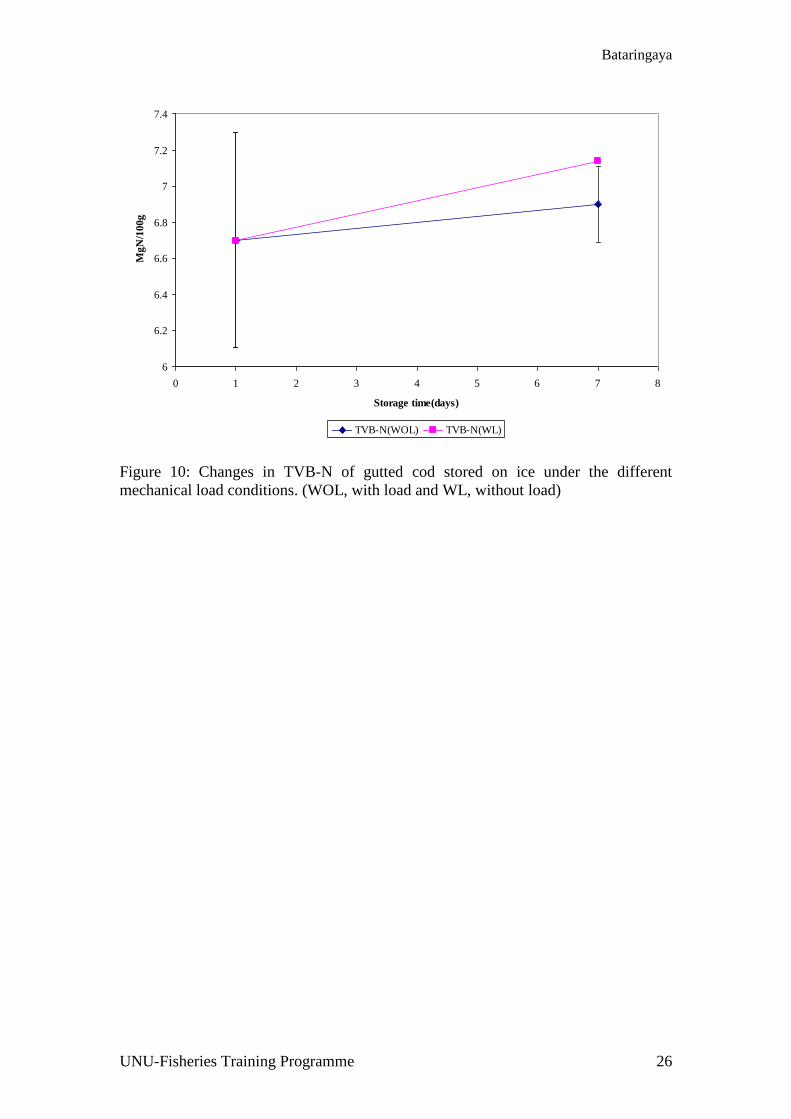
TVB measurements indicate the extent of the breakdown of proteins due to bacterial
and enzymatic action, leading to amines and thus a low nutritional value of the
product. From the results, levels of TVB-N in both treatments WOL and WL,
increased from the initial, TVB-N 6.7 mgN/100 g to 6.9 mgN/100 g and 7.14
mgN/100 g respectively, with a slightly higher increase in fish with mechanical load
(Figure10).
Bataringaya
UNU-Fisheries Training Programme 26
6
6.2
6.4
6.6
6.8
7
7.2
7.4
0 1 2 3 4 5 6 7 8
Storage time(days)
MgN
/100g...
TVB-N(WOL) TVB-N(WL)
Figure 10: Changes in TVB-N of gutted cod stored on ice under the different
mechanical load conditions. (WOL, with load and WL, without load)
Bataringaya
UNU-Fisheries Training Programme 27
5 DISCUSSION
Fish catch prior to processing in Uganda is generally characterised by fishing vessels
landing un-chilled fish at landing sites, delayed icing, un-efficient transfer of fish on
and from the loading container (ice boat), unhygienic icing in the fish holds and
constant handling of fish prior to processing. All these practices affect and reduce the
quality of fish, thereby accelerating spoilage and in the end resulting in short shelf life
of the fish products. Previous studies on Nile perch showed an increase in mesophilic
bacteria plate counts from 4 log10 cfu (colony forming units) when iced immediately
to 4.7 log10 cfu when icing was delayed for 3 or 6 hours, which was about 0.5 log
cycle increase (Muyonga 2004). In addition, the shelf life of Nile perch had an
estimated shelf life of 13 hours and 28 days when stored at ambient temperature
(25°C) and on ice respectively (Gram et al. 1989). In comparison to Iceland, the
handling practices employed right from the fishing vessels to the factory have been
shown to minimise fish quality deterioration, which is attributed to the immediate
icing of fish, gutting and bleeding, use of tubs of appropriate size, reduction in
number of times the fish is handled and general hygiene involved. Analyses of fish of
different post-catch days showed that storage time influences the quality of fish. From
the microbiological point of view, all the fish from the post-catch days had colony
forming units less than 5105 and therefore were of good quality (ICMSF 1986).
Results from sensory evaluation showed that the PD 11 fish had an estimated shelf
life of 2 and 6 days from whole fish and fillets respectively compared to the remaining
storage time of 4 days from previous studies (QIM-Euro fish 2001).
Results further indicated that properly iced cod loses its quality slowly in the first
week, after which the rate of spoilage increases as seen from sensory evaluation and
TVB-N results. The cause of quality loss in post-catch days (PDs) 1 and 7 was most
likely due to autolysis which was found to precede microbiological spoilage and
contributed very little to overall spoilage (Huss 1994). During these enzymatic
changes, ATP-related compounds are degraded resulting in intermediate compounds
such as inosine monophosphate (IMP) which is broadly accepted to be responsible for
loss of fresh fish flavour. The broken down compounds avail metabolites necessary
for bacterial growth (Huss 1995). This explains the higher increase in bacterial counts
between PDs 1 and 7. The wider difference in bacterial counts between PD 1 and 7
and PD 7and 11 can probably be explained in respect to bacterial growth in response
to changes in the environment, where on PD 1 (counts were less than 10 and therefore
estimated), the bacteria were in the lag phase and therefore not growing faster
whereas on PD 7 they had acclimatised to the environment and were therefore in the
exponential phase. Between PDs 7 and 11, the bacteria were probably approaching the
stationary phase. From the mechanical load experiment, mechanical load seems to
accelerate entry of microorganisms from the surface of the fish into the flesh, leading
to a reduction in microbial counts on the skin surface and an increase in microbial
counts in the flesh as shown by the higher bacterial counts on the skin of WOL-fish
compared to WL-fish and vice versa in the flesh. It is likely that the high pressure
bruises the fish thereby allowing bacteria from the skin surface into the flesh.
However, the higher surface bacterial counts on the skin of WOL fish might suggest
that the spoilage bacteria were aerobic and therefore flourished since the tubs were not
closed during the experiment. The same compactness probably explains the higher
sensory quality loss in WL fish.
Bataringaya
UNU-Fisheries Training Programme 28
6 CONCLUSIONS
It can be concluded that the results of post-catch analysis revealed that good handling
practices employed from sea to the factory are important. If the best quality fish
products are to be realised in cod, fish should be processed within a week from the
catch-day.
Based on my own experience and results from the study, it can be concluded that the
major cause of fish spoilage in Uganda is bacterial growth which is accelerated by
delayed icing and un-hygienic handling. Therefore, in order to maintain the shelf life
of Nile perch up to the market demands, the fish should be iced within the first 6
hours from catch.
From the results of mechanical load, it can be said that its effects on fish quality are
less significant provided that fish is properly and sufficiently iced. However, more
work is required to investigate this in more detail, by comparing the quality of fish
from the bottom, middle and top layers of un-gutted fish in a fully filled fish hold
(Uganda’s situation). It is important to draw recommendations and guidelines for fish
handling in Uganda based on the study results as outlined in the next section.
Bataringaya
UNU-Fisheries Training Programme 29
7 RECOMMENDATIONS/GUIDELINES FOR IMPROVING FISH
HANDLING IN UGANDA
Production of high quality fishery products requires that each stakeholder in the
production chain participate responsibly including the fishermen, factory suppliers,
processors, distributors and resource managers. These recommendations (guidelines)
are drawn from the study results and are intended to encourage fishermen, suppliers
and processors in producing high quality fish products that can sustain Uganda’s
foreign fish markets.
Fishing boat on lake
After nets are hauled, fish should be immediately removed from the nets.
Prolonged time in nets leaves marks on the skin and hence affects its
physical quality attributes.
Fish should not be thrown around as this practice can damage the fish.
Efforts should be made to avail ice to fishing communities where the
potential to access ice prevails, especially landing sites on the mainland
where electricity is available. In such cases, fish should be chilled rapidly
after they are caught to preserve their fresh flavour by slowing down the
rate of chemical and bacterial spoilage.
Landing site, container and truck
Fish should not be put on the ground or floors of factories. This practice is
unhygienic and can lead to fish spoilage through contamination. This is
critical since most landing sites lack sanitary and handling facilities.
Fish display tables must be smooth and kept clean.
Since the fish is landed by fishing boats un-iced, once landed they should
be immediately weighed and chilled as quickly as possible so as to reduce
the temperature (0оC-4
оC), thereby slowing down the rate of bacterial
spoilage.
Violent throwing and dropping from a considerable height should be
avoided. Care should be taken to prevent damage to the fish. Any bruises,
abrasions or cuts spoil the appearance, reduce yield of edible flesh and
accelerate spoilage. As a rule, the more bruises or cuts on fish, the more
spoilage spreads.
Fish holds of insulated containers should not be left unprotected from
direct radiation from the sun and wind as the ice melts quickly. Therefore
fish containers should not be left uncovered for long during icing.
Fish should be properly iced. Ice should not be used as “cosmetic (or
additive) to make fish happy and fool buyers”. Rather, ice should be used
to chill fish as soon as possible after landing and keep it chilled afterwards
until it is processed. “It is better to throw out ice than fish at the landing
site or factory”. An ice to fish ratio of 1:1 and 1:2 is recommended for
tropical and temperate areas respectively, though the amount eventually
would depend on experience. Begin with a layer of ice at the bottom,
followed by a layer of fish that alternates with a layer of ice until the hold
is appropriately filled, ending with a layer of ice on top. Make sure to fill
all spaces between fish with ice.
Bataringaya
UNU-Fisheries Training Programme 30
To reduce rough fish handling and crushing due to large sizes of fish holds
in the insulated containers, the fisheries department, in collaboration with
processing plants, needs to develop an appropriate design and regulation
for insulated containers if the rough handling and unhygienic practices
involved in container operations are to be improved. The design should at
least allow fish to be loaded, iced and the container unloaded without the
fish being trampled in the fish hold.
Temperature recorders should be fitted at appropriate points in the truck so
that temperature can be monitored throughout the trip. This provides the
factory with the previous storage conditions of fish in the truck.
Cleanliness is an important part of good handling. Much of the care
exercised in chilling can be wasted if the container or box is un-clean, or if
dirty ice is used. Fish chilled in dirty ice spoil faster than fish chilled in
clean ice. After off-loading fish at the next landing site or factory, the
container should be cleaned with suitable detergent and disinfectant to
avoid contaminating ice and fish during the next route.
Container and truck surfaces should be robust, impervious and easily
cleanable. Wood is discouraged as contact surface with fish (food in
general) because it is very difficult to clean and can cause the occurrence
of “stinkers”. Smooth metal alloy or plastic are the recommended materials
of choice.
Water used in washing fish, equipment, fish hold and any other fish
contact surface should be clean or portable water. For landing sites in
islands where portable water is not available, fish once caught should be
properly handled and never in contact with landing site water whose
quality is doubted. Alternatively, deep offshore water can be used to clean
equipment and the fish hold.
Processors need to encourage fish suppliers to start a plan of separating
fish of different catch days and quality levels so that the government can
also enact appropriate laws and guidelines. This would be advantageous to
the factories in assisting them in fish inspection and grading.
Processing plant
The factory should ensure that it keeps a list of reliable suppliers who can
be judged from their constant supplies and the level of fish quality from
well conducted sensory evaluation. Suppliers who always have many
rejects should be discouraged or abandoned. This encourages the others to
improve their fish handling practices. In addition, good quality fish should
be given attractive prices to keep fishermen and suppliers motivated and
strive to handle fish with care.
Fish in the factory reception should not be allowed to heat up. The fish
should be kept close to 0ºC in ice at an ambient temperature of 0-4ºC,
which should be continuously recorded by temperature loggers fitted in
strategic positions and monitored through observation by the quality
manager. In addition, the doors of the reception area and all other cold
rooms should not be left open for long periods of time as this allows hot
air from the outside to come in. In case the temperature runs out of control,
the raw materials should be re-inspected, sorted and low quality ones
rejected for other uses such as fishmeal production.
Bataringaya
UNU-Fisheries Training Programme 31
ACKNOWLEDGEMENTS
I would like to extend my heartfelt appreciation to the UNU-Fisheries Training
Programme Director, Dr. Tumi Tomasson, for having admitted me to the programme
and his endless efforts and support up to the end of the course. In a similar manner, I
would like to thank the Deputy Programme Director, Mr. Thor Asgeirsson, for his
guidance throughout the programme.
I would further like to thank my supervisor, Professor Hjorleifur Einarsson for the
technical guidance and supervision towards my research project. Also the following
are recognised: Arnheidur Eythorsdottir for her assistance during my project data
collection and laboratory work, Mr.Gudni Eiriksson and Sigridur Ingvarsdottir for
editing the project.
Finally, thanks to my wife, Fausta, for her perseverance and family care during my
stay in Iceland.
Bataringaya
UNU-Fisheries Training Programme 32
LIST OF REFERENCES
Bonilla, A.C.,Sveinsdottir,K. and Martinsdottir,E.2007. Development of Quality
Index Method(QIM) scheme for fresh Cod(Gadus morhua) fillets and application in
shelf-life study. Food Control 18(2007)352-358.
Botta, J.R., B.E.Squires and J.Johnson.1986. Effect of bleeding/gutting procedures on
the sensory quality of fresh Atlantic Cod. Canadian Institute of Food Science and
Technology 19(1986) 186-190.
Dalgaard, P.1993. Evaluation and prediction of microbiological fish spoilage. PhD
thesis, Royal Veterinary and Agricultural University, Copenhagen. In: J.H.J.Huis int’t
Veld.1996.International Journal of Food Microbiology, 33(1996) 1-18.
Dalgaard.P.1995. Qualitative and quantitative characterization of spoilage bacteria
from packed fish. International Journal of Food Microbiology 26(1995) 319-333.
EC No.852/2004.(2004). Regulation(EC)No852/2004 of the European Parliament and
of the Council on the hygiene of food stuffs. Official Journal of the European Union
L 139 of 30 April 2004.
FAO (Food Agricultural Organisation). Quality and changes in fresh fish.
http://www.fao.org/docrep/V7180E/V7180e09.htm
FAO. FAO Year Book of Fishery Statistics.www.fao.org/figis/servlet/static?
dom=collection&xml=global-capture-production.xml. Visited on 8th
January 2007.
Gram L., Oundo J. and Bon J.1989. Storage life of Nile perch (Lates niloticus) in
relation to temperature and initial bacteria load. Tropical science, 29,221-236.
Gram and Huss H.H.1996. Microbiological spoilage of fish and fish products.
International Journal of Food Microbiology 33(1996) 121-137.
Hayes,P.R 1985. Food Microbiology and hygiene.Elsevier,London,pp 80-139.
Herbert,R.A and Shewan,J.M.1975. Precursors of volatile sulphides in spoiling North
Sea Cod(Gadus morhua).Journal of Science Food and Agriculture,26,1195-1202.
Hermansen1983.In: Regenstein C.E and Regenstein M.J 1991. Introduction to fish
technology. Page 64. Published by Van Nostrand Reinhold, New York.
Huis in,t Veld.1996. Microbial and biochemical spoilage of foods: an overview.
International Journal of Food Microbiology,33(1996)1-18.Elsevier Science B.V.
Huss,H.H.,Dalgaard,D.,Hansen,L.,Ladefoged,H.,Pedersen,A., and Zittan,L.1974. The
influence in catch handling on the storage life of iced cod and plaice. Journal of Food
Technology.9, 213-221.
Huss H.H. 1994. Quality and quality changes in fresh fish. FAO Fisheries Technical
Paper (348).
Bataringaya
UNU-Fisheries Training Programme 33
Huss, H.H. (editor) 1995. Quality and Quality Changes in Fresh Fish. FAO Fisheries
technical paper 348, FAO Rome, Italy.
International Commission on Microbiological Specifications for Foods
(ICMSF).1986. Sampling plan and recommended microbiological limits for Seafood.
At: www.fao.org/docrep/X5624E/x5624e08.htm
Lambooij,E.,Kloosterboer R.J,Gerritzen.M.A and J.V Vande vis.2004. Head-only
electrical stunning and bleeding of African cat fish(Clarias gariepinus) assessment of
loss of consciousness. Animal Welfare 13(2004) 71-76.
Larsen,E.,Heldbo,J.,Jerspersen,C.M., and Nielson,J.1992. Development of a method
for quality assessment of fish for human consumption based on sensory evaluation. In:
H.H.Huss.,M, Jakobsen and J. Liston (editors).Quality assurance of in the fish
industry (pp.351-358), Amsterdam: Elsevier science publishing.
Liston, J.1980. Microbiology in fishery science. In: J. J. Connell (editor),Advances in
Fishery Science and Technology. Fishing News Books, Farnham,England,pp.138-
157.
Muyonga J.H. 2004. Effect of pre-icing duration on quality deterioration of iced Nile
perch (Lates niloticus). Department of Food Science &Technology, Makerere
University, Uganda.
QIM Euro fish, 2001. Sensory Evaluation of Fish Freshness. Published by QIM
Eurofish, 2001.
Regenstein M.J and C.E Regenstein. 1991. Introduction to Fish Technology.
Published by Van Nostrand Reinhold, New York.
Roth,B.,Torrissen,O.J and Slinde E.2005.The effect of slaughtering procedures on
blood spotting in rainbow trout(Oncorhynchus mykiss) and Atlantic Salmon(Salmo
salar).Aquaculture 250(2005) pp796-803,Issues 3-4,30th
Dec.2005.
Spencer R.and Baines C, R.1964.The effect of temperatures on the spoilage of wet
fish 1.storage at constant temperature between-1C and 25C.Food Technology
campaign 18,769-772.
Valdimarsson, G., A, Mathiasson and G, Stefansson.1987. Bleeding and gutting of
Cod (Gadus morhua) Can. Fish.Aquat.Sci.5325 (1987) 13pp.
Bataringaya
UNU-Fisheries Training Programme 34
APPENDICES
Appendix 1: Sensory assessment sheet for whole Cod (QIM).
Sensory evaluation score sheet for whole Cod fish.
Quality parameter Description Score
Sample code
1 2 3 4 5
Skin Bright, iridescent pigmentation 0
Rather dull, becoming
discoloured 1
Dull 2
Stiffness In rigor 0
Firm, elastic 1
Soft 2
Very soft 3
Eyes Cornea Clear 0
Opalescent 1
Milky 2
Form Convex 0
Slightly sunken 1
Sunken, concave 2
Pupil Black 0
Opaque 1
Grey 2
Gills Colour Bright 0
Less coloured, becoming
discoloured 1
Discoloured, brown spots 2
Brown, discoloured 3
Odour Fresh, sea weedy, metallic 0
Neutral, grassy, musty(mouldy) 1
Yeast, bread, beer, sour, milk 2
Acetic acid, sulphuric acid, very
sour 3
Mucus Clear 0
Milky 1
Milky, dark, opaque 2
Flesh,
fillets Colour Translucent, bluish 0
Waxy, milky 1
Opaque, yellow, brown spots 2
Blood colour Red 0
Dark red 1
Brown 2
Quality index(0-23) sum:
Bataringaya
UNU-Fisheries Training Programme 35
Appendix 2: Sensory assessment guide for Cod fillets (QIM).
Sensory evaluation of Cod Fillets
Samples
Quality parameter Description Score 1 2 3 4 5
Skin Brightness Iridescent pigmentation 0
Rather dull 1
Dull 2
Slime Uniform, thin transparent 0
Little thicker, opaque 1
Clotted, thick, yellowish 2
Flesh Texture Firm 0
Rather soft 1
Very soft 2
Blood Bright red, not present 0
Dull red 1
Shadowy, brown 2
Odour fresh, neutral 0
Sea weedy, marine, grass 1
Sour milk 2
Acetic, ammonia 3
Colour White, greyish 0
Some yellowish, a little pinkish 1
Yellow, overall pink 2
Bright Translucent, bluish 0
Opaque 1
Milky 2
Gaping No gaping, one longitudinal along neck part 0
Slight gaping<25% of the fillet 1
Slight gaping 50-75% of the fillet 2
Deep gaping over 75% of the fillet 3
Quality index(0-18) sum: