Embed Size (px)
Citation preview

DNA 5354F
ANALYSIS OF RADIATION EXPOSURE FOR TROOP OBSERVERS Exercise Desert Rock VI, Operation Teapot
Science Applications, Inc.
P.O. Box 1303
McLean, Virginia 22102
15 July 1980
Final Report for Period 1 March 1980-15 July 1980
CONTRACT No. DNA 001-80-C-0052
APPROVED FOR PUBLIC RELEASE; DISTRIBUTION UNLIMITED. I
THIS WORK SPONSORED BY THE DEFENSE NUCLEAR AGENCY UNDER RDT&E RMSS CODE 8325080454 V99QAXNA10003 H2590D.
Prepared for
Director
DEFENSE NUCLEAR AGENCY
Washington, D. C. 20305

Destroy this report when it is no longer needed. Do not return to sender.
PLEASE NOTIFY THE DEFENSE NUCLEAR AGENCY, ATTN: STTI, WASHINGTON, D.C. 20305, IF YOUR ADDRESS IS INCORRECT, IF YOU WISH TO BE DELETED FROM THE DISTRIBUTION LIST, OR IF THE ADDRESSEE IS NO LONGER EMPLOYED BY YOUR ORGANIZATION.

UNCLASSIFIED SECui?lt~ CLASSIFICATION OF THIS PAGE p&n Dam Lnterod)
! REPORTDOCUMENTATION PAGE READ INSTRUCTIONS BEFORE COMPLETING FORM
1 REPORT NUMBER 2. GOVT ACCESSION NO. 3 RECIPIENT’S CATALOG NUMBER
DNA 5354F I 1 TITLE (ad Subf/tle)
ANALYSIS OF RADIATION EXPOSURE FOR TROOP OBSERVERS Exercise Desert Rock VI, Operation Teapot
5 TYPE OF REPORT 5 PERIOD COVERED
7. AUTHOR(a)
J. Goetz D. Kaul J. Klemm
J. McGahan R. Weitz
6 CONTRACT OR GRANT NUMBER(a)
DNA 001-80-C-0052
I 9. PERFORMING ORGANIZATION NAME AND ADDRESS 10. PROGRAM ELEMENT, PROJECT, TASK AREA b WORK UNIT NUMISERS
Science Applications, Inc. P.O. Box 1303 McLean, Virginia 22102
Subtask V99QAXNA100-03
1 11. CONTROLLING OFFICE NAME AND ADDRESS
Director Defense Nuclear Agency Washington, D.C. 20305
12 REPORT DATE
15 July 1980 13. NUMBER OF PAGES
98 14 MONITORING AGENCY NAME a ADDRESS(If dlffmrmnl from CatrolItn6 OtNc.) IS SECURITY CLASS. (of tide tossor?)
UNCLASSIFIED 15a DECLASSlFICATION/DOWNGRADING
SCHEDULE
N/A 1 IO. DISTRIBUTION STATEMENT (of fhle Rmpor:)
Approved for public release; distribution unlimited.
\ 17 DISTRIBUTION STATEMENT (of th. abstract .nrermd In BJock 20. ff dlffarml from Report)
I IS SUPPLEMENTARY NOTES
This work sponsored by the Defense Nuclear Agency under RDT&E RMSS Code B325080464 V99QAXNA10003 H2590D.
1
a
-
9. KEY WORDS (Contlnu. on rev.,.. l ldm if n.c...y md Idmftfy by block numb.rl
Teapot Radiation Exposure Desert Rock VI Automated Dose Reconstruction Volunteer Observers Troop Observers
10. ABSTRACT (Continua m r.“.,.. aId, ff “.c...uy md ldmtffy by block mrm5.r)
The radiation doses to troop observers and volunteer observers for Exercise Desert Rock VI are reconstructed for each applicable shot of Operation Teapot (1955). Initial neutron and gamma radiation doses are determined from trans- port codes ATR4 and ATR4.1. Residual radiation contours and decay rates are established through a new automated procedure that utilizes raw data in regression analysis to fit space-time models. Troop operations data are combined with the radiological data to determine integrated dose. Uncertain- ties are calculated for each parameter. The volunteers received the highest
DD 1 ::?I3 1473 EDITION OF 1 NOV 55 IS OBSOLCTE _ S/N 010%LF-0146601 “ll”LnJJLl +LY
SECURITY CLASSIFICATION OF TMIS PAGE mm Data Ent-.d.l

UNCLASSIFIED SECURITY CLASSIFICATION OF THIS PAGE flb’hul Dar* I%t~rd)
20. ABSTRACT (Continued)
observer dose--l.6 rem gamma and 4.5 rem neutron. The highest dose received by troop observers was 1.4 rem gamma and 1.4 rem neutron at Shot Tesla.
UNCLASSIFIED
SECURITY CLASSIFICATION OF tl4lS PAOEFM Dmfa Bntmmd)

DEFENSENUCLEAR AGENCY WASHINGTON, D.C 20305
1 SEP 1982 NATD
SUBJECT : DNA Report, “Analysis of Radiation Exposure for Troop Observers, Exercise Desert Rock VI, Operation Teapot”
SEE DISTRIBUTION
1. The Defense Nuclear Agency, as the Department of Defense (DoD) executive agency for matters relating to low-level ionizing radiation, is conducting an extensive review of radia- tion exposures to military personnel who have participated in the United States nuclear weapons development programs. This program, termed the Nuclear Test Personnel Review (NTPR), began in 1977 in response to concern over possible health risks as a result of very low level radiation exposures. A major objective of the NTPR is the assessment of radiation exposure for partici- pating troops.
2. Accurate radiation exposure data for individuals and units are essential to fulfill the objectives of the NTPR program. Because film badge data are not always available (some badges were lost or unreadable, some records are no longer available, not all personnel were badged for a given shot, etc.) DNA has developed procedures for reconstructing, with confidence, both external and internal exposures for DOD test participants.
3. The enclosed report by Science Applications Inc., written under contract to DNA, provides estimates of the radiation doses that would have been possible for troop observers on Operation Teapot (1955). These dose reconstructions are based upon: (1) Patterns of residual activity measured, documented and published shortly after the tests, (2) Extensive calculation and analysis of prompt radiation doses, (3) The documented movement histories, including arrival and departure times for each unit which opera- ted in the vicinity of the tests, and (4) Current dose calcula- tion methodologies.

NATD Subject: DNA Report, "Analysis of Radiation Exposure for
Troop Observers, Exercise Desert Rock VI, Operation Teapot"
4. DNA believes this report accurately represents a conserva- tive approach to dose estimation, and that the estimations are reasonable and appropriate.
FOR THE DIRECTOR:
1 Enclosure as
Y lonel, USA
Director for Biomedical Effects
DISTRIBUTION (See Page 3)

TABLE OF CONTENTS
Section
List of Illustrations .............................................
List of Tables .................................................
INTRODUCTION AND SUMMARY ...............................
OPERATIONS .................................................
2.1 Shot Data ................................................ 2.2 Participation .............................................. 2.3 Concept .................................................. 2.4 Activities ................................................
INITIAL RADIATION ...........................................
3.1 Computational Method .................................... 3.2 Results ..................................................
RESIDUAL RADIATION ........................................
4.1 Residual Gamma Radiation Exposure ......................... 4.2 Internal Radiation Exposure ................................ 4.3 Residual Radiation Dose Summary ...........................
UNCERTAINTY ANALYSIS AND TOTAL DOSE DETERMINATION ......
5.1 Uncertainties in Initial Radiation Dose ........................ 5.2 Uncertainties in Residual Radiation Dose ....................... 5.3 Total Mean Dose Summary ...................................
CONCLUSIONS .................................................
REFERENCES ..................................................
APPENDIX: AUTOMATED PROCEDURE FOR EXTERNAL RESIDUAL GAMMA DOSE RECONSTRUCTION . . . . . . . . . . . . . . . . . . . . . . . . . .
Page 2
4
5
9
9 9
11 14
33
33 38
53
53 65 65
67
67 70 73
77
79
81

LIST OF ILLUSTRATIONS
Figure
l-1
2-1
2-2
2-3
2-4
2-5
2-6
2-7
2-8
2-9
2-10
3-l
3-2
3-3
3-4
3-5
3-6
3-7
3-8
3-9
4-1
4-2
4-3
4-4
Operation Teapot Shot Locations ................................. 7
Shot Wasp Area ............................................... 16
Shot Moth Area ............................................... 18
Shot Tesla Area ............................................... 19
Shot Turk Area ............................................... 21
Shot Bee Area ................................................ 23
Observers at Shot Ess .......................................... 25
Shot Ess Area ................................................. 26
Shot Apple I Area .............................................. 27
Shot MET Area ................................................ 29
Shot Apple II Area ............................................. 31
Shot Moth Neutron Dose ....................................... 40
Shot Moth Gamma Dose ........................................ 41
Shot Tesla Neutron Dose ........................................ 42
Shot Tesla Gamma Dose ........................................ 44
Shot Turk Gamma Dose ........................................ 45
Shot Bee Neutron Dose ........................................ 47
Shot Bee Gamma Dose ........................................ 48
Shot Apple I Gamma Dose ...................................... 50
Shot Apple II Gamma Dose ..................................... 51
Shot Moth Residual Radiation and Observer Position ............... 55
Shot Tesla Residual Radiation and Observer Routes ................. 56
Shot Turk Residual Radiation and Observer Routes (D+l) - l . l - - - - - - - l 57
Shot Bee Residual Radiation and Observer Routes .................. 59

Figure
4-5
4-6
4-7
4-8
4-9
A-i
LIST OF ILLUSTRATIONS (Continued)
Shot Ess Residual Radiation, Shot Turk Residual Radiation, and Observer Position . . . . . . . . . . . . . . . . . . . . . . . . . . . . . . . . . 60
Shot Apple I Residual Radiation and Observer Routes . . . . . . . . . . . . . . . . 61
Shot MET Residual Radiation and Observer Position . . . . . . . . . . . . . . . . . 62
Shot Apple II Residual Radiation and Observer Routes ............... 63
Composite Plot of Residual Radiation, Yucca Flat .................. 64
Sample Computer Printout of Dose Determination Procedure . . . . . . . . . 86
3

LIST OF TABLES
Table
2-l Teapot Shot Data . . . . . . . . . . . . . . . . . . . . . . . . . . . . . . . . . . . . . . . . . . . . 10
2-2 Observer Program Participation, Exercise Desert Rock VI, Operation Teapot . . . . . . . . . . . . . . . . . . . . . . . . . . . . . . . . . . . . . . . . . . . . 12
2-3 Observer-Ground 2 ero Distance Summary, Exercise Desert Rock VI . . . . . . . . . . . . . . . . . . . . . . . . . . . . . . ..*............. 15
3-l Initial Radiation Dose, Shot Apple II . . . . . . . . . . . . . . . . . . . . . . . . . . . 52
5-l Observer Dose Summary . . . . . . . . . . . . . . . . . . . . . . . . . . . . . . . . . . . . . . 74

Section 1
INTRODUCTION AND SUMMARY
This is the third in a series of reports concerned with radiation dose
reconstruction for military participants in the atmospheric nuclear weapons
testing program. The first two reports were based on the exercises conducted in
conjunction with Shot Smoky in Operation Plumbbob in 1957. This report is the
first of several pertaining to military participation in Operation Teapot.
There were four types of military participation in Exercise Desert Rock VI,
conducted at Nevada Test Site in conjunction with Operation Teapot in
winter/spring 1955. The first type of participation consisted of troop observers,
that is, military personnel who were sent to the test site for the specific purpose
of witnessing one or more nuclear shots and who returned to their home stations
immediately after this “indoctrination.” This is the military participation
addressed in this report.
The second type of military participation consisted of battalion-size
maneuver units that moved to the site to engage in tactical exercises that tested
doctrine and techniques being developed for the nuclear battlefield. The two
such exercises conducted during Operation Teapot were the Marine Brigade
Exercise at Shot Bee, and the Armored Task Force (TF RAZOR) maneuver at
Shot Apple II. These two exercises, and the radiation exposure associated
therewith, will be the subject of separate reports.
The third type of military participation centered around service equipment
tests and operational training associated with nuclear warfare. There were
several projects engaged in these activities, for which the radiation exposure will
be treated separately.
Finally, there were the personnel who were assigned to Camp Desert Rock,
usually for the duration of the exercise, who planned, supported, and admin-
istered the overall exercise in order that the other participants mentioned above
5

could concentrate their efforts on their particular missions. These activities and
the associated radiation exposures will also be analyzed subsequently.
It should also be emphasized that a fifth type of major military participa-
tion, not a part of the four Exercise Desert Rock groups mentioned above,
consisted of the Weapons Effects Test Group from Field Command, Armed
Forces Special Weapons Project. This group measured, analyzed, and docu-
mented the effects of nuclear weapons for the Department of Defense. Their
exposures are to be analyzed only if film badge dosimetry is incomplete or
inconclusive.
The thrust of this report centers around the external radiation dose to
observers during the course of their activities in contaminated areas of Nevada
Test Site. Of the fourteen nuclear shots (Figure l-1) of the Teapot series,
Desert Rock observers participated in nine. The observer program is described
in general, and the observer activities for each of the nine shots are traced from
the pre-shot orientation through the shot activities to the post-shot equipment
inspection, where appropriate. Time-dependent position information is presented
in order that an exposure analysis can be performed to determine the integrated
dose from all contributing sources, including the initial radiation dose from the
shot being observed and the dose due to residual radiation from applicable
preceding shots.
The analysis described herein utilizes, for the first time, an automated
procedure for determining the dose due to residual radiation. This procedure
utilizes raw radiological survey data in statistical regression analyses to fit
space-time models of residual radiation intensity from which isointensity
contours are then derived. The derived contours as well as the decay parameters
are shown for the appropriate shots for which the procedure was used. Time and
space factors associated with personnel movements (operations) through
contaminated areas are combined with the refined and stored radiological data
to determine the integrated radiation dose for a specific troop track through the
defined area. A major feature of the automated procedure is that, once the

i
I
I I I I I I I I I I I I I
r'
l - c
HA l /
N EV
TURK 0
News Nob,,
CONTROL POINT ‘
BEE, ZUCCHINI 0
/ .WASPs
r OTH
-%ORNET
/
ADA /---- YUCCA I’
\ -
TEST
\
:y, x ,i ,
MILES 210 2 4 6 a
? I
S I TE
L -- 'Check Points
DESERT ROCK
Figure l-l Operation Teapot Shot Locations

radiological environment is defined, variations in the time and space factors
associated with troop operations are introduced to determine the sensitivity of
the final integrated dose to the omissions and inconsistencies of the operational
histories. The computer-based procedure facilitates such a sensitivity analysis
and aids considerably in the overall uncertainty determination.
Due to inadequate film badge dosimetry data for Exercise Desert Rock VI,
no significant comparison of calculated dose with film badge doses is possible.
However, the methodology for determining dose is not significantly different
than that used in previous analyses in which a comparison with dosimetric data
established a high degree of confidence. Automation of the procedure has
refined the confidence levels, and thus will facilitate subsequent exposure
analyses of other troop operations in the same radiologically contaminated areas.
Major findings of this report are:
The observers of nuclear shots in Operation Teapot were subjected to
external radiation from prompt neutrons and gamma rays, and
residual gamma radiation from fallout and neutron-activated soil.
The reconstructed mean film badge dose for observers of Shot Tesla
is +0.4
1.4 _o.5 +0.9
rem; for Shot Turk observers, 1.3 _. 5 rem; for Shot Bee .
observers, 0.85 2 0.35 rem; for volunteer observers of Shot Apple II, +I.0
lo6 -0.7 rem. Observers of other shots accrued much lesser doses.
+0.6 Free-field mean neutron doses of 1.4 _. 3 rem and 4.5
+5.4 . -3.0 rem are
calculated for the in-trench positions of Shot Tesla observers and
Shot Apple II volunteer observers, respectively. Neutron doses to
other observers were much lower, on the order of 0.1 rem and less.
The inhalation and ingestion of radioactive dust resulted in only a
trivial addition to the dose of Operation Teapot observers.

Section 2
OPERATIONS
2.1 SHOT DATA
Data for all nuclear shots of Operation Teapot are shown in Table 2-l. It
should be noted that Desert Rock observers participated only in those shots
marked with an asterisk. The other shots are shown for information and for
investigation of residual radiation that could have contributed to the observers’
radiation dose (Section 4).
2.2 PARTICIPATION
For Operation Teapot, there were four categories of the observer program
conducted by Camp Desert Rock as a part of Exercise Desert Rock VI. These
were as follows:
A. Volunteer Observers (Project 40.22). This group, consisting of nine
officers and one civilian (GS-12) from various Army service schools,
participated in Shot Apple II. They each calculated the minimum
safe in-trench observer distance for the upper limit of anticipated
shot yield, and the consensus of the group determined the distance at
which the shot would be observed from a trench.
0. Troop Packets (Projects 4 1.3 and 41.7). This group, consisting of 523
personnel from the Army and 25 from the Air Force, participated in
Shot Apple II. The Army personnel, part of Project 41.3, were from
the six continental armies. The Air Force personnel were designated
Project 4 1.7.
C. Service Observers (Projects 40.11, 41.3, 41.4, 41.8). This group
consisted of visitor observers from all services. The Army observers
were also known as official observers, and were those personnel from
Project 41.3 who were not in troop packets. They came to Camp
9

Table 2-l Teapot Shot Data
Shot Name
Date HOB Actual Local Location Coord (Planned)
(Ft) Yield Time NTS Area (UTM) (Note 1) (KT)
*Wasp
*Moth
*Tesla
*Turk
Hornet
*Bee
*ESS
*Apple I
Wasp Prime
HA
Post
*MET
*Apple II
Zucchini
18 FEB (18 FEB)
1200
22 FEB (21 FEB)
0545
1 MAR (25 FEB)
0530
7 MAR (15 FEB)
0520
12 MAR (8 MAR)
0520
22 MAR (18 MAR)
0505
23 MAR (15 MAR)
1230
29 MAR (18 MAR)
0455
29 MAR (20 MAR)
1000
6 APR (4 MAR)
1000
9 APR (1 MAR)
0430
15 APR (1 MAR)
1115
5MAY 0510 '(26 APR) (PDT)
15 MAY (1 APR)
0500 (PDT)
T-7(4)
T-3
T-9b
T-2
T-3a
T-7(la)
T-1Oa
T-4
T-7(4)
T-5
T-9c
FF
T-l
T-7(la)
* Exercise Desert Rock Observer participation
Note 1: A - Air T - Tower U - Underground
10
869047
871004
844090
784104
867996
867056
849138
797056
869047
860086
956728
798009
867056
762A
300T
300T
500T
300T
500T
-67U
500T
737A
32,582A
300T
400T
500T
500T
1
2
7
43
4
8
1
14
3
3
2
22
29
28

D.
Desert Rock mostly as individuals rather than in groups, from various
locations throughout the U.S. and overseas. The Navy and Marine
Corps observers, Projects 41.4 and 40.11 respectively, followed
essentially the same pattern. Their participation, however, was
heavily slanted toward Shot Bee, at which the Marine Brigade
exercise was conducted. The Air Force observers, Project 41.8,
likely came from various bases in a manner similar to the other
services.
The shot participation of the service observers is shown in Table 2-2.
It should be noted that, due to possible multiple shot participation,
the numbers in each project column are not necessarily additive.
This is explained in Section 2.3.
Camp Desert Rock (CDR) Observers. This group of observers was not
associated with a particular project. It consisted of individuals
assigned to the Camp Desert Rock permanent party, likely sent to
the forward area in increments that varied in size somewhat
inversely as the participation of other observer and troop maneuver
projects. It can be assumed that everyone in the CDR organization
was given the opportunity to observe one shot on a non-interference
basis with other observers. With a station complement of approxi-
mately 2000, it would appear from Table 2-2 that virtually everyone
took advantage of the opportunity to observe one of the shots.
Because the priority for viewing a shot would have gone to those who
had not yet seen one, the number of CDR personnel participating as
observers on more than one shot would have been small.
2.3 CONCEPT
The purpose of the observer program was to indoctrinate service members
at all grade levels by the observation of an actual detonation of a nuclear device,
followed whenever possible by an examination of the effects of the device on an
11

Table 2-2 Observer Program Participation Exercise Desert Rock VI
Operation Teapot
Shot Name --
Project
1 Wasp
2 Moth
3 Tesla
4 Turk
5 Hornet
6 Bee
7 Ess
8 Apple I
9 Wasp Prime
10 HA
11 Post
12 MET
13 Apple II
14 Zucchini
-_
* Observers and troop packets originally scheduled for participation in Shot MET were postponed to Shot Apple II.
Source: References 1,13,14.
‘2
-

array of equipment. Volunteer observers and troop packets were scheduled to
observe only one shot, Apple II. Service observers were scheduled for nine shots.
They were programmed to arrive at Camp Desert Rock in groups, a day or two
before the shot that the group was to observe. A new group was scheduled to
arrive shortly after the previous group had departed. The observer population
fluctuated considerably due to such factors as shot delays, which caused groups
to overlap. Each group participated in an orientation program which included
lectures and films on general nuclear weapon characteristics, a security briefing,
a description of the exercise, and a pre-shot tour of the equipment display area.
This pre-shot tour was probably conducted in conjunction with the AFSWP tour
for its official observers and other VIPs. Observation of the nuclear shot was to
be from trenches, if possible, as close to ground zero as safety criteria
permitted. At approximately one hour before each shot, the observers were to
be positioned in trenches (when appropriate), briefed on what to expect, and
checked for proper safety procedures. After the shot, the group was to tour the
equipment display area to see the effects of the detonation. The tour would be
conducted by an instructor group, who would describe the effects at the various
distances from the burst. The observer program was planned for each participa-
tion according to the following priority:
I - One shot of 1OKT or more.
II - Two shots, one less than 1OKT followed by one of 1OKT or
more, if feasible.
III - One shot of less than 10 KT.
The plan for observer participation changed frequently due to shot
postponements influenced by unfavorable weather conditions and other technical
factors. Thus, the established priorities could not be met in many cases. Most
observers were limited to one shot of any size and, in some cases because of the
delays involved, many observers departed for their home station without
witnessing any shot (Reference 13).
13

2.4 ACTIVITIES
Within each category of observers-- Volunteer Observers, Troop Packets,
Service Observers, and CDR Observers--the activities were essentially the same
for a particular shot. That is, each category remained as a group before, during,
and after each shot in which it participated. Moreover, the last three categories
all behaved as a single unit for each shot in which they participated. With the
exception of the volunteer observers, all other participating categories for each
shot were in the same trenches and viewed the same equipment display. In this
section, observer activities are treated on a shot-by-shot basis. Time and space
variances of the activities, due to the number of participants and the size of the
areas, are considered in the uncertainty analysis (Section 5). Significant
distances of interest, as used in the exposure analysis, are summarized in Table
2-3.
2.4.1 Shot Wasp. Two categories of observers were planned for this shot.
Service Observers and CDR Observers, totaling 888 personnel (Table 2-21,
intended to view the event from trenches 5000 yards from ground zero and to
tour the equipment display thereafter. Based on overall observer schedules in
References 13 and 14, it appears that they inspected the equipment display on
14 February, four days before the shot. Because the observer trenches and the
display area were in the path of possible, if only slight, fallout, the observation
point was shifted to News Nob and the post-shot tour of the display area was
cancelled. Figure 2-l shows the locations of the planned and actual observer
activities relative to the shot. Due to the actual distance involved (10 miles),
the observers were not exposed to significant nuclear radiation. This being the
first shot of the series, there was no residual radiation from previous shots. No
further analysis of the observer program for Shot Wasp is required.
2.4.2 Shot Moth. Service Observers and CDR Observers, totaling 193 personnel
(Table 2-21, observed the shot, as planned, from trenches 2500 yards WSW (258’
azimuth) of ground zero. From the applicable operation order (Reference 3) it
can be assumed that the observers arrived at the detrucking area on schedule
between 0420 and 0430. The trench area was adjacent to the dismount area.
Using other shot plans as a basis, the observers would have entered the trenches
14

Shot
Wasp
Moth
Tesla
Turk
Bee
Ess
Apple I
MET
Apple II
Table 2-3. Observer to Ground Zero Distance Summary Exercise Desert Rock VI
Observer Distance
10 miles (16 km)
2500 yards (2290 m)
2400 yards (2 190 m)
5500 yards (5030 m)
3500 yards (3200 m)
9000 yards (8230 m)
3500 yards (3200 m)
10,200 yards (9330 m)
3500 yards (3200 m) 2600 yards (2380 m)
Post-Shot Approach
None
None
1000 yards (910 m)
1000 yards (910 m) (D+l)
600 yards (550 m)
None
1000 yards (910 m)
None
1000 yards (910 m) 1000 yards (910 m)
15
- -_

I
’ ’ i
y ,__ \ ,’
Figure 2-1
Shot Wasp Area 4 -N-
B _. -00 0 YARDS .’ -.- ~ fj- ‘$J.--_
I
t J 0 METERS 3000 l+F- _ -s-
-( -2
Observer Position

almost immediately in order to await the countdown. At H-l hour, orientation
and safety instructions were provided and attendance rosters were checked. The
countdown was repeated over a loudspeaker system for all personnel to hear. At
H-Z minutes, the observers were instructed to turn in one direction, crouch in
the trenches, and shield their eyes. This position was to be maintained during
the shot and until the blast wave had passed, after which they were allowed to
rise to view the rising fireball. Within ten minutes the observers could have
exited the trenches to prepare for the arrival of the vehicles (they had been
parked about five miles to the south), which likely arrived by H+20 minutes. All
personnel, other than the observer control group, would have departed for Camp
Desert Rock by H+30 minutes. The locations of all observer activities are shown
in Figure 2-2.
2.4.3 Shot Tesla. A total of 523 observers, most of whom were from Camp
Desert Rock (Table 2-21, observed the shot from trenches 2400 yards* southwest
(235’ azimuth) of ground zero. They had inspected the display area on 28
February, the day before. In accordance with the usual planned procedure, the
observers arrived at the detrucking area shortly after 0400 (H-l.5 hours) and
moved to the trench area, about 100 yards from the road (see Figure 2-3). After
the orientation and the safety, communications, and attendance checks were
accomplished, the observers moved into the trenches at about H-15 minutes,
where they remained through the countdown to the shot at 0530 and for an
additional 5- IO minutes thereafter. By H+20 minutes, Desert Rock tad-safe
monitors had cleared the way for the walk to the equipment display, located
almost a mile toward ground zero. It is evident from the rad-safe situation map,
however, that little of the planned tour could be accomplished, possibly due in
part to the higher-than-expected shot yield. The limit of advance for all
observer personnel was the Sr/hr line, which was established by rad-safe
personnel at about 1000 yards from GZ. The equipment displays were located at
500 and 1000 yards from ground zero (Reference 1, Annex Q). Thus, only the
lOOO-yard line could have been viewed by the observers. They would have
*The planned distance was 2500 yards. Inspection of shot area photographs, however, places the trenches at this azimuth and distance.
17

. . .’ I
I- ’
i 4 -‘ .:f 3
I - J._ $g -y _i
_-A\ji- 7_” 7_ I , --
--- c .,_ _
Y_’ TJ _ sq. / \ ‘>,’ ,...--_$ - _ _ , ;A-
-/ +“:’ -, -/ - _. _
I ’ .+‘ - - 1 _ + /\
I -: i L . I -J ,
I - ’ - “Q -
i / 2 ’
:/ ubserver . Trcmrhacx
Figure 2-2
Shot Moth Area -N-
I
t 4 0 YARDS 3000
I 1 0 YETERS 3000

Fiqure 2-3
Shot Tesla Area
c . 0 YARDS 3000
Lo 4 0 METERS 3000
_ -

arrived there approximately 30 minutes after leaving the trench area, or at
about 0620. After a stay of IO-15 minutes, they had to return to the trench area
(verified by Army photograph) to meet their vehicles rather than use the planned
loading area near the 500-yard display line. Arrival at the trench area was about
0700, at which time the observers mounted and returned to Camp Desert Rock.
2.4.4 Shot Turk. A total of 464 observers witnessed the shot on 7 March from
trenches located 5500 yards SE (120’ azimuth) of ground zero (Figure 2-4). Some
observers had toured the display area on 14 February, the day before the original
readiness date. Others toured the display on 2 March. As in the previous shot
(Tesla), most of the observers consisted of the Camp Desert Rock permanent
party (Table 2-2). This may have been due, in part, to the long delay of Shot
Turk, the planned first shot of Operation Teapot, which could have caused some
observers to depart before the shot. The trenches were the same ones used for
Shot Tesla because the trenches prepared for Shot Turk, 3500 yards south of
ground zero, were in the path of expected fallout. The observers, following the
operation plan already used for Shot Tesla, arrived at the trenches between 0410
and 0420, in time for the usual pre-shot orientation and checks to begin at 0420
(H-l). It had been determined beforehand that, due to expected fallout, the
forward area would be evacuated immediately after the shot. The vehicles,
parked about 5 miles to the south, would have arrived at the trench area by 0535
(H+15 minutes), at which time they would have loaded and departed the area,
possibly by 0545. They likely arrived back at Camp Desert Rock before 0700.
As it turned out, because the cloud veered to the west, the trench area was not
in the fallout path. However, the display area was contaminated to an extent
that would have precluded an inspection on shot day, had the observers remained
in the forward area.
On the following afternoon, observers returned to the shot area to view the
equipment display, as evidenced by U.S. Army photographs. The photographs
indicate levels of damage to equipment that are consistent with those to be
expected as close as 1000 yards from a 43 KT burst. Recause of the 20 mr/hr
rad-safe limit for vehicular movement, the observers had to disembark just short
20

,. . -r .
.I. - .
I
1
16
15
5’
04
a3
la2
‘01
w
99
%a
Shot Turk Area
- -- -

of the unused trench area. Their inspection, up to the IOOO-yard displays, would
have required about the two hours indicated in the operation order.
2.4.5 Shot Hornet. There was no Exercise Desert Rock observer participation in
this event.
2.4.6 Shot Bee. A total of 525 service observers witnessed this shot from
trenches located 3500 yards SW (220’ azimuth) of ground zero. Because of the
large number of planned participants, including some of the maneuver troops
from the Marine Brigade Exercise (Project 41.61, there were no Camp Desert
Rock permanent party observers. Of those from the Marine Brigade Exercise,
142 stayed with the observers for the post-shot tour and did not participate in
the maneuver. As for previous shots, it is assumed that the exercise observers
joined the other official observers to inspect the pre-shot condition of the
equipment in the display area on 15 March, three days before the planned shot
date of 18 March. On 22 March, the actual shot date, the observers arrived in
the trench area (Figure 2-5) at about 0335, thirty minutes before the usual H-l
hour orientation and safety checks were begun. Shot Bee was detonated at 0505
hours. It was 0535 before the
the equipment display area, the
trenches (2800 yards from CZ).
on Reference 7) was as follows:
Depart trenches
observers were given clearance to move toward
first line of which was 700 yards forward of the
Their itinerary through the display area (based
0535 H+.5 Arr 2800-yard display Arr 2300-yard display Arr 1900-yard display Arr 1 loo-yard display Arr 700-yard display
(includes displays to 500 yards) Dep 700-yard display Arr trench area, load vehicles Dep for Camp Desert Rock
0545 H+.7 0555 H+.8 0605 H+l 0625 H+1.3 0650 H+1.8
0705 H+2 0740 H+2.6 0750 H+2.8
The observers would have arrived back at Camp Desert Rock at 0920, if it is
assumed that they adhered to their itinerary in the same manner as they had for
the entire operation.
22

h-

2.4.7 Shot Ess. There were 356 observers for this shot, a test of the Army’s
Atomic Demolition Munition (ADM). About half of the observers were from the
Camp Desert Rock permanent party, as shown in Table 2-2. Recause of the
distance, and because the shot was detonated at a depth of 67 feet, no trenches
were necessary for the observers. There was no Desert Rock display area,
hence, no pre-shot inspection. They witnessed the shot from 9000 yards
southwest (248’ azimuth) of ground zero, coordinates 773104. It is assumed that
they arrived at the observer area at 1100 hours (H-1.51, having approached the
area from the south, through Area 4. After the usual pre-shot checks and
orientation, they waited through the countdown to the shot at 1230. After the
shot (Figure 2-61, they would have boarded the vehicles within 20 minutes for the
return trip to Camp Desert Rock. The return route was the reverse of the route
used before the shot. Figure 2-7 shows the significant roads and areas of
interest.
2.4.8 Shot Apple I. Table 2-2 shows the breakdown of the 608 exercise
observers, most of whom were from the Camp Desert Rock permanent party.
They had visited the shot area on 28 March, the day before the shot, to conduct
the usual pre-shot equipment display inspection. On shot day, they arrived at the
detrucking area at 0325 hours (H-l.5 hours). The pre-shot activities were
essentially the same as for previous shots. They entered the observer trenches,
located 3500 yards SSW (205’ azimuth) of ground zero, at 0355 hours (H-l hour).
Within twenty minutes after the shot, they began the tour of the equipment
display area, walking forward to the displays between 2500 and 1000 yards from
ground zero. They then returned to the bus loading area at approximately 2000
yards from ground zero. They loaded the buses at 0615 for the return trip to
Camp Desert Rock. Figure 2-8 shows the significant points and roads involved.
2.4.9 Shot Wasp, HA, and Post. There was no Exercise Desert Rock observer
participation in these events.
2.4.10 Shot MET. The pre-shot tour of the equipment display area was
conducted on 10 April, almost a week before the shot. A sizeable observer
24


Figure 2-7
Shot Ess Area
1 . 0 YARDS 3000
F 2 0 YETERS 3000

f _J - 1 \
Shot Apple I Area

program was planned for this Military Effects Test (MET) shot, the only one of
the series conducted on Frenchman Flat. Due to the danger from pilotless drone
aircraft, observer participation, probably programmed for the old (Desert Rock
V) trenches 5000 yards WSW (225O azimuth) of ground zero, was cancelled, as
well as planned tours of the equipment display area. The only observers to
participate were 163 members of the Camp Desert Rock permanent party, who
witnessed the shot from 10,200 yards to the southwest, as shown in Figure 2-9.
A few minutes after the shot, they boarded the buses and returned to Camp
Desert Rock, just seven miles south of the observer point.
2.4.11 Shot Apple II. For this shot, all four categories of observers participated,
together with Task Force RAZOR, Project 41.2. All observers had inspected the
pre-shot equipment display on 25 April. On shot day, 5 May, ten volunteer
observers (Project 40.22) witnessed the shot from a trench located 2600 yards
south (175’ azimuth) of ground zero. The main group of observers were in
trenches 900 yards farther south, 3500 yards from ground zero. A last group of
observers, to include VIPs, was in trenches almost 4900 yards southwest (210’
azimuth) of ground zero. All observers had left Camp Desert Rock shortly after
0100 and had arrived at their respective observer areas at approximately 0300,
almost two hours before the shot. At H-l hour, all observers were in position,
and the pre-shot checks and orientation had begun. The observers remained in
their positions through the countdown to the shot at 0510. After the shot, the
volunteer observers likely remained in their trench for about five minutes, after
which they walked back to the command trench at the 3500-yard line. They
would have arrived by H+15 minutes. At about this time, rad-safe monitors were
completing their initial survey of the display area. At H+20 minutes, the
observers from the trench area began their walk-through of the equipment
display. Due to rad-safe considerations, the observers would have been allowed
to view the equipment only up to 1000 yards from ground zero. The observers
also could have watched the tank exercise which was underway to their left
(west). At H+l h our, the inspection was complete and the observers were
assembled at the bus loading area for the return trip to Camp Desert Rock. The
bus pick-up point was at the 20 mr/hr line (Reference IO), probably in the
28

_iL ’
, , -i- ,jC---_- ,
i’ , i >
S [I T Z---,--,
Figure 2-9
Shot MET Area
29 +- / ,x .:2-E B”L\:~IvI _
METERS 3000 --

vicinity of the volunteer observer trench. By 0640 (H+90 minutes), the observers
had mustered, brushed off, loaded into buses, and departed for Camp Desert
Rock. Figure 2-10 shows the significant areas of interest for the observer
participation in Shot Apple II.
Although it could be assumed that the volunteer observers would not have
joined the other observers in the equipment inspection, the possibility cannot be
ruled out. Because of the necessity for timely follow-up tests on their post-shot
condition, the volunteer observers probably would have been evacuated immedi-
ately after their return to the command trench. If they had stayed to inspect
the equipment, they would have accrued an additional dose from this activity.
For the purpose of this report, this is assumed for an upper limit of dose.
There is no evidence to suggest that the observers back at the 4900-yard
area were brought up to inspect the equipment display after the shot. They
presumably stayed near the VIP observer area until about 0610 (H+l hour), at
which time the buses from the vehicle park arrived to load up and return to
camp.
2.4.12 Shot Zucchini. There was no observer participation in this event, the last
shot of Operation Teapot.
30

- _--. APPLE II
--l-l4 Figure 2-10
-II- Shot Apple II Area
i-ii ’
4” 1 II 4
0 YARDS 3000
a UETERS 3000
-

32

Section 3
INITIAL RADIATION
Of the nine shots at which observers participated in Exercise Desert Rock
VI, six are investigated to determine the possible exposure to initial gamma and
neutron radiation. These are Shots Moth, Tesla, Turk, Bee, Apple I, and Apple II,
the details of which are listed in Table 2-l. The other three shots (Wasp, Ess,
MET) require no further investigation of initial exposure, because the distances
at which observers were actually positioned for these shots were well beyond the
range of significant initial radiation. This section discusses the general method
used to compute the initial radiation dose to personnel, and the specific
treatment of each of the six shots of interest.
3.1 COMPUTATIONAL METHOD
Because the observers were located in trenches at the times of detonation,
the calculation of the radiation dose for observer personnel is accomplished in
two steps. First, the free-field radiation environment above the trenches is
determined. This environment is then used to calculate the radiation doses to
personnel in the trenches.
In the first step, the neutron and gamma radiation environment is deter-
mined with radiation transport codes ATR4 (Reference 22) and ATR4.1
(Reference 23). The first code contains provisions to correct for the presence of
Nevada soil at the air-ground interface; the second, although using a West
German soil type, contains improved source-energy dependent ground correction
factors. Hence, ATR4 is used to calculate neutron and neutron-induced gamma
radiation, which are sensitive to the hydrogen (water) content of the soil
(Reference 241, while ATR4.1 is used to calculate fission product gamma and
prompt* gamma radiation, neither of which is sensitive to the presence of
hydrogen in the soil. Neutron doses are calculated from tissue (Ritts) kerma
factors, while Henderson tissue doses are used for gamma radiation.
*Defined as from the fission reaction.
33

A required input to the ATR codes is the weapon neutron output spectrum.
This is not available, however, for any of the six shots considered. Therefore,
the neutron spectrum is estimated for each shot by first choosing a trial neutron
spectrum based on specific weapon design characteristics (e.g., boosting, high
explosive thickness) and known spectra for similar weapons. This spectrum is
used in ATR4 to calculate the neutron dose as a function of range, which is then
expressed in the form
where D is the dose, R is slant range, and A and B are constants. The
parameters A and B are determined by a least squares fit to the calculated doses
in the range 400-l 300 yards. The trial spectrum is then systematically modified
to obtain agreement with initial radiation measurements taken at the time of the
shot. Neutron fluence measurements were made for several shots, using fission
(plutonium, neptunium, uranium) and activation (gold, sulfur) foils. These foil
measurements are converted to neutron dose using an equation which was
derived by collapsing tissue (Ritts) kerma factors to conform to the foil energy
boundaries. This was done using published kerma (Reference 22) and neutron
fluence (Reference 30) values, the latter calculated at one meter above the
ground, 1500 meters from a bare fission source located at a height of 50 feet.
The resulting expression for free-field tissue dose is:
rad (tis) = 4Au (9.36x10⁻¹²) + ( 4Au +$Ru, (1.73~10-~‘)
+ ‘+Ru -+Np) (7.69~10-~‘) + ($Np - $$ (2.17~10-~)
+ c4”- +S’ (3.00~10-~) + ~$~(4.464xlO-~)
where d is a fluence value measured with the appropriate foil. The epithermal
contribution to the dose (second term) is estimated by assuming that 52 percent
of the total neutron fluence is in the range .3 eV to 10 KeV, as suggested in
Reference 19. Dose range points derived in this manner from foil data are fit
with an analogous exponential expression, DR2 = e -A’R+B’
, and the parameters A’
34

and B’ are compared with those developed from the trial spectrum. If necessary,
the neutron distribution in the trial spectrum is adjusted so that the slope
parameter A agrees with the observed value A’ (the reciprocal of which is the
neutron dose relaxation length) over the range of 400-1300 yards, where most
foil data are available. After this adjustment, the total neutron output (or,
equivalently, the neutron normalization in neutrons per KT yield) is adjusted as
necessary to obtain agreement in the “B” parameter. The spectrum so derived,
when used in ATR4, predicts a neutron dose which agrees with the dose
calculated from foil data over the range 400-1300 yards.
A final neutron spectrum adjustment is then made, if necessary, to obtain
agreement between the measured and the ATR-calculated gamma dose-range
curves. Gamma doses are calculated as described previously, using ATR4 for
neutron-induced (secondary) gamma and ATR4.1 for prompt and fission product
(debris) gamma. The total calculated gamma doses are then compared with dose
measurements. Because a significant gamma component is due to secondary
gamma from radiative capture of thermal neutrons, the low energy portion of
the trial neutron spectrum may be adjusted, within reasonable limits, to obtain
better agreement between the two gamma dose curves. This adjustment does
not significantly alter the neutron dose curve in the range 400- 1300 yards; thus,
the neutron dose need not be readjusted. The final adjusted spectrum is used in
ATR4 to determine both neutron and neutron-induced gamma doses at the
distances of the observer trenches (generally 2500-3500 yards).
The gamma dose-range curves calculated in this manner generally agree
well with the measured dose-range curves in the range 1000-2000 yards.
However, for many Teapot shots, the measured gamma data display a rather
abrupt change in slope at approximately 2000 yards, as shown for Moth in Figure
3-2 (at 1500 yards), Bee in Figure 3-7 (2000 yards), Apple I in Figure 3-8 (2050
yards), and Apple II in Figure 3-9 (2400 yards). The ATR calculations are unable
to duplicate this behavior, which is unclear. The locations of the discontinuities
in slope correspond to ranges at which film types were changed--film types 1290
and 606 were used at closer distances, while types 510 and 502 were used farther
out. Film types 510 and 502 were used sparingly in the Tesla and Turk shots,
where no slope change is evident. Therefore, it appears that the
35

slope change and consequent discrepancy between measured and predicted
gamma doses may be related to the sensitivity and/or processing of film types
510 and 502. On the other hand, examination of gamma dose data from
Operations Tumbler-Snapper, Upshot-Knothole, and Plumbbob reveals examples
of similar changes in slope that occur either in the range of a single film type or
as measured with chemical dosimeters. Recause the ATR gamma doses are
consistently lower than the measured doses at ranges beyond this change in
slope, a high-sided estimate of dose at the trench location is obtained by
extrapolation from measured data. This method is applied to obtain the gamma
dose for those shots displaying this effect. Individual gamma dose components
(prompt, secondary, and debris gamma) are then estimated by increasing the
ATR-predicted component doses proportionally to agree with the extrapolated
total dose.
The second step of the calculation uses the free-field radiation environ-
ment to determine the dose within the trench. It is convenient to define a
trench factor as the ratio of dose (neutron or gamma) in the trench to dose
(neutron or gamma) above the trench. These factors must be calculated for each
of the major components of radiation--neutron, secondary gamma (created by
neutron capture or inelastic scattering in the atmosphere and ground), local
gamma (created locally by neutron capture in the trench walls), and fission
product (debris) gamma. It is found that the trench factors depend also on
ground range, height of burst, weapon yield, trench dimensions, and depth in the
trench. For the shots of interest, two trench sizes were utilized. The volunteer
observers at Shot Apple II were in trenches three feet wide with an estimated
depth of five feet. All other observers were in trenches approximately two feet
wide and five feet deep. The in-trench free-field neutron and gamma doses for
personnel in the crouched position are calculated at a depth of 2.33 feet below
the lip of the trench, which corresponds approximately to the mid-torso depth
for personnel in this position. For personnel standing upright in the trench, as
probably occurred soon after passage of the shock wave, free-field doses are
calculated at a point .5 feet below the lip at the mid-trench position; this
corresponds approximately to the location of a properly-worn film badge for a
36

standing observer. Brief discussions of the derivations of the various trench
factors are presented in Appendix I of Reference 31.
The in-trench dose (in rads) is converted to an equivalent tissue dose
(in rem) using the quality factors and methods prescribed in Reference 32. It is
found that the “effective” quality factor for this rad-to-rem conversion for
neutrons is an almost constant value of 13 for the weapon types and ranges of
interest. The quality factor for gamma radiation is taken to be unity. Finally,
representative film badge readings for personnel in the trenches are estimated.
The factors that are used to convert the in-trench free-field doses to film badge
(chestworn) readings were developed from calculations utilizing the adjoint mode
of the computer code MORSE (Reference 26). These film badge conversion
factors are strongly dependent on the posture and orientation of the personnel in
the trench; mean values of these parameters were determined from MORSE
calculations involving extreme variations in individual posture and orientation.
The “dose equivalent in trench” values reported for each shot in Section 3.2 are
the equivalent tissue dose for neutron radiation and the film badge dose for
gamma radiation.
The neutron, secondary gamma, and local gamma doses are accrued
rapidly (essentially within the first second) after detonation. Thus, the posture
in a trench could not be altered significantly during this exposure. The debris
gamma dose, however, is delivered over a period of many seconds. Therefore,
the possibility of individual reorientation (e.g., standing up) in the trench must be
considered. It is unlikely that a person crouched in the trench at the time of
detonation would have attempted any significant movement until after the shock
wave had passed and the blast winds had subsided. Therefore it is assumed that,
within a few seconds after passage of the shock wave, most of the observers
were standing upright in the trench, watching the rising cloud. This reorienta-
tion changed both the trench factors and film badge conversion factors for such
an individual. For an observer crouched in the trench from to until tU, and
standing upright in the center of the trench facing the rising cloud at times
t > t,, his film badge dose, Dd, due to debris gamma is calculated by:
37

/
t” Dd(tu) = Fc
t Tc(t)Id(t)dt + F Tu(t)Id(t)dt ,
0
where Fc = film badge conversion factor, debris gamma, crouched position,
FU q film badge conversion factor, debris gamma, upright position,
Tc(t) = debris gamma trench factor, crouched position,
T,(t) = debris gamma trench factor, upright position,
Id(t) = debris gamma free-field intensity.
The trench factors T,(t) and T,(t), which are time-dependent due to the rising
source, are discussed in Appendix I of Reference 31. Intensities Id(f) are
calculated with computer codes NUIDEA (Reference 33) and ATR4 for the shots
and ranges of interest. The film badge conversion factors Fc and FU were
discussed previously; their values for debris gamma calculations are taken as
Fc = .46, Fu = .95. In calculating the debris gamma dose, it is assumed that the
observers stood upright in the trenches at three seconds after the shock wave
passed their position. The values of debris gamma trench factor given in the
following section are the results of this calculation. These parameters are used
to convert from above-trench debris gamma dose to film badge reading for a
person standing up at the reference time, and thus include the effects of both
trench shielding and film badge conversion.
3.2 RESULTS
The results of the computations are discussed in the following subsections
for each of the six shots of interest. Due to lack of required input data for some
shots, some deviation from the general computational method discussed above
was required. When such deviations were necessary to perform the analysis for a
given shot, the details are presented.
3.2.1 Shot Moth. The general computational method was used, as described in
Section 3.1. Neutron fluences derived from foil measurements were taken from
References 20 and 21, corrected by factors given in Reference 27 to reflect
improved knowledge of reaction cross section, and converted to free-field tissue
doses using spectral-averaged kerma factors. The ATR fit to these “measured”
38

doses is displayed in Figure 3- 1. Only one complete set of foil data exists for
the ranges of interest. However, many individual foil measurements were taken
at various distances, so that accurate fluence versus distance curves can be
constructed for individual foils. These can be used to analytically determine
neutron dose at any desired distance within the range spanned by the foil
measurements. This method was used to determine the parameters A and B to
which the ATR neutron dose was fit.
The gamma dose measurements from Reference 19 are shown in Figure
3-2, together with the ATR-derived gamma dose curve and an extrapolation
from measured data. At the trench location (2500 yards from ground zero), the
gamma dose obtained by extrapolation is 36 percent higher than the dose
calculated with ATR. This higher dose value is used as the dose estimate.
The results of the dose calculations at the trench location are as follows:
Prompt Secondary Debris Local TOTAL Gamma Gamma Gamma Gamma GAMMA NEUTRON
Tissue Dose above Trench (mrad) 40 480 240 - 760 49
Trench Factor .06 .020 .22 .08 - .25
Film Badge Con- version Factor .46 .53 - .7 -
Dose Equivalent in Trench (mrem) 1” 5” 53” 3” 62” 160
*Film Badge Dose
3.2.2 Shot Tesla. In addition to the gold and sulfur neutron foil measurements
reported in Reference 20, two nearly-complete sets of foil data are given in
Reference 34. Doses derived from the latter data (and shown in Figure 3-3)
were fit with an ATR calculation; the source spectrum so derived was used to
determine the free-field neutron environment at the trench location (2400 yards
from ground zero). Gamma dose data are presented in Reference 19, and
39

\ 0 @ Ci
- Ci
\
culated measurer
culated ATR
rom nts
rom
t
Slant Range (yards)
I
Figure 3-l Shot Moth Neutron Dose
40

\ 0
-$t
a rti e
'al
--Ext
.
\
.
sured
ulated I
apolatec measurer
Slant Range (yards)
TR)
from nts
\
Figure 3-2 Shot Moth Gamma Dose
41

lola
log_
108L
107-
0
\ i
c
.ooo
0 Cal slated 'om Meas semen&
- Cal Alated 'om ATR
\
2000
Slant Range ,Yards)
\
3000
-
-
-
-
Figure 3-3 Shot Tesla Neutron Dose
42
_ - _- _ _~ ----
displayed in Figure 3-4, together with the ATR-calculated gamma dose. The
agreement is generally good.
Tesla was an asymmetric device with its axis generally in the north-south
direction (So azimuth). The neutron data from Reference 20, taken along lines
O”, 45’, and 90’ to the weapon axis, show only minor variations with azimuth.
The neutron data from Reference 34 were taken along an aximuth of 65’; the
gamma data in Reference 19 were taken along the device axis; the trenches were
located approximately between the azimuths 230°-240’. Since asymmetries in
the radiation output of this device do not appear to be significant, it is assumed
in performing these calculations that the output was approximately symmetrical.
The estimated radiation environment at the trench location for Shot Tesla is as
follows:
Prompt Secondary Debris Local TOTAL Gamma Gamma Gamma Gamma GAMMA NEUTRON
Tissue Dose above Trench (mrad) 80 760 1220 - 2060 400
Trench Factor .06 .021 .20 .08 - .25
Film Badge Con- version Factor .46 .53 - .7 -
Dose Equivalent in Trench (mrem) 2” 8* 240” 20” 270” 1310
*Film Badge Dose
3.2.3 Shot Turk. No neutron foil data were taken for Shot Turk; gamma dose
data (uncorrected due to lack of foil data) are provided in Reference 19. A
neutron source spectrum was chosen based on weapon design characteristics.
Because of the distance of the trench from ground zero (5500 yards), the neutron
dose above the trench is found to be negligible (less than 1~10~~ rads). The ATR-
calculated gamma dose is approximately 60 percent higher than the measured
gamma dose as shown in Figure 3-5. Due to the very small doses involved and
the apparent conservativeness inherent in these ATR calculations, further
refinements were not attempted.
43

lo9
108
107
0
l . -25 ‘0 ‘b
‘0 b(
OF’
-C
lsured
culated WR i
1000 2000
Slant Range (Yards)
Fisure 3-4 Shot Tesla
3000
Gamma Dose

Y 0 0 Q
0 0 c
o Me
- Ca
\
0
0
0 0
Slant Range (yards)
;ured
:ulated \TR) .
Figure 3-5 Shot Turk Gamma Dose
45

The estimated radiation dose at the trench location is as follows:
Prompt Secondary Debris Local TOTAL Gamma Gamma Gamma Gamma GAMMA NEUTRON
Tissue Dose above Trench (mrad) <I 3 1 - 4 <I
Trench Factor .03 .015 .13 .08 - .25
Film Badge Con- version Factor .46 .53 - .7 -
Dose Equivalent in Trench (mrem) <l <l <I <1 <I <I
3.2.4 Shot Bee. Neutron fluence measurements were taken from References 20
and 21, corrected by the factors in Reference 27, and converted to dose. The
ATR fit to these doses is displayed in Figure 3-6. The measured gamma doses,
from Reference 19, the ATR gamma dose curve, and the extrapolation from
measured data are shown in Figure 3-7. The gamma dose obtained by
extrapolation is 95 percent higher than the ATR-calculated dose at the trench
location (3500 yards from ground zero). This higher gamma dose value is used as
the dose estimate.
The results of the dose calculations at the trench location are as follows:
Prompt Secondary Debris Local TOTAL Gamma Gamma Gamma Gamma GAMMA NEUTRON
Tissue Dose above Trench (mrad) 10 235 85 - 330 3
Trench Factor .03 .015 .19 .08 - .25
Film Badge Con- version Factor .46 .53 - .7 -
Dose Equivalent in Trench (mrem) <1 2” 16” ~1 18” 10
*Film Badge Dose
46

\
I 0
\ B
\
\
Ci
i
\
2(
culated measurer
culated ATR
L 0
Slant Range (yards)
'ram !nts
'ram
3c
Figure 3-6 Shot Bee Neutron Dose
47

\
B
0 0
0 0
%rI . . . @ Meas
- Calc
_ Extr'
. 1 . .
Oed
iated (A
lolated neasurem
h
Slant Range (yards)
-0m 1ts
I
Figure 3-7 Shot Bee Gamma Dose
4s
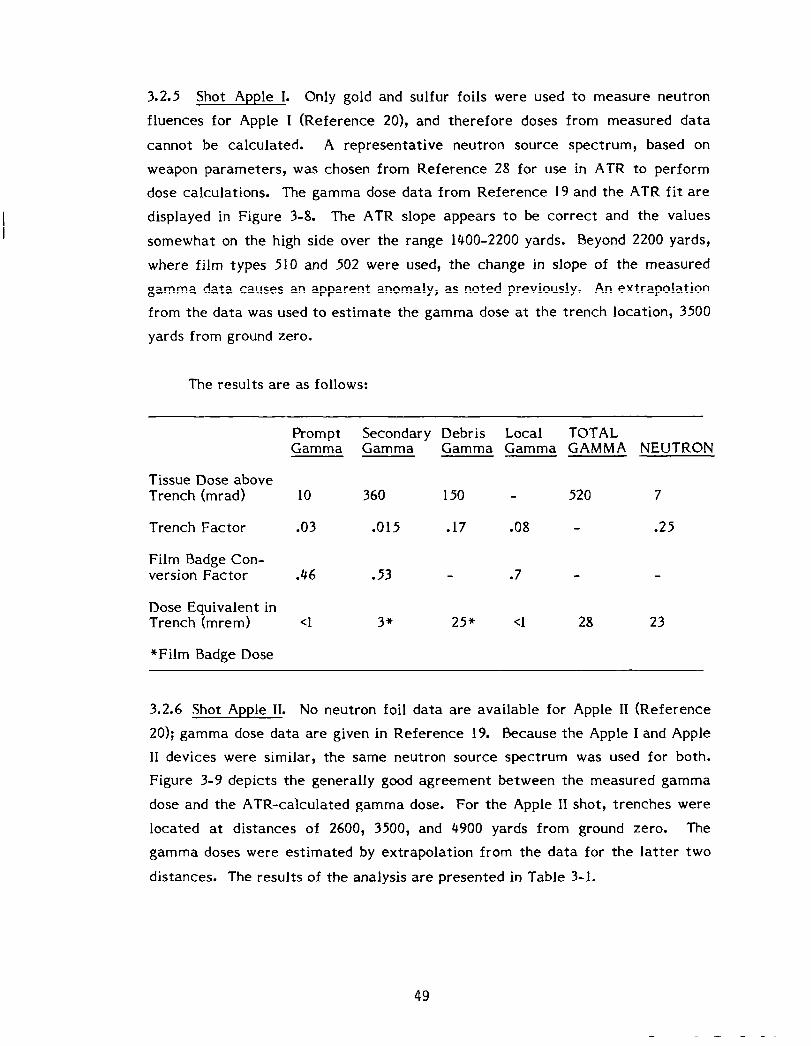
3.2.5 Shot Apple I. Only gold and sulfur foils were used to measure neutron
fluences for Apple I (Reference 20), and therefore doses from measured data
cannot be calculated. A representative neutron source spectrum, based on
weapon parameters, was chosen from Reference 28 for use in ATR to perform
dose calculations. The gamma dose data from Reference 19 and the ATR fit are
displayed in Figure 3-8. The ATR slope appears to be correct and the values
somewhat on the high side over the range 1400-2200 yards. Beyond 2200 yards,
where film types 510 and 502 were used, the change in slope of the measured
gamma data causes an apparent anomaly, as noted previously. An extrapolation
from the data was used to estimate the gamma dose at the trench location, 3500
yards from ground zero.
The results are as follows:
Prompt Secondary Debris Local TOTAL Gamma Gamma Gamma Gamma GAMMA NEUTRON
Tissue Dose above Trench (mrad) 10 360 150 - 520 7
Trench Factor .03 ,015 .17 .08 - .25
Film Badge Con- version Factor .46 .53 - .7 -
Dose Equivalent in Trench (mrem> <1 3” 25” ~1 28 23
*Film Badge Dose
3.2.6 Shot Apple II. No neutron foil data are available for Apple II (Reference
20); gamma dose data are given in Reference 19. Because the Apple I and Apple
II devices were similar, the same neutron source spectrum was used for both.
Figure 3-9 depicts the generally good agreement between the measured gamma
dose and the ATR-calculated gamma dose. For the Apple II shot, trenches were
located at distances of 2600, 3500, and 4900 yards from ground zero. The
gamma doses were estimated by extrapolation from the data for the latter two
distances. The results of the analysis are presented in Table 3-1.
49

108
0
0
\
0
0 0
0 c . 5 . x 0
s
Q Me,
- Ca'
-- Ex.
ured
ulated
apolatec measure
,TR)
from lents
1000 2000
Slant Range (yards)
3000
Figure 3-8 Shot Apple I Gamma Dose
50
- ._- --

Q Me;
- Cal
-1 Exl
\
ured
ulated (
apolatec measure
. .
t 0
,TR)
from lents
0 . 1 Q.
0
1000 2000
Slant Range (yards)
Figure 3-9 Shot Apple
a . _
\ - b
\ - 1 \
_
_
3000
I Gamma Dose

Table 3-1. Initial Radiation Dose, Shot Apple II
Prompt Secondary Debris Local TOTAL Gamma Gamma Gamma Gamma GAMMA NEUTRON
TRENCHES AT 2600 YARDS (VOLUNTEER OBSERVERS):
Tissue Dose above Trench (mrad) 310
Trench Factor .07
Film Badge Con- version Factor .46
Dose Equivalent in Trench (mrem) 10*
TRENCHES AT 3500 YARDS:
Tissue Dose above Trench (mrad) 20
Trench Factor .03
Film Badge Con- version Factor .46
Dose Equivalent in Trench (mrem) <l
TRENCHES AT 4900 YARDS:
Tissue Dose above Trench (mrad) <I
Trench Factor .03
Film Badge Con- version Factor .46
Dose Equivalent in Trench (mrem) <l
5700
.030
.53
90*
630
.015
.53
5*
20
.015
.53
<I
5800 -
.18 .08
.7
11800 1080
.27
1040” 60” 1200” 3800
350
.14
48”
5
.13
<I
.08
.7
1*
.08
.7
<l
1000
54”
25
<l
16
.25
50
<l
.25
<l
*Film Badge Dose
52

Section 4
RESIDUAL RADIATION
4.1 RESIDUAL GAMMA RADIATION EXPOSURE
Gamma doses are reconstructed for military observers, based on their
activities in the fallout and neutron-induced activity fields of various shots of
Operation Teapot. A computerized methodology, described in the appendix,
determines the radiological environment encountered by the observers. From
this, doses are calculated based on the scenario of troop activities. Iso-intensity
countours with superimposed troop tracks are displayed in Figures 4-2, 4-3, 4-4,
4-6, and 4-8 for Shots Tesla, Turk, Aee, Apple I, and Apple II, respectively.
Other shots, which did not contaminate the observers, have gamma fields
outlined in Figures 4-1, 4-5, and 4-7 to show their relationship to the observer
positions. A composite plot of residual radiation from applicable Teapot shots in
Yucca Flat is shown in Figure 4-9.
The computer-calculated doses do not reflect the presence of the human
body in the radiological environment. Despite the penetrating ability of gamma
rays from fission and activation products, the body affords some shielding;
hence, the gamma dose to any organ depends on the geometry of the radiation
source and the body position. In order to represent reconstructed film badge
readings, gamma doses are calculated for the surface of the chest, where a film
badge is normally worn. The free-field gamma intensity is converted to a film
badge dose rate through the factor developed in Reference 17: 1 r/hr 0.7
rem/hr. This conversion is applicable to an erect individual wearing a film badge
on his chest, and standing in a uniform, plane fallout field. These conditions are
met in the observers’ scenarios except that there are intensity gradients in the
gamma fields (the calculated film badge dose is identical to the “film badge
equivalent dose” of Reference 17).
Observer dose calculations are categorized by the shot in conjunction with
which each observer group participated. Contributions from previous shots to
the dose are noted as they arise.
53

4.1.1 Shot Wasp. As indicated in Section 2.4.1, observers proceeded no closer to
the shot area than News Nob, and received no dose at this ten-mile distance.
4.1.2 Shot Moth. Observers of Shot Moth may have encountered very light
fallout before departing the trench area within a half hour after the shot. No
radiological survey data were reported as far from GZ as the trenches; however,
a reading of 10 mr/hr was obtained at H+42 minutes at a position about 600
meters nearer GZ. Any fallout in the trench area, even if as early as H+lO
minutes, would not have had an intensity greater than several mr/hr. The dose
to the observers, then, was probably on the order of 1 mrem. A dose this small
would have been below the threshold of a film badge. Figure 4-l shown the
residual radiation area and the observer trenches.
4.1.3 Shot Tesla. The observers encountered fresh fallout, beginning a few
hundred yards in front of their trenches. Most of their dose, however, resulted
from their inspection of the equipment display line at 1000 yards from GZ. The
gamma intensity during their 10-l 5 minute inspection of this display is
calculated to have decreased from about 5 to 4 r/hr. Thus, the observers were
still near the rad-safe limit, and would not have attempted to approach the 500-
yard display line,
(see Figure 4-2).
to be -1.16. The
mrem.
4.1.4 Shot Turk.
which is calculated to have been at about 50 r/hr at H+l hour
The decay exponent associated with the isopleths is calculated
total film badge dose calculated for the Tesla observers is 1100
Observers for this shot received no residual dose on shot day.
Both their pre-shot tour of the equipment display and the Tesla trenches from
which they witnessed the shot were in uncontaminated areas. The anticipated
fallout from Turk at their trench position did not materialize (although it came
close--see Figure 4-3), so that no dose would have resulted even if the observers
had not been evacuated. The calculated decay exponent associated with the
isopleths in the figure is -1.04.
On the day after the shot, the observers could view the equipment display
as close as the lOOO-yard line within the 5 r/hr rad-safe limit. Available
photography shows that the observers walked toward GZ along the eastern
boundary road of the display area. They would have accrued most of their dose
54

11 and Observer PositIon
Figure 4-1
Shot Moth Residual Radiation (mr/hr @H+l)
1 0 IL 0 z METERS YARDS 3000 3000 3

_,_,/_ , , r 2--. ic 4 _ ’ .I
and Observer Routes

,- Ii \ I\ , \~_
\I I, ‘I/ I -I ‘1 ,
b -N-
II
Figure 4-3
Shot Turk Residual Radiation (mr/hr @ H+l)
and Observer Routes iD+l)
. + 0 YARDS 3000
c , 0 YRERS 3ooo
while returning along the (assumed) western road, which, paralleling the direc-
tion of fallout, had little decrease in intensity with distance. The calculated
film badge dose for this circuit is 1240 mrem.
4.1.5
from
were
Shot Bee. The radiation field encountered by Shot Bee observers resulted
neutron activation of the soil. Entering from the southwest, the observers
well removed from the light fallout that drifted to the east (see Figure 4-
4). It is assumed that the observers reached their rad-safe rate limit because the
display line that ranged 700 to 500 yards from GZ crossed the 5 r/hr line at about
600 yards. The calculated film badge dose for Bee observers is 830 mrem.
4.1.6 Shot Ess. Observers of Shot Ess were well removed from its fallout (see
Figure 4-5), and thus accrued no dose from this source. However, they observed
Ess from positions in the 16-day old Turk fallout field (Figure 4-3). While being
trucked to and from their position, they crossed the Turk hotline, calculated to
have had an intensity of nearly 200 mr/hr at that time. Much of their calculated
film badge dose, 43 mrem, resulted from the longer time spent at the observer
positions, although the intensity there was less than 20 mr/hr. No correction is
made for truck shielding or for the close spacing of the personnel within.
4.1.7 Shot Apple I. This shot resulted in a mixed gamma field. Although there
was moderate fallout to the northeast (Figure 4-6), induced activity
predominated elsewhere (as determined from fitting the data). Consequently,
the observers, who entered the contaminated area from the southwest, are
assumed to have encountered no fallout. Because the shot yield was far less than
anticipated, the observers were able to view the innermost display line without
being close to the rad-safe limit. Their calculated film badge dose is 84 mrem.
4.1.8 Shot MET. Observers were well distant from the Shot MET contamination
(Figure 4-7), and thus accrued no dose. Moreover, the Frenchman Flat area was
uncontaminated during the pre-shot equipment inspections.
4.1.9 Shot Apple II. Measurable fallout from Apple II reached about 3000 yards
in the direction of the trenches (Figure 4-8). The volunteer observers would have
withdrawn beyond this distance within ten minutes, at which time fallout had
probably not arrived. Therefore, the volunteers accrued a residual radiation dose
58

--

Figure 4-5
Shot Ess Residual Radiation (mr/hr @ H+l)
Shot Turk Residual Radiation (mr/hr @ D+16)
and Observer Position
100 0 YARM
, I 0 VETEm 3000

I Figure 4-6
Shot Apple I Residual (mr/hr @ H+l)
-N- and Observer Routes
Radiation w
t
*
r . 0 IARDS 3000
43 ‘ 1 0 YETERS 3Doo
t
--

I Figure 4-7
Shot MET Residual Radiation
-n- (mr/hr @ H+l)
and Observer Position
1 ‘
0 YARDS 3000
t 0 YETEa
3 3000
__- I

/ I I
ver I/ II I Figure 4-8
4 Shot Apple II Residual Radiation (mr/hr D H+l)
-N-
and Observer Routes
-
ioi
ioo

4 Figure 4-9
Composite Plot of
-I(- Residual Radiation, Yucca Flat
(13 mr/hr @ cl+!)
b VARDS do0
m 4 0 YETERS 3000

only if they went forward to view equipment with the main body of observers.
Observers would have encountered contamination at about H+25 minutes.
Fallout deposition most likely had occurred by then; if not, the calculated dose is
slightly high-sided. If it is assumed that the observers did not pass the lOOO-yard
display line in an attempt to reach the 500-yard line (which was too
contaminated, with an intensity approaching 10 r/hr), the calculated film badge
dose is 180 mrem. The calculated decay exponent associated with the isopleths
in Figure 4-8 is -0.94.
4.2 INTERNAL RADIATION EXPOSURE
The only situation for Operation *Teapot observers in which a potential
internal radiation hazard need be considered is the trucking of the Shot Ess
observers across the Shot Turk fallout field (the breathing of dust therefrom).
An estimate of their dose is obtained by comparison with the internal dose
calculation for Task Force BIG BANG in Operation Plumbbob (Reference 18).
This task force had one source of exposure on their exercise day similar to Shot
Turk at D+ 16 days: Shot Shasta at D+l5 days. The time-integrated gamma
intensity for the Shot Ess observers while being trucked is calculated as 24 mr;
for TF BIG BANG from Shot Shasta, it was 0.83 mr (Reference 18, p. 28). The
Shot Shasta contribution to the BIG BANG internal dose on D+l5, excluding the
infiltration course, was 0.08 mrem, based on a resuspension factor of 10 -5 -1
m
(Reference 18, p. 40). Resuspension factors for dust raised by vehicles has also
been reported as being on the order of 10 -5 m -1 (Reference 29). By proportion-
ality, the 50-year internal bone dose commitment for the Shot Ess observers is
estimated to have been about 2 mrem.
4.3 RESIDUAL RADIATION DOSE SUMMARY
The calculated film badge doses to Operation Teapot observers from
residual radiation are summarized as follows:
Shot Wasp Moth Tesla Turk Bee Ess* Apple I MET Apple II
Dose (rem) 0 0.001 1.1 1.2 0.83 0.043 0.084 0 0.18
*Also, a 0.002 rem 50-year bone dose commitment.
65

-

Section 5
UNCERTAINTY ANALYSIS AND TOTAL DOSE DETERMINATION
The sources of error in the calculation of initial and residual doses are
examined in order to quantitatively estimate the uncertainty in the total dose
for each group of observers.
5.1 UNCERTAINTIES IN INITIAL RADIATION DOSE
5.1.1 Neutron Dose. For those shots (Moth, Tesla, Bee) for which neutron data
exist, the sources of error in the calculation of neutron dose include: (1)
uncertainties in doses derived from foil measurements, (2) uncertainties in
neutron output spectra of the devices, (3) errors associated with the use of the
ATR4 to extrapolate beyond the range of measured data, and (4) errors in
relating above-trench dose to in-trench dose equivalent. A detailed analysis of
the neutron dosimetry techniques employed in Operation Teapot indicates that
the major sources of uncertainty in foil measurements are due to error in the
reactor thermal neutron fluence used to calibrate the fission and gold detectors,
and to foil activity counting precision and technique. The error factor,
expressed in terms of 900percent confidence limits, is determined to be
approximately 1.25. The error due to neutron output spectral uncertainty is
estimated by calculating neutron doses at a typical trench range resulting from
various output spectra, all of which match the measured doses over the range of
neutron measurements. It is found that the error factor associated with spectral
uncertainty is about 1.15 for those ranges at which significant doses are possible.
The error in using ATR4 to extrapolate from the range of measured data to
trench locations is estimated by comparing ATR results with those of recent
two-dimensional discrete ordinates calculations; this error factor is determined
to be approximately 1.15. Finally, the error factor associated with relating the
above-trench environment to the in-trench dose equivalent is estimated to be
1.25. The combined error factor for the neutron dose from Shots Moth and Bee
is therefore 1.45. For Shot Tesla, an additional uncertainty due to device
asymmetry must be considered. It is estimated that the error factor associated
with this uncertainty is approximately 1.20, resulting in a combined error factor
of 1.51 for Shot Tesla.
67

For those shots (Turk, Apple 1, Apple II) lacking sufficient neutron data to
determine experimental dose versus range, the uncertainty increases
significantly. Without the capability to normalize to measured data, the
uncertainties in neutron output spectra and environmental factors dominate.
These uncertainties are estimated by examining the distribution of dose versus
range curves for six Teapot shots for which full neutron foil data were taken,
after normalization to common yield and air density. It is felt that this
distribution is representative of Teapot-era devices, and that the prediction of
dose versus range from a best-estimate output spectrum without normalization
to measured data will probably conform to such a distribution. The error factors
determined in this manner are estimated to increase from 2.2 at 2000 yards to
3.2 at 4000 yards. Including the ATR4 extrapolation error factor (1.15) and the
trench calculation error factor (1.25) results in combined error factors of 2.3-3.3
for ground ranges of 2000-4000 yards.
5.1.2 Initial Gamma Dose. Sources of error in the calculation of initial gamma
dose include: (1) uncertainty in experimental film badge readings, (2)
extrapolation/interpolation techniques to determine dose at trench locations, (3) ,
errors in relating above-trench dose to in-trench dose, (4) uncertainty in
converting in-trench dose to film badge reading for personnel in a fixed position,
and (5) uncertainty in personnel reorientation (i.e., standing up) in the trench.
While the other sources of error are systematic, the latter two uncertainties
provide an indication of the spread in film badge readings expected due to the
various orientational factors.
The error factor associated with experimental film badge readings is
determined to be approximately 1.4, based on estimates made in Reference 19; a
somewhat larger factor is estimated for Shot Turk, since neutron data were not
available to allow correction of the gamma data. The error in
interpolation/extrapolation techniques used to determine the gamma doses at
trench locations is range-dependent, with estimated values from 1.1 (when
interpolation is required) to 2.0 (for the long-range extrapolation required for
Shot Turk). The factors used for Shots Moth, Bee, Apple I, and Apple II (3500-
and 4900-yard trenches) reflect the uncertainty in extrapolating from the 502-
and 510-type film data, as discussed previously. It is estimated that the
uncertainty in the gamma trench factors, which relate the above-trench dose to
68

in-trench dose, introduce error factors of 1.2 for 2-foot wide trenches and 1.3
for the 3-foot wide volunteer observer trench in Shot Apple II. The uncertainty
in relating the in-trench gamma dose to film badge reading (for stationary
personnel) is due primarily to variations in body orientation among individuals in
the trench and the placement of the film badge on the body. This error factor
for all observers is estimated to be 1.5.
The final uncertainty in initial gamma dose results from the probability
that the observers stood up in the trenches to observe the rising cloud soon after
the blast effects of the weapon had subsided. It is considered unlikely that
anyone stood up before one second after the blast wave passed the trench
location, because the blast effects and fireball luminosity still would have been
significant. It is also considered probable that most observers were standing by
six seconds after passage of the blast wave. The values of one and six seconds
after passage of the blast wave are therefore considered the 90-percent
confidence limits on standup time. Using a reference standup time of three
seconds after passage of the blast wave, these limits introduce error factors of
1.1-1.3 in the total initial gamma doses.
These gamma dose error factors for shots of interest are as follows:
Source of Uncertainty
Experimental Extrapolation/ Trench Trench Standup Shot Data Interpolation Factor Posture Time
Moth 1.4 1.3 1.2 1.5 1.1
Tesla 1.4 1.1 1.2 1.5 1.2
Turk 1.5 2.0 1.2 1.5 1.2 Bee 1.4 1.5 1.2 1.5 1.2 Apple I 1.4 1.3 1.2 1.5 1.2 Apple II 1.4
2600 yd 1.1 1.3 1.5 1.3 3500 yd 1.3 1.2 1.5 1.2
4900 yd 1.7 1.2 1.5 1.2
Combined Error Factor
1.9
1.8
2.5 2.1
2.0
1.9 1.9
2.2
69

5.1.3 Accuracy of ATR. The ATR4 code used for initial neutron and gamma
radiation environment determination possesses great flexibility in accepting wide
ranges of burst heights, atmospheric densities, source spectra and other
parameters affecting such determination. It also is very fast-running, a
necessary quality for any code used as part of the iterative process described in
Section 3. The ability of the ATR code to replicate measured neutron and
gamma ray dose data at slant ranges of up to 2000 meters is demonstrated in this
and a previous report (Reference 17). However, the ability of the ATR code to
predict dose values beyond the measurements has not been proven. Further,
even in the range where measurements are available, some normalization has
been required to obtain a match between ATR results and such data. Therefore,
in order to gain confidence in the ATR predictive capability at extended ranges,
and to improve the understanding of its application in the ranges where
experimental data exist, a program of comparison between experimental data,
ATR results, and results of computations using state-of-the-art radiation
transport methods has been initiated. This program was not finished as of the
date of publication of this report. Its results will be published in a future report.
Initial results indicate good agreement (difference ,lO percent) between
secondary gamma radiation free-field doses predicted by ATR4 and state-of-the-
art methods at ranges to 3000 meters. On the other hand, initial results for
neutron free-field dose indicate that, in comparison to state-of-the-art methods,
ATR4 overpredicts the neutron dose by 30 and 40 percent at ranges up to 2000
meters for the Teapot (low humidity) and Plumbbob (high humidity) shots,
respectively. At ranges of 3000 meters the overprediction of ATR for these
series is as much as 45 and 85 percent, respectively. Therefore, while ATR
gamma free-field dose is a good representation of that obtained from state-of-
the-art methods, the ATR neutron free-field dose must be regarded as
conservative. However, the present calculational method of normalizing ATR4
results to measured neutron doses by adjustment of neutron output spectra
eliminates much of this discrepancy.
5.2 UNCERTAINTIES IN RESIDUAL RADIATION DOSE
The uncertainty in calculated residual radiation doses arises from two basic
sources: (1) the gamma radiation environment, and (2) the space-time scenario
of troop movements. The 90-percent confidence limits in the gamma intensity,
including the uncertainty in the decay parameter, are provided by the automated
70

procedure described in the appendix. Parametric studies are made using the
automated procedure to determine the influence of scenario variations on
personnel dose.
Errors in position, time, and gamma intensity are not independent because
of the rad-safe constraint limiting troops to intensities of less than 5 r/hr. Troop
positions are well known except with regard to the limit of advance in the
display areas. Because the references do not report which equipment display
lines were inspected by the observers, the assumption is made that all of the
displays within rad-safe limits were inspected. Consequently, the upper limit on
dose is not necessarily obtained by considering the upper confidence limits in
field intensity or by maximizing the number of display lines visited; it is instead
found by considering the scenario variation which maximizes the time spent at or
near the 5 r/hr line.
Other than with regard to the limit of troop advance, there is essentially
no error in dose resulting from uncertainty in troop position. The bounding
azimuths of the equipment display sector have been well identified for each shot
from operation plans, shot area maps, and shot area photographs. For the shots
considered, the uncertainty in angle of troop position within the display sectors
has a negligible influence on dose. That the distances from GZ of the display
lines are known identifies where observers would linger and limits the position of
farthest advance to a few discrete possibilities.
The timing of the observers’ march is generally based on the planned time
of moving out from the trenches and arriving at the pickup point. Reasonable
march speeds and display area stay times are assumed to construct a scenario
consistent with the known times. The most important influence of timing on the
uncertainty in dose is the time spent at the position of greatest gamma intensity.
Consequently, this duration is emphasized in the uncertainty analysis.
Each shot for which the observers encountered residual radiation is
considered separately. The various sources of error cannot be combined
rigorously due to the disparity of their associated distributions. These
distributions may be normal (e.g., _ +5 minutes), lognormal (as for the gamma
71

intensity), or truncated (due to the 5 r/hr limit). Ninety-percent confidence
limits for each area are approximated to be roughly correct for both normal and
lognormal distributions, and the upper and lower limits are treated separately, so
that asymmetrical error bands are permitted.
5.2.1 Shot Tesla. Because the observers are calculated to have reached 5 r/hr at
the lOOO-yard display, the uncertainty in the gamma field could contribute only
to a lower dose. With regard to time, the confidence limits are taken as a five-
minute earlier departure from the trenches to allow five additional minutes at
the IOOO-yard display, and a five-minute later trench departure, with five fewer
minutes at 1000 yards. With regard to intensity, the dose is 1100~~4, mrem;
with regard to time, it is llOO!‘## mrem. The overall 90-percent confidence
limits are approximately 1 lOO+~~~ mrem.
5.2.2 Shot Turk. The uncertainty in the intensity field allows the possibility that
the observers viewed the 500-yard display, despite the absence of photographs at
that range. If the entire breadth of the 500-yard display was viewed, the
additional dose could have been as much as 980 mrem. Because of uncertainty in
the intensity field, the dose resulting from the walk forward to the lOOO-yard
display could be as much as 600 mrem less than that calculated. Uncertainty in
timing results in little increase in the confidence limits, which are approximately
1 240+1000mrem -600 ’
5.2.3 Shot Bee. Because the innermost Bee display stretched from 500 to 700
yards from GZ, the observers would have been able to view some equipment at
the 5 r/hr line for all intensity fields within the confidence limits. The only
influence of the uncertainty in intensity is with regard to the walking time
required to reach the 5 r/hr line. This could have varied +3 minutes, and
probably would have been reflected in the time spent at the 5 r/hr line. With
regard to time alone, the same _ +5 minutes perturbation to the scenario is
assumed as for Shot Tesla. Thus, the confidence limits on intensity imply a dose
of 830+180 mrem; those on time imply 8302300 mrem. The overall 90-percent
confidence limits are approximately 83OL350 mrem.
5.2.4 Shot Ess. The uncertainty in dose to the Ess observers is almost entirely
due to the uncertainty in the Turk fallout field intensity. For this, the 90-
72

percent confidence limits yield a dose calculation of 43 f:T mrem. The truck
speed while crossing the Turk hotline is probably estimated to within 20 percent,
and the uncertainty in time spent at the observation position is about 10 percent
(because the observers were in position a full 1% hours before detonation).
These, each of which applies only to part of the dose, add negligibly to the
overall uncertainty in dose.
5.2.5 Shot Apple I. For Apple I, the innermost equipment display was at an
intensity of less than 5 r/hr, for all gamma fields within the 90-percent
confidence limits of intensity. Consequently, the observers are certain to have
walked to this display, but no farther. For the assumed scenario, the gamma
intensity uncertainty implies a dose of 84 r,‘,” mrem. For the calculated
intensity field, _ +5 minutes at the innermost display implies 84230 mrem. The
overall 90-percent confidence limits are approximately 84:;: mrem.
5.2.6 Shot Apple II. There is considerable uncertainty in the Apple II intensity
field. Near the upper intensity limit, the lOOO-yard display which the observers
are presumed to have reached would have had an intensity of about 5 r/hr. Near
the lower intensity limit, the observers would have been able to reach the
500-yard display. In order to obtain a lower limit on dose, it must be assumed
that the intensity field was such that the 500-yard display was just over 5 r/hr
(as could have been determined by rad-safe monitors preceding the observers),
and that the observers did not advance beyond the lOOO-yard line. These imply
180 +430
-70 mrem. The planned duration of the walk-through did not allow time for
stopping at any of the displays. Therefore, only an upper limit on time, allowing
five minutes at each display, is calculated. For the computed intensity field,
these stops would increase the dose by 150 mrem. The approximate overall 90-
percent confidence limits are 180 +450
_70 mrem. See also below.
5.3 TOTAL MEAN DOSE SUMMARY
The reconstructed neutron and gamma doses for Operation Teapot
observers are presented in Table 5- 1. From the best-estimate doses of Sections
3 and 4, and the error distribution of this section, the mean neutron and gamma
doses for each observer group are calculated. These are presented in the table
with estimated 90-percent confidence limits. The doses are not added because
73

Table 5-l Observer Dose Summary*
Shot
Moth
Tesla
Turk
Bee
Ess
Apple I
Apple II Vol. Obs.
Trp. Obs.
VIP Obs.
Neutron Dose (rem)
0 . 16 +0.07 -0.05
1 4 +0.6 . -0.5
0
0 010 +0.005 . -0.003
0
+0.04 1 o*029 -0.021
+5.4 4.5 -3.0
+0.090 o*063 -0.047
< 0.001
Initial Gamma Dose (rem)
0 . 067 +0.051 -0.034
0 . 29 +O.*O -0.14
< 0.001
o 020 +0.018 . -0.011
0
o 031 +0.025 . -0.017
1 3. +0.98 . -0.67
+0.045 Ooo5* -0.030
N 0.001
Residual Gamma Dose (rem)
- 0.001
+0.4 lo1 -0.5
1 3 +0.9 . -0.7
0.83 + 0.35
+0.02 0*04 -0.01
+0.072 ‘*09* -0.058
+0.29 o*34 -0.23
o 34 +0.29 .
-0.23
0
Total Gamma Dose (rem)
+0.05 0*07 -0.04
+0.4 lo4 -0.5
1 3 +0.9 . -0.7
0.85 LO.35
+0.02 0*04 -0.01
o . 12 +0.08
-0.06
1 6 +l.O .
-0.7
+0.30 o-4’ -0.23
0.001
*Reconstructed mean film badge dose, except for mean neutron dose.
74

the neutron dose would not have been recorded by film badges. It should be
noted that the mean dose and the best estimate dose may differ according to the
error distribution. For most shots, the difference is on the order of 10 percent.
For Shot Apple II, however, the highly asymmetric error distribution results in a
calculated mean that is nearly twice the best estimate.
75


Section 6
CONCLUSIONS
Of the nine shots of Operation Teapot in which Desert Rock observers
participated, only four were significant in terms of radiation dose accrued.
These were Shots Tesla, Turk, and Bee for troop observers, and Shot Apple II for
the volunteer observers, for which the calculated mean gamma film badge doses
are 1.4, 1.3, 0.85, and 1.6 rem, respectively. For these shots, the calculated
mean neutron doses are 1.4, 0, 0.01, and 4.5 rem, respectively. From the neutron
doses, it is seen that Shot Tesla offered the highest initial radiation dose to troop
observers, probably due in part to the higher-than-anticipated shot yield of 7 KT
(vs. 2 KT expected). Shots Tesla and Turk contributed the highest residual dose
to observers as they inspected the post-shot eqipment displays. When confidence
limits are applied to the above calculations, the upper limits of gamma dose for
Shots Tesla, Turk, Bee, and Apple II are calculated to be 1.8, 2.2, 1.2, and 2.6
rem, respectively. Upper confidence limits for neutron dose are 2.0 and 9.9 rem
for Shots Tesla and Apple II (volunteers), respectively.
As might be expected, the volunteer observers at Shot Apple II received
the highest gamma and neutron radiation doses. Although their exposure criteria
were higher (10 rem, 5 rem of which could be initial) than for the other
observers, it would appear that their calculated mean doses of 1.6 rem gamma
and 4.5 rem neutron did not significantly exceed the regular troop exposure limit
of 6 rem. If upper limits are considered, the doses of 2.6 rem gamma and 9.9
rem neutron result in a 25-percent overdose, however improbable.
Only limited dosimetric information is available for comparison with
calculated doses. Although no specific details are provided, Reference 13 states
that the average film badge reading for the volunteer observers at Shot Apple II
was 1.3 rem. It is noted that the calculated film badge gamma dose of 1.6
(0.9-2.6) rem compares very favorably with the average reading. Data on Marine
participants at Shot Bee include 10 officer observers with film badge readings
(within 10 percent) of 0.54 rem, in reasonable agreement with the calculated
77

film badge dose of 0.85 (0.5-1.2) rem. Because of the few personnel involved,
these comparisons are considered insufficient to establish overall correlation
with all calculated doses for all shots.
7%

Section 7
REFERENCES
1.
2.
3.
4.
5.
6.
7.
8.
9.
10.
11.
12.
13.
14.
15.
16.
17.
18.
“Exercise Desert Rock VI, Final Report of Operations,” Headquarters, Exercise Desert Rock VI, Las Vegas, Nevada, 23 May 1955.
Operation Order No. 1 (Shot Turk), Desert Rock VI, 5 February 1955.
Operation Order No. 2 (Shot Wasp), Desert Rock VI, 15 February 1955.
Operation Order No. 3 (Shot Moth), Desert Rock VI, 21 February 1955.
Operation Order No. 4 (Shot Tesla), Desert Rock VI, 5 February 1955.
Operation Order No. 5 (Shot Apple), Desert Rock VI, 10 March 1955.
Operation Order No. 6 (Shot Bee), Desert Rock VI, 19 March 1955.
Operation Order No. 7 (Shot Ess), Desert Rock VI, 21 March 1955.
Operation Order No. 8 (Shot MET), Desert Rock VI, 6 April 1955.
Operation Order No. 9 (Shot Apple II), Desert Rock VI, 25 April 1955.
Operation Plan l-55 (Shot Bee), Headquarters, 3d Marine Corps Provisional Atomic Exercise Brigade, Camp Pendleton, California, 23 February 1955.
“Radiological Safety, Operation Teapot,” Headquarters, Field Command, AFSW P, May 1955.
“Report of the Test Manager, Joint Test Organization, Operation Teapot,” Atomic Energy Commission, Nevada Test Site, Spring 1955.
“Operational Summary,” Operation Teapot, Nevada Test Site, WT-1158, Headquarters Field Command, AFSWP, July 1955.
“Report of the Test Director, Operation Teapot,” LA 1966, Los Alamos Scientific Laboratory, October 1955.
“Compilation of Local Fallout Data from Nuclear Test Detonations, 1945- 1962,” Volume I - Continental U.S. Tests, DNA 1251-I-EX, Defense Nuclear Agency, 1 May 1979.
“Analysis of Radiation Exposure for Task Force WARRIOR, Shot Smoky, Exercise Desert Rock VII-VIII, Operation Plumbbob,” DNA 4747F, Defense Nuclear Agency, 31 May 1979.
“Analysis of Radiation Exposure for Task Force BIG BANG, Shot Galileo, Exercise Desert Rock VII-VIII, Operation Plumbbob,” DNA 4772F, Defense Nuclear Agency, 9 April 1980.

19. “Initial Gamma Data from Nuclear Weapon Tests, 1948-1962,” U.S. Army Nuclear Defense Laboratory, (Unpublished).
20. “Neutron Flux Measurements,” Project 2.2, Operation Teapot, Field Command, AFSW P (Unpublished).
21. “Physical Measurements of Neutron and Gamma Radiation Dose from High Neutron Yield Weapons and Correlation of Dose with Biological Effect,” Civil Effects Test Group (Unpublished).
22. “Version 4 of ATR (Air Transport of Radiation),” DNA 3995, Defense Nuclear Agency, January 1976.
23. “Energy Dependent Air/Ground Correction Factors for the ATR (Air Transport of Radiation) Code,” BRL Report No. 345, U.S. Army Ballistic Research Laboratory, August 1977.
24. “Radiation Environments from Tactical Nuclear Weapons,” DNA 4268F, Defense Nuclear Agency, July 1976.
25. “The MORSE Code with Combinatorial Geometry,” DNA 2860T, Defense Nuclear Agency, May 1972.
26. “The MORSE Monte Carlo Radiation Transport Code System,” ORNL-4972, Oak Ridge National Laboratory, February 1975.
27. “External Neutron Measurements, 1952 through 1958,” U.S. Army Chemical Warfare Laboratory (Unpublished).
28. “DNA Nuclear Weapons Output Handbook,” Defense Nuclear Agency (Unpublished).
29. “The Resuspension of Particulate Material from Surfaces,” in Proceedings of a Symposium on Surface Contamination, Gatlinburg, Tennessee, June 1964, Pergamon Press, New York.
30. “Time-Dependent Neutron and Secondary Gamma-Ray Transport in an Air- Ground Geometry,” ORNL-4289, Oak Ridge National Laboratory, September 1968.
31. “Analysis of Radiation Exposure for Troop Observers,” Exercise Desert Rock V, Operation Upshot-Knothole, Draft Final Report, Science Applica- tions, Inc., McLean, VA, 28 April 1981.
32. “Protection Against Neutron Radiation,” NCRP Report No. 38, January 1971.
33. “NUIDEA - A Computer Code for the Prediction of Radiation, Blast, and Thermal Environments from Nuclear Weapons,” Science Applications, Inc., 19 November 1975.
34. “Shielding Studies,” Project 2.7, Operation Teapot, Chemical Warfare Laboratories, Army Chemical Center, MD (Unpublished).
EO
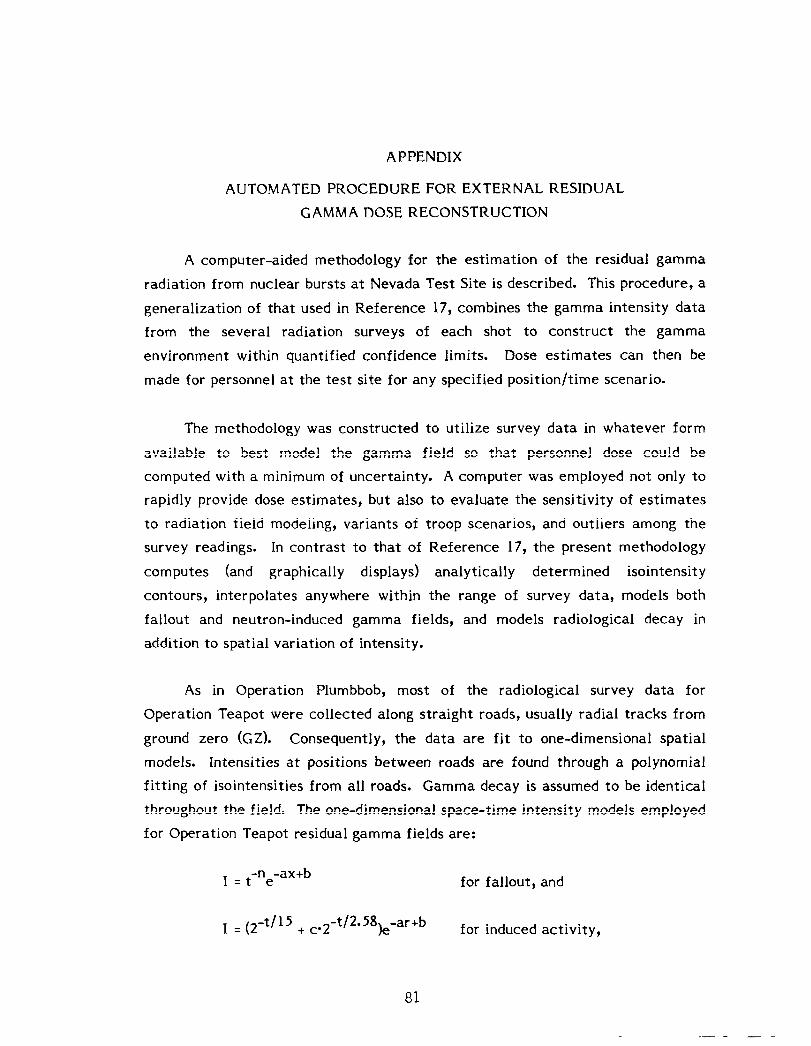
APPENDIX
AUTOMATED PROCEDURE FOR EXTERNAL RESIDUAL
GAMMA DOSE RECONSTRUCTION
A computer-aided methodology for the estimation of the residual gamma
radiation from nuclear bursts at Nevada Test Site is described. This procedure, a
generalization of that used in Reference 17, combines the gamma intensity data
from the several radiation surveys of each shot to construct the gamma
environment within quantified confidence limits. Dose estimates can then be
made for personnel at the test site for any specified position/time scenario.
The methodology was constructed to utilize survey data in whatever form
available to best model the gamma field so that personnel dose could be
computed with a minimum of uncertainty. A computer was employed not only to
rapidly provide dose estimates, but also to evaluate the sensitivity of estimates
to radiation field modeling, variants of troop scenarios, and outliers among the
survey readings. In contrast to that of Reference 17, the present methodology
computes (and graphically displays) analytically determined isointensity
contours, interpolates anywhere within the range of survey data, models both
fallout and neutron-induced gamma fields, and models radiological decay in
addition to spatial variation of intensity.
As in Operation Plumbbob, most of the radiological survey data for
Operation Teapot were collected along straight roads, usually radial tracks from
ground zero (GZ). Consequently, the data are fit to one-dimensional spatial
models. Intensities at positions between roads are found through a polynomial
fitting of isointensities from all roads. Gamma decay is assumed to be identical
throughout the field. The one-dimensional space-time intensity models employed
for Operation Teapot residual gamma fields are:
-n -ax+b I=t e for fallout, and
I = (,-t/l5 + c.2-t/2.58Je-ar+b for induced activity,
81

where I = gamma intensity (r/hr)
t = time in hours after burst
r = slant range from burst
x = distance from an arbitrary origin
a,b,c,n are parameters determined from data fitting.
The automated procedure permitted fallout data to be combined in the
absence of independent decay information (that was available from Operation
Plumbbob for use in Reference 17). The quality and quantity of the survey
readings determined the level of detail to which power law modeling (t’“) could
be used for gamma decay. It was not possible to obtain a statistically significant
value of n for each interval between surveys, nor was it possible (for the entire
period of surveys) for data along individual roads. Consequently, the one best
fitting n for all of the given shot’s data was determined; this was done by
averaging the values found for each road, weighted according to the quantity of
data available along each road. The data for each road, which had been fit
according to multiple linear regression of the logarithmic form of the model,
were then refit with the imposed time decay by linear regression in the spatial
variable only.
The model for induced
radioisotopes of consequence to
activity incorporates the decay of the only
military maneuvering in neutron-activated areas -_ of Nevada Test Site: Na24 (tl,* = 15.0 hr) and Mn56 (t 1,2 = 2.58 hr). As stated,
the model cannot be linearized; however, linear regression can be performed
after decoupling the Na and Mn contributions. Because surveys performed from
one to about five days after the shot reflect almost entirely Na 24 activity, a fit
is obtained for this isotope alone in this timeframe. With parameters a and b
already determined, c is found from the best fit to shot-day data. Only a single
value of c for the entire field is statistically significant.
The spatial factor in both models is a simple exponential form. For
induced fields, the actual distance from the point of burst is the appropriate
scale. Simple physical reasoning based on a uniform, isotropic, neutron-
a2

attenuating medium would indicate inclusion of an additional factor of l/r*.
However, the presence of the ground, its orientation relative to the burst point,
and the depth distribution of the activated nuclei makes analysis of the
intensity-distance relationship far more complex. The form chosen fits the data
at least as well as a more complicated model. For fallout fields, the exponential
form is purely empirical. It best applies where intensity gradients are large.
The addition of a quadratic term to the exponent does not significantly improve
the fit (as reported in Reference 171, but its inclusion is vital to analysis of data
sets which approach or span the hotline (axis of fallout). For these, the Gaussian
form so obtained generally provides the best fit of linearizable functions.
Intensities at positions not on survey roads are found from interpolation of
the fitted data along neighboring roads. The interpolation is accomplished
through a three-step procedure: (1) the position of the 10, 100, 1000, and 10000
mr/hr intensities is determined on each survey road at a standardized time; (2)
isointensity contours are constructed from analytical functions in which range
(slant range for induced fields) from GZ is expressed as a cubic polynomial in
azimuth around GZ; a six-pointed scheme that produces smooth contours is used;
and (3) the ranges of these contours for the azimuth of any specified position
define intercepts which determine parameters of the applicable model along that
azimuth; the intensity at the desired position and time is then obtained directly
from the model. Contours are displayed graphically so that they can be
compared with hand-drawn contours accompanying the raw survey data, be
checked for consistency with personnel dose calculations, and indicate
contaminated areas of Nevada Test Site that could be relevant to subsequent
military operations. Contours can be displayed with standardized intensity levels
for any time of interest.
Personnel dose is computed by time-integration
encountered by troops present in a gamma field. The troops
and time through the field in small, discrete steps. The
of the intensity
are traced in space
intensity and time
interval associated with each step determine the incremental dose accrued for
that step. Wide latitude is allowed in the type of position-time data required to
83

specify the troop scenario. A sample output of the dose calculation concludes
this appendix (Figure A-l).
The automated procedure quantifies uncertainties associated with the
computed gamma environment. (These are combined with the uncertainties in
the troop activity scenario to determine overall confidence limits in the
reconstructed personnel dose). In contrast to Reference 17, in which one
approximate parameter characterizes an entire gamma field, the computer
permits a point-by-point determination of uncertainty. The standard error of the
model, as a function of position and time, is calculated in conjunction with the
regression along survey roads. Off these roads, standard error is found by a
linear interpolation along contours followed by a linear interpolation between
contours on the azimuth of interest. Between roads, an additional source of
error in the gamma intensity results from the manner in which contours are
computed. An approximate measure of this error is found by comparison with an
alternate means of curve fitting, for example the cubic polynomial determined
by four neighboring isointensity points. The implied deviation in intensity by the
displaced contour is used to estimate the curve fitting error. The overall
uncertainty in intensity is used at each step in incrementing the dose. These
errors are simply added from step to step; this approach is preferred because the
intensity error along a troop path is much more likely to be systematic than
random with each integration step.
It is cautioned that the error analysis is no better than the models to
which the radiological survey data are fit. Diagnostic printouts of statistical
parameters ensured that the choice of models was sound and that outliers which
significantly influenced the regressions and uncertainty analysis could be
identified and disregarded. Nevertheless, the confidence in the models and the
statistics associated therewith is minimal beyond the range of times and
distances at which the surveys were taken. In practice, this is of little
importance--far from GZ the intensities make an insignificant contribution to
personnel dose, and rarely did troops penetrate closer to CZ than where surveys
were made.
84

Figure A-l is a printout of a dose reconstruction (for Shot Tesla) that
displays the variations in uncertainty with position and time. For intensities less
than 0.1 mr/hr, dose calculations are suppressed. The totals are to be multiplied
by the conversion factor of 0.7 to obtain film badge dose.
85

WtiICh DATA FILE DO YOU WISH TO ACCESS? 3 INPUT 1 TO GET INPUT DATA PRINTS 0 ;NTER I TO GET DOSCAL DEBUGGING PRINTS
ENTER 1 TO GET DEBUGGING PRINTS 0 NTPR INTEGRATION PROGRAM VERSION 2 -- CUBIC MODEL SELECT OPTION--I. .DEFINE MODEL
2 3: ’
.DEFINE HOT-LINE SECTOR
.CRAPHICAL DISPLAY AT REFERENCE TInE
;* : SET PRINT DETAIL
6: ’ PERFORM DOSE INTEGRATION
. STOP 1
THE FOLLOWlNG VALUES HAVE BEEN JNPUT FROn TAPE:
SLANT RANGE FLAG= 0 HOB= 100
TIILITARY COORDINATE OF GZ= 844090
MODEL p = 1 REFERENCE TIME= 12 C-VALUETfor flodelP21,FINAL C-VALUETfor nodelnST,or DECAY RATElfor Modelal or 3)~ -1 .I633
ENTER I TO CHANGE VALUES, OTHERWISE ENTER 0 0 ENlER CONTOURS TO BE OPEN ENDED BY ENTERING ALL CONTOUR INTENS!TIES IN ASCEhOING ORDER ENTERING A 0 FOR CONTOURS Tt-iAT ARE OPEN ENDED, EG 0,2,3,4 0,0.0,0
Figure A-l. Sample Computer Printout of Dose Determination Procedure
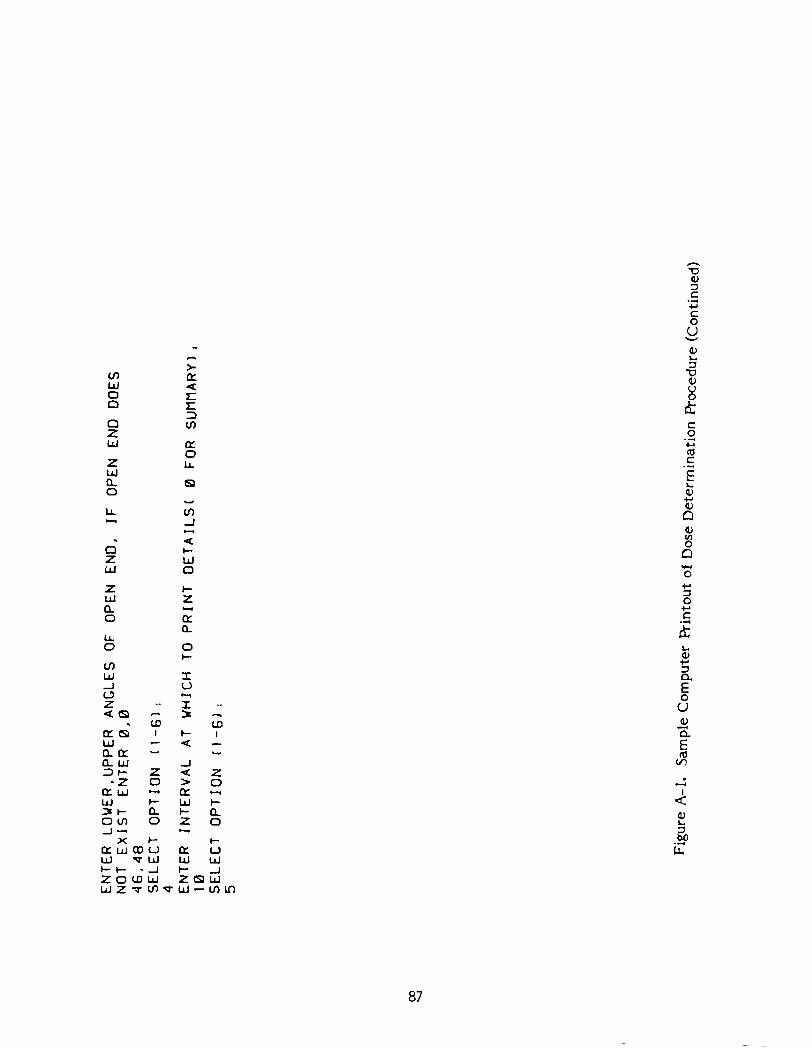
87

rf*START OF TRACKS** DEFINE THE FIRST LINE SEGTIENT OF THE TRACK ENTER START TIME, IN HOURS AFTER H-HOUR:
333 SELECT TlETHOD OF SPECIFYING START POINT
MILITARY COORDINATE ~OEGREES FROM N , AND YARDS FROtl GZ 2 ENTER START POINT, iN DEGREES FROM N AND YARDS FROtl GZ 235.2400 SELECT METHOD OF SPECIFYING DIRECTION OF MOVEMENT 1 . . . END POINT IN MILITARY COORDINATES
.END POINT IN DECREES FROM N AND YARDS FROM CZ ?. 2’
DEGREES FROfl N RELATIVE TO START POINT
ENTER END POINT IN DEGREES FROM N AND YARDS FROM GZ: 235,1000 SELECT nETHOD OF SPECIFYING TIME ON SEGTlENT-- I . . . VELOCITY [in TIPHI 2 . ELAPSED T IME 3:‘. VELOCITY Iin YARDS PER MINUTE1 2 ENTER ELAPSED TIME IN HOURS:
5 SELECT STOPPING RULE-- 1 . . . WHEN REACH END POINT 2 . . . WHEN EXCEED SPECIFIED DOSE RATE 3 . * . WHEN FALL BELOW SPECIFIED DOSE RATE 4 . * . WHEN HAVE CONE SPECIFlED DISTANCE FROM START POINT 1 ENTER INTECRATJON INCREMENT IN YARDS: 10
Figure A-l. Sample Computer Printout of Dose Determination Procedure (Continued)

TIME AT YARDS INC INC END FROM
II [HRS) START 1 0 34 10
10 0.37 100 20 0.40 200 30 0.44 300 40 0.48 400 50 0.51 500 60 0.55 600 70 0.58 700 80 0.62 800 90 0.65 900
100 0.69 1000 I I0 0.73 1100 120 0.76 1200 130 0.80 1300 140 0.83 1400
ANGLE 235.0 235.0 235.0 235.0 235 0 235.0 235 0 235.0 235.0 235.0 235.0 235.0 235.0 235.0 235.0
YARDS FROM
cz 2390 2300 2200 2100 2000 1900 1800 1700 1600 1500 1400 1300 1200 1100 1000
JNC DOSE RATES (llR/HRI
START END 0 0 0 0 0 0 7 7
:: ;z 39 41 70 74
128 136 233 248 427 454 785 835
1448 I540 2677 2847 4963 5280
curl DOSE lflR1
0 0 0 0 0
:
; 14 26 47 87
161 297
ERROR FACTOR
0.000 0.000 0.000 2.093 1,989 1 .897 1.818 1 * 754 1 .705 1 .672 1 .657 1 .660 1.681 1 .720 1 .775
CONF I DENCE LInITS
LOWER UPPER 0 0 0 0 0 0 0 0 0 1 I 2
: 4 8 ii 24 14
15 44 28 80 i; 272 147
173 511
INTEGRATION ALONG THIS SEGMENT STOPPED WITH
DISTANCE FROfl START IS 1400.0 YARDS
CURRENT POSITION IS 235.0 DEGREES 1000.0 YARDS FROM CZ
MILITARY COORDINATE IS 837085
ENTER I.... TO SPECIFY STAY TIME AT THIS POINT 2 . . * . TO SPECIFY THE NEXT SEGMENT OF THE TRACK 3 . . * . TO END THIS TRACK
Figure A-l. Sample Computer Printout of Dose Determination Procedure (Continued)

ENTER STAY TIME AND INTEGRATION INCREMENT BOTH IN HOURS.
25, .01
TIME AT YARDS YARDS INC DOSE RATES CUM CONF SCIENCE INC INC END FROM FROM IMR/HRl DOSE ERROR LIMITS
CT (HRSI START ANGLE CZ START END (MR) FACTOR LOWER UPPER I 0.84 1400 235 0 1000 5280 5207 350 1 ,782 203 605
IQ 0.93 1400 235.0 1000 4686 4628 795 I * 757 454 1391 20 1 .03 1400 235.0 1000 4158 4111 1233 1.732 706 2156 26 I .08 1400 235.0 f 000 389 1 389 I 1434 1.719 822 2503
CURRENT POSITION IS 235.0 DEGREES 1000.0 YARDS FROM GZ
MILITARY COORDINATE IS 837085
s ENTER 1. . . . TO SPECIFY STAY TIME AT THIS POINT
2 # . * TO SPECIFY THE NEXT SEGMENT OF THE TRACK 3 . . . . TO END THIS TRACK
2 SELECT METHOD OF SPECIFYING DIRECTION OF ROVEMENT 1. . END POINT IN MILITARY COORDINATES 2 . . . END POINT IN DEGREES FROM N AND YARDS FROM GZ 3 . . DEGREES FROM N RELATIVE TO START POINT 2 ENTER END POINT IN DEGREES FROM N AND YARDS FROM GZ, 235.2400 SELECT METHOD OF SPECIFYING TIME ON SEGtlENT-- I. . VELOCITY (in MPH) 2. ELAPSED TIME 3. VELOCITY Iin YARDS PEP tlJNlJTEl 2
Figure A-l. Sample Computer Printout of Dose Determination Procedure (Continued)

91

TIME AT YARDS YARDS INC DOSE RATES INC INC EN0 FROfl FROtI (tIR/HR)
ID IHRSl START ANGLE GZ START EN0 I I 09 10 235.0 1010
10 1.12 100 235.0 1100 20 1.15 200 235.0 1200 30 I,19 300 235.0 1300 40 1 .23 400 235.0 1400 50 1 .26 500 235.0 1500 60 1 .30 600 23510 1600 70 1.33 700 235,0 1700 80 1.37 800 235.0 1800 90 1.40 900 235.0 1900
100 1.44 1000 235.0 2000 110 1 .48 1100 235.0 2100 120 1.51 1200 235.0 2200 130 1.55 1300 235.0 2300 140 1 58 1400 235.0 2400
389 I 2060 1018
504 250 124
61 31 15
8 4 2 0
:
3625 1920
949 470 233 115
57 28 14
7
;
: 0
CUtJ DOSE [fIRI I448 1538 1588 1614 1626 1632 1635 1637 1638 1638 1638 1638 1638 1638 I638
ERROR FACTOR
1.719 1.656 1.606 1.578 1.573 1.592 1 .633 1.695 1.775 1.873 1 .988 2.118 0.000 0.000 0.000
CONF I OENCE LIMITS
LOWER UPPER 830 2526 883 2677 915 2760 930 2800 938 2820 942 2830 944 2835 945 2837 946 2838 946 2839 946 2839 946 2840 946 2840 946 2840 946 2840
INTEGRATION ALONG THIS SEGMENT STOPPED WITH
DISTANCE FROfl START IS 1400.0 YAROS
CURRENT POSITION IS 235.0 DEGREES 2400.0 YARDS FROtl GZ
MILITARY COORDINATE IS 826077
ENTER 1. , , . TO SPECIFY STAY TIME AT THIS POINT 2. . TO SPECIFY THE NEXT SEGflENT OF THE TRACK 3 , . . TO EN0 THIS TRACK
3 u*+E!JO OF TRACp*FS*
Figure A-l. Sample Computer Printout of Dose Determination Procedure (Continued)
DISTRIBUTION LIST
DEPARTMENT OF DEFENSE
Armed Forces Institute of Pathology ATTN: Radiation Pathology Br ATTN: Director
Armed Forces Radiobiology Rsch Institute ATTN: Director ATTN: Tech Director
Assistant Secretary of Defense ATTN. ASD(PA)
Assistant Secretary of Defense ATTN: ASD(HA)
Assistant Secretary of Defense ATTN: ASD(LA)
Assistant to the Secretary of Oefense Atomic Energy
ATTN: Executive Assistant
Defense Nuclear Agency ATTN: STNA ATTN. Dlrector ATTN: GC ATTN: STSP ATTN: PA0 ATTN: RAEE
2 cy ATTN: STBE 4 cy ATTN: TITL 4 cy ATTN: NATO
Defense Tech Info Ctr 12 cy ATTN: DD
Deputy Asst Secretary of Defense ATTN: DASD, EE&S
Field Command Defense Nuclear Agency
ATTN: FCTOF ATTN. FCTT, W. Summa ATTN: FCTOF, MAJ Evinrude ATTN: FCTT, G. Ganong ATTN: FCPR. J. McDaniel ATTN: FCLS
Field Command Defense Nuclear Agency Livermore Br
ATTN: FC-1
Field Command Defense Nuclear Agency Los Alamos Br
ATTN: MS-635 FC-2
Interservice Nuclear Weapons School ATTN. TTV
Under Secretary Of Defense Rsch & Engrg ATTN: DUSDRE, Rsch & Adv Tech
DEPARTMENT OF THE ARMY
Headquarters Department of the Army 5 cy ATTN: DAAG-AMR, ANTPR
Harry Diamond Labs ATTN: DELHD-TA-L, 81100
Office of the Chief of Staff Department of the Army
ATTN: DACS-DMZ-A, T. Green
US Army Ballistic Rsch Labs ATTN: DRDAR-BLB, J. Maloney
US Army Medical Rsch & Dev Cmd ATTN: SGRD-SD
US Army Nuclear & Chemical Agency ATTN: C. Davidson
Walter Reed Army Medical Ctr ATTN: Library
DEPARTMENT OF THE NAVY
Bureau of Medicine and Surgery ATTN: NM&S-09 ATTN: NM&S-O0 ATTN: NM&S-3022
National Naval Medical Ctr
Naval
Naval
Naval
Naval
Naval
ATTN: Dept of Radiology ATTN: Medical Library
Medical Rsch Institute ATTN: Tech Ref Library
Ocean Systems Ctr ATTN: Rsch Library
Sea Systems Command ATTN. SEA-08, M. Miles
Surface Weapons Ctr ATTN. Code F31, D Levine
Weapons Evaluation Facility ATTN: G. Binns
Navy Nuclear Test Personnel Review 5 cy ATTN: W. Loettler
Office of the Chief of Naval Operations ATTN: NOP 098, VADM, Monroe
DEPARTMENT OF THE AIR FORCE
Aerospace Medical Division ATTN. Library, SCL-4
Air Force Nuclear Test Personnel Review 4 cy ATTN: P. Fallon
93

DEPARTMENT OF THE AIR FORCE (Continued)
Air University ATTN: ENP, J. Bridgeman ATTN. Library
Air Force Weapons Lab ATTN. NT ATTN: SUL ATTN: DYT
Air Unlverslty Library ATTN AUL-LSE
HQ USAF/SG ATTN M. Chesney
US Air Force Occupational & Env Health Lab ATTN: CC
4 cy ATTN: AFNTPR
USAF School of Aerospace Medicine ATTN: J. Pickering
DEPARTMENT OF ENERGY
Albuquerque Operations Office ATTN: R Cuddlhy
Nevada Operations Office ATTN Health Physics Div ATTN: L. O'Neal ATTN: B. Church ATTN Public Affairs
Department of Energy ATTN. OMA, G. Facer
Human Health & Assessments Div, EV-31 ATTN: H. Hollister, EV-4 ATTN: C. Edlngton, EV-31 ATTN: N Barr, EV-32 ATTN. J. Thiesen, EV-32 ATTN: J. Viren, EV-32 ATTN: W. Burr, EV-2 ATTN: R. Clusen, EV-1 ATTN: Tech Info Ctr, E-201 ATTN: B. Wachholz, EV-30 ATTN: J. Blair, EV-32 ATTN: J. Whltnah. EV-50
2 cy ATTN: W. Weyzen,.EV-31
OTHER GOVERNMENT AGENCIES
Cancer Ctr, NIH ATTN. A Knudson
US Public Health Service ATTN: Consolidated Surveillance ATTN: K. Chol
2 cy ATTN: G. Caldwell
Central Intelligence Agency ATTN: Office of Medical Services
Oepartment of Commerce National Bureau of Standards
ATTN: J. Hubell
Department of Health & Human Services ATTN: Dfc of Regulation Review
OTHER GOVERNMENT AGENCIES (Continued)
Department of Health & Human Services ATTN: R. Murphy
Department of Health & Human Services ATTN: J. Vlllforth, HFX-1 ATTN: G. Johnson, HFX-4
Enviromental Protection Agency ATTN: T. Thorslund, RO-689
Environmental Protection Agency ATTN: J. Knelson
Environmental Protection Agency ATTN: W. Mills, ANR-460 ATTN: W. Ellett, ANR-460 ATTN: D. Rosendaum, ANR-458 ATTN: N. Nelson, ANR-460
Federal Emergency Management Agency ATTN: Emerg Oper Sys Dlv, J. Kerr
Library of Congress ATTN. Science & Technology Dlv
National Cancer Institute, NIH ATTN: R. Miller ATTN: G. Beebe
National Cancer Institute, NIH ATTN: W. Blot ATTN: J. Fraumeni ATTN: C. Land
National Cancer Institute, NIH ATTN: J. Gart
National Cancer Institute, NIH ATTN: A. Rabson
National Institute of Health ATTN. Library, Acq Unit
National Library of Medicine, NIH ATTN Library
Nat1 Heart, Lung & Blood Institute. NIH ATTN: W. Zukel
Office of Technology Assessment ATTN: P. Sharfman
Office on Smoking & Health ATTN. J. Pinney
State Department of Public Health ATTN: R. Paffenberger
US House of Representatives ATTN. Subcommittee on Mil Per & Comp
US House of Representatives ATTN: Subcommittee on Health & Envir
US Public Health Service ATTN: Library
US Public Health Service Hospital ATTN: E. Nlshlmura
94

OTHER GOVERNMENT AGENCIES (Continued)
US Public Health Service Hospital ATTN: T. Robertson
US Senate ATTN: C. Cowart
US Senate ATTN: W. Brew
US Senate ATTN: S. Ulm, Senate Court
Veterans Admin Medical Ctr ATTN: K. Lee
Veterans Admin Medical Ctr ATTN: D. McGregor
Veterans Admin Medical Ctr ATTN: C. Tessmer
Veternas Admin Wadsworth Hospital Ctr ATTN: T. Maklnodan
Veterans Administration ATTN: L. Hobson ATTN: J. Donsbach
2 cy ATTN: D. Starbuck
The White House ATTN: Oft of Policy Dev (DP)
OTHERS
Oak Ridge Associated Universities ATTN: M. Garber
Oak Ridge Associated Universities ATTN: D. Lushbaugh ATTN: J. Totter ATTN: E. Tompkins
University of Utah ATTN: Library
University of Utah ATTN: Library
DEPARTMENT OF ENERGY CONTRACTORS
Argonne National Lab ATTN: P. Failla ATTN: A. Brues ATTN: D. Grahn
Brookhaven National Lab ATTN: V. Bond ATTN: M. Bender ATTN: A. Brill
University of California Lawrence Livermore National Lab
ATTN: Tech Info Dept, Library ATTN: L. Anspaugh ATTN. Y. Ng
DEPARTMENT OF ENERGY CONTRACTORS (Continued)
Los Alamos National Lab ATTN: J. Dummer ATTN: MS218, P. Whalen ATTN: M/S634, T. Dowler ATTN. Library
2 cy ATTN. E. Young
Oak Ridge National Lab ATTN: F. Malenshun ATTN: J. Auxier ATTN: Central Rsch Library ATTN: C. Clifford ATTN: G. Kerr ATTN. X-10. Lab Records Dlv ATTN. C. Richmond
Reynolds Electrical and Engr Co, Inc ATTN: Coord & Info Ctr ATTN: J Brady
Sandia National Lab ATTN. Div 1314, S. Durpee ATTN: D Aldridge
DEPARTMENT OF DEFENSE CONTRACTORS
Advanced Rsch & Applications Corp ATTN: R Armlstead
BDM Corp ATTN: J Braddock
Energy Systems, Inc ATTN. W. Ogle
JAYCOR ATTN. J. Ozeroff
JAYCOR ATTN: J. Sperling
JAYCOR ATTN: J. Soukup
Kaman Tempo ATTN: DASIAC
3 cy ATTN: E. Martin
Kaman Tempo ATTN: W. Alfonte
National Academy of Sciences ATTN: National Materials Advisory Brd ATTN: S. Jablon
7 cy ATTN: C. Robinette
Pacific-Sierra Rsch Corp ATTN: H. Brode, Chairman SAGE
R & 0 Associates ATTN. J. Marcum ATTN: P. Haas ATTN: A. Latter
Rand Corp ATTN: Library
Oak Ridge National Lab ATTN: T. Jones
95

DEPARTMENT OF DEFENSE CONTRACTORS (Continued)
Science Applications, Inc ATTN: E. Straker ATTN: W. Scott ATTN: G. Reynolds ATTN: W. Woolson
Science Applications, Inc ATTN: W. McRaney ATTN: J. Cockayne
2 cy ATTN: J. Goetz 2 cy ATTN: 3. Klemm 2 cy ATTN: D. Kaul 2 cy ATTN: R. Weitz 5 cy ATTN: J. McGahan
DEPARTMENT OF DEFENSE CONTRACTORS (Contlnued)
Science Applications, Inc ATTN: D. Kaul
Scientific Info Svcs, Inc ATTN: Library
Sciences Applications, Inc ATTN: L. Novotney
Shields Warren Radiation Lab ATTN: H. Kohn
96