Embed Size (px)
Citation preview
Analysis of Radiosonde and Ground-Based Remotely Sensed PWV Data from the2004 North Slope of Alaska Arctic Winter Radiometric Experiment
V. MATTIOLI,*,� E. R. WESTWATER,# D. CIMINI,#,@ J. C. LILJEGREN,& B. M. LESHT,&
S. I. GUTMAN,** AND F. J. SCHMIDLIN��
*Dipartimento di Ingegneria Elettronica e dell’Informazione, Università di Perugia, Perugia, Italy�Science and Technology Corporation, Hampton, Virginia
#Cooperative Institute for Research in Environmental Sciences, University of Colorado, and NOAA/ESRL Physical SciencesDivision, Boulder, Colorado
@ Institute of Methodologies for Environmental Analysis, National Research Council, Tito Scalo, Italy&DOE/Argonne National Laboratory, Argonne, Illinois
**NOAA/Forecast Systems Laboratory, Boulder, Colorado��NASA Goddard Space Flight Center, Wallops Flight Facility, Wallops Island, Virginia
(Manuscript received 27 December 2005, in final form 11 July 2006)
ABSTRACT
During 9 March–9 April 2004, the North Slope of Alaska Arctic Winter Radiometric Experiment wasconducted at the Atmospheric Radiation Measurement Program’s (ARM) “Great White” field site nearBarrow, Alaska. The major goals of the experiment were to compare microwave and millimeter wavelengthradiometers and to develop forward models in radiative transfer, all with a focus on cold (temperature from0° to �40°C) and dry [precipitable water vapor (PWV) � 0.5 cm] conditions. To supplement the remotesensors, several radiosonde packages were deployed: Vaisala RS90 launched at the ARM Duplex and at theGreat White and Sippican VIZ-B2 operated by the NWS. In addition, eight dual-radiosonde launches wereconducted at the Duplex with Vaisala RS90 and Sippican GPS Mark II, the latter one modified to includea chilled mirror humidity sensor. Temperature comparisons showed a nighttime bias between VIZ-B2 andRS90, which reached 3.5°C at 30 hPa. Relative humidity comparisons indicated better than 5% averageagreement between the RS90 and the chilled mirror. A bias of about 20% for the upper troposphere wasfound in the VIZ-B2 and the Mark II measurements relative to both RS90 and the chilled mirror.
Comparisons in PWV were made between a microwave radiometer, a microwave profiler, a globalpositioning system receiver, and the radiosonde types. An RMS agreement of 0.033 cm was found betweenthe radiometer and the profiler and better than 0.058 cm between the radiometers and GPS. RS90 showeda daytime dry bias on PWV of about 0.02 cm.
1. Introduction
Although many years of research and experimentshave focused on radiosonde measurements of humidity,many recent experiments have been conducted, primar-ily because of the importance of humidity to the mod-eling of radiative transfer (Clough et al. 1999; Rever-comb et al. 2003; Ferrare et al. 2004). In forward modelstudies, calculations based on radiosondes are com-pared to both infrared and microwave radiometer ob-servations (Westwater 1997; Westwater et al. 2003; Lil-
jegren et al. 2005; Mattioli et al. 2005a; Hewison et al.2006). Thus, the accuracy of radiosonde observationshas a direct impact on the evaluation and developmentof forward models, as well as in the evaluation of radi-ometers themselves. Remote sensor measurements ofprecipitable water vapor (PWV) have also played animportant role in the evaluation of radiosonde accuracy(Clough et al. 1999; Revercomb et al. 2003; Westwateret al. 2003). Both radiosonde measurements and re-motely sensed PWV also have significant applicationsin climate research (Revercomb et al. 2003) and in thecalibration and validation of remote sensing instru-ments (Westwater 1997; Turner and Goldsmith 1999;Turner et al. 2003). For these studies, intercomparisonsbetween different radiosonde types and differentmanufacturers as well as between various types of re-
Corresponding author address: Vinia Mattioli, DIEI, Universitàdi Perugia, via G. Duranti 93, 06125 Perugia, Italy.E-mail: [email protected]
MARCH 2007 M A T T I O L I E T A L . 415
DOI: 10.1175/JTECH1982.1
© 2007 American Meteorological Society
JTECH1982
mote sensors are quite useful in evaluating accuraciesand in discovering possible inconsistencies in the mea-surements.
Many comparisons of radiosondes and remote sen-sors have been conducted in the midlatitudes (Rever-comb et al. 2003; Wang et al. 2003) and in the Tropics(Westwater et al. 2003; Wang et al. 2002). However,there is a dearth of radiosonde and remote sensor com-parisons for Arctic locations. This is especially impor-tant in climate modeling for PWV � 3 mm when infra-red radiance in normally opaque regions becomes par-tially transparent and structure in the frequencyspectrum becomes apparent. As a first step in evaluat-ing a variety of radiometers in the Arctic in conditionsof low PWV, in March 1999, an intensive operatingperiod (IOP) was conducted at the U.S. Department ofEnergy’s Atmospheric Radiation Measurement Pro-gram’s (ARM) “Great White” (GW) field site nearBarrow, Alaska (Racette et al. 2005). Because of a lim-ited number of radiosondes, many questions were leftunanswered about the accuracy of radiometric remotesensors. In particular, at that time, ARM radiosondeswere launched only once per day and at asynoptictimes, making comparisons with the synoptic launchesof the U.S. National Oceanic and Atmospheric Admin-istration/National Weather Service (NOAA/NWS) dif-ficult. In addition, Vaisala RS80 radiosondes were alsolaunched by ARM, and these radiosondes are known tohave a dry bias, at least at mid- and tropical latitudes(Revercomb et al. 2003; Turner et al. 2003; Westwateret al. 2003; Wang et al. 2002). To better understandthese and other issues, the 2004 North Slope of Alaska(NSA) Arctic Winter Radiometric Experiment WaterVapor Intensive Operational Period (WVIOP04) wasconducted at the Great White from 9 March to 9 April2004. The basic goals of the experiment were to exam-ine the relative sensitivity of millimeter wavelength ra-diometers to conventional microwave radiometers, todemonstrate a new NOAA instrument and its associ-ated calibration techniques, and to compare microwaveand millimeter forward models for radiative transfer. Adescription of the experiment is given by Westwater etal. (2004), and initial results are given in Mattioli et al.(2005b), Cimini et al. (2005), and Westwater et al.(2005). In this experiment, several radiosonde observa-tions (raobs) by different types of sensors were takenand several remote sensing instruments were operated.This paper presents the results of the comparisons ofradiosonde measurements of temperature and relativehumidity profiles as well as the comparison of measure-ments of PWV by radiosondes, a dual-channel micro-wave radiometer (MWR), a microwave radiometerprofiler (MWRP), and a global positioning system
(GPS) receiver. Our results represent the first system-atic comparisons of the above remote sensors and ra-diosonde systems for cold (from 0° to �40°C in surfacetemperature) and dry (PWV from 0.08 to 1.5 cm) con-ditions.
2. Radiosonde launch strategy
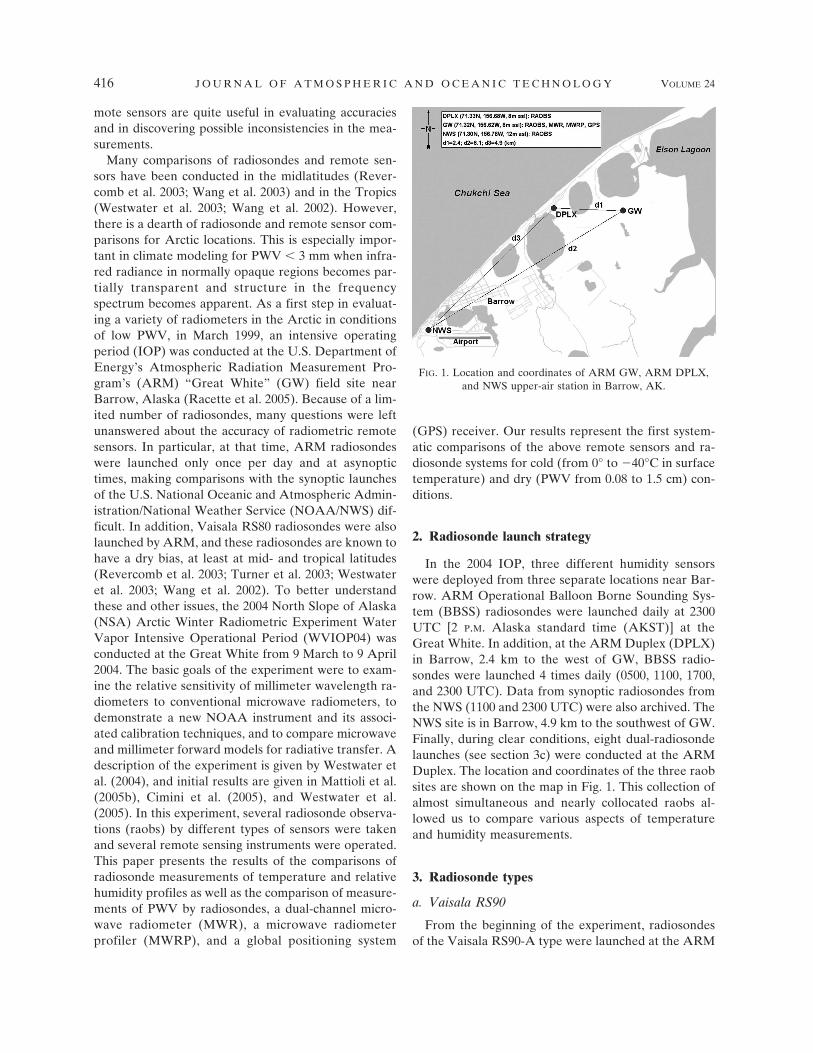
In the 2004 IOP, three different humidity sensorswere deployed from three separate locations near Bar-row. ARM Operational Balloon Borne Sounding Sys-tem (BBSS) radiosondes were launched daily at 2300UTC [2 P.M. Alaska standard time (AKST)] at theGreat White. In addition, at the ARM Duplex (DPLX)in Barrow, 2.4 km to the west of GW, BBSS radio-sondes were launched 4 times daily (0500, 1100, 1700,and 2300 UTC). Data from synoptic radiosondes fromthe NWS (1100 and 2300 UTC) were also archived. TheNWS site is in Barrow, 4.9 km to the southwest of GW.Finally, during clear conditions, eight dual-radiosondelaunches (see section 3c) were conducted at the ARMDuplex. The location and coordinates of the three raobsites are shown on the map in Fig. 1. This collection ofalmost simultaneous and nearly collocated raobs al-lowed us to compare various aspects of temperatureand humidity measurements.
3. Radiosonde types
a. Vaisala RS90
From the beginning of the experiment, radiosondesof the Vaisala RS90-A type were launched at the ARM
FIG. 1. Location and coordinates of ARM GW, ARM DPLX,and NWS upper-air station in Barrow, AK.
416 J O U R N A L O F A T M O S P H E R I C A N D O C E A N I C T E C H N O L O G Y VOLUME 24
DPLX in Barrow and at the ARM GW site. For con-venience, these radiosondes will be referred to asDPLX-RS90 and GW-RS90, respectively. The RS90-Ais a “PTU-only” system, that is, the primary measure-ments are pressure (P), temperature (T), and relativehumidity (RH). Altitude and dewpoint temperature arederived quantities in the data. The sensor for the tem-perature measurement is the Vaisala F-Thermocap,which consists of a capacitive wire. The sensor for therelative humidity is the Vaisala Heated H-Humicap, athin film capacitor with a heated twin-sensor design;two humidity sensors work in phase so that while onesensor is measuring, the other is heated to prevent iceformation (see online at www.vaisala.com). Sampleswere taken every 2 s. Details of the sensors’ accuraciesare given in Paukkunen et al. (2001).
b. Sippican VIZ-B2
During the experiment, the synoptic radiosondes ofthe Sippican VIZ-B2 type were launched in Barrow byNWS. These radiosondes were implemented at NWSupper-air sites in 1997 and are currently operated at 28NWS upper-air sites. At present, a new RadiosondeReplacement System (RRS) is under deployment (seeonline at www.ua.nws.noaa.gov/RRS.htm) and is ex-pected to continue until 2009 to replace the radiosondesin use with GPS-based radiosondes. The initial GPSradiosonde is the Sippican MkIIA.
The VIZ-B2 radiosondes measure P, T, and RH ev-ery 1.2 s and reported every 6 s for archiving. Altitudeand dewpoint temperature are derived quantities in thedata. Wind speed and direction are also computed byusing the recorded elevation and azimuth informationfrom the radiosonde tracking system. Here, thesesoundings will be referred to as NWS-VIZ. The sensorfor the temperature measurement is a 4.5-cm-longwhite-coated rod (long rod) thermistor, and the sensorfor humidity measurements is a carbon hygristor (CH),whose characteristics are described in Blackmore andTaubvurtzel (1999). The VIZ-B2 sondes have manufac-turer-installed calibration factors for the humidity mea-surements. For the NWS sondes, the H1 and H2 factorshave been used at all NWS stations that use VIZ-B2sondes since 1999.
c. Sippican Mark II with Meteolabor Snow White
During the experiment, eight successful dual-radiosonde launches were conducted at the ARM Du-plex, two during the day and six during the night. Tworadiosonde packages flew on the same balloon. Thefirst package was the ARM DPLX-RS90, as discussedin section 3a. The second was a radiosonde of the Sip-
pican GPS Mark II type, operated by the NationalAeronautics and Space Administration (NASA), whichcontained a VIZ 2.5-cm-long white-coated rod (shortrod) thermistor for temperature measurements and aVIZ carbon hygristor humidity sensor. In contrast tothe NWS-VIZ sondes, the H1 and H2 factors for thecarbon hygristor were set to unity. The Mark II radio-sonde had also attached a “Snow White” chilled mir-ror dewpoint hygrometer manufactured by Meteola-bor AG in Switzerland (see online at http://www.meteolabor.ch). This instrument is a dewpoint sensordesigned for radiosonde application whose perfor-mance has been evaluated in many studies (Fujiwara etal. 2003; Vömel et al. 2003; Wang et al. 2003; Milo-shevich et al. 2006). The accuracy of the mirror tem-perature measurement is better than 0.1°C. With accu-racy in the air temperature measurement of 0.2°C, theRH uncertainty is about 2% of the percent RH value(Vömel et al. 2003). The instrument has shown goodperformance in the tropical troposphere (Fujiwara etal. 2003) and in detecting cirrus clouds (Wang et al.2003), although some deficiencies of the instrumentwere found in the presence of extremely dry layers(Vömel et al. 2003), in precipitation, in heavy-water-laden clouds, and sometimes in ice clouds (Schmidlinand Northam 2005). For convenience, we will refer tothe Mark II humidity sensor and to the Snow White asMK2-CH and MK2-SW, respectively.
A GPS receiver and antenna were included in theMark II system and integrated into the radiosonde elec-tronics (see online at www.sippican.com). Values forwind and pressure are derived from the GPS data pro-cessing by applying the hydrostatic equation to the GPSaltitude so that a pressure sensor was not included.Three spare channels were also included in the systemand used to transmit the data from the attached MK2-SW. Samples were taken every 1.2 s. Each dual-radiosonde launch therefore had simultaneous and col-located humidity profiles from three humidity sensors(DPLX-RS90, MK2-CH, and MK2-SW) for intercom-parison.
4. Radiosonde data processing
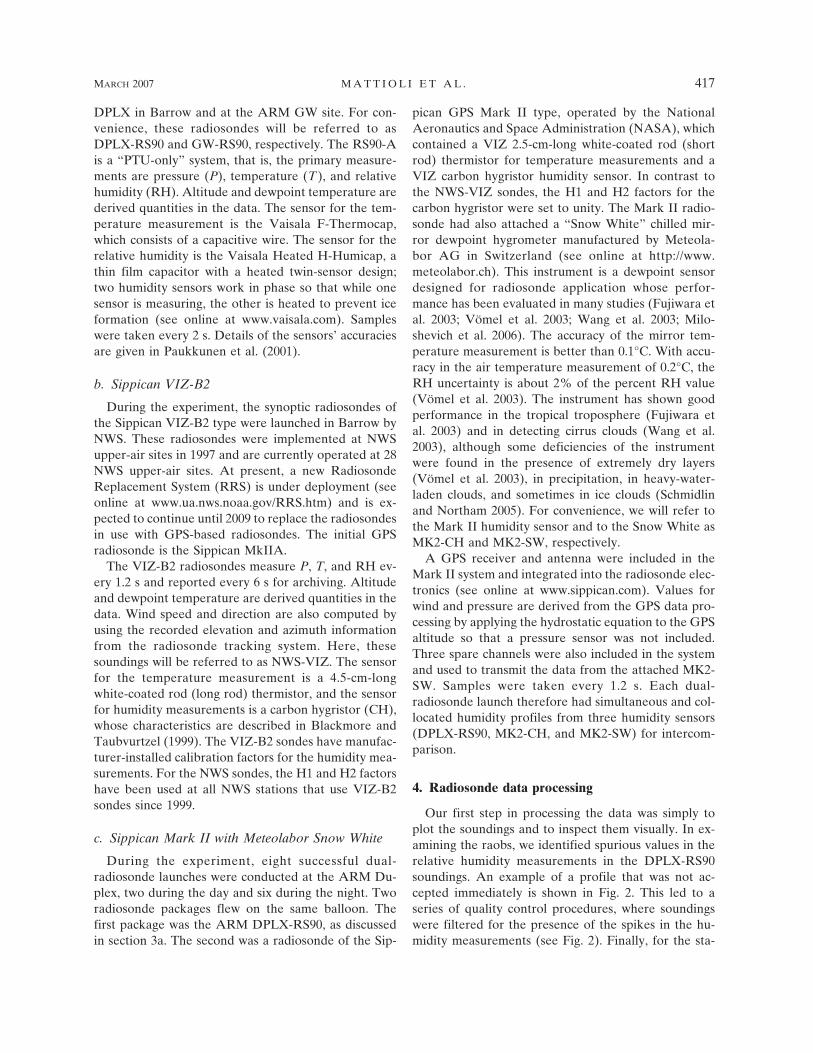
Our first step in processing the data was simply toplot the soundings and to inspect them visually. In ex-amining the raobs, we identified spurious values in therelative humidity measurements in the DPLX-RS90soundings. An example of a profile that was not ac-cepted immediately is shown in Fig. 2. This led to aseries of quality control procedures, where soundingswere filtered for the presence of the spikes in the hu-midity measurements (see Fig. 2). Finally, for the sta-
MARCH 2007 M A T T I O L I E T A L . 417
tistical comparisons of the temperature and humidityprofiles in section 5, soundings were fitted to a regulargrid over pressure, with a resolution of 5 hPa. Afterintercomparisons between the radiosoundings and withremote sensing instruments (GPS, MWR, and MWRP),outliers (entire profiles) were also identified and re-moved from the statistics (see sections 6 and 7). Table1 shows the number of launches and the availablesoundings after quality control.
We found that spurious values were present in theRH data in approximately 50% of the DPLX-RS90soundings. The spurious data were observed generallyabove 10 km from the surface. However, after the startof the IOP, another meteorological experiment involv-ing aerosondes (Holland et al. 2001) was conducted atthe Aerosonde Arctic Site in Barrow. We believe thatthe origin of the spikes is the result of radio frequencyinterference that affected the telemetry. In addition,the spikes were not present in the GW data. At thislocation, a spectrum analyzer was operated to searchfor an interference-free frequency before the radio-sondes were launched. The fact that the spikes did notoccur in the temperature (see Fig. 2, left panel) mayalso be a result of the differing sensitivities of the tem-perature and RH calibration functions. Unfortunately,we could not obtain the raw sounding data to confirmour hypothesis. In general, above the tropopause, it waspossible to recognize the behavior of the true profilebehind the spikes, by assumptions on the vertical con-
tinuity of the measurements for pressure values lowerthan 250–200 hPa. Following these considerations, weapplied a nonlinear filter to detect and replace thesehigh-frequency interferences in the data. Noisy pointswere identified by using a median high-pass filter andthen corrected by interpolation over the adjacentpoints. The window of the filter varied with the noisemagnitude and hence was varied from radiosonde toradiosonde. Figure 2 (right panel) shows the noisy RHmeasurements and the reconstructed profile. The filterworks properly when the interferences are infrequent,and it is possible to estimate the missing value fromcontiguous points not affected by the noise. In a fewcases, some uncorrected spurious noise that still af-fected the RH measurement was eliminated by handediting after intercomparisons.
5. Statistical comparison of raob temperature andrelative humidity measurements
In this section, individual soundings as well as statis-tical evaluations of the temperature and relative humid-
FIG. 2. (left) Temperature profile in the DPLX-RS90 sounding launched at 2300 UTC 4 Apr 2004.(Right) RH affected by unrealistic noise (gray dots) and reconstructed profiles (black dots) in the samesounding. Here, large excursions occur at pressures below 70 hPa.
TABLE 1. Number of soundings deployed and available afterthe processing.
Raobs type No. of launches Postprocessed soundings
DPLX-RS90 124 113GW-RS90 28 26MK2 with SW 10 8NWS-VIZ 51 44
418 J O U R N A L O F A T M O S P H E R I C A N D O C E A N I C T E C H N O L O G Y VOLUME 24
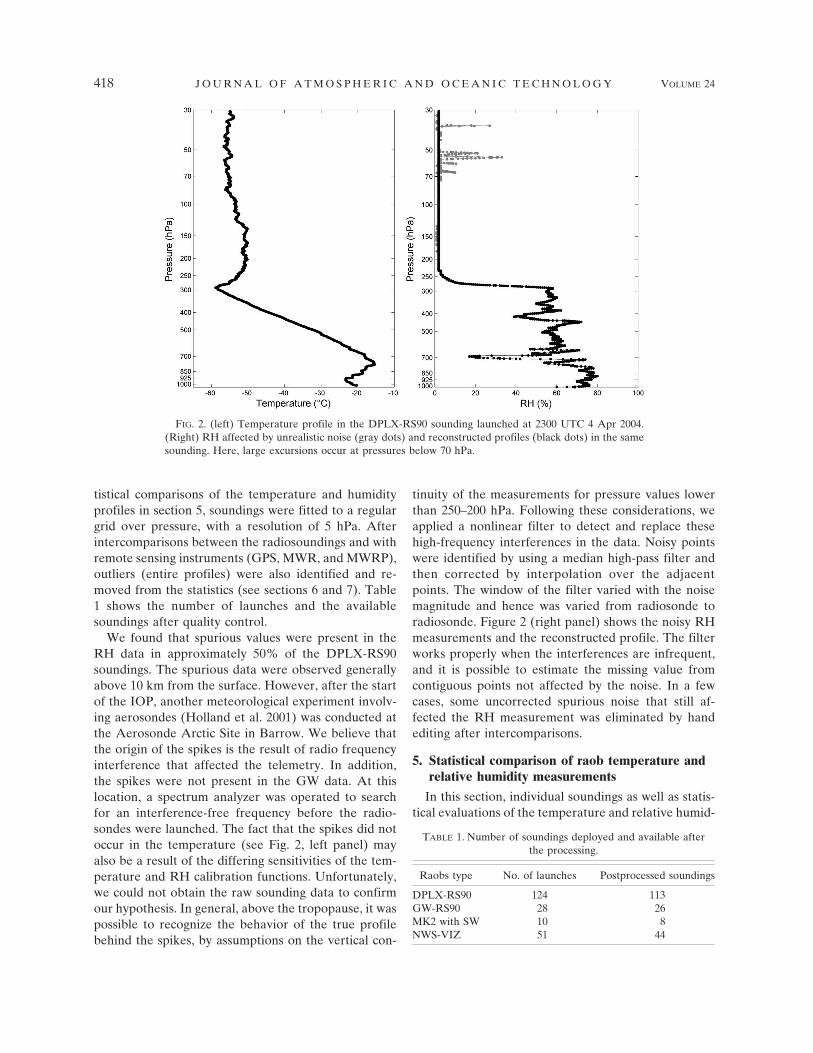
ity measured by the different sensors are presented.Figure 3 shows the sounding profiles taken at 2300UTC 26 March from the various radiosonde types.Among them, Mark II and DPLX-RS90 were attachedat the same balloon. First, we note excellent agreementbetween the four measurements of temperature up to150 hPa (see section 5b for discussion). In the humidityprofiles, we note that the two RS90 measurements aswell as those of MK2-SW are in good agreement. How-ever, the two VIZ-like soundings differ considerablyfrom the other types of sensors in vertical resolutionbelow about 5 km and in absolute magnitude above thisaltitude. At higher altitudes, the differences approach30%. However, the two VIZ-like soundings agreeroughly within 5% of each other. Thus, as mentionedabove, dual launches provide unique opportunities tocompare different radiosonde types, since the differ-ence in the measurement is only due to the sensor typeand not to temporal or spatial displacements. Althoughin this work we have chosen pressure as our verticalcoordinate, plots of RH and T differences as a functionof geopotential height were quite similar (Mattioli et al.2005b).
a. GW-RS90 versus DPLX-RS90 profiles
Figure 4 shows the profiles of temperature and rela-tive humidity difference between the DPLX-RS90 andthe GW-RS90 soundings. The comparisons are re-stricted during the daytime at 2300 UTC (2 P.M. AKST),the time of the GW-RS90 launches. The average dif-
ference profile (black line) and standard deviation (std)profile (dark gray line) are also given. Usually onlysmall differences are present in the difference profiles,which can be attributed to the spatial baseline (2.4 km),temporal baselines (less than 15 min), and manufactur-ing tolerances for the sensor between the launches atDPLX and at GW. However, since many of the profileshave significant vertical structure in RH (an example ofwhich can be seen in Fig. 3), it is not surprising thatdifferences of more than 20% were occasionally ob-served at the same pressure level. In our analysis, sincethe two stations have the same altitude above the sealevel, we also evaluated the temperature differencesnear the surface. We noted a temperature bias near thesurface (DPLX warmer than GW) of about 0.8°C,which persists for about 100 m. This is also not unex-pected because of the presence of local sources of heat-ing in the city of Barrow. Above 100 m, the tempera-ture difference stays within 0.3°C, with an average stdvalue of 0.32°C. For the RH, the mean difference stayswithin 2%, with an average std value of 2%.
b. NWS-VIZ versus DPLX-RS90 profiles
Figure 5 shows the temperature difference profilesbetween the NWS-VIZ soundings and DPLX-RS90.The comparison is performed with the dataset dividedinto data taken at night at 1100 UTC (2 A.M. AKST) andduring the day at 2300 UTC (2 P.M. AKST). Two featurescan be noticed. First, there is a gradient in temperaturearound 1000 hPa (corresponding to about 100–300 m
FIG. 3. (left) Temperature and (right) RH soundings at 2300 UTC 26 March.
MARCH 2007 M A T T I O L I E T A L . 419
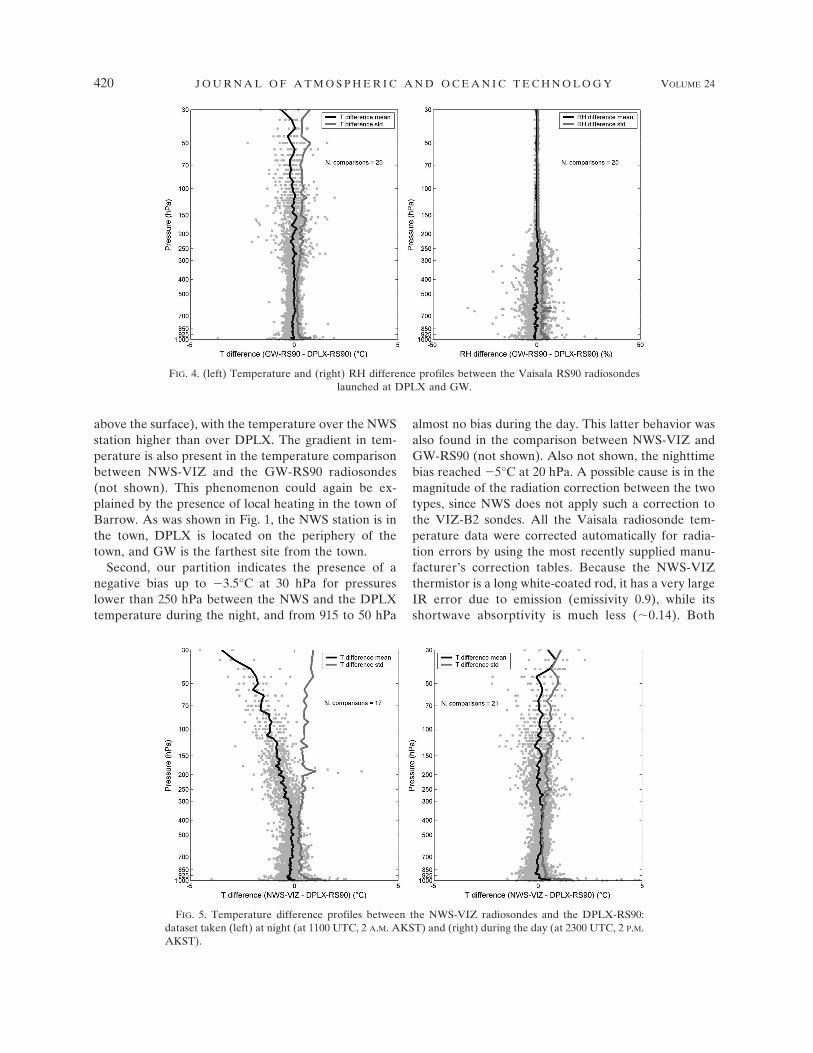
above the surface), with the temperature over the NWSstation higher than over DPLX. The gradient in tem-perature is also present in the temperature comparisonbetween NWS-VIZ and the GW-RS90 radiosondes(not shown). This phenomenon could again be ex-plained by the presence of local heating in the town ofBarrow. As was shown in Fig. 1, the NWS station is inthe town, DPLX is located on the periphery of thetown, and GW is the farthest site from the town.
Second, our partition indicates the presence of anegative bias up to �3.5°C at 30 hPa for pressureslower than 250 hPa between the NWS and the DPLXtemperature during the night, and from 915 to 50 hPa
almost no bias during the day. This latter behavior wasalso found in the comparison between NWS-VIZ andGW-RS90 (not shown). Also not shown, the nighttimebias reached �5°C at 20 hPa. A possible cause is in themagnitude of the radiation correction between the twotypes, since NWS does not apply such a correction tothe VIZ-B2 sondes. All the Vaisala radiosonde tem-perature data were corrected automatically for radia-tion errors by using the most recently supplied manu-facturer’s correction tables. Because the NWS-VIZthermistor is a long white-coated rod, it has a very largeIR error due to emission (emissivity 0.9), while itsshortwave absorptivity is much less (�0.14). Both
FIG. 4. (left) Temperature and (right) RH difference profiles between the Vaisala RS90 radiosondeslaunched at DPLX and GW.
FIG. 5. Temperature difference profiles between the NWS-VIZ radiosondes and the DPLX-RS90:dataset taken (left) at night (at 1100 UTC, 2 A.M. AKST) and (right) during the day (at 2300 UTC, 2 P.M.AKST).
420 J O U R N A L O F A T M O S P H E R I C A N D O C E A N I C T E C H N O L O G Y VOLUME 24
Vaisala sensor absorptivity and emissivity are quitesmall (�0.1). Therefore, the rod has a large IR errorthat is especially noticeable at night when comparedwith Vaisala-type sensors (Schmidlin et al. 1986). Theerror of the rod is keyed to the background radiativeenvironment and can be different depending on loca-tion and conditions.
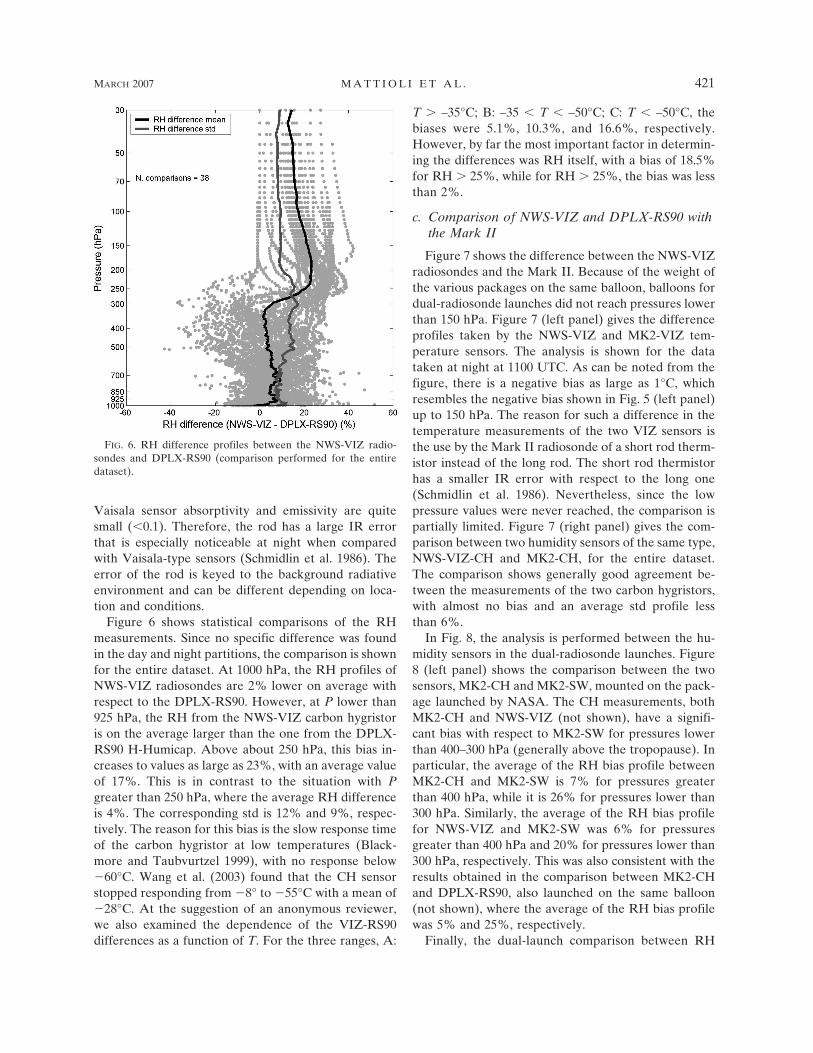
Figure 6 shows statistical comparisons of the RHmeasurements. Since no specific difference was foundin the day and night partitions, the comparison is shownfor the entire dataset. At 1000 hPa, the RH profiles ofNWS-VIZ radiosondes are 2% lower on average withrespect to the DPLX-RS90. However, at P lower than925 hPa, the RH from the NWS-VIZ carbon hygristoris on the average larger than the one from the DPLX-RS90 H-Humicap. Above about 250 hPa, this bias in-creases to values as large as 23%, with an average valueof 17%. This is in contrast to the situation with Pgreater than 250 hPa, where the average RH differenceis 4%. The corresponding std is 12% and 9%, respec-tively. The reason for this bias is the slow response timeof the carbon hygristor at low temperatures (Black-more and Taubvurtzel 1999), with no response below�60°C. Wang et al. (2003) found that the CH sensorstopped responding from �8° to �55°C with a mean of�28°C. At the suggestion of an anonymous reviewer,we also examined the dependence of the VIZ-RS90differences as a function of T. For the three ranges, A:
T � –35°C; B: –35 � T � –50°C; C: T � –50°C, thebiases were 5.1%, 10.3%, and 16.6%, respectively.However, by far the most important factor in determin-ing the differences was RH itself, with a bias of 18.5%for RH � 25%, while for RH � 25%, the bias was lessthan 2%.
c. Comparison of NWS-VIZ and DPLX-RS90 withthe Mark II
Figure 7 shows the difference between the NWS-VIZradiosondes and the Mark II. Because of the weight ofthe various packages on the same balloon, balloons fordual-radiosonde launches did not reach pressures lowerthan 150 hPa. Figure 7 (left panel) gives the differenceprofiles taken by the NWS-VIZ and MK2-VIZ tem-perature sensors. The analysis is shown for the datataken at night at 1100 UTC. As can be noted from thefigure, there is a negative bias as large as 1°C, whichresembles the negative bias shown in Fig. 5 (left panel)up to 150 hPa. The reason for such a difference in thetemperature measurements of the two VIZ sensors isthe use by the Mark II radiosonde of a short rod therm-istor instead of the long rod. The short rod thermistorhas a smaller IR error with respect to the long one(Schmidlin et al. 1986). Nevertheless, since the lowpressure values were never reached, the comparison ispartially limited. Figure 7 (right panel) gives the com-parison between two humidity sensors of the same type,NWS-VIZ-CH and MK2-CH, for the entire dataset.The comparison shows generally good agreement be-tween the measurements of the two carbon hygristors,with almost no bias and an average std profile lessthan 6%.
In Fig. 8, the analysis is performed between the hu-midity sensors in the dual-radiosonde launches. Figure8 (left panel) shows the comparison between the twosensors, MK2-CH and MK2-SW, mounted on the pack-age launched by NASA. The CH measurements, bothMK2-CH and NWS-VIZ (not shown), have a signifi-cant bias with respect to MK2-SW for pressures lowerthan 400–300 hPa (generally above the tropopause). Inparticular, the average of the RH bias profile betweenMK2-CH and MK2-SW is 7% for pressures greaterthan 400 hPa, while it is 26% for pressures lower than300 hPa. Similarly, the average of the RH bias profilefor NWS-VIZ and MK2-SW was 6% for pressuresgreater than 400 hPa and 20% for pressures lower than300 hPa, respectively. This was also consistent with theresults obtained in the comparison between MK2-CHand DPLX-RS90, also launched on the same balloon(not shown), where the average of the RH bias profilewas 5% and 25%, respectively.
Finally, the dual-launch comparison between RH
FIG. 6. RH difference profiles between the NWS-VIZ radio-sondes and DPLX-RS90 (comparison performed for the entiredataset).
MARCH 2007 M A T T I O L I E T A L . 421

profiles obtained by the MK2-SW and DPLX-RS90 H-Humicap shows a much better agreement, with an av-erage value of the bias profile of 1% and an averagevalue of the std profile of 4%, as shown in Fig. 8 (rightpanel). Thus, both the SW and RS90 humidity sound-ings are consistent with each other and both differ sub-stantially from VIZ.
6. PWV comparison among radiosonde types
In addition to the constant pressure level compari-sons, we compared the radiosonde types in terms of
PWV. Figure 9 shows the PWV time series computedfrom the various radiosondes. The following featurescan be noticed: (i) even though only 30 days of obser-vations were taken during the March–April 2004 timeperiod, there was a 0.1–1.4-cm range in PWV; (ii) theNWS-VIZ radiosondes measured, in general, highervalues of PWV with respect to the Vaisala RS90(launched at both DPLX and GW); (iii) PWV fromMK2-SW agrees very well with data from the Vaisalaradiosondes, while PWV computed from MK2-CH isusually larger than that computed from both Vaisalaand MK2-SW; and (iv) PWV computed from the MK2-
FIG. 7. Profiles of temperature and RH difference between NWS-VIZ and Mark II. (left) NWS-VIZlong rod thermistor vs MK2 VIZ short rod thermistor for the dataset taken at night. (right) NWS-VIZcarbon hygristor vs MK2-CH for the entire dataset.
FIG. 8. Profiles of RH difference between the VIZ carbon hygristor, the Vaisala capacitor, and theSnow White chilled mirror for the dual-radiosonde launches: (left) MK2-CH vs MK2-SW and (right)DPLX-RS90 vs MK2-SW.
422 J O U R N A L O F A T M O S P H E R I C A N D O C E A N I C T E C H N O L O G Y VOLUME 24
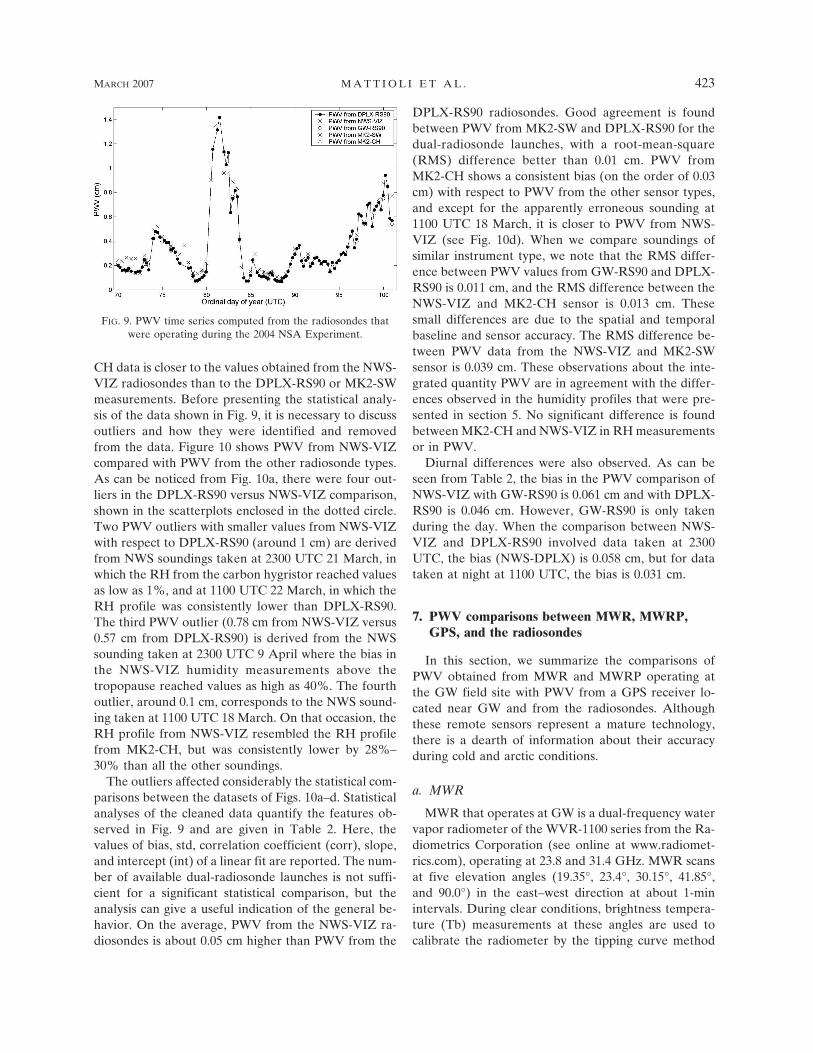
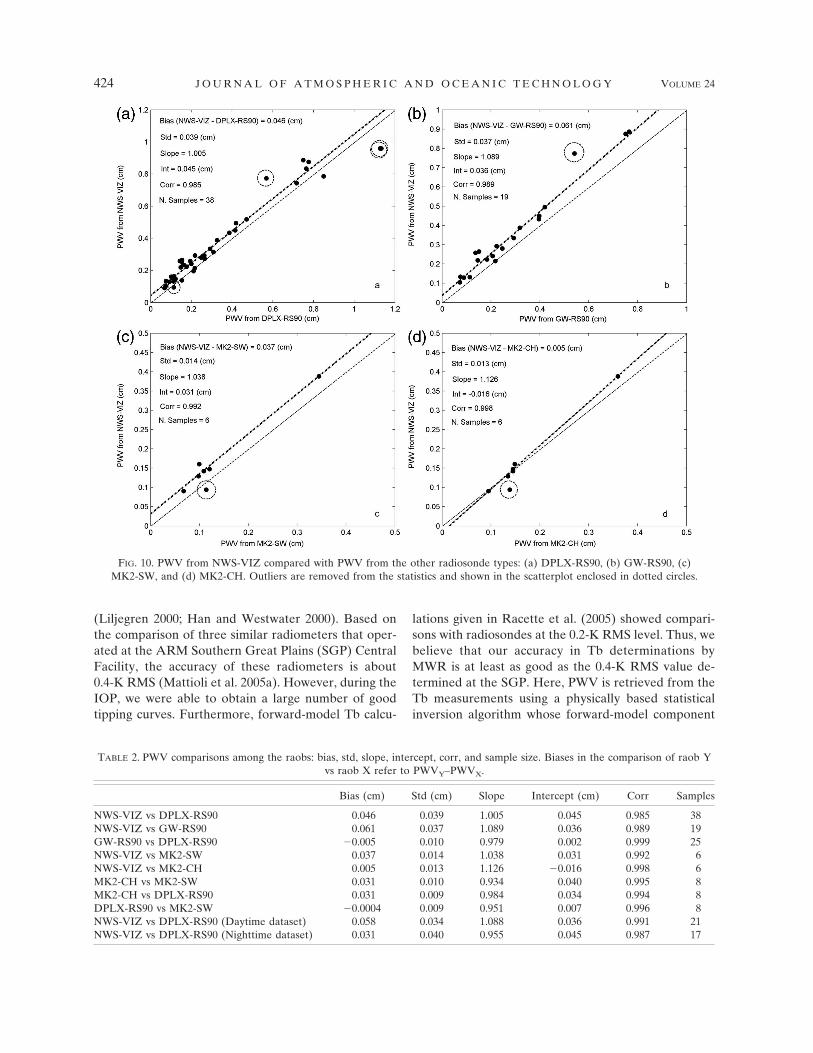
CH data is closer to the values obtained from the NWS-VIZ radiosondes than to the DPLX-RS90 or MK2-SWmeasurements. Before presenting the statistical analy-sis of the data shown in Fig. 9, it is necessary to discussoutliers and how they were identified and removedfrom the data. Figure 10 shows PWV from NWS-VIZcompared with PWV from the other radiosonde types.As can be noticed from Fig. 10a, there were four out-liers in the DPLX-RS90 versus NWS-VIZ comparison,shown in the scatterplots enclosed in the dotted circle.Two PWV outliers with smaller values from NWS-VIZwith respect to DPLX-RS90 (around 1 cm) are derivedfrom NWS soundings taken at 2300 UTC 21 March, inwhich the RH from the carbon hygristor reached valuesas low as 1%, and at 1100 UTC 22 March, in which theRH profile was consistently lower than DPLX-RS90.The third PWV outlier (0.78 cm from NWS-VIZ versus0.57 cm from DPLX-RS90) is derived from the NWSsounding taken at 2300 UTC 9 April where the bias inthe NWS-VIZ humidity measurements above thetropopause reached values as high as 40%. The fourthoutlier, around 0.1 cm, corresponds to the NWS sound-ing taken at 1100 UTC 18 March. On that occasion, theRH profile from NWS-VIZ resembled the RH profilefrom MK2-CH, but was consistently lower by 28%–30% than all the other soundings.
The outliers affected considerably the statistical com-parisons between the datasets of Figs. 10a–d. Statisticalanalyses of the cleaned data quantify the features ob-served in Fig. 9 and are given in Table 2. Here, thevalues of bias, std, correlation coefficient (corr), slope,and intercept (int) of a linear fit are reported. The num-ber of available dual-radiosonde launches is not suffi-cient for a significant statistical comparison, but theanalysis can give a useful indication of the general be-havior. On the average, PWV from the NWS-VIZ ra-diosondes is about 0.05 cm higher than PWV from the
DPLX-RS90 radiosondes. Good agreement is foundbetween PWV from MK2-SW and DPLX-RS90 for thedual-radiosonde launches, with a root-mean-square(RMS) difference better than 0.01 cm. PWV fromMK2-CH shows a consistent bias (on the order of 0.03cm) with respect to PWV from the other sensor types,and except for the apparently erroneous sounding at1100 UTC 18 March, it is closer to PWV from NWS-VIZ (see Fig. 10d). When we compare soundings ofsimilar instrument type, we note that the RMS differ-ence between PWV values from GW-RS90 and DPLX-RS90 is 0.011 cm, and the RMS difference between theNWS-VIZ and MK2-CH sensor is 0.013 cm. Thesesmall differences are due to the spatial and temporalbaseline and sensor accuracy. The RMS difference be-tween PWV data from the NWS-VIZ and MK2-SWsensor is 0.039 cm. These observations about the inte-grated quantity PWV are in agreement with the differ-ences observed in the humidity profiles that were pre-sented in section 5. No significant difference is foundbetween MK2-CH and NWS-VIZ in RH measurementsor in PWV.
Diurnal differences were also observed. As can beseen from Table 2, the bias in the PWV comparison ofNWS-VIZ with GW-RS90 is 0.061 cm and with DPLX-RS90 is 0.046 cm. However, GW-RS90 is only takenduring the day. When the comparison between NWS-VIZ and DPLX-RS90 involved data taken at 2300UTC, the bias (NWS-DPLX) is 0.058 cm, but for datataken at night at 1100 UTC, the bias is 0.031 cm.
7. PWV comparisons between MWR, MWRP,GPS, and the radiosondes
In this section, we summarize the comparisons ofPWV obtained from MWR and MWRP operating atthe GW field site with PWV from a GPS receiver lo-cated near GW and from the radiosondes. Althoughthese remote sensors represent a mature technology,there is a dearth of information about their accuracyduring cold and arctic conditions.
a. MWR
MWR that operates at GW is a dual-frequency watervapor radiometer of the WVR-1100 series from the Ra-diometrics Corporation (see online at www.radiomet-rics.com), operating at 23.8 and 31.4 GHz. MWR scansat five elevation angles (19.35°, 23.4°, 30.15°, 41.85°,and 90.0°) in the east–west direction at about 1-minintervals. During clear conditions, brightness tempera-ture (Tb) measurements at these angles are used tocalibrate the radiometer by the tipping curve method
FIG. 9. PWV time series computed from the radiosondes thatwere operating during the 2004 NSA Experiment.
MARCH 2007 M A T T I O L I E T A L . 423
(Liljegren 2000; Han and Westwater 2000). Based onthe comparison of three similar radiometers that oper-ated at the ARM Southern Great Plains (SGP) CentralFacility, the accuracy of these radiometers is about0.4-K RMS (Mattioli et al. 2005a). However, during theIOP, we were able to obtain a large number of goodtipping curves. Furthermore, forward-model Tb calcu-
lations given in Racette et al. (2005) showed compari-sons with radiosondes at the 0.2-K RMS level. Thus, webelieve that our accuracy in Tb determinations byMWR is at least as good as the 0.4-K RMS value de-termined at the SGP. Here, PWV is retrieved from theTb measurements using a physically based statisticalinversion algorithm whose forward-model component
FIG. 10. PWV from NWS-VIZ compared with PWV from the other radiosonde types: (a) DPLX-RS90, (b) GW-RS90, (c)MK2-SW, and (d) MK2-CH. Outliers are removed from the statistics and shown in the scatterplot enclosed in dotted circles.
TABLE 2. PWV comparisons among the raobs: bias, std, slope, intercept, corr, and sample size. Biases in the comparison of raob Yvs raob X refer to PWVY–PWVX.
Bias (cm) Std (cm) Slope Intercept (cm) Corr Samples
NWS-VIZ vs DPLX-RS90 0.046 0.039 1.005 0.045 0.985 38NWS-VIZ vs GW-RS90 0.061 0.037 1.089 0.036 0.989 19GW-RS90 vs DPLX-RS90 �0.005 0.010 0.979 0.002 0.999 25NWS-VIZ vs MK2-SW 0.037 0.014 1.038 0.031 0.992 6NWS-VIZ vs MK2-CH 0.005 0.013 1.126 �0.016 0.998 6MK2-CH vs MK2-SW 0.031 0.010 0.934 0.040 0.995 8MK2-CH vs DPLX-RS90 0.031 0.009 0.984 0.034 0.994 8DPLX-RS90 vs MK2-SW �0.0004 0.009 0.951 0.007 0.996 8NWS-VIZ vs DPLX-RS90 (Daytime dataset) 0.058 0.034 1.088 0.036 0.991 21NWS-VIZ vs DPLX-RS90 (Nighttime dataset) 0.031 0.040 0.955 0.045 0.987 17
424 J O U R N A L O F A T M O S P H E R I C A N D O C E A N I C T E C H N O L O G Y VOLUME 24
is that of Liljegren et al. (2005). Considering that thesensitivity of the 23.8-GHz channel to PWV is about 1.3K mm�1 (see Racette et al. 2005), an absolute accuracyof 0.4 K in Tb corresponds to an absolute accuracy of0.3 mm in PWV. The manufacturer’s estimates of “re-peatability” of 0.25 K (on a 30-s sample) led to a similarnumber for PWV of 0.2 mm on a 30-s basis. For themuch more humid environment during a spring IOP atthe SGP (1.0–2.0 cm of PWV), the RMS accuracy inmeasuring PWV, determined by comparison with ra-diosondes, GPS, and between different radiometers,was found to be about 0.75 mm (Mattioli et al. 2005a).
b. MWRP
MWRP is a 12-channel radiometer of the TP/WVP-3000 series from the Radiometrics Corporation, with 5K-band channels (22.235, 23.035, 23.835, 26.235, and30.0 GHz) and 7 V-band channels (51.25, 52.28, 53.85,54.94, 56.66, 57.29, and 58.8 GHz), which provides hu-midity and temperature profiles at about 5-min inter-vals. The K-band channels and the lowest V-band chan-nel are used for humidity sensing, while the remainingV-band channels are used for temperature profiling.The system also includes an infrared broadband radi-ometer and PTU sensors for the measurements ofcloud-base temperature and surface pressure, tempera-ture, and humidity, respectively.
PWV can be retrieved from MWRP observations byusing different combinations of channels (Liljegren andLesht 2004). For example, in this study we compareresults obtained using only two channels [23.835 and 30GHz (2ch)], the five K-band channels (5ch), and sixchannels [which are the five K-band plus the 51.25-GHzchannel (6ch)]. Both MWRP and MWR are providedwith a wet window sensor mounted on the top of theradiometer that turns a heater on during condensing orprecipitating conditions to promote the evaporation ofrain or snow. In our comparisons, PWV data from theradiometers are accepted when the wet window sensorindicated that the heater was not activated. However,as we show later in this section, in terms of PWV, theretrievals obtained when the heater was activatedseemed consistent with the observations from other in-struments (GPS and raobs). The manufacturer’s esti-mate of the absolute accuracy of the V-band channels is0.5 K, with a repeatability of 0.25 K on a 5-min basis.
c. GPS (near–real time and reprocessed)
A SuomiNet (Ware at al. 2000) GPS receiver (SG27)located near GW provided PWV measurementsthroughout the experiment. The site is also incorpo-rated into the NOAA Forecast Systems Laboratory
(FSL) ground-based GPS Meteorology network (seeonline at http://gpsmet.noaa.gov). FSL and the ScrippsInstitution of Oceanography collaborated to producethe near–real time (NRT) and reprocessed data used inthis experiment by using the method described in Gut-man et al. (2004a). PWV is retrieved from the tropo-spheric GPS signal delay by first parsing it into its wetand dry components by subtracting a hydrostatic delaythat is calculated from surface pressure (Saastamoinen1972). Then the wet component is mapped into PWVusing a transfer function that is nearly proportional tosurface temperature (Bevis et al. 1994). The temporalresolution of the measurements is 30 min.
When using NRT data, because of the time con-straints imposed on data availability from operationalweather forecasting, no special effort is made to reducethe impact of various sources of processing errors,which appear as noise or scatter about the mean in theNRT solution. As described in Gutman et al. (2004b),errors occur in the estimation of the zenith troposphericsignal delay (Bevis et al. 1992), in the estimation of thezenith hydrostatic delay (Saastamoinen 1972; Elgered1993), and in the estimation of the wet delay transferfunction (Bevis et al. 1994). These errors are indepen-dent and correspond to an equivalent PWV retrievalerror of 0.75, 0.25, and 0.1 mm, respectively, for a totalestimated PWV retrieval error of 0.8-mm RMS. How-ever, initial comparisons of the GPS NRT data withthose of MWR revealed a substantial amount of scatterin the GPS data.
For the meteorological conditions of this experiment,we analyzed the errors arising from estimating theweighted mean temperature of the atmosphere (Tm;Davis et al. 1985) in the wet delay transfer function toPWV, either from radiosonde or surface data. Here,Tm was calculated from 30-min interpolations of the4-times-a-day DPLX-RS90 radiosondes. Although, theonce-a-day radiosondes launched at GW were not suf-ficient to represent the diurnal differences, the RMSdifference between Tm computed at the DPLX andGW for the daytime dataset is 0.24 K, which is negli-gible in terms of PWV. For the month of the experi-ment, we found that the RMS difference between Tmcomputed from raobs and from the surface temperatureTs was less than 5 K, with a relative error in the transferfunction of about 2% and an RMS difference in termsof PWV of 0.012 cm. These errors are small relative tothe scatter. We believe the scatter is mainly associatedwith site-dependent multipath, which affects the zenithtotal delay estimation, which was associated with lowsatellite elevation angles. A contributing factor washigh reflectivity properties associated with frozen iceand snow on the surface. Another possible source of
MARCH 2007 M A T T I O L I E T A L . 425
error is in the Niell mapping function (Niell 1996),which relates the zenith delay to the signal slant path.(The use of an elevation cutoff angle of 7.5° increasedthe accuracy of its use for an arctic environment.)
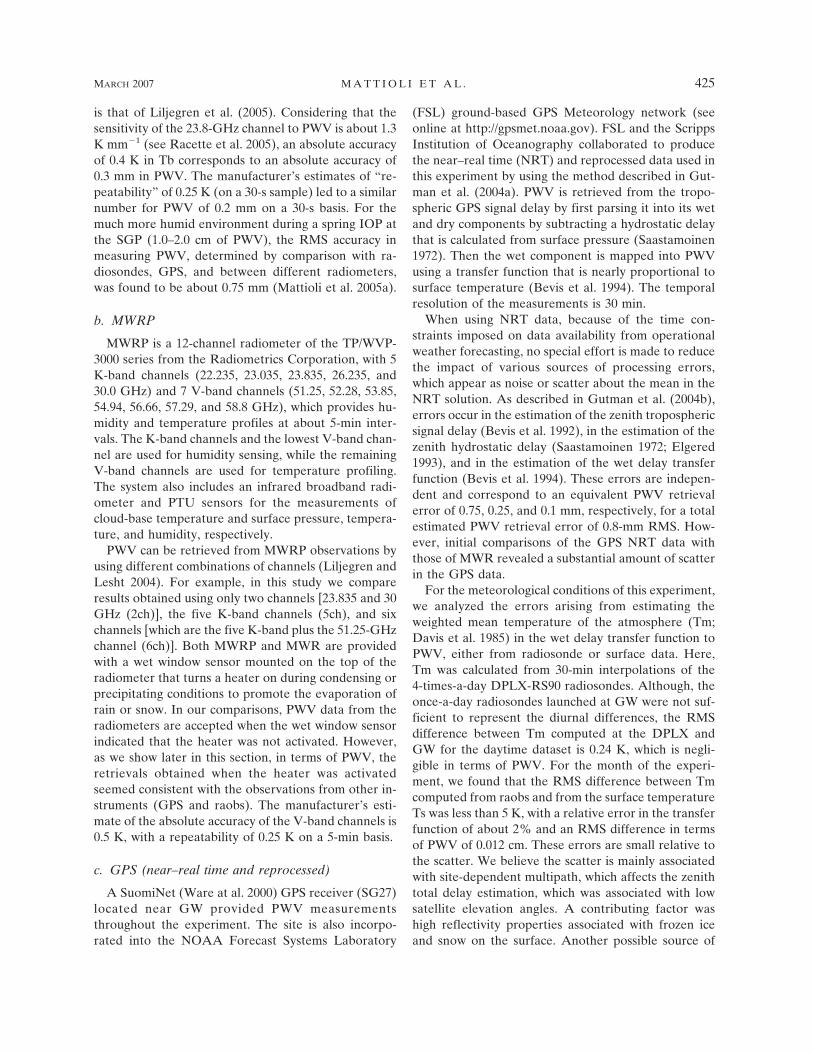
An attempt to minimize the scatter in the NRT wasmade by (i) implementing the postfit residual option inthe GPS at the Massachusetts Institute of Technology(GAMIT) data software package (Herring et al. 2006)used by FSL, (ii) using precise orbits from the GlobalNavigation Satellite Systems Service (GNSS; ratherthan real-time hourly orbits provided to FSL byScripps), and (iii) identifying and removing repetitiveaspects of the tropospheric delay time series associatedwith multipath. The reprocessing steps reduced mostbut not all of the scatter in the GPS data, as can benoticed from Fig. 11, which shows the time series ofPWV-NRT and PWV reprocessed for the duration ofthe experiment. For the two datasets, the bias (PWVreprocessed and PWV-NRT) is 0.012 cm and the std is0.064 cm. Considering that the average PWV value dur-ing the experiment was 0.4 cm, the percentage differ-ence is substantial and is over 15%. In the followingcomparisons, only reprocessed GPS data will be used.
d. PWV from MWRP
The PWV from MWRP is retrieved by using mea-surements at 2 channels [23.835 and 30 GHz (2ch)], at5 channels [22.235–30 GHz (5ch)], and at 6 channels[22.235–30 and the 51.25 GHz (6ch)]. Monthly retrievalcoefficients, including the mean radiating temperatureTmr, have been specifically computed from past radio-soundings using Vaisala radiosondes (RS80-H andRS90) launched at the Great White between 1998 and2004, assuming a 0.3-K RMS error in brightness tem-
perature. All are based on the modified Rosenkranzmodel (Liljegren et al. 2005; Clough et al. 2005).
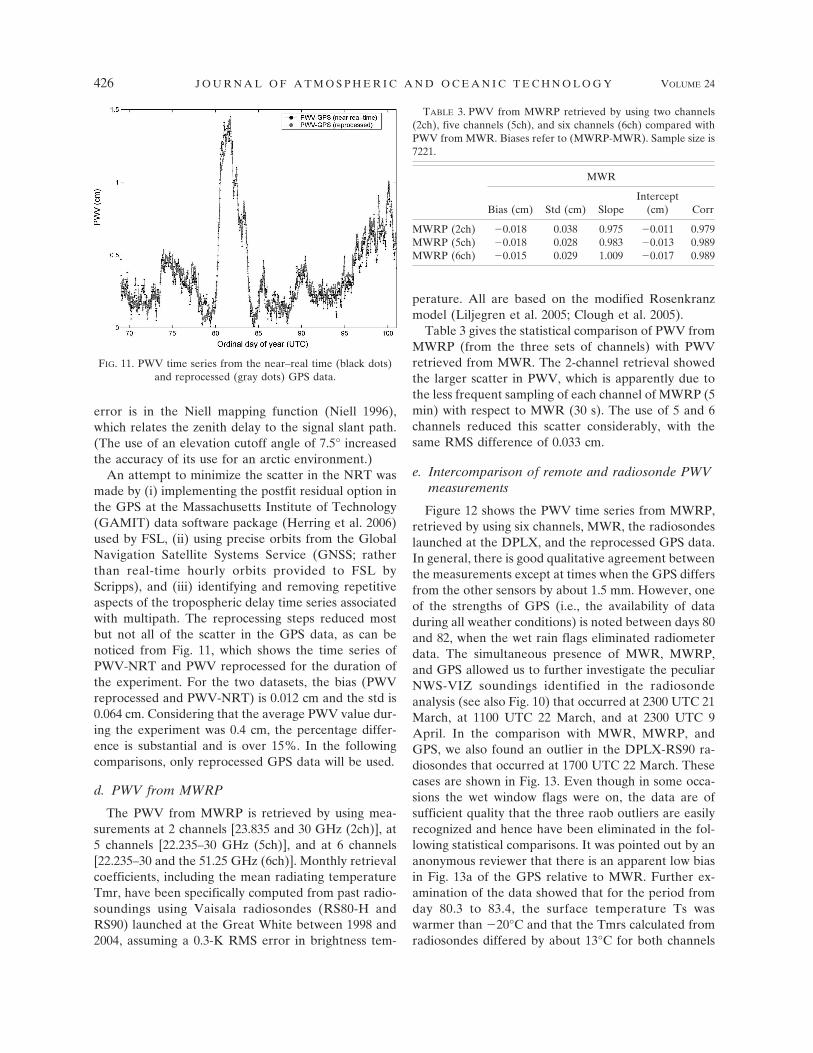
Table 3 gives the statistical comparison of PWV fromMWRP (from the three sets of channels) with PWVretrieved from MWR. The 2-channel retrieval showedthe larger scatter in PWV, which is apparently due tothe less frequent sampling of each channel of MWRP (5min) with respect to MWR (30 s). The use of 5 and 6channels reduced this scatter considerably, with thesame RMS difference of 0.033 cm.
e. Intercomparison of remote and radiosonde PWVmeasurements
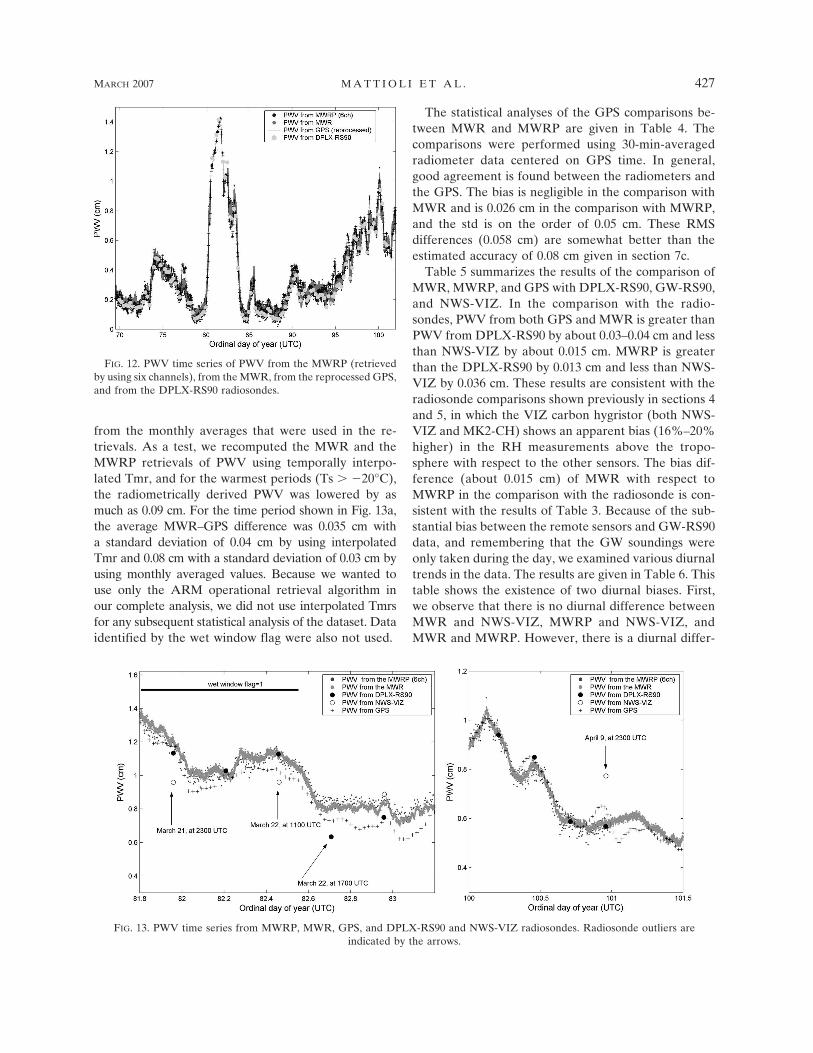
Figure 12 shows the PWV time series from MWRP,retrieved by using six channels, MWR, the radiosondeslaunched at the DPLX, and the reprocessed GPS data.In general, there is good qualitative agreement betweenthe measurements except at times when the GPS differsfrom the other sensors by about 1.5 mm. However, oneof the strengths of GPS (i.e., the availability of dataduring all weather conditions) is noted between days 80and 82, when the wet rain flags eliminated radiometerdata. The simultaneous presence of MWR, MWRP,and GPS allowed us to further investigate the peculiarNWS-VIZ soundings identified in the radiosondeanalysis (see also Fig. 10) that occurred at 2300 UTC 21March, at 1100 UTC 22 March, and at 2300 UTC 9April. In the comparison with MWR, MWRP, andGPS, we also found an outlier in the DPLX-RS90 ra-diosondes that occurred at 1700 UTC 22 March. Thesecases are shown in Fig. 13. Even though in some occa-sions the wet window flags were on, the data are ofsufficient quality that the three raob outliers are easilyrecognized and hence have been eliminated in the fol-lowing statistical comparisons. It was pointed out by ananonymous reviewer that there is an apparent low biasin Fig. 13a of the GPS relative to MWR. Further ex-amination of the data showed that for the period fromday 80.3 to 83.4, the surface temperature Ts waswarmer than �20°C and that the Tmrs calculated fromradiosondes differed by about 13°C for both channels
FIG. 11. PWV time series from the near–real time (black dots)and reprocessed (gray dots) GPS data.
TABLE 3. PWV from MWRP retrieved by using two channels(2ch), five channels (5ch), and six channels (6ch) compared withPWV from MWR. Biases refer to (MWRP-MWR). Sample size is7221.
MWR
Bias (cm) Std (cm) SlopeIntercept
(cm) Corr
MWRP (2ch) �0.018 0.038 0.975 �0.011 0.979MWRP (5ch) �0.018 0.028 0.983 �0.013 0.989MWRP (6ch) �0.015 0.029 1.009 �0.017 0.989
426 J O U R N A L O F A T M O S P H E R I C A N D O C E A N I C T E C H N O L O G Y VOLUME 24
from the monthly averages that were used in the re-trievals. As a test, we recomputed the MWR and theMWRP retrievals of PWV using temporally interpo-lated Tmr, and for the warmest periods (Ts � �20°C),the radiometrically derived PWV was lowered by asmuch as 0.09 cm. For the time period shown in Fig. 13a,the average MWR–GPS difference was 0.035 cm witha standard deviation of 0.04 cm by using interpolatedTmr and 0.08 cm with a standard deviation of 0.03 cm byusing monthly averaged values. Because we wanted touse only the ARM operational retrieval algorithm inour complete analysis, we did not use interpolated Tmrsfor any subsequent statistical analysis of the dataset. Dataidentified by the wet window flag were also not used.
The statistical analyses of the GPS comparisons be-tween MWR and MWRP are given in Table 4. Thecomparisons were performed using 30-min-averagedradiometer data centered on GPS time. In general,good agreement is found between the radiometers andthe GPS. The bias is negligible in the comparison withMWR and is 0.026 cm in the comparison with MWRP,and the std is on the order of 0.05 cm. These RMSdifferences (0.058 cm) are somewhat better than theestimated accuracy of 0.08 cm given in section 7c.
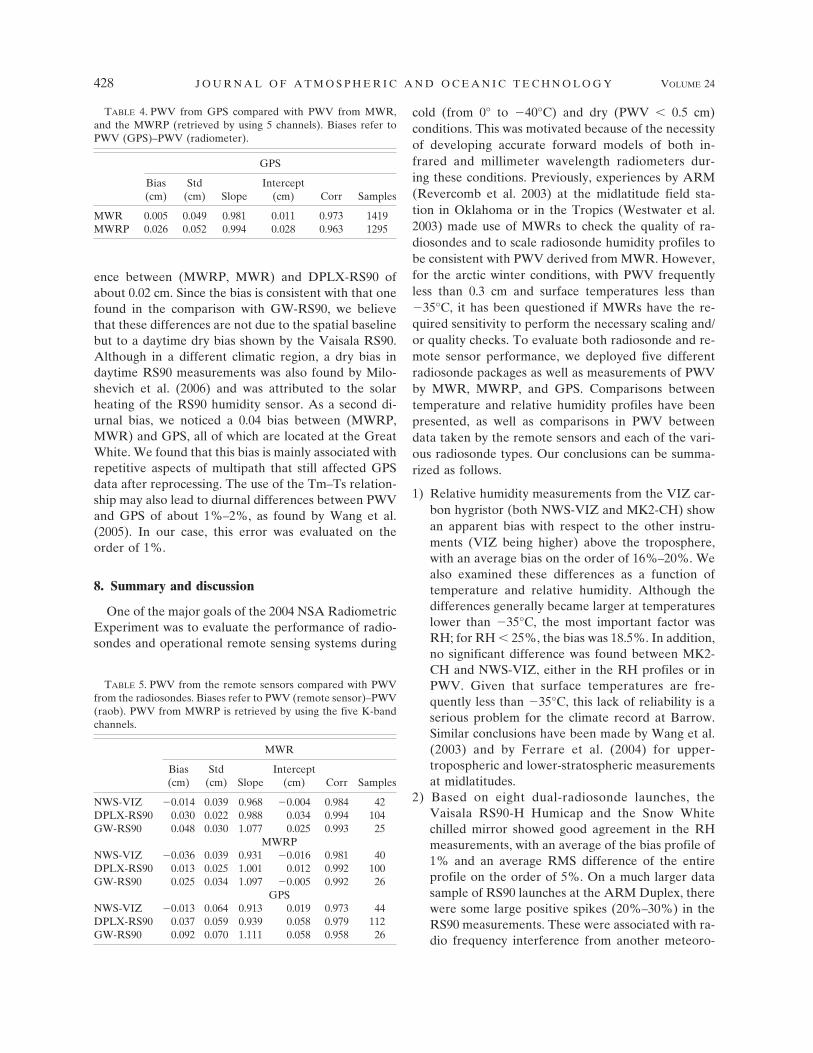
Table 5 summarizes the results of the comparison ofMWR, MWRP, and GPS with DPLX-RS90, GW-RS90,and NWS-VIZ. In the comparison with the radio-sondes, PWV from both GPS and MWR is greater thanPWV from DPLX-RS90 by about 0.03–0.04 cm and lessthan NWS-VIZ by about 0.015 cm. MWRP is greaterthan the DPLX-RS90 by 0.013 cm and less than NWS-VIZ by 0.036 cm. These results are consistent with theradiosonde comparisons shown previously in sections 4and 5, in which the VIZ carbon hygristor (both NWS-VIZ and MK2-CH) shows an apparent bias (16%–20%higher) in the RH measurements above the tropo-sphere with respect to the other sensors. The bias dif-ference (about 0.015 cm) of MWR with respect toMWRP in the comparison with the radiosonde is con-sistent with the results of Table 3. Because of the sub-stantial bias between the remote sensors and GW-RS90data, and remembering that the GW soundings wereonly taken during the day, we examined various diurnaltrends in the data. The results are given in Table 6. Thistable shows the existence of two diurnal biases. First,we observe that there is no diurnal difference betweenMWR and NWS-VIZ, MWRP and NWS-VIZ, andMWR and MWRP. However, there is a diurnal differ-
FIG. 13. PWV time series from MWRP, MWR, GPS, and DPLX-RS90 and NWS-VIZ radiosondes. Radiosonde outliers areindicated by the arrows.
FIG. 12. PWV time series of PWV from the MWRP (retrievedby using six channels), from the MWR, from the reprocessed GPS,and from the DPLX-RS90 radiosondes.
MARCH 2007 M A T T I O L I E T A L . 427
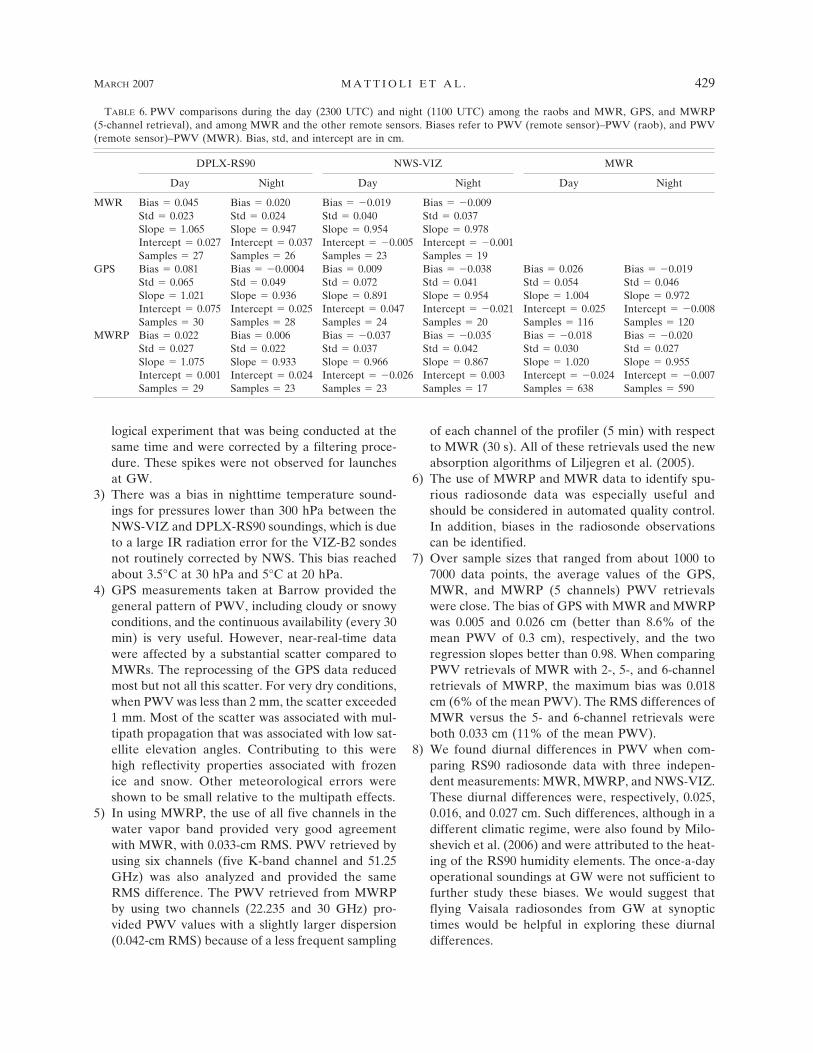
ence between (MWRP, MWR) and DPLX-RS90 ofabout 0.02 cm. Since the bias is consistent with that onefound in the comparison with GW-RS90, we believethat these differences are not due to the spatial baselinebut to a daytime dry bias shown by the Vaisala RS90.Although in a different climatic region, a dry bias indaytime RS90 measurements was also found by Milo-shevich et al. (2006) and was attributed to the solarheating of the RS90 humidity sensor. As a second di-urnal bias, we noticed a 0.04 bias between (MWRP,MWR) and GPS, all of which are located at the GreatWhite. We found that this bias is mainly associated withrepetitive aspects of multipath that still affected GPSdata after reprocessing. The use of the Tm–Ts relation-ship may also lead to diurnal differences between PWVand GPS of about 1%–2%, as found by Wang et al.(2005). In our case, this error was evaluated on theorder of 1%.
8. Summary and discussion
One of the major goals of the 2004 NSA RadiometricExperiment was to evaluate the performance of radio-sondes and operational remote sensing systems during
cold (from 0° to �40°C) and dry (PWV � 0.5 cm)conditions. This was motivated because of the necessityof developing accurate forward models of both in-frared and millimeter wavelength radiometers dur-ing these conditions. Previously, experiences by ARM(Revercomb et al. 2003) at the midlatitude field sta-tion in Oklahoma or in the Tropics (Westwater et al.2003) made use of MWRs to check the quality of ra-diosondes and to scale radiosonde humidity profiles tobe consistent with PWV derived from MWR. However,for the arctic winter conditions, with PWV frequentlyless than 0.3 cm and surface temperatures less than�35°C, it has been questioned if MWRs have the re-quired sensitivity to perform the necessary scaling and/or quality checks. To evaluate both radiosonde and re-mote sensor performance, we deployed five differentradiosonde packages as well as measurements of PWVby MWR, MWRP, and GPS. Comparisons betweentemperature and relative humidity profiles have beenpresented, as well as comparisons in PWV betweendata taken by the remote sensors and each of the vari-ous radiosonde types. Our conclusions can be summa-rized as follows.
1) Relative humidity measurements from the VIZ car-bon hygristor (both NWS-VIZ and MK2-CH) showan apparent bias with respect to the other instru-ments (VIZ being higher) above the troposphere,with an average bias on the order of 16%–20%. Wealso examined these differences as a function oftemperature and relative humidity. Although thedifferences generally became larger at temperatureslower than �35°C, the most important factor wasRH; for RH � 25%, the bias was 18.5%. In addition,no significant difference was found between MK2-CH and NWS-VIZ, either in the RH profiles or inPWV. Given that surface temperatures are fre-quently less than �35°C, this lack of reliability is aserious problem for the climate record at Barrow.Similar conclusions have been made by Wang et al.(2003) and by Ferrare et al. (2004) for upper-tropospheric and lower-stratospheric measurementsat midlatitudes.
2) Based on eight dual-radiosonde launches, theVaisala RS90-H Humicap and the Snow Whitechilled mirror showed good agreement in the RHmeasurements, with an average of the bias profile of1% and an average RMS difference of the entireprofile on the order of 5%. On a much larger datasample of RS90 launches at the ARM Duplex, therewere some large positive spikes (20%–30%) in theRS90 measurements. These were associated with ra-dio frequency interference from another meteoro-
TABLE 4. PWV from GPS compared with PWV from MWR,and the MWRP (retrieved by using 5 channels). Biases refer toPWV (GPS)–PWV (radiometer).
GPS
Bias(cm)
Std(cm) Slope
Intercept(cm) Corr Samples
MWR 0.005 0.049 0.981 0.011 0.973 1419MWRP 0.026 0.052 0.994 0.028 0.963 1295
TABLE 5. PWV from the remote sensors compared with PWVfrom the radiosondes. Biases refer to PWV (remote sensor)–PWV(raob). PWV from MWRP is retrieved by using the five K-bandchannels.
MWR
Bias(cm)
Std(cm) Slope
Intercept(cm) Corr Samples
NWS-VIZ �0.014 0.039 0.968 �0.004 0.984 42DPLX-RS90 0.030 0.022 0.988 0.034 0.994 104GW-RS90 0.048 0.030 1.077 0.025 0.993 25
MWRPNWS-VIZ �0.036 0.039 0.931 �0.016 0.981 40DPLX-RS90 0.013 0.025 1.001 0.012 0.992 100GW-RS90 0.025 0.034 1.097 �0.005 0.992 26
GPSNWS-VIZ �0.013 0.064 0.913 0.019 0.973 44DPLX-RS90 0.037 0.059 0.939 0.058 0.979 112GW-RS90 0.092 0.070 1.111 0.058 0.958 26
428 J O U R N A L O F A T M O S P H E R I C A N D O C E A N I C T E C H N O L O G Y VOLUME 24
logical experiment that was being conducted at thesame time and were corrected by a filtering proce-dure. These spikes were not observed for launchesat GW.
3) There was a bias in nighttime temperature sound-ings for pressures lower than 300 hPa between theNWS-VIZ and DPLX-RS90 soundings, which is dueto a large IR radiation error for the VIZ-B2 sondesnot routinely corrected by NWS. This bias reachedabout 3.5°C at 30 hPa and 5°C at 20 hPa.
4) GPS measurements taken at Barrow provided thegeneral pattern of PWV, including cloudy or snowyconditions, and the continuous availability (every 30min) is very useful. However, near-real-time datawere affected by a substantial scatter compared toMWRs. The reprocessing of the GPS data reducedmost but not all this scatter. For very dry conditions,when PWV was less than 2 mm, the scatter exceeded1 mm. Most of the scatter was associated with mul-tipath propagation that was associated with low sat-ellite elevation angles. Contributing to this werehigh reflectivity properties associated with frozenice and snow. Other meteorological errors wereshown to be small relative to the multipath effects.
5) In using MWRP, the use of all five channels in thewater vapor band provided very good agreementwith MWR, with 0.033-cm RMS. PWV retrieved byusing six channels (five K-band channel and 51.25GHz) was also analyzed and provided the sameRMS difference. The PWV retrieved from MWRPby using two channels (22.235 and 30 GHz) pro-vided PWV values with a slightly larger dispersion(0.042-cm RMS) because of a less frequent sampling
of each channel of the profiler (5 min) with respectto MWR (30 s). All of these retrievals used the newabsorption algorithms of Liljegren et al. (2005).
6) The use of MWRP and MWR data to identify spu-rious radiosonde data was especially useful andshould be considered in automated quality control.In addition, biases in the radiosonde observationscan be identified.
7) Over sample sizes that ranged from about 1000 to7000 data points, the average values of the GPS,MWR, and MWRP (5 channels) PWV retrievalswere close. The bias of GPS with MWR and MWRPwas 0.005 and 0.026 cm (better than 8.6% of themean PWV of 0.3 cm), respectively, and the tworegression slopes better than 0.98. When comparingPWV retrievals of MWR with 2-, 5-, and 6-channelretrievals of MWRP, the maximum bias was 0.018cm (6% of the mean PWV). The RMS differences ofMWR versus the 5- and 6-channel retrievals wereboth 0.033 cm (11% of the mean PWV).
8) We found diurnal differences in PWV when com-paring RS90 radiosonde data with three indepen-dent measurements: MWR, MWRP, and NWS-VIZ.These diurnal differences were, respectively, 0.025,0.016, and 0.027 cm. Such differences, although in adifferent climatic regime, were also found by Milo-shevich et al. (2006) and were attributed to the heat-ing of the RS90 humidity elements. The once-a-dayoperational soundings at GW were not sufficient tofurther study these biases. We would suggest thatflying Vaisala radiosondes from GW at synoptictimes would be helpful in exploring these diurnaldifferences.
TABLE 6. PWV comparisons during the day (2300 UTC) and night (1100 UTC) among the raobs and MWR, GPS, and MWRP(5-channel retrieval), and among MWR and the other remote sensors. Biases refer to PWV (remote sensor)–PWV (raob), and PWV(remote sensor)–PWV (MWR). Bias, std, and intercept are in cm.
DPLX-RS90 NWS-VIZ MWR
Day Night Day Night Day Night
MWR Bias � 0.045 Bias � 0.020 Bias � �0.019 Bias � �0.009Std � 0.023 Std � 0.024 Std � 0.040 Std � 0.037Slope � 1.065 Slope � 0.947 Slope � 0.954 Slope � 0.978Intercept � 0.027 Intercept � 0.037 Intercept � �0.005 Intercept � �0.001Samples � 27 Samples � 26 Samples � 23 Samples � 19
GPS Bias � 0.081 Bias � �0.0004 Bias � 0.009 Bias � �0.038 Bias � 0.026 Bias � �0.019Std � 0.065 Std � 0.049 Std � 0.072 Std � 0.041 Std � 0.054 Std � 0.046Slope � 1.021 Slope � 0.936 Slope � 0.891 Slope � 0.954 Slope � 1.004 Slope � 0.972Intercept � 0.075 Intercept � 0.025 Intercept � 0.047 Intercept � �0.021 Intercept � 0.025 Intercept � �0.008Samples � 30 Samples � 28 Samples � 24 Samples � 20 Samples � 116 Samples � 120
MWRP Bias � 0.022 Bias � 0.006 Bias � �0.037 Bias � �0.035 Bias � �0.018 Bias � �0.020Std � 0.027 Std � 0.022 Std � 0.037 Std � 0.042 Std � 0.030 Std � 0.027Slope � 1.075 Slope � 0.933 Slope � 0.966 Slope � 0.867 Slope � 1.020 Slope � 0.955Intercept � 0.001 Intercept � 0.024 Intercept � �0.026 Intercept � 0.003 Intercept � �0.024 Intercept � �0.007Samples � 29 Samples � 23 Samples � 23 Samples � 17 Samples � 638 Samples � 590
MARCH 2007 M A T T I O L I E T A L . 429
9) In an anomalously warm period, a small bias wasfound in radiometric retrievals of PWV (as large as0.09 cm). This was due to the use of a monthly av-eraged mean radiating temperature that was used inthe retrievals. To overcome such biases, tempera-ture profile retrievals from MWRP could be used.For locations in which such information is not avail-able, the use of temporally interpolated values com-puted from radiosondes or from numerical forecastmodels is suggested.
On 1 April 2006, ARM began launching two extrasoundings per day (0600 and 1800 UTC) but not at thesynoptic times of the NWS. However, the increasedsoundings should still be valuable in studying diurnaleffects. Other works in progress will be focused on de-veloping forward models for the millimeter wavelengthradiometric observations that were taken during the2004 IOP and are currently being taken by ARM at theNSA.
Acknowledgments. The work presented in this paperwas sponsored by the Environmental Sciences Divisionof the Department of Energy under the AtmosphericRadiation Measurement Program. The authors wish tothank Dr. Janet Machol and Dr. P. Ola Persson ofNOAA/ESRL//PSD for their useful comments on themanuscript.
REFERENCES
Bevis, M., S. Businger, T. A. Herring, C. Rocken, R. A. Anthes,and R. H. Ware, 1992: GPS meteorology: Remote sensing ofatmospheric water vapor using the global positioning system.J. Geophys. Res., 97 (D14), 15 787–15 801.
——, ——, S. Chiswell, T. A. Herring, R. A. Anthes, C. Rocken,and R. H. Ware, 1994: GPS meteorology: Mapping zenith wetdelays onto precipitable water. J. Appl. Meteor., 33, 379–386.
Blackmore, W. H., and B. Taubvurtzel, 1999: Environmentalchamber tests on NWS radiosonde humidity sensors. Pre-prints, 11th Symp. on Meteorological Observations and In-strumentation, Dallas, TX, Amer. Meteor. Soc., 259–262.
Cimini, D., A. J. Gasiewski, M. Klein, E. R. Westwater, V. Leuski,and S. Dowlatshahi, 2005: Ground-based scanning radiom-eter measurements during the Water Vapor Intensive Opera-tional Period 2004: A valuable new dataset for the study ofthe Arctic atmosphere. Proc. 15th Atmospheric RadiationMeasurement (ARM) Science Team Meeting, Daytona Beach,FL, U.S. Department of Energy. [Available online athttp://www.arm.gov/publications/proceedings/conf15/extended_abs/cimini_d.pdf.]
Clough, S. A., P. D. Brown, D. D. Turner, T. R. Shippert, J. C.Liljegren, D. C. Tobin, H. E. Revercomb, and R. O. Knute-son, 1999: Effect on the calculated spectral surface radiancesdue to MWR scaling of sonde water vapor profiles. Proc.Ninth Atmospheric Radiation Measurement (ARM) ScienceTeam Meeting, Washington, DC, U.S. Department of Energy.
[Available online at http://www.arm.gov/publications/proceedings/conf09/extended_abs/clough_sa.pdf.]
——, M. W. Shephard, E. J. Mlawer, J. S. Delamere, M. J. Iacono,K. Cady-Pereira, S. Boukabara, and P. D. Brown, 2005:Atmospheric radiative transfer modeling: A summary of theAER codes. J. Quant. Spectrosc. Radiat. Transfer, 91, 233–244.
Davis, J. L., L. T. A. Herring, I. I. Shapiro, A. E. Rogers, and G.Elgered, 1985: Geodesy by radio interferometry: Effects ofatmospheric modeling errors on estimates of baseline length.Radio Sci., 20, 1593–1607.
Elgered, G., 1993: Tropospheric radio-path delay from ground-based microwave radiometry. Atmospheric Remote Sensingby Microwave Radiometry, M. A. Janssen, Ed., J. Wiley &Sons, 218–258.
Ferrare, R. A., and Coauthors, 2004: Characterization of upper-troposphere water vapor measurements during AFWEX us-ing LASE. J. Atmos. Oceanic Technol., 21, 1790–1808.
Fujiwara, M., M. Shiotani, F. Hasebe, H. Vömel, S. J. Oltmans,P. W. Ruppert, T. Horinouchi, and T. Tsuda, 2003: Perfor-mance of the Meteolabor “Snow White” chilled-mirror hy-grometer in the tropical troposphere: Comparisons with theVaisala RS80 A/H-Humicap sensors. J. Atmos. OceanicTechnol., 20, 1534–1542.
Gutman, S. I., S. R. Sahm, S. G. Benjamin, B. E. Schwartz, K. L.Holub, J. Q. Stewart, and T. L. Smith, 2004a: Rapid retrievaland assimilation of ground based gps precipitable water ob-servations at the NOAA Forecast Systems Laboratory: Im-pact on weather forecasts. J. Meteor. Soc. Japan, 82 (1B),351–360.
——, ——, ——, and T. L. Smith, 2004b: GPS water vapor obser-vation errors. Preprints, Eighth Symp. on Integrated Observ-ing and Assimilation Systems for Atmosphere, Oceans, andLand Surface, Seattle, WA, Amer. Meteor. Soc., CD-ROM,8.3.
Han, Y., and E. R. Westwater, 2000: Analysis and improvement oftipping calibration for ground-based microwave radiometers.IEEE Trans. Geosci. Remote Sens., 38, 1260–1276.
Herring, T. A., R. W. King, and S. C. McClusky, 2006: GPSAnalysis at MIT (GAMIT) reference manual, release 10.3.Massachusetts Institute of Technology, 182 pp.
Hewison, T., D. Cimini, L. Martin, C. Gaffard, and J. Nash, 2006:Validating clear air absorption models using ground-basedmicrowave radiometers and vice-versa. Meteor. Z., 15, 27–36.
Holland, G. J., and Coauthors, 2001: The aerosonde robotic air-craft: A new paradigm for environmental observations. Bull.Amer. Meteor. Soc., 82, 889–901.
Liljegren, J. C., 2000: Automatic self-calibration of ARM micro-wave radiometers. Microwave Radiometry and Remote Sens-ing of the Earth’s Surface and Atmosphere, P. Pampaloni andS. Paloscia, Eds., VSP Press, 433–443.
——, and B. M. Lesht, 2004: Preliminary results with the twelve-channel microwave radiometer profiler at the North Slope ofAlaska Climate Research Facility. Proc. 14th AtmosphericRadiation Measurement (ARM) Science Team Meeting, Al-buquerque, NM, U.S. Department of Energy. [Available on-line at http://www.arm.gov/publications/proceedings/conf14/extended_abs/liljegren-jc.pdf.]
——, S.-A. Boukabara, K. Cady-Pereira, and S. A. Clough, 2005:The effect of the half-width of the 22-GHz water vapor lineon retrievals of temperature and water vapor profiles with a
430 J O U R N A L O F A T M O S P H E R I C A N D O C E A N I C T E C H N O L O G Y VOLUME 24
twelve-channel microwave radiometer. IEEE Trans. Geosci.Remote Sens., 43, 1102–1108.
Mattioli, V., E. R. Westwater, S. I. Gutman, and V. R. Morris,2005a: Forward model studies of water vapor using scanningmicrowave radiometers, global positioning system, and radio-sondes during the Cloudiness Inter-Comparison Experiment.IEEE Trans. Geosci. Remote Sens., 43, 1012–1021.
——, ——, D. Cimini, J. S. Liljegren, B. M. Lesht, S. I. Gutman,and F. Schmidlin, 2005b: Analysis of radiosonde and precipi-table water vapor data from the 2004 North Slope of AlaskaArctic Winter Radiometric Experiment. Proc. 15th Atmo-spheric Radiation Measurement (ARM) Science Team Meet-ing, Daytona Beach, FL, U.S. Department of Energy. [Avail-able online at http://www.arm.gov/publications/proceedings/conf15/extended_abs/mattioli_v.pdf.]
Miloshevich, L. M., H. Vömel, D. N. Whiteman, B. M. Lesht, F. J.Schmidlin, and F. Russo, 2006: Absolute accuracy of watervapor measurements from six operational radiosonde typeslaunched during AWEX-G and implications for AIRS vali-dation. J. Geophys. Res., 111, D09S10, doi:10.1029/2005JD006083.
Niell, A. E., 1996: Global mapping functions for the atmospheredelay at radio wavelengths. J. Geophys. Res., 101 (B2), 3227–3246.
Paukkunen, A., V. Antikainen, and H. Jauhiainen, 2001: Accu-racy and performance of the new Vaisala RS90 radiosonde inoperational use. Preprints, 11th Symp. on Meteorological Ob-servations and Instrumentation, Albuquerque, NM, Amer.Meteor. Soc., CD-ROM, 4.5.
Racette, P. E., and Coauthors, 2005: Measurement of lowamounts of precipitable water vapor using ground-based mil-limeterwave radiometry. J. Atmos. Oceanic Technol., 22, 317–337.
Revercomb, H. E., and Coauthors, 2003: The ARM Programs’swater vapor intensive observation periods: Overview, initialaccomplishments, and future challenges. Bull. Amer. Meteor.Soc., 84, 217–236.
Saastamoinen, J., 1972: Introduction to practical computation ofastronomical refraction. Bull. Geod., 106, 383–397.
Schmidlin, F. J., and E. T. Northam, 2005: Standards for evaluat-ing radiosonde measurements. Preprints, Ninth Symp. on In-tegrated Observing and Assimilation Systems for the Atmo-sphere, Oceans, and Land Surface, San Diego, CA, Amer.Meteor. Soc., CD-ROM, 11.6.
——, J. K. Luers, and P. D. Huffman, 1986: Preliminary estimatesof radiosonde thermistor errors. NASA Tech. Paper 2637,Wallops Island, VA, 19 pp.
Turner, D. D., and J. E. M. Goldsmith, 1999: Twenty-four-hourRaman lidar water vapor measurements during the Atmo-
spheric Radiation Measurement Program’s 1996 and 1997water vapor intensive observation periods. J. Atmos. OceanicTechnol., 16, 1062–1076.
——, B. M. Lesht, S. A. Clough, J. C. Liljegren, H. E. Revercomb,and D. C. Tobin, 2003: Dry bias and variability in VaisalaRS80-H radiosondes: The ARM experience. J. Atmos. Oce-anic Technol., 20, 117–132.
Vömel, H., M. Fujiwara, M. Shiotani, F. Hasebe, S. J. Oltmans,and J. E. Barnes, 2003: The behavior of the Snow Whitechilled-mirror hygrometer in extremely dry conditions. J. At-mos. Oceanic Technol., 20, 1560–1567.
Wang, J., H. L. Cole, D. J. Carlson, E. R. Miller, K. Beierle, A.Paukkunen, and T. K. Laine, 2002: Correction of humiditymeasurement errors from the Vaisala RS80 radiosonde—Application to TOGA COARE data. J. Atmos. OceanicTechnol., 19, 981–1002.
——, D. J. Carlson, D. B. Parsons, T. F. Hock, D. Lauritsen, H. L.Cole, K. Beierle, and E. Chamberlain, 2003: Performance ofoperational radiosonde humidity sensors in direct compari-son with a chilled mirror dew-point hygrometer and its cli-mate implication. Geophys. Res. Lett., 30, 1860, doi:10.1029/2003GL016985.
——, L. Zhang, and A. Dai, 2005: Global estimates of water-vapor-weighted mean temperature of the atmosphere forGPS applications. J. Geophys. Res., 110, D21101, doi:10.1029/2005JD006215.
Ware, R. H., and Coauthors, 2000: SuomiNet: A real-time na-tional GPS network for atmospheric research and education.Bull. Amer. Meteor. Soc., 81, 677–694.
Westwater, E. R., 1997: Remote sensing of tropospheric tempera-ture and moisture by integrated observing systems. Bull.Amer. Meteor. Soc., 78, 1991–2006.
——, B. Stankov, D. Cimini, Y. Han, J. A. Shaw, B. M. Lesht, andC. N. Long, 2003: Radiosonde humidity soundings and mi-crowave radiometers during Nauru99. J. Atmos. OceanicTechnol., 20, 953–971.
——, and Coauthors, 2004: The 2004 North Slope of Alaska Arc-tic Winter Radiometric Experiment. Proc. 14th AtmosphericRadiation Measurement (ARM) Science Team Meeting, Al-buquerque, NM, U.S. Department of Energy. [Available on-line at http://www.arm.gov/publications/proceedings/conf14/extended_abs/westwater-er.pdf.]
——, and Coauthors, 2005: Microwave and millimeter waveforward modeling results from the 2004 North Slope ofAlaska Arctic Winter Radiometric Experiment. Proc.15th Atmospheric Radiation Measurement (ARM) ScienceTeam Meeting, Daytona Beach, FL, U.S. Department of En-ergy. [Available online at http://www.arm.gov/publications/proceedings/conf15/extended_abs/westwater_er.pdf.]
MARCH 2007 M A T T I O L I E T A L . 431