Embed Size (px)
Citation preview
ANALYSIS OF SELECTED MEASURES PROMOTING THE CONSTRUCTION
AND OPERATION OF GREENER SHIPS
Analysis of selected measures promoting the construction and operation of greener ships
2
FOREWORD This report was prepared under the Council Working Party on Shipbuilding (WP6) under item "government policies encouraging the construction and operation of green ships". The Secretariat uploaded the report on OLIS and sent it by email for possible comments and declassification by written procedure to delegates on 17 October 2017. No comments were received by 3 November indicating that delegates agreed to declassify the report. The report will be made available on the WP6 website: http://www.oecd.org/sti/shipbuilding and will be available for participants of the 20 November WP6 Workshop on Green growth of maritime industries and of the 21-22 November Green Growth and Sustainable Development Forum on Greening the ocean economy. This document, as well as any data and any map included herein, are without prejudice to the status of or sovereignty over any territory, to the delimitation of international frontiers and boundaries and to the name of any territory, city or area. The statistical data for Israel are supplied by and under the responsibility of the relevant Israeli authorities. The use of such data by the OECD is without prejudice to the status of the Golan Heights, East Jerusalem and Israeli settlements in the West Bank under the terms of international law.” © OECD 2017; You can copy, download or print OECD content for your own use, and you can include excerpts from OECD publications, databases and multimedia products in your own documents, presentations, blogs, websites and teaching materials, provided that suitable acknowledgment of OECD as source and copyright owner is given. All requests for commercial use and translation rights should be submitted to [email protected].
Analysis of selected measures promoting the construction and operation of greener ships
3
TABLE OF CONTENTS
EXECUTIVE SUMMARY ........................................................................................................... 5
CHAPTER I: INTRODUCTION .................................................................................................. 8
1.1. International framework ..................................................................................................... 8 1.2. Outlines of policies and measures ...................................................................................... 8 1.3. Scope of the report ............................................................................................................ 10
CHAPTER II: INTERNATIONAL GHG EMISSION FROM SHIPPING ................................ 11
2.1. Background ....................................................................................................................... 11 2.2. Future CO2 emissions ....................................................................................................... 12
2.2.1. Methodologies ............................................................................................................ 12 2.2.3. Projection of future CO2 emissions ............................................................................ 14
2.3. Estimation of EEDI values ............................................................................................... 15 2.3.1. Estimation of EEDI values ......................................................................................... 15 2.3.2. Assessment of impact of EEDI requirement on estimated EEDI values ................... 16
2.4. Analysis of ship design affecting EEDI ............................................................................ 18 2.5. National policies ............................................................................................................... 21
2.5.1. Overview of national policies addressing air pollutant emission ............................... 21 2.5.2. Assessment of scrap and build subsidy in China ....................................................... 21
2.6. Chapter summary .............................................................................................................. 23
CHAPTER III: AIR POLLUTION ............................................................................................. 24
3.1. Background ....................................................................................................................... 24 3.2. Emission Control Areas (ECAs) ....................................................................................... 24 3.3. Effects of reginal stricter regulation on fuel types and eco-friendly equipment ............... 26
3.3.1. Changes in fuel type used for new vessels ................................................................. 26 3.3.2. Trend in vessels equipped with sulphur scrubbers ..................................................... 28 3.3.3. Trend in vessels equipped with denitrification systems ............................................. 29
3.4. National policies ............................................................................................................... 31 3.4.1. Overview of national policies addressing air pollutant emission ............................... 31 3.4.2 Assessment of national policies addressing air pollutant emissions ........................... 32
3.5. Chapter Summary ............................................................................................................. 34
CHAPTER IV: BALLAST WATER TREATMENT ................................................................. 35
4.1. Background ....................................................................................................................... 35 4.2 Estimation of yard capacity to be devoted to retrofitting ships with BWMS .................... 35
Demand for retrofitting existing ships with BWMS ............................................................ 36 Repair yards’ time spent for retrofitting vessels with BWMS ............................................. 36
4.3. Chapter summary .............................................................................................................. 37
CHAPTER V: GREEN INNOVATION IN THE SHIP SECTOR ............................................. 38
Background .............................................................................................................................. 38
Analysis of selected measures promoting the construction and operation of greener ships
4
Overview of innovation activities in ship sector ..................................................................... 38 Analysis on innovation activities for climate change in the maritime sector .......................... 40
Patent activities for climate change in maritime sector ........................................................ 40 Case study on R&D support for green innovation in Japan ................................................. 41
Chapter summary ..................................................................................................................... 44
CHAPTER VI: CONCLUDING REMARKS ............................................................................. 45
GHG Emissions ....................................................................................................................... 45 Air Pollution ............................................................................................................................ 45 Ballast Water Management ...................................................................................................... 46
REFERENCES ............................................................................................................................ 47
ANNEX I: BAR, LOW/HIGH/MEAN OF EEDI VALUES BY VESSEL CLASS ................... 50
ANNEX II: EVOLUTION OF DESIGN PARAMETERS ......................................................... 54
ANNEX III: INNOVATIVE TECHNOLOGY FACTORS ........................................................ 56
ANNEX IV: LIST OF REGIONAL AND NATIONAL POLICIES AND MEASURES .......... 59
NOTES ........................................................................................................................................ 65
Analysis of selected measures promoting the construction and operation of greener ships
5
EXECUTIVE SUMMARY
Maritime freight transport is indispensable to world trade and globalization as around 80 per cent of global trade by volume are carried by sea and are handled by ports worldwide. The increase in greenhouse gases (GHGs), local and regional air pollutants emissions, and the spread of invasive aquatic species by international shipping are driven by this growth in seaborne trade. Many of these impacts can be mitigated through improved ship design and construction. The shipbuilding and marine equipment industries are expected to play a large role in mitigating adverse impacts of shipping by focusing their research, development and production activities on the improvement of the environmental performance of ocean-going vessels, and by complying with national and international regulations.
As the WP6 is a unique international forum discussing policies and measures impacting the shipbuilding industry and marine equipment sectors, this report focuses on the impact of environmental related policies and measures on the shipbuilding and ship machinery industries. This paper follows WP6 reports assessing selected policies addressing the reduction of CO2 emissions in 2013 and a document on the impact of international regulation on innovation activities in the maritime sector.
This report aims to assess policies implemented at international, regional and national levels by pollutant targets, and to study their impacts on shipbuilding, ship repair and marine equipment industries. Chapters II, III, and IV deal with GHGs, air pollution and ballast water, respectively. In each chapter, all levels of policy implementation, whether international, regional or national, are assessed. As some of these measures were implemented rather recently, this report does not include the assessment of policies commenced in and after 2014 due to data availability and lags in responses. Chapter V focuses on innovation in the ship sector including an overview of patent activities as well as the assessment of support policies impacting Supply & Demand.
Policy actions at international (e.g. the Energy Efficiency Design Index), regional (e.g. restrictions of air pollution in Emission Control Areas) and national levels, have an impact on the environmental performance of the shipping sector. They also contribute to technology developments as well as growth in shipbuilding, repair and machinery industry by creating new business opportunities (i.e. retrofitting ballast water management system, new building demand stem from scrap and build subsidies). Stricter regulation and financial support measures are often combined in complementary manner at the national level in order to promote the development of greener fleets. Interestingly, national policies appear to have had a significant impact on how stakeholders comply with regulations.
It is important to note that the objective of this report is not to assess whether the costs associated with the implementation of the measures assessed are exceeded by the benefits (i.e. reductions in GHGs and air pollutants, fewer negative impacts on marine biodiversity). Nor is the objective of the report to assess issues related to policy design and whether the instruments applied are the least-cost measures (i.e. comparing the economic efficiency of carbon taxes vs performance standards such as the EEDI). The objective of the report is more modest – assessing the implications of existing measures on the activity of the sector.
Analysis of selected measures promoting the construction and operation of greener ships
6
GHG Emissions
In principle, the EEDI has the potential to have a significant impact on future CO2 emissions and would lead to a reduction from bulkers, tankers and containers by around 115 million CO2 ton by 2035 relative to “business as usual”, which is equivalent to 38% of total CO2 emissions from these segments in 2015. However, more efforts for further emission reduction would be needed, as EEDI requirements are more effective on vessels having a very low energy efficiency, rather than in promoting very energy efficient vessels. Therefore, policies and measures encouraging the construction and operation of “over-compliant” vessels (relative to the EEDI) are necessary in order to seek further reduction in CO2 emissions from ships.
Some trends in design changes, which affect recorded EEDI values, were observed for bulkers depending on size categories, while these trends are not observed for tankers. It is remarkable that the reduction in design speed was not a measure frequently adopted to meet required EEDI values for most vessel classes (except handysize bulkers) until 2015. On the contrary, changes in hull design are more prominent for larger size bulkers. This implies that the first reaction to comply with the EEDI requirement appears to be the improvement of vessel designs rather than the reduction in design speed.
At the national, the Chinese “scrap and build subsidy scheme” could contribute to decreasing CO2 emissions from bulkers, as EEDI values of Chinese owned vessels show improvements for bulkers when comparing scrapped to newly built vessels. However, the opposite result was observed for tankers. Further analysis may be necessary to assess the reason for this counter-intuitive result for tankers by analysing the impact of hull design (double and single hull) on the EEDI values.
Air Pollution
Stricter restrictions on the sulphur content of fuels in ECAs contribute to a faster development of LNG capable vessels. However, tighter restriction in ECAs doesn’t appear to have contributed to significantly develop the use of scrubbers or the construction of Marine Gas Oil (MGO) capable vessels, as similar adoption trends were experienced by fleets flagged in or owned by non-ECA countries. Moreover, the impact of stricter rules notably in terms of the adoption of denitrification systems has not been yet observed as the new restrictions apply for vessels keel laid on and after 1st January 2016.
National policies in the form of financial supports such as investment aid (Finland) and the “NOx fund” (Norway) significantly impacted the way stakeholders comply with environmental regulation.
Ballast Water Management
The Ballast Water Management (BWM) Convention, which is a major step towards limiting the spread of invasive aquatic species, could have a significant impact on the ship repair industry, contributing to activities representing around 20% to 50% of retrofitting capacity in the coming 7 years. However, as information on the number of docks is not comprehensive and, moreover, the information on closures is not applicable to the repair and fabricator/conversion yards, further analysis is necessary for more accurate estimation of the impact of the BWM Convention on capacity utilisation of repair yards.
Analysis of selected measures promoting the construction and operation of greener ships
7
As EEDI requirements contribute to reducing the production of vessels having a low environmental performance, but do not seem to lead to an increase of the construction of more energy efficient vessels, this report also reviews patent activities of related technologies with a primary focus on energy efficiency and efforts to reduce carbon dioxide (CO2) and other greenhouse gases (GHGs) emissions. Our analysis finds, at the global level, no relationship between patent activities and marginal abatement costs for selected technologies, which would imply that technologies developed thanks to recent R&D activities in the ship sector are not likely to be introduced into the market in the near future. However, in some countries such as Japan, the ship sector focused on technologies with lower marginal abatement costs.
Further analysis requiring access to additional data would be needed to better understand the implementation of innovative technologies in the ship sector and the impact of policy interventions on the use of new technologies in shipping operations. The IMO’s Marine Environment Protection Committee (MEPC) 70, held in October 2016, adopted the Annex VI of the MARPOL Convention which will enter into force on 1 March 2018. The additional requirements laid out in this Annex include the necessity for ships to record and report their fuel consumption, which will enable researchers to understand the developments in the fuel efficiency of vessels in operation.
Analysis of selected measures promoting the construction and operation of greener ships
8
CHAPTER I: INTRODUCTION
Maritime freight transport is indispensable to world trade and globalization as around 80 per cent of global trade by volume are carried by sea and are handled by ports worldwide. The increase in greenhouse gases (GHGs), local and regional air pollution emissions, and the spread of invasive aquatic species by international shipping are notably driven by this growth in seaborne trade. Many of these impacts can be mitigated through improved ship design. The shipbuilding and marine equipment industries are expected to play a large role in mitigating adverse impacts of shipping by focusing their research, development and production activities on the improvement of the environmental performance of ocean-going vessels, and by complying with national and international regulations.
As the WP6 is a unique international forum discussing policies impacting shipbuilding and ship machinery, this report focuses on the impact of environmental policies and measures on these industries. The WP6 conducted a research assessing selected policies addressing the reduction of CO2 shipping emissions in 2013 and a study on the impact of international regulation on innovation activities in the maritime sector. This section summarizes the main elements of environmental regulation for the maritime sector at international, regional and national levels.
1.1. International framework
The Paris Agreement was adopted in December 2015 under the United Nations Framework Convention on Climate Change (UNFCCC). As notable exceptions, it did not cover shipping and aviation emissions. In accordance with the Article 2.2 of the Kyoto Protocol stated that Parties in Annex I should work through the International Maritime Organisation (IMO) on the limitation or reduction of GHGs emissions from ships, the IMO has played an important role regarding practical measures aiming to limit GHGs emissions. At the MEPC 70 in October 2016, the IMO approved a Roadmap for developing a comprehensive IMO strategy on reduction of GHG emissions from ships which contains new activities notably new IMO GHG studies aligned with its three-step approach aiming to improve ship energy efficiency (data collection, data analysis, decision regarding new measures if needed).
Furthermore, United Nations Sustainable Development Goal (SDG) 14 (adopted in 2015) relates to the objective to “conserve and sustainably use the oceans, seas and marine resources for sustainable development”. Shipbuilding and marine equipment industries are expected to contribute to the sustainable management of marine and coastal ecosystems and are driven by international efforts by the IMO and measures taken at regional and national levels aiming to maintain healthy and productive oceans.
1.2. Outlines of policies and measures
The IMO’s Marine Environment Protection Committee (MEPC) dealing with GHG emissions, air pollution, and biodiversity is a key forum to discuss public initiatives aiming to increase the environmental performance of the maritime sector (Table 1).
Analysis of selected measures promoting the construction and operation of greener ships
9
The WP6 has collected information on selected support measures at regional and national levels via the annual updates of the WP6 Inventory since the early 1990s. In February 2017, the WP6 Secretariat sent a questionnaire on policies and measures promoting the construction and operation of greener ships. As of September 2017, Denmark, Japan, Romania and Turkey had responded to the questionnaire. Moreover, peer reviews of shipbuilding industries have been conducted in six countries since 2012. Relevant policies and measures are also summarised in these documents. The WP6 Secretariat furthermore conducted Internet research on policies and private initiatives. In total, 16 policies and private initiatives which might have an impact on construction and operation of greener ships have been studies in this document (ANNEX I).
Regional and national policies have been implemented in response to tightened international regulations on GHG emissions, air pollution, and ballast water treatment. With respect to regional policies, there is one regulation on air pollutant implemented by the IMO and one scheme recently developed by the EIB. In addition, a variety of national policies has been implemented in different forms. Remarkably, financial incentives for purchasing greener vessels (i.e. grants, fees, funding, port fee discount, tax deduction) have been implemented to help comply with IMO regulation on air pollutants, notably in ECA countries. Innovation aid schemes dedicated to the maritime sector are implemented in some countries without any restriction on pollutant target, while the scheme in Japan is restricted to technologies contributing to the reduction in GHG emissions. Moreover, so-called “scrap and build subsidies” have been implemented in the People’s Republic of China (hereafter “China”), Norway, and Turkey. These can target multiple policy objectives.
Table 1. Policies and measures at regional and national levels
Targets Level of implementation
Authorities responsible
Form of policy Start year
Relevant chapter
GHG International IMO Regulation 2013 Chapter II National Japan R&D support for maritime sector 2008 Chapter V
Air pollution International IMO Regulation 2005 Chapter III Regional IMO Regulation 2006 Chapter III National Finland Grant for shipowners 2010 Chapter IIINational Norway Policy mix of tax and funding 2007 Chapter III
National Singapore Port fee discount and tax deduction 2011 Chapter IIIBiodiversity International IMO Regulation 2017 Chapter IV
National US Regulation 2014 Chapter IV Cross-cutting Regional EIB Loan guarantees to shipowners 2016 -
National Denmark R&D support for maritime sector 2015 Chapter V National Finland R&D support for shipbuilding 2008 Chapter VNational Norway Regulation in ferry tenders 2016 Chapter V National Turkey Subsidies for scrapping 2015 Chapter II National Norway Subsidies for scrapping and building 2016 Chapter II National China Subsidies for scrapping and building 2009 Chapter II National Romania Policy mix 2018 -
Source: OECD based on inventory, questionnaire on green ship policy, peer review
Analysis of selected measures promoting the construction and operation of greener ships
10
1.3. Scope of the report
This report focuses on the assessment of policies implemented at international, regional and national levels by pollutant targets. The analysis mainly deals with the impact of policy actions aiming for a sustainable development of the ocean economy on shipbuilding, ship repair and marine equipment industries.
Chapter II, III, and IV focus on GHG, air pollutants and ballast water treatment, respectively. In each chapter, policy measures at international/regional/national levels are assessed (Table 1). As some of these measures were commenced very recently, this report does not include the assessment of policies commenced in and after 2014. Chapter V focuses on innovation in the ship sector including the overview of patent activities as well as the assessment of S&D support policies.

Analysis of selected measures promoting the construction and operation of greener ships
11
CHAPTER II: INTERNATIONAL GHG EMISSION FROM SHIPPING
2.1. Background
The Kyoto Protocol of 1997 initiated a discussion on GHG emissions from shipping. More specifically, paragraph 2.2 granted responsibility for addressing international shipping emissions to the IMO. As a result, the IMO has played an important role as one of the places to discuss practical measures for reducing GHGs emissions at the international level. In December 2003, the IMO assembly adopted a resolution on policies and practices related to the reduction of GHG emissions from ships. The assembly asked the IMO’s Marine Environment Protection Committee (MEPC) to cooperate with the Conference of Parties (COP) to the United Nations Framework Convention on Climate Change (UNFCCC).
The IMO had comprehensively discussed several measures including international regulation on energy efficiency as well as market-based measures. To that end, the IMO adopted a mandatory energy-efficiency regulation in 2011 based on the Energy Efficiency Design Index (EEDI) to reduce GHGs from international shipping. The regulation requires new ships ordered on and after 1st January 2013 not to exceed certain thresholds of the index. The regulations apply to all ships of 400 gross tonnes and above (Box 1).
The IMO has set a reference line that corresponds to the required EEDI level for the first two years (between 2013 and 2015) which has been followed by an updated reference line for the 2nd phase (between 2015 and 2019) setting the maximum level of emissions 10% below the original one. The reference line will be tightened every five years depending on the discussions at the IMO’s MEPC which will also take into account technological developments. By 2025 the EEDI reference line is expected to be tightened by 30% from its original levels.
Box 1. Energy Efficiency Design Index (EEDI)
This mandatory index stipulates a minimum energy efficiency level per tonne mile for different ship types and size categories. (i.e. the formula is the ratio of CO2 emissions divided by the product of the ship's deadweight and speed that is measured under trial conditions with 75% of installed power).
The Required EEDI is the regulatory limit for EEDI and its calculation involves the use of “reference lines” and “reduction factors”. The basic concepts included in this regulation are:
Reference line: A baseline EEDI for each ship type, representing reference EEDI as a function of ship size
Reduction factor: This represents the percentage points for EEDI reduction relative to the reference line, as mandated by regulation for future years. This factor is used to tighten the EEDI regulations in phases over time by increasing its value.
Cut-off levels: Smaller size vessels are excluded from having a Required EEDI for some technical reasons. Thus, the regulatory text specifies the size limits. This size limit is referred to as cut off levels.
Analysis of selected measures promoting the construction and operation of greener ships
12
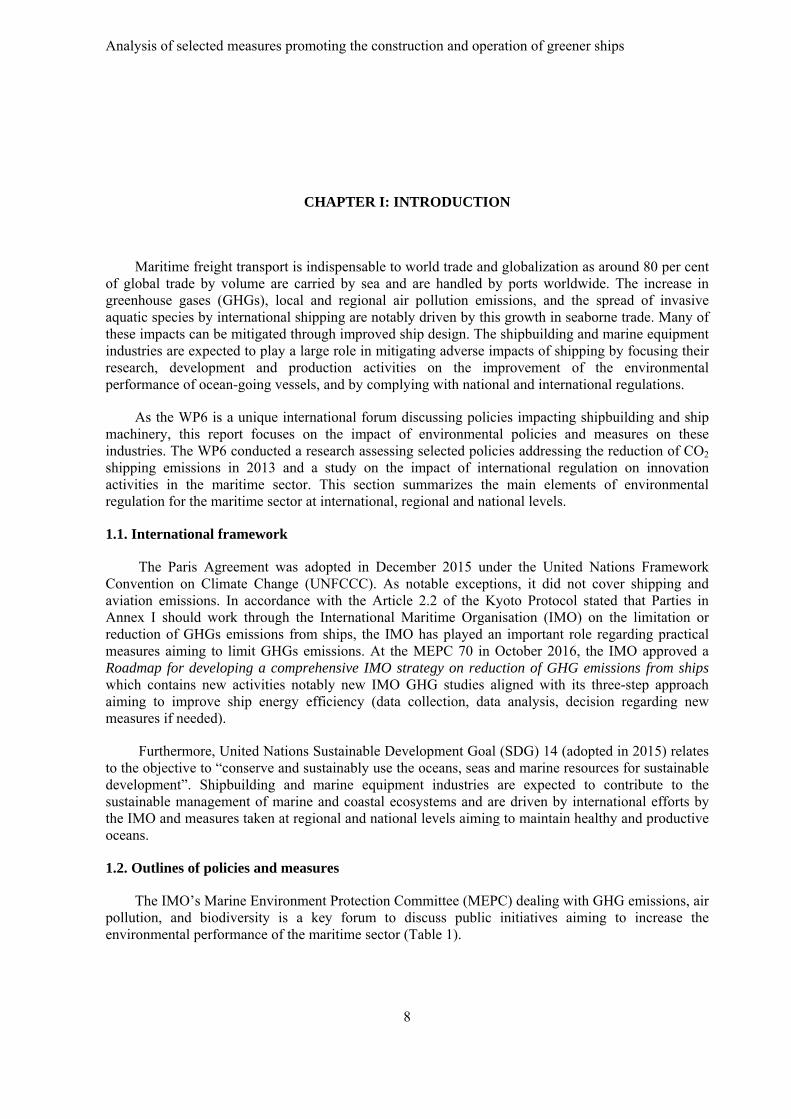
Implementation phases: the EEDI will be implemented in phases. Currently, it is in phase 1 that runs from year 2015 to 2019. Phase 2 will run from year 2020 to 2024 and phase 3 is from year 2025 onwards.
The reference line for each ship type, representing reference EEDI as a function of ship size, are developed by the IMO using data from a large number of existing ships and analysing these data. The required EEDI level is tightened every five years. The reduction factor is the percentage points for EEDI reduction relative to reference line, as mandated by regulation for future years. The value of “reduction factor” is decided by the IMO and is recorded in Regulation 21.
Source: IMO Train the Trainer (TTT) Course on Energy Efficient Ship Operation, January 2016
Since the EEDI regulation has been in place for already 4 years, (i.e. since 1st January 2013) a preliminary assessment of its impact and effectiveness can be conducted in line with the considerations of WP6 members expressed during the 115th session of the WP6 to gauge whether additional incentives would be necessary to promote the construction and operation of greener ships.
2.2. Future CO2 emissions
The main purpose of this section is to forecast future emissions from shipping. This forecast indicates a need for additional efforts to promote the construction and operation of greener ships. Future CO2 emissions from shipping are projected by the IMO and other researchers; however, the replacement of old vessels by new vessels is not fully taken into account in the projections. As the WP6 has developed a fleet survival model in order to forecast future ship demand, it can also be applied to calculate future CO2 emissions from shipping. This section presents some estimates on CO2 emissions from ships thanks to a model developed by the OECD Secretariat. Due to limited data availability, this analysis focuses on emissions from three main shipping segments i.e. bulkers, tankers and container ships.
2.2.1. Methodologies
CO2 emissions are calculated by multiplying fuel consumption with the conversion factor between fuel consumption and CO2 emissions.1 In this report, the conversion factor for Heavy Fuel Oil (HFO), 3.114 (t-CO2/t-Fuel),2 is used with the assumption that most vessels use HFO, a reasonable approximation as it accounts for 84% of the marine bunkers fuel mix (IEA 2017).
The fuel consumption for a vessel type in a future year is based on the unit fuel consumption per fleet volume (ton per gt); the expected improvements in fuel efficiency (%) resulting from compliance with the EEDI regulation; and the future fleet’s size (gt)3. Unit fuel consumption is calculated based on fuel consumption divided by fleet capacity in 2015. Table 2 presents the unit fuel consumption in 2015 based on bunker volumes in 2015 and fleet capacity in gt by vessel type.
Analysis of selected measures promoting the construction and operation of greener ships
13
Table 2. Bunker fuel data 2015 per vessel segment
Fuel consumption (million CO2-ton)
Fleet volume (million gt) Unit fuel consumption (ton/gt)
Bulkers 37.1 430.8 0.086 Tankers 41.1 263.8 0.156
Containers 18.8 223.0 0.084
Source: OECD calculation based on IHS Seaweb and Transparency Market research (2014)4
Future fleet volume is estimated on the basis of additional demand for vessels generated by seaborne trade expansion and the replacement demand for scrapped vessels (OECD, 2016). In order to take into account fuel efficiency improvements resulting from the compliance with the EEDI requirements, the future fleet is classified into three categories (Table 3). Although the EEDI requirement is based on contract year, the fleet requirement is estimated on the basis of built year. To overcome this shortcoming, the volume of fleets categorised in Table 3 are based on built years with the assumption that there is 2 years’ time lag between contract and delivery.
Table 3. Future fleet category for estimating
Rimprove; Expected fuel efficiency improvement rate Built year
Fleet category 0 0% In and before 2016 Fleet category 1 10% compared to fleets existing in 2015 between 2017 and 2021
Fleet category 2 20% compared to fleets existing in 2015 between 2022 and 2026 Fleet category 3 30% compared to fleets existing in 2015 in and after 2027 Note: Categories based on built years with the assumption of a 2-year lag between contract and delivery
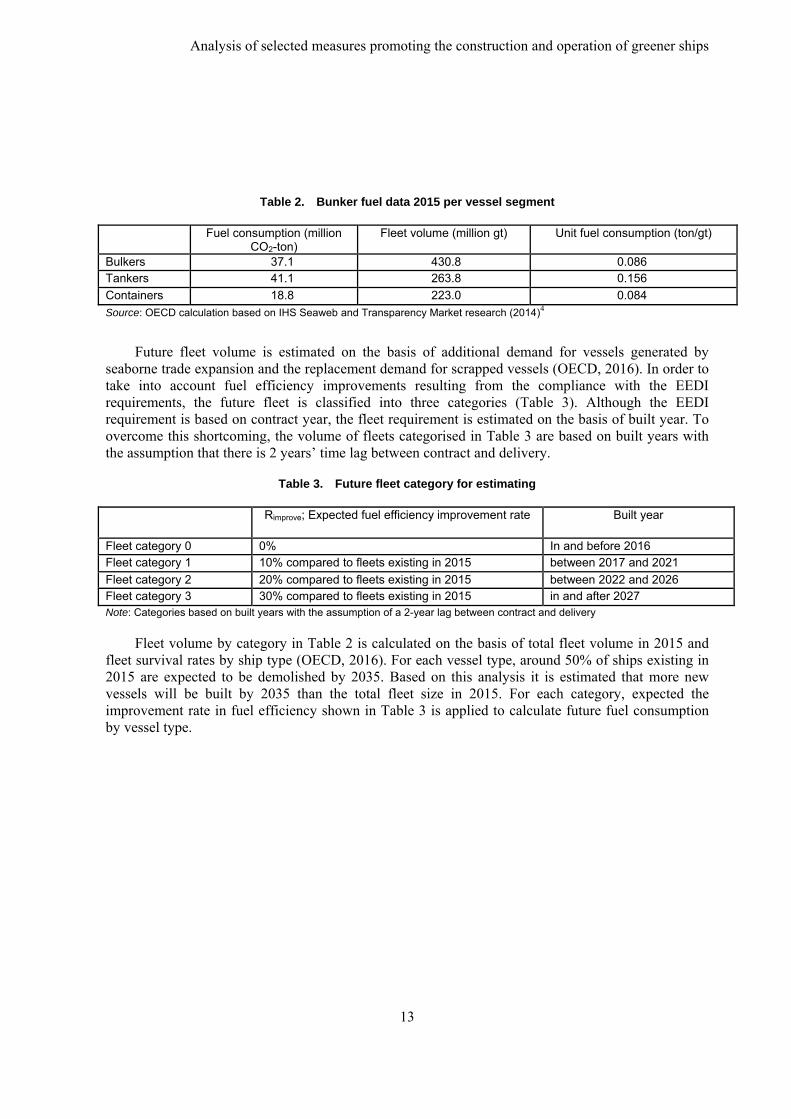
Fleet volume by category in Table 2 is calculated on the basis of total fleet volume in 2015 and fleet survival rates by ship type (OECD, 2016). For each vessel type, around 50% of ships existing in 2015 are expected to be demolished by 2035. Based on this analysis it is estimated that more new vessels will be built by 2035 than the total fleet size in 2015. For each category, expected the improvement rate in fuel efficiency shown in Table 3 is applied to calculate future fuel consumption by vessel type.
Analysis of selected measures promoting the construction and operation of greener ships
14
Figure 1. Fleet volume by category in Table 3, million gt
(a) Category 0 (b) Category 1
(c) Category 2 (d) Category 3
Source: OECD calculation based on IHS Seaweb and Transparency Market research (2014)5
2.2.3. Projection of future CO2 emissions
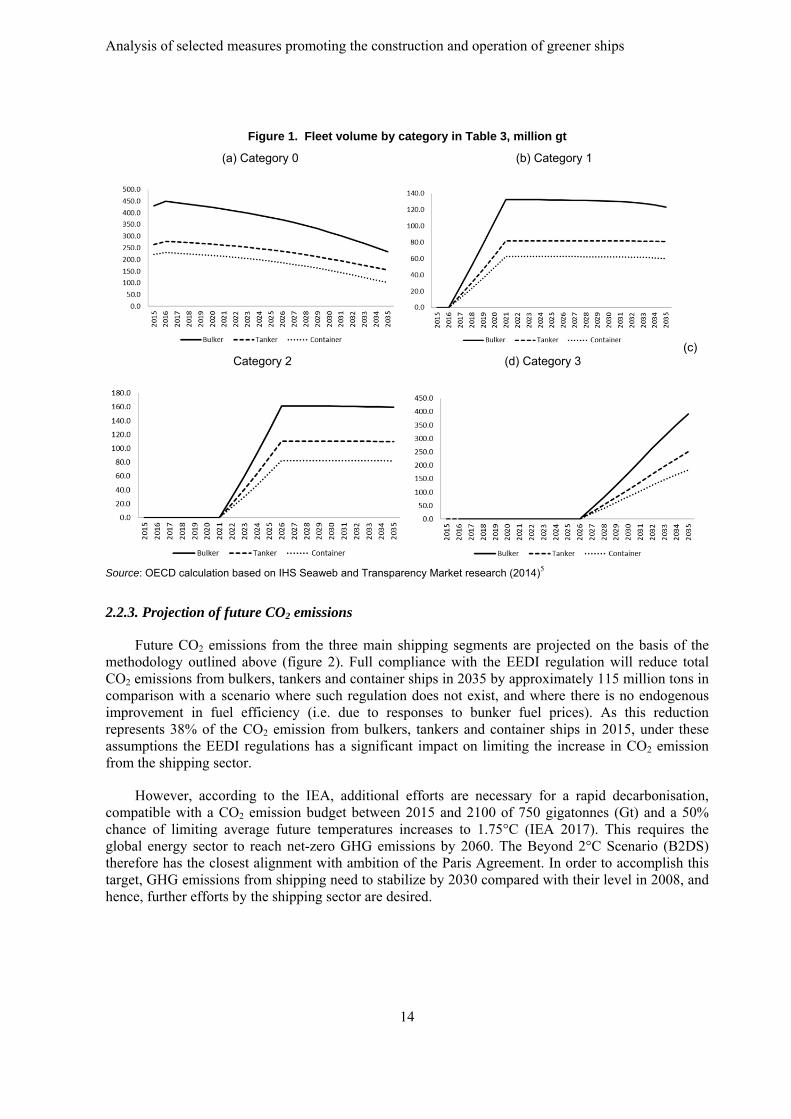
Future CO2 emissions from the three main shipping segments are projected on the basis of the methodology outlined above (figure 2). Full compliance with the EEDI regulation will reduce total CO2 emissions from bulkers, tankers and container ships in 2035 by approximately 115 million tons in comparison with a scenario where such regulation does not exist, and where there is no endogenous improvement in fuel efficiency (i.e. due to responses to bunker fuel prices). As this reduction represents 38% of the CO2 emission from bulkers, tankers and container ships in 2015, under these assumptions the EEDI regulations has a significant impact on limiting the increase in CO2 emission from the shipping sector.
However, according to the IEA, additional efforts are necessary for a rapid decarbonisation, compatible with a CO2 emission budget between 2015 and 2100 of 750 gigatonnes (Gt) and a 50% chance of limiting average future temperatures increases to 1.75°C (IEA 2017). This requires the global energy sector to reach net-zero GHG emissions by 2060. The Beyond 2°C Scenario (B2DS) therefore has the closest alignment with ambition of the Paris Agreement. In order to accomplish this target, GHG emissions from shipping need to stabilize by 2030 compared with their level in 2008, and hence, further efforts by the shipping sector are desired.
Analysis of selected measures promoting the construction and operation of greener ships
15
Figure 2. CO2 emissions with and without EEDI, million CO2-tons
Source: OECD calculation based on IHS Seaweb and Transparency Market research (2014)6
2.3. Estimation of EEDI values
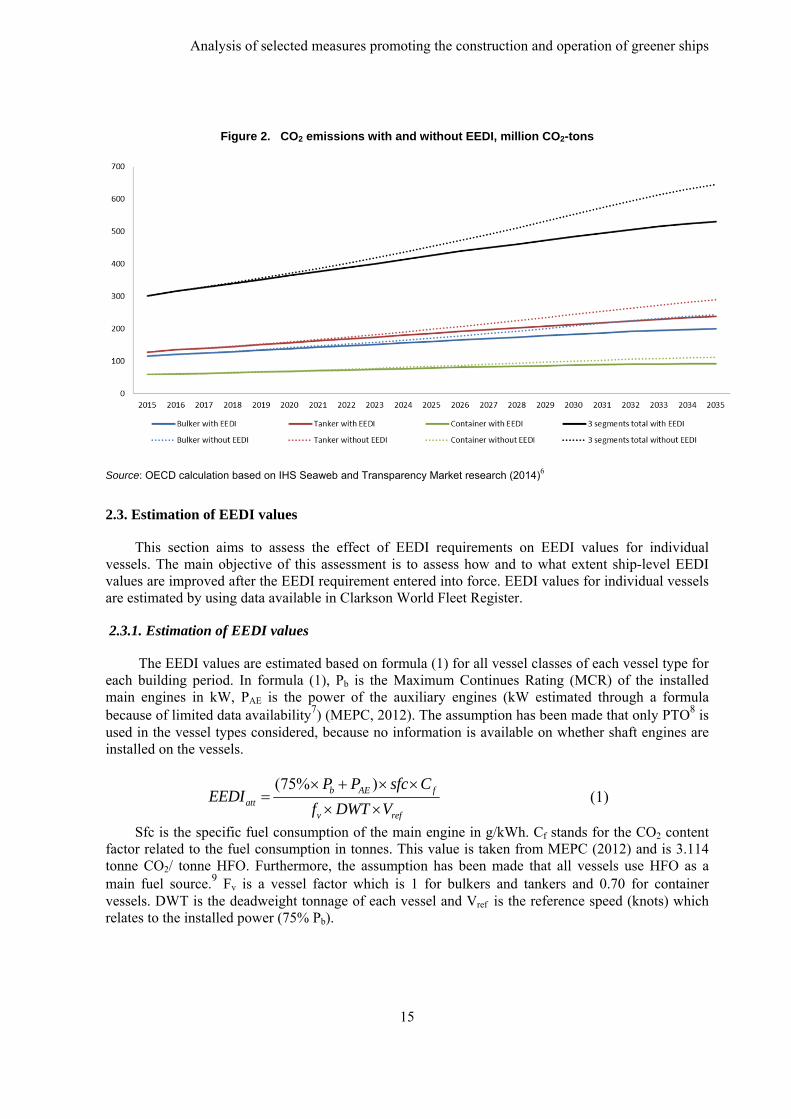
This section aims to assess the effect of EEDI requirements on EEDI values for individual vessels. The main objective of this assessment is to assess how and to what extent ship-level EEDI values are improved after the EEDI requirement entered into force. EEDI values for individual vessels are estimated by using data available in Clarkson World Fleet Register.
2.3.1. Estimation of EEDI values
The EEDI values are estimated based on formula (1) for all vessel classes of each vessel type for each building period. In formula (1), Pb is the Maximum Continues Rating (MCR) of the installed main engines in kW, PAE is the power of the auxiliary engines (kW estimated through a formula because of limited data availability7) (MEPC, 2012). The assumption has been made that only PTO8 is used in the vessel types considered, because no information is available on whether shaft engines are installed on the vessels.
(75% )b AE fatt
v ref
P P sfc CEEDI
f DWT V
(1)
Sfc is the specific fuel consumption of the main engine in g/kWh. Cf stands for the CO2 content factor related to the fuel consumption in tonnes. This value is taken from MEPC (2012) and is 3.114 tonne CO2/ tonne HFO. Furthermore, the assumption has been made that all vessels use HFO as a main fuel source.9 Fv is a vessel factor which is 1 for bulkers and tankers and 0.70 for container vessels. DWT is the deadweight tonnage of each vessel and Vref is the reference speed (knots) which relates to the installed power (75% Pb).
Analysis of selected measures promoting the construction and operation of greener ships
16
2.3.2. Assessment of impact of EEDI requirement on estimated EEDI values
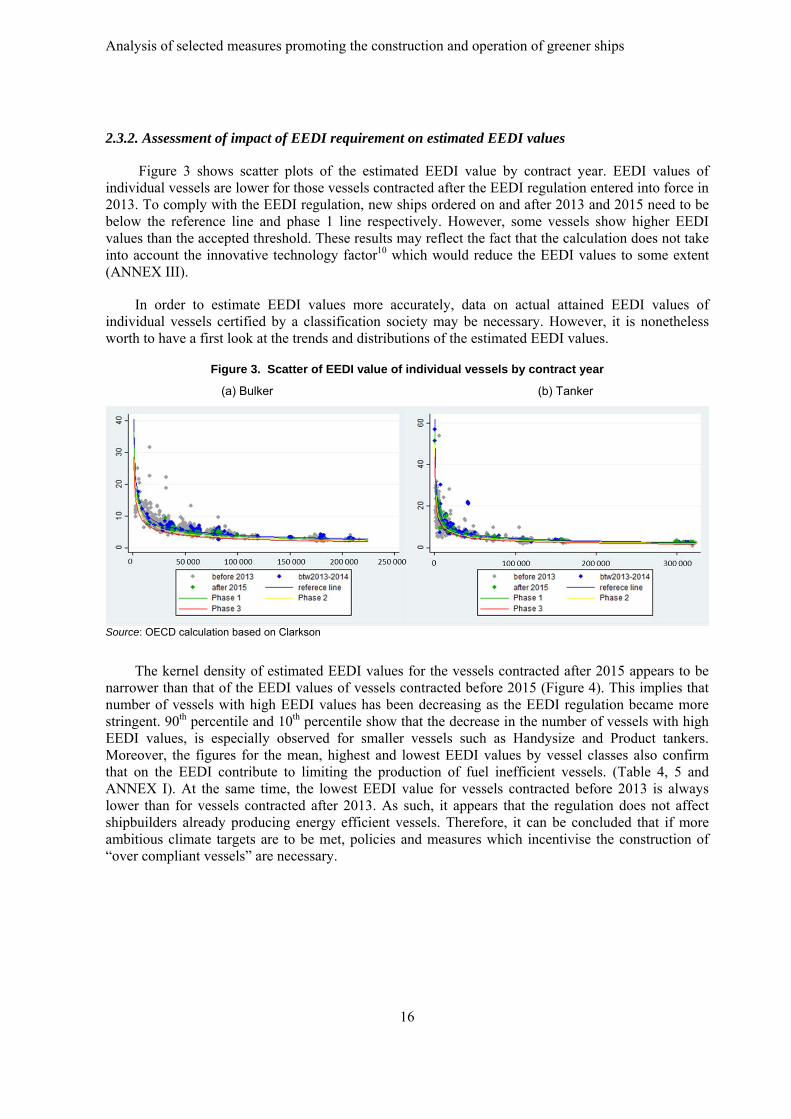
Figure 3 shows scatter plots of the estimated EEDI value by contract year. EEDI values of individual vessels are lower for those vessels contracted after the EEDI regulation entered into force in 2013. To comply with the EEDI regulation, new ships ordered on and after 2013 and 2015 need to be below the reference line and phase 1 line respectively. However, some vessels show higher EEDI values than the accepted threshold. These results may reflect the fact that the calculation does not take into account the innovative technology factor10 which would reduce the EEDI values to some extent (ANNEX III).
In order to estimate EEDI values more accurately, data on actual attained EEDI values of individual vessels certified by a classification society may be necessary. However, it is nonetheless worth to have a first look at the trends and distributions of the estimated EEDI values.
Figure 3. Scatter of EEDI value of individual vessels by contract year
(a) Bulker (b) Tanker
Source: OECD calculation based on Clarkson
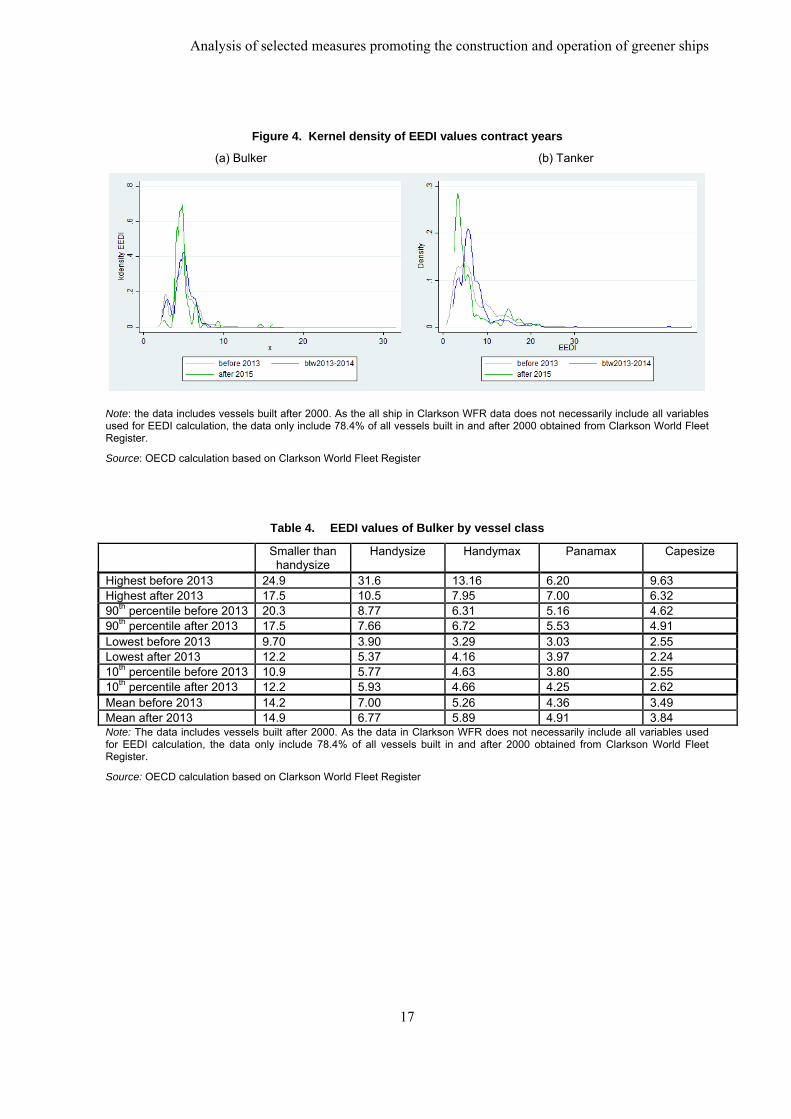
The kernel density of estimated EEDI values for the vessels contracted after 2015 appears to be narrower than that of the EEDI values of vessels contracted before 2015 (Figure 4). This implies that number of vessels with high EEDI values has been decreasing as the EEDI regulation became more stringent. 90th percentile and 10th percentile show that the decrease in the number of vessels with high EEDI values, is especially observed for smaller vessels such as Handysize and Product tankers. Moreover, the figures for the mean, highest and lowest EEDI values by vessel classes also confirm that on the EEDI contribute to limiting the production of fuel inefficient vessels. (Table 4, 5 and ANNEX I). At the same time, the lowest EEDI value for vessels contracted before 2013 is always lower than for vessels contracted after 2013. As such, it appears that the regulation does not affect shipbuilders already producing energy efficient vessels. Therefore, it can be concluded that if more ambitious climate targets are to be met, policies and measures which incentivise the construction of “over compliant vessels” are necessary.
Analysis of selected measures promoting the construction and operation of greener ships
17
Figure 4. Kernel density of EEDI values contract years
(a) Bulker (b) Tanker
Note: the data includes vessels built after 2000. As the all ship in Clarkson WFR data does not necessarily include all variables used for EEDI calculation, the data only include 78.4% of all vessels built in and after 2000 obtained from Clarkson World Fleet Register.
Source: OECD calculation based on Clarkson World Fleet Register
Table 4. EEDI values of Bulker by vessel class
Smaller than handysize
Handysize Handymax Panamax Capesize
Highest before 2013 24.9 31.6 13.16 6.20 9.63 Highest after 2013 17.5 10.5 7.95 7.00 6.32 90th percentile before 2013 20.3 8.77 6.31 5.16 4.62 90th percentile after 2013 17.5 7.66 6.72 5.53 4.91 Lowest before 2013 9.70 3.90 3.29 3.03 2.55 Lowest after 2013 12.2 5.37 4.16 3.97 2.24 10th percentile before 2013 10.9 5.77 4.63 3.80 2.55 10th percentile after 2013 12.2 5.93 4.66 4.25 2.62 Mean before 2013 14.2 7.00 5.26 4.36 3.49 Mean after 2013 14.9 6.77 5.89 4.91 3.84 Note: The data includes vessels built after 2000. As the data in Clarkson WFR does not necessarily include all variables used for EEDI calculation, the data only include 78.4% of all vessels built in and after 2000 obtained from Clarkson World Fleet Register.
Source: OECD calculation based on Clarkson World Fleet Register
Analysis of selected measures promoting the construction and operation of greener ships
18
Table 5. EEDI values of Tanker by vessel class
Product tanker Panamax Aframax Suezmax VLCC Highest before 2013 28.1 9.78 9.84 4.60 3.62 Highest after 2013 21.8 6.15 4.56 4.00 2.88 90th percentile before 2013 10.6 5.02 3.81 3.38 2.55 90th percentile after 2013 9.88 5.65 4.56 3.78 2.88 Lowest before 2013 4.46 3.01 1.75 2.15 0.80 Lowest after 2013 4.57 4.09 2.69 2.62 2.16 10th percentile before 2013 5.19 4.05 3.06 2.88 2.08 10th percentile after 2013 5.55 4.81 3.56 3.17 2.49 Mean before 2013 7.46 4.51 3.43 3.10 2.32 Mean after 2013 7.37 5.39 3.89 3.55 2.67 Note: The data includes vessels built after 2000. As the data in Clarkson WFR does not necessarily include all variables used for EEDI calculation, the data only include 78.4% of all vessels built in and after 2000 obtained from Clarkson World Fleet Register.
Source: OECD calculation based on Clarkson World Fleet Register
2.4. Analysis of ship design affecting EEDI
In this section, several design factors which can contribute to lowering EEDI values are analysed to identify how, and to what extent, these design factors have been evolving since 2000. In order to determine the design factors affected by EEDI requirement, the EEDI formula can be transformed into formula (3).
2 /3 2 11(75% )
( )
effN
eff effiAE
ref fad ref ref
v
f PP
V C sfcC V V
EEDIf LWT
(3)
In formula (3), 1/Cad is the inverse of the Admiralty constant11, Δ is the displacement and LWT the lightweight12 of the vessel. Based on formula (3), four (design) parameters can be distinguished which are further researched in more detail. These parameters are: 1/Cad
13, sfc, L.W./(L.B.D) and Vdesign speed. In Table 6, an overview of these parameters and the effect on the EEDI is displayed.
Table 6. Overview of the main design parameters affecting the EEDI
Parameter Unit Meaning Effect on EEDI
Design evolutions
1/Cad [tonne2/3.knots3/kW] Admiralty constant Linear proportional
sfc [g/kWh] Specific fuel consumption Linear proportional
L.W./LBD [tonnes/m3] Lightweight as ratio to the
main dimensions Inversely proportional Design choice V [knots] Design speed Quadratic proportional
Source: Presentation by Dr Edwin van Hassel at the 124th session of the WP6.
Analysis of selected measures promoting the construction and operation of greener ships
19
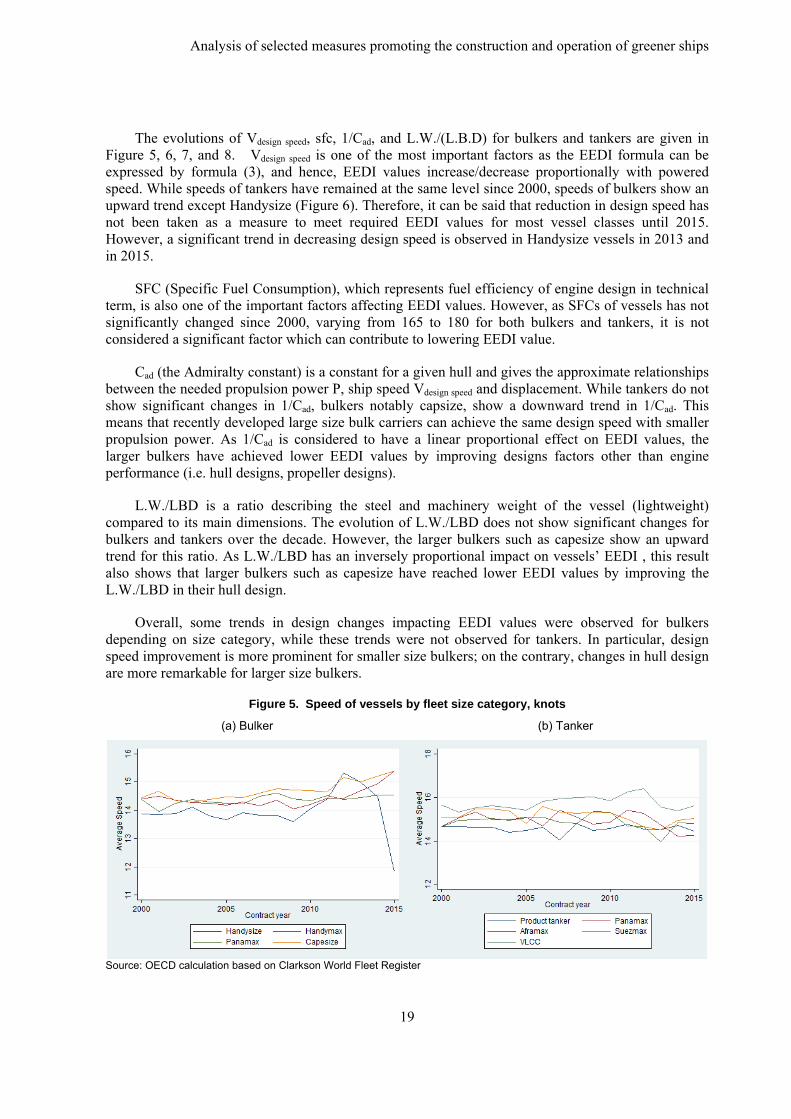
The evolutions of Vdesign speed, sfc, 1/Cad, and L.W./(L.B.D) for bulkers and tankers are given in Figure 5, 6, 7, and 8. Vdesign speed is one of the most important factors as the EEDI formula can be expressed by formula (3), and hence, EEDI values increase/decrease proportionally with powered speed. While speeds of tankers have remained at the same level since 2000, speeds of bulkers show an upward trend except Handysize (Figure 6). Therefore, it can be said that reduction in design speed has not been taken as a measure to meet required EEDI values for most vessel classes until 2015. However, a significant trend in decreasing design speed is observed in Handysize vessels in 2013 and in 2015.
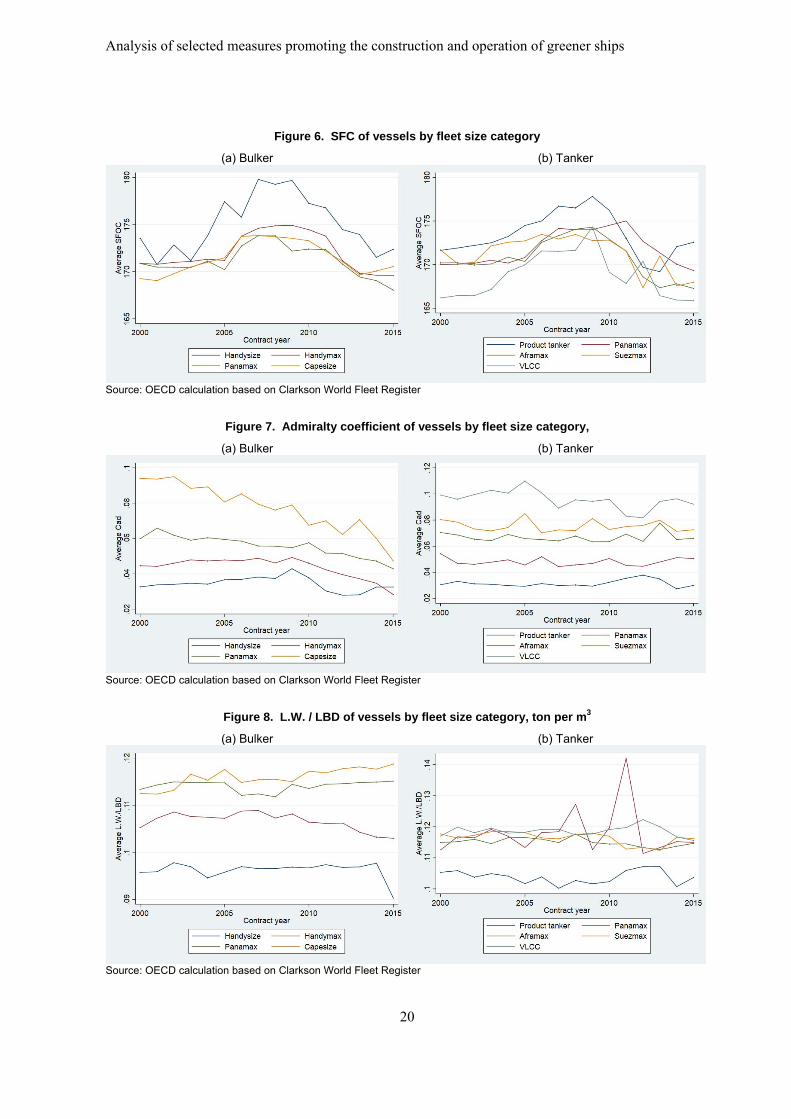
SFC (Specific Fuel Consumption), which represents fuel efficiency of engine design in technical term, is also one of the important factors affecting EEDI values. However, as SFCs of vessels has not significantly changed since 2000, varying from 165 to 180 for both bulkers and tankers, it is not considered a significant factor which can contribute to lowering EEDI value.
Cad (the Admiralty constant) is a constant for a given hull and gives the approximate relationships between the needed propulsion power P, ship speed Vdesign speed and displacement. While tankers do not show significant changes in 1/Cad, bulkers notably capsize, show a downward trend in 1/Cad. This means that recently developed large size bulk carriers can achieve the same design speed with smaller propulsion power. As 1/Cad is considered to have a linear proportional effect on EEDI values, the larger bulkers have achieved lower EEDI values by improving designs factors other than engine performance (i.e. hull designs, propeller designs).
L.W./LBD is a ratio describing the steel and machinery weight of the vessel (lightweight) compared to its main dimensions. The evolution of L.W./LBD does not show significant changes for bulkers and tankers over the decade. However, the larger bulkers such as capesize show an upward trend for this ratio. As L.W./LBD has an inversely proportional impact on vessels’ EEDI , this result also shows that larger bulkers such as capesize have reached lower EEDI values by improving the L.W./LBD in their hull design.
Overall, some trends in design changes impacting EEDI values were observed for bulkers depending on size category, while these trends were not observed for tankers. In particular, design speed improvement is more prominent for smaller size bulkers; on the contrary, changes in hull design are more remarkable for larger size bulkers.
Figure 5. Speed of vessels by fleet size category, knots
(a) Bulker (b) Tanker
Source: OECD calculation based on Clarkson World Fleet Register
Analysis of selected measures promoting the construction and operation of greener ships
20
Figure 6. SFC of vessels by fleet size category
(a) Bulker (b) Tanker
Source: OECD calculation based on Clarkson World Fleet Register
Figure 7. Admiralty coefficient of vessels by fleet size category,
(a) Bulker (b) Tanker
Source: OECD calculation based on Clarkson World Fleet Register
Figure 8. L.W. / LBD of vessels by fleet size category, ton per m3
(a) Bulker (b) Tanker
Source: OECD calculation based on Clarkson World Fleet Register
Analysis of selected measures promoting the construction and operation of greener ships
21
2.5. National policies
2.5.1. Overview of national policies addressing air pollutant emission
As described in Chapter I, regional and national policies have been implemented in response to tightening international regulation on GHG emissions, air pollution, and ballast water treatment. Among them, scrap and build subsidies have been implemented as a measure to upgrade existing vessels to become more environmental friendly. Scrap and build subsidies have been implemented in China, Turkey and Norway (Table 1) with the primary objective of improving fuel efficiency. As the scheme in Turkey and Norway only recently commenced in 2015 and in 2016 respectively, this section focuses on the assessment of the scheme implemented in China.
2.5.2. Assessment of scrap and build subsidy in China
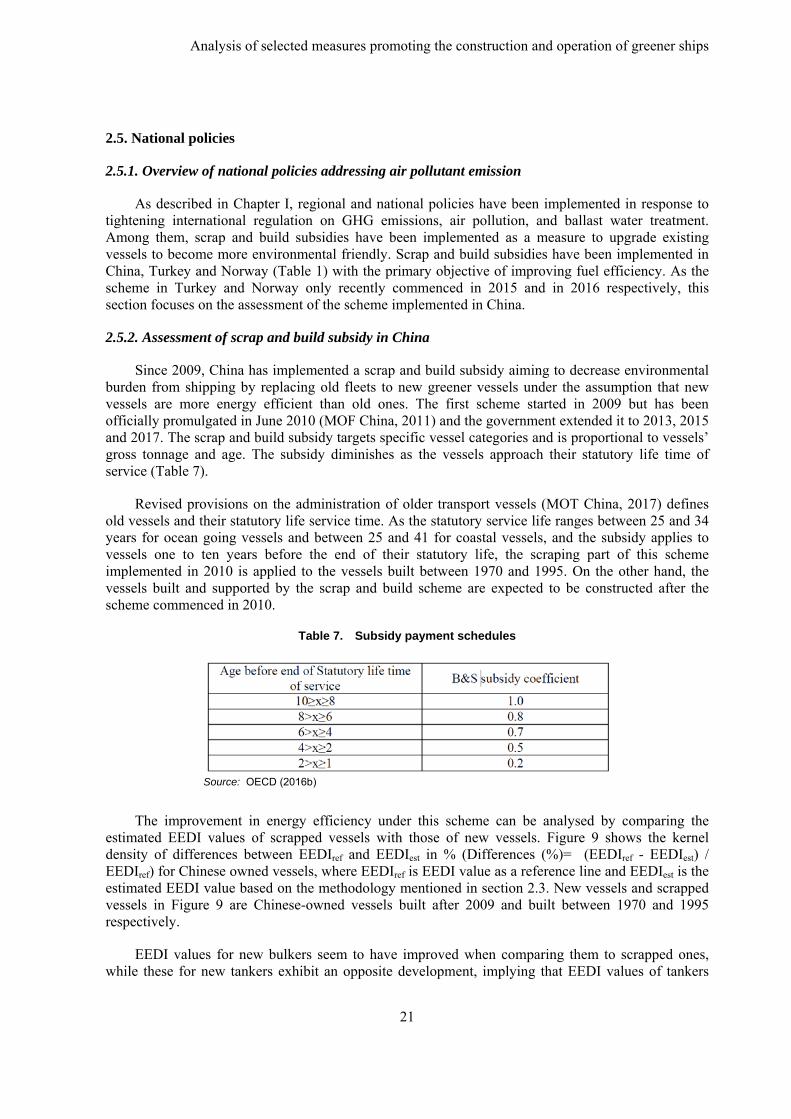
Since 2009, China has implemented a scrap and build subsidy aiming to decrease environmental burden from shipping by replacing old fleets to new greener vessels under the assumption that new vessels are more energy efficient than old ones. The first scheme started in 2009 but has been officially promulgated in June 2010 (MOF China, 2011) and the government extended it to 2013, 2015 and 2017. The scrap and build subsidy targets specific vessel categories and is proportional to vessels’ gross tonnage and age. The subsidy diminishes as the vessels approach their statutory life time of service (Table 7).
Revised provisions on the administration of older transport vessels (MOT China, 2017) defines old vessels and their statutory life service time. As the statutory service life ranges between 25 and 34 years for ocean going vessels and between 25 and 41 for coastal vessels, and the subsidy applies to vessels one to ten years before the end of their statutory life, the scraping part of this scheme implemented in 2010 is applied to the vessels built between 1970 and 1995. On the other hand, the vessels built and supported by the scrap and build scheme are expected to be constructed after the scheme commenced in 2010.
Table 7. Subsidy payment schedules
Source: OECD (2016b)
The improvement in energy efficiency under this scheme can be analysed by comparing the estimated EEDI values of scrapped vessels with those of new vessels. Figure 9 shows the kernel density of differences between EEDIref and EEDIest in % (Differences (%)= (EEDIref - EEDIest) / EEDIref) for Chinese owned vessels, where EEDIref is EEDI value as a reference line and EEDIest is the estimated EEDI value based on the methodology mentioned in section 2.3. New vessels and scrapped vessels in Figure 9 are Chinese-owned vessels built after 2009 and built between 1970 and 1995 respectively.
EEDI values for new bulkers seem to have improved when comparing them to scrapped ones, while these for new tankers exhibit an opposite development, implying that EEDI values of tankers

Analysis of selected measures promoting the construction and operation of greener ships
22
have not improved over the decades. One of the reasons for this seemingly counterintuitive observation lies in the fact that newly built tankers are expected to be double hulled, while the scrapped tankers, built between 1970 and 1995 and thus before the first double hull requirement by IMO conventions entered into force in 1996, are single hulled. Since double-hulling has negative consequences for EEDI this implies that the scrap and build subsidy implemented in China does not always result in a positive impact on CO2 emission from tankers, at least until older single-hulled vessels have been removed from the fleet.
However, as the EEDI regulation has entered into force in 2013, the fuel efficiency of new vessels contracted on and after 2013 is expected to be improved. Figure 10 shows the kernel density of differences between EEDIref and EEDIest in % of world fleets. For both bulkers and tankers, the estimated EEDI values of vessels contracted in and after 2013 have improved compared to those of vessels contracted before 2013 (Figure 10). Therefore, in general, scrap and build schemes commenced after 2013 are expected to contribute to decreasing CO2 emission from shipping.
Figure 9. Distribution of differences between EEDIref and EEDIest in % for Chinese owned vessels
(a) Bulkers (b) Tankers
Source: OECD calculation based on Clarkson World Fleet Register
Figure 10. Distribution of differences between EEDIref and EEDIest in % for all vessels
(a) Bulkers (b) Tankers
Source: OECD calculation based on Clarkson World Fleet Register
Analysis of selected measures promoting the construction and operation of greener ships
23
2.6. Chapter summary
The international regulation based on EEDI has a significant impact on the future CO2 emissions. The difference between a scenario where the EEDI regulation is implemented relative to the case where it is not implemented amounts to 115 million CO2 ton by 2035, which is equivalent to 38% of total CO2 emission from bulkers, tankers and containers in 2015. However, such a result is based upon strong assumptions concerning technological improvement that would have taken place absent the regulation. Moreover, additional efforts are desirable to contribute to further reduction, as the EEDI requirements are more effective in restricting vessels with very low energy efficiency rather than promoting very energy efficient vessels. Therefore policies and measures encouraging the production of “over-compliant” vessels in terms of fuel efficiency are necessary in order to seek further reduction in CO2 emission from shipping and to contribute to limiting climate change.
Some trends in design changes, which impact EEDI values, were observed for bulkers depending on size category, while these trends are not observed for tankers. It is remarkable that reduction in design speed is not a measure frequently taken to meet required EEDI value for most vessel classes (except handysize bulkers) until 2015. On the contrary, changes in hull design are more prominent for larger size bulkers. This implies that the first reaction to comply with the EEDI requirement is to improve vessel designs rather than to reduce design speed.
With respect to the impact of Chinese scrap and build subsidy scheme on the fuel efficiency of vessels, this scheme could contribute to decreasing CO2 emissions from bulkers as EEDI values of Chinese owner’s vessels show improvement in EEDI values for bulkers in comparison between scrapped and new built vessels; however, the opposite result was observed for tankers. Further analysis may be necessary to figure out the reason for this opposite result for tankers by analysing the impact of hull design (double and single hull) on the EEDI values.
Analysis of selected measures promoting the construction and operation of greener ships
24
CHAPTER III: AIR POLLUTION
3.1. Background
Air pollution causes a cumulative effect that contributes to the overall air quality problems leading to poor respiratory health encountered by populations in many areas, and also affects the natural environment, such as through acid rain (IMO, 2011).
It is also reported that the emission of air pollutants from ship traffic has a significant impact in some areas, such as the Baltic Sea (Brandt et al., 2013). The air pollutants from shipping are considered to be more problematic in coastal areas in specific regions. For example, freshwater ecosystems are particularly sensitive to acidification in Norway. Over the years many fish stocks have been depleted or wiped out, and other aquatic animals and plants are also affected. Power plants, industrial processes (especially metal production) and transport are the main sources of acidifying emissions resulting in reduced water quality in lakes and rivers in the southern half of Norway, and especially in the southernmost counties (Norwegian Environment Agency, 2015).
IMO has been working to reduce harmful impacts of shipping on the environment to address air pollution from shipping. Regulation for the Prevention of Air Pollution from Ships (Annex VI) seeks to control airborne emissions of SOx, NOx, Ozone Depleting Substances (ODS) Volatile Organic Compounds (VOC) shipboard incineration and their contribution to local and global air pollution, human health issues and environmental problems. Annex VI entered into force on 19 May 2005 and a revised Annex VI with significantly strengthened requirements was adopted in October 2008 and entered into force on 1 July 2010. The regulations to reduce sulphur oxide emissions introduced a global limit for sulphur content of ships’ fuel oil, with tighter restrictions in designated Emission Control Areas (ECAs). (IMO, 2016a)
The emission of air pollutants from ships is more problematic in some zones and hence tighter restrictions have been introduced in these areas. This chapter mainly focuses on the impact of ECAs on the shipbuilding industry notably on fleet and technology development by fuel type in ECAs countries.
3.2. Emission Control Areas (ECAs)
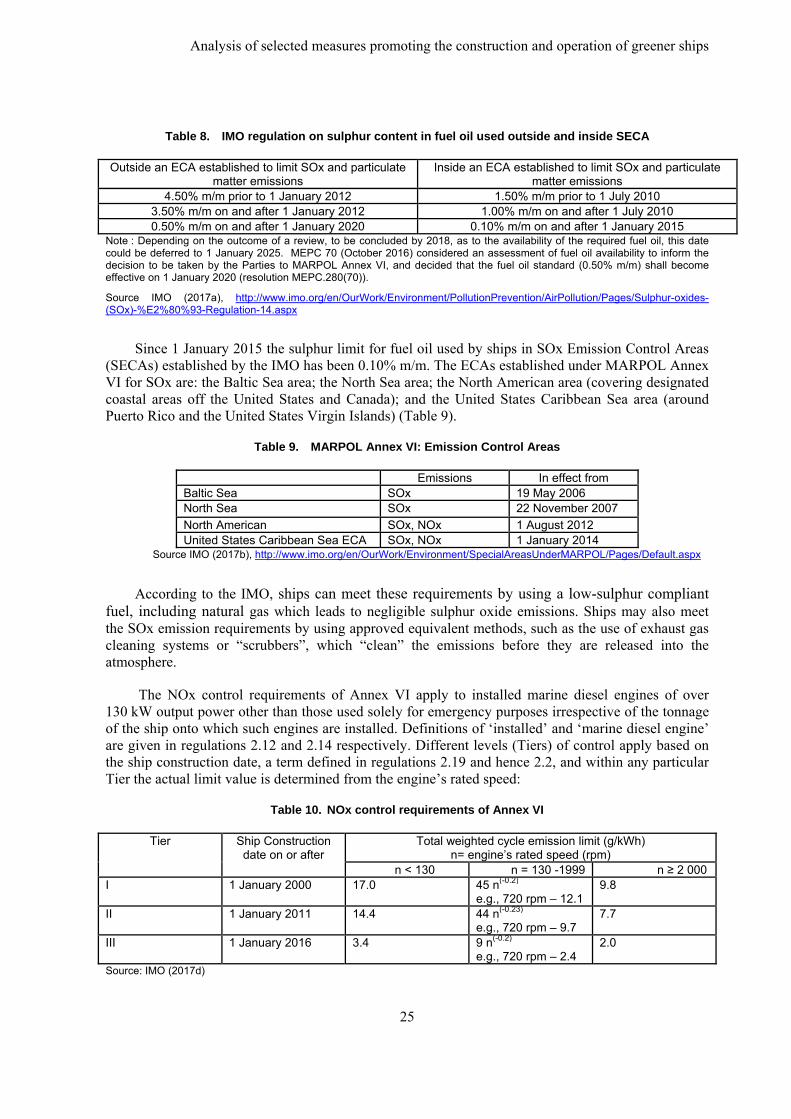
SOx and particulate matter emission controls apply to all fuel oil, as defined in regulation 2.9, combustion equipment and devices on board and therefore include both main and all auxiliary engines together with items such boilers and inert gas generators. These controls are divided between those applicable inside SOx Emission Control Areas (SECA) established to limit the emission of SOx and particulate matter and those applicable outside such areas and are primarily achieved by limiting the maximum sulphur content of the fuel oils as loaded, bunkered, and subsequently used on-board. These fuel oil sulphur limits (expressed in terms of % m/m – that is by mass) are subject to a series of step changes over the years, regulations 14.1 and 14.4 (Table 8). (IMO, 2017 a)
Analysis of selected measures promoting the construction and operation of greener ships
25
Table 8. IMO regulation on sulphur content in fuel oil used outside and inside SECA
Outside an ECA established to limit SOx and particulate matter emissions
Inside an ECA established to limit SOx and particulate matter emissions
4.50% m/m prior to 1 January 2012 1.50% m/m prior to 1 July 2010 3.50% m/m on and after 1 January 2012 1.00% m/m on and after 1 July 2010 0.50% m/m on and after 1 January 2020 0.10% m/m on and after 1 January 2015
Note : Depending on the outcome of a review, to be concluded by 2018, as to the availability of the required fuel oil, this date could be deferred to 1 January 2025. MEPC 70 (October 2016) considered an assessment of fuel oil availability to inform the decision to be taken by the Parties to MARPOL Annex VI, and decided that the fuel oil standard (0.50% m/m) shall become effective on 1 January 2020 (resolution MEPC.280(70)).
Source IMO (2017a), http://www.imo.org/en/OurWork/Environment/PollutionPrevention/AirPollution/Pages/Sulphur-oxides-(SOx)-%E2%80%93-Regulation-14.aspx
Since 1 January 2015 the sulphur limit for fuel oil used by ships in SOx Emission Control Areas (SECAs) established by the IMO has been 0.10% m/m. The ECAs established under MARPOL Annex VI for SOx are: the Baltic Sea area; the North Sea area; the North American area (covering designated coastal areas off the United States and Canada); and the United States Caribbean Sea area (around Puerto Rico and the United States Virgin Islands) (Table 9).
Table 9. MARPOL Annex VI: Emission Control Areas
Emissions In effect from Baltic Sea SOx 19 May 2006 North Sea SOx 22 November 2007
North American SOx, NOx 1 August 2012 United States Caribbean Sea ECA SOx, NOx 1 January 2014
Source IMO (2017b), http://www.imo.org/en/OurWork/Environment/SpecialAreasUnderMARPOL/Pages/Default.aspx
According to the IMO, ships can meet these requirements by using a low-sulphur compliant fuel, including natural gas which leads to negligible sulphur oxide emissions. Ships may also meet the SOx emission requirements by using approved equivalent methods, such as the use of exhaust gas cleaning systems or “scrubbers”, which “clean” the emissions before they are released into the atmosphere.
The NOx control requirements of Annex VI apply to installed marine diesel engines of over 130 kW output power other than those used solely for emergency purposes irrespective of the tonnage of the ship onto which such engines are installed. Definitions of ‘installed’ and ‘marine diesel engine’ are given in regulations 2.12 and 2.14 respectively. Different levels (Tiers) of control apply based on the ship construction date, a term defined in regulations 2.19 and hence 2.2, and within any particular Tier the actual limit value is determined from the engine’s rated speed:
Table 10. NOx control requirements of Annex VI
Tier Ship Construction date on or after
Total weighted cycle emission limit (g/kWh) n= engine’s rated speed (rpm)
n < 130 n = 130 -1999 n ≥ 2 000 I 1 January 2000 17.0 45 n(-0.2)
e.g., 720 rpm – 12.1 9.8
II 1 January 2011 14.4 44 n(-0.23) e.g., 720 rpm – 9.7
7.7
III 1 January 2016 3.4 9 n(-0.2) e.g., 720 rpm – 2.4
2.0
Source: IMO (2017d)
Analysis of selected measures promoting the construction and operation of greener ships
26
The Tier III controls apply only to specified ships while operating in NOx Emission Control Areas (NECA), while outside such areas the Tier II controls apply. In accordance with regulation 13.5.2, certain small ships would not be required to install Tier III engines. A marine diesel engine that is installed on a ship constructed on or after 1 January 2016 and operating in the North American ECA and the United States Caribbean Sea ECA shall comply with the Tier III NOx standards.
This chapter shows trends in fuel type and in retrofitting scrubbers in existing fleets in SECAs as well as trends in vessels equipped with denitrification system in NECAs. In this chapter, analysis is made with the assumption that the country of ownership or the nationality of the flag has an influence on the routes taken by vessels and if they operate in ECAs.
3.3. Effects of reginal stricter regulation on fuel types and eco-friendly equipment
3.3.1. Changes in fuel type used for new vessels
In the maritime sector, fuel oils are roughly classified in Heavy Fuel Oil (HFO), Intermediate fuel oil (IFO), Marine Diesel Oil (MDO), Marine Gas Oil (MGO) and Liquefied Natural Gas (LNG). HFO is pure or nearly pure residual oil, IFO and MDO is a blend of gasoil and heavy fuel oil (normally IFO has less gasoil than marine diesel oil), MGO is fuel made from distillate only, and LNG is natural gas that has been converted to liquid form. Although sulphur contents in fuel oils are not easily identified from this classification, generally HFO and IFO have higher sulphur content whereas MGO and LNG have very limited sulphur content which can meet the stricter restriction of sulphur in SECAs.
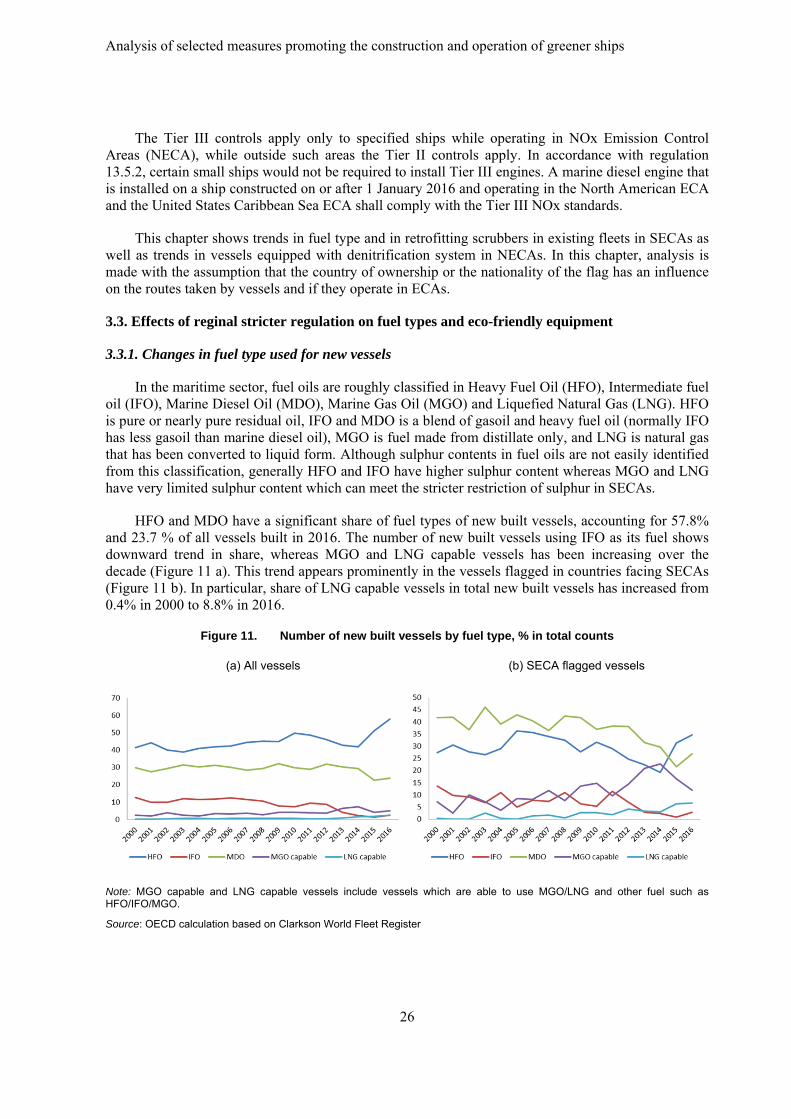
HFO and MDO have a significant share of fuel types of new built vessels, accounting for 57.8% and 23.7 % of all vessels built in 2016. The number of new built vessels using IFO as its fuel shows downward trend in share, whereas MGO and LNG capable vessels has been increasing over the decade (Figure 11 a). This trend appears prominently in the vessels flagged in countries facing SECAs (Figure 11 b). In particular, share of LNG capable vessels in total new built vessels has increased from 0.4% in 2000 to 8.8% in 2016.
Figure 11. Number of new built vessels by fuel type, % in total counts
(a) All vessels (b) SECA flagged vessels
Note: MGO capable and LNG capable vessels include vessels which are able to use MGO/LNG and other fuel such as HFO/IFO/MGO.
Source: OECD calculation based on Clarkson World Fleet Register
Analysis of selected measures promoting the construction and operation of greener ships
27
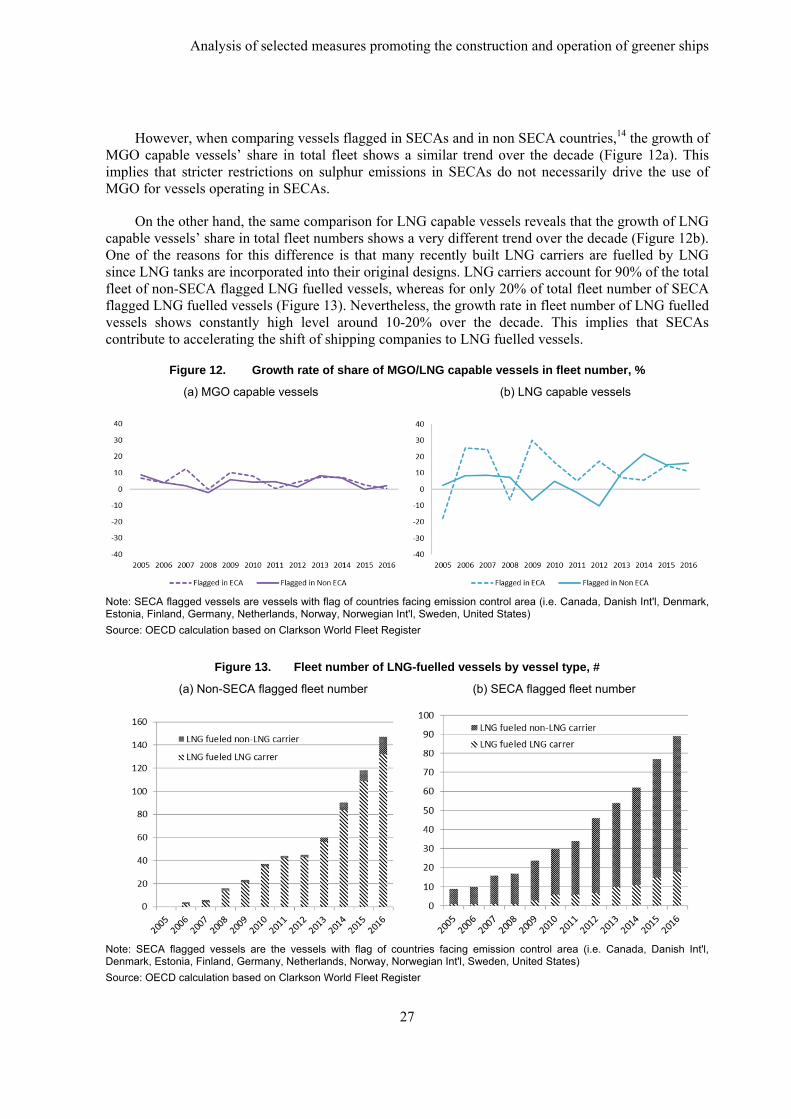
However, when comparing vessels flagged in SECAs and in non SECA countries,14 the growth of MGO capable vessels’ share in total fleet shows a similar trend over the decade (Figure 12a). This implies that stricter restrictions on sulphur emissions in SECAs do not necessarily drive the use of MGO for vessels operating in SECAs.
On the other hand, the same comparison for LNG capable vessels reveals that the growth of LNG capable vessels’ share in total fleet numbers shows a very different trend over the decade (Figure 12b). One of the reasons for this difference is that many recently built LNG carriers are fuelled by LNG since LNG tanks are incorporated into their original designs. LNG carriers account for 90% of the total fleet of non-SECA flagged LNG fuelled vessels, whereas for only 20% of total fleet number of SECA flagged LNG fuelled vessels (Figure 13). Nevertheless, the growth rate in fleet number of LNG fuelled vessels shows constantly high level around 10-20% over the decade. This implies that SECAs contribute to accelerating the shift of shipping companies to LNG fuelled vessels.
Figure 12. Growth rate of share of MGO/LNG capable vessels in fleet number, %
(a) MGO capable vessels (b) LNG capable vessels
Note: SECA flagged vessels are vessels with flag of countries facing emission control area (i.e. Canada, Danish Int'l, Denmark, Estonia, Finland, Germany, Netherlands, Norway, Norwegian Int'l, Sweden, United States)
Source: OECD calculation based on Clarkson World Fleet Register
Figure 13. Fleet number of LNG-fuelled vessels by vessel type, #
(a) Non-SECA flagged fleet number (b) SECA flagged fleet number
Note: SECA flagged vessels are the vessels with flag of countries facing emission control area (i.e. Canada, Danish Int'l, Denmark, Estonia, Finland, Germany, Netherlands, Norway, Norwegian Int'l, Sweden, United States)
Source: OECD calculation based on Clarkson World Fleet Register
Analysis of selected measures promoting the construction and operation of greener ships
28
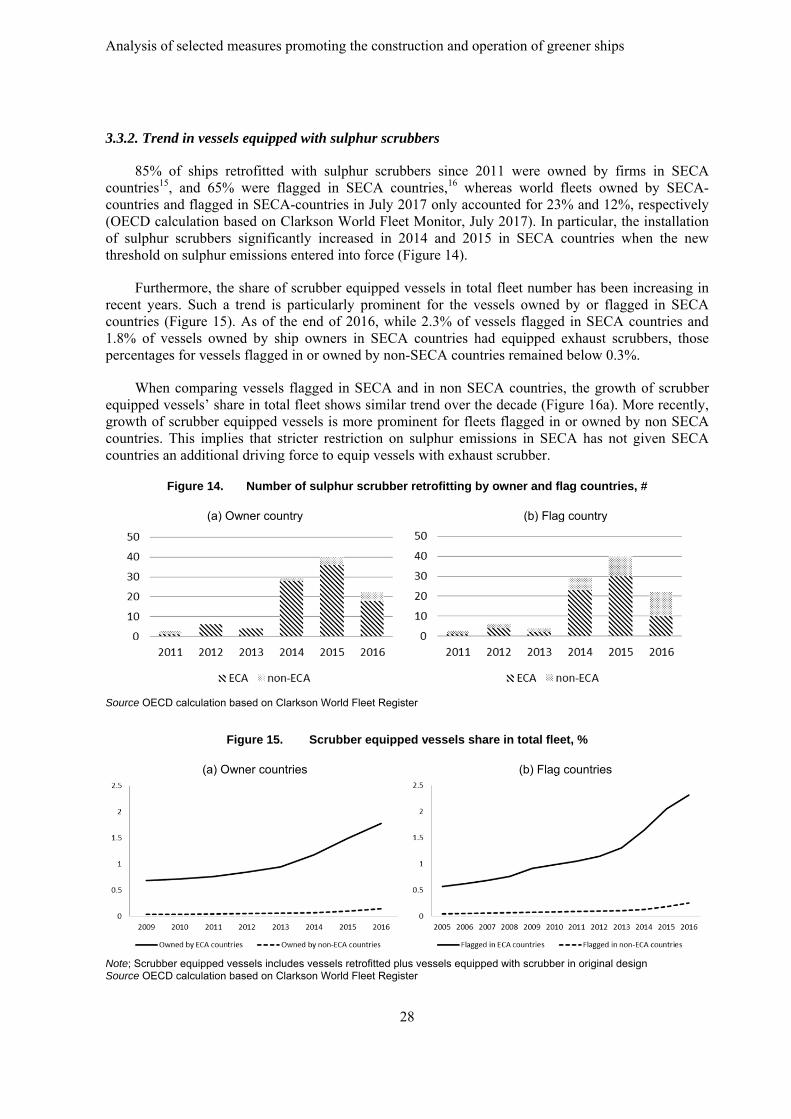
3.3.2. Trend in vessels equipped with sulphur scrubbers
85% of ships retrofitted with sulphur scrubbers since 2011 were owned by firms in SECA countries15, and 65% were flagged in SECA countries,16 whereas world fleets owned by SECA-countries and flagged in SECA-countries in July 2017 only accounted for 23% and 12%, respectively (OECD calculation based on Clarkson World Fleet Monitor, July 2017). In particular, the installation of sulphur scrubbers significantly increased in 2014 and 2015 in SECA countries when the new threshold on sulphur emissions entered into force (Figure 14).
Furthermore, the share of scrubber equipped vessels in total fleet number has been increasing in recent years. Such a trend is particularly prominent for the vessels owned by or flagged in SECA countries (Figure 15). As of the end of 2016, while 2.3% of vessels flagged in SECA countries and 1.8% of vessels owned by ship owners in SECA countries had equipped exhaust scrubbers, those percentages for vessels flagged in or owned by non-SECA countries remained below 0.3%.
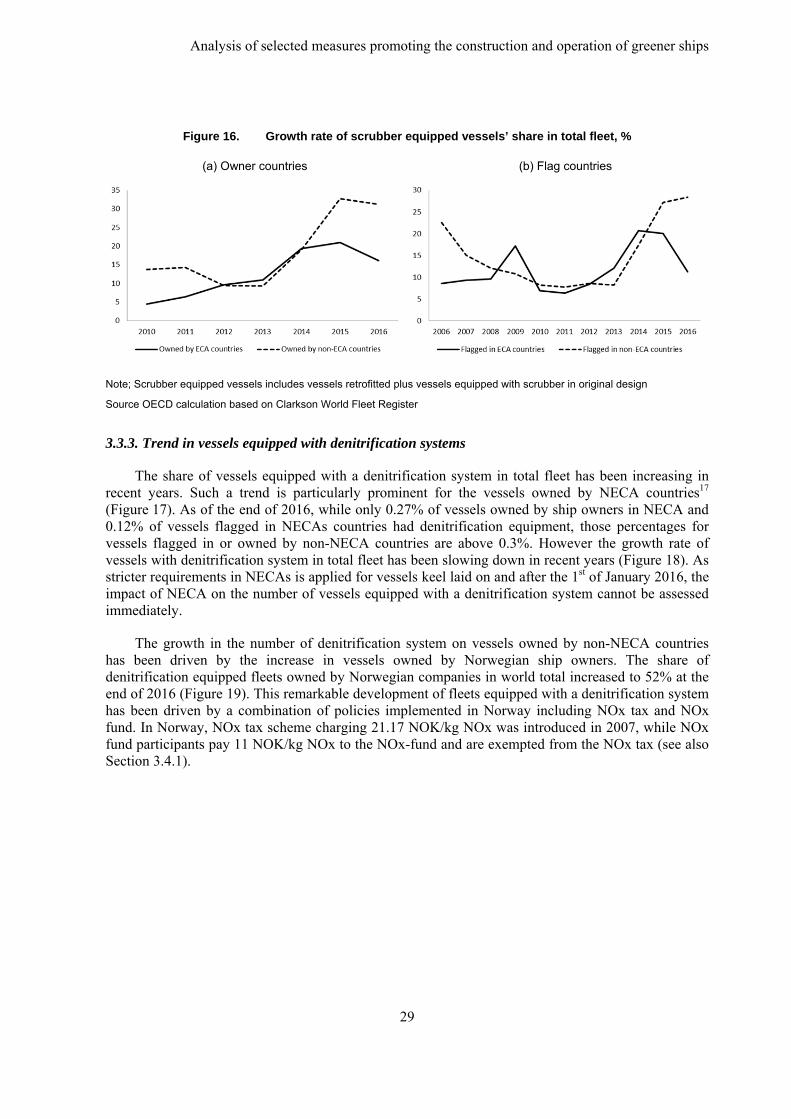
When comparing vessels flagged in SECA and in non SECA countries, the growth of scrubber equipped vessels’ share in total fleet shows similar trend over the decade (Figure 16a). More recently, growth of scrubber equipped vessels is more prominent for fleets flagged in or owned by non SECA countries. This implies that stricter restriction on sulphur emissions in SECA has not given SECA countries an additional driving force to equip vessels with exhaust scrubber.
Figure 14. Number of sulphur scrubber retrofitting by owner and flag countries, #
(a) Owner country (b) Flag country
Source OECD calculation based on Clarkson World Fleet Register
Figure 15. Scrubber equipped vessels share in total fleet, %
(a) Owner countries (b) Flag countries
Note; Scrubber equipped vessels includes vessels retrofitted plus vessels equipped with scrubber in original design Source OECD calculation based on Clarkson World Fleet Register
Analysis of selected measures promoting the construction and operation of greener ships
29
Figure 16. Growth rate of scrubber equipped vessels’ share in total fleet, %
(a) Owner countries (b) Flag countries
Note; Scrubber equipped vessels includes vessels retrofitted plus vessels equipped with scrubber in original design
Source OECD calculation based on Clarkson World Fleet Register
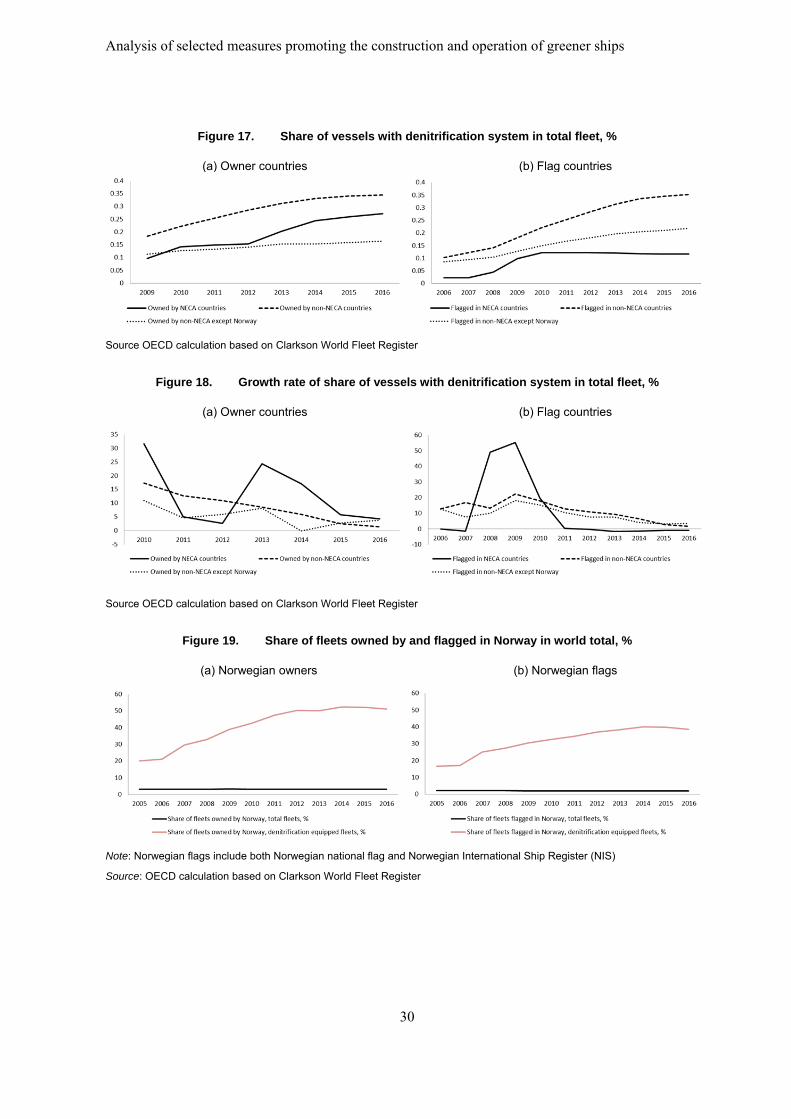
3.3.3. Trend in vessels equipped with denitrification systems
The share of vessels equipped with a denitrification system in total fleet has been increasing in recent years. Such a trend is particularly prominent for the vessels owned by NECA countries17 (Figure 17). As of the end of 2016, while only 0.27% of vessels owned by ship owners in NECA and 0.12% of vessels flagged in NECAs countries had denitrification equipment, those percentages for vessels flagged in or owned by non-NECA countries are above 0.3%. However the growth rate of vessels with denitrification system in total fleet has been slowing down in recent years (Figure 18). As stricter requirements in NECAs is applied for vessels keel laid on and after the 1st of January 2016, the impact of NECA on the number of vessels equipped with a denitrification system cannot be assessed immediately.
The growth in the number of denitrification system on vessels owned by non-NECA countries has been driven by the increase in vessels owned by Norwegian ship owners. The share of denitrification equipped fleets owned by Norwegian companies in world total increased to 52% at the end of 2016 (Figure 19). This remarkable development of fleets equipped with a denitrification system has been driven by a combination of policies implemented in Norway including NOx tax and NOx fund. In Norway, NOx tax scheme charging 21.17 NOK/kg NOx was introduced in 2007, while NOx fund participants pay 11 NOK/kg NOx to the NOx-fund and are exempted from the NOx tax (see also Section 3.4.1).
Analysis of selected measures promoting the construction and operation of greener ships
30
Figure 17. Share of vessels with denitrification system in total fleet, %
(a) Owner countries (b) Flag countries
Source OECD calculation based on Clarkson World Fleet Register
Figure 18. Growth rate of share of vessels with denitrification system in total fleet, %
(a) Owner countries (b) Flag countries
Source OECD calculation based on Clarkson World Fleet Register
Figure 19. Share of fleets owned by and flagged in Norway in world total, %
(a) Norwegian owners (b) Norwegian flags
Note: Norwegian flags include both Norwegian national flag and Norwegian International Ship Register (NIS)
Source: OECD calculation based on Clarkson World Fleet Register
Analysis of selected measures promoting the construction and operation of greener ships
31
3.4. National policies
3.4.1. Overview of national policies addressing air pollutant emission
In response to the regulation on emission of air pollutants from shipping, a variety of policies and measures have been implemented to support ship owners to comply with tighter restrictions in different ways. Table 11 shows the policies and measures implemented at national level.
Table 11. Financial incentives related to emission of air pollutants from ship
Measures Target pollutant Start/End year Budget
Finland Investment aid SOx 2010/2014 EUR 44 million per year
Norway NOx tax and NOx fund NOx 2008/On-going NOK 700 million per year
Singapore Port fee discount/ Tax deduction
SOx 2011/2016 -
Source: Peer review of Norway's Shipbuilding Industry, Information from Finland, MPA (2011)
In Finland, the Investment aid scheme for purchasing greener ships was announced in 2010. It aimed to promote investments leading to a decrease in the level of emissions by ships. It was elaborated in connection with the proposal by the European Commission to amend the Directive18 1999/32/EC on the sulphur content of certain liquid fuels. While the scheme initially only applied to new vessels purchased between 2010 and 2012, it was extended to the acquisition of new ships in line with future EU standards and to retrofitting operations (e.g. scrubbers) after 2013. The total budget of the scheme was EUR 220 million (EUR 120 million in the first batch announced in 2010 plus EUR 100 million in the second batch announced in 2013). The total amount of aid granted was EUR 56 million for two new vessels in 2011 and for 64 vessels for retrofitting investments (50 MGO conversions, 1 LNG conversion and 13 scrubbers).
In Norway, the NOx tax was introduced in 2007 to address NOx emissions from industry sectors. The tax exemptions through the NOx Fund scheme were established under the NOx agreement 2011-2017, which was signed by 15 business organisations, including ship owners association, and the Ministry of the Environment. The Fund has been eligible since 2008. While the NOx tax is 21.17 NOK/kg NOx, NOx fund participants pay 11 NOK/kg NOx to the NOx-fund and are exempted from the NOx tax. The NOx fund has fostered and stimulated the development of new emission reducing technologies, such as LNG as a ship fuel. By the end of 2014, the NOx Fund financed NOx reducing measures on 480 vessels, achieving reductions of NOx emissions between 2012 and 2014. A substantial part (60 per cent) of the funding in the maritime sector was linked to LNG powered vessels. The programme has been an effective instrument and an incentive for the substantial build-up of the Norwegian LNG-powered fleet and expertise over the past years (OECD, 2016).
In Singapore, the Green Ship Programme was commenced in 2011 to encourage the use of energy-efficient ship design, type-approved scrubber technology and/or the use of LNG, all of which reduce fuel consumption and/or carbon dioxide emissions. Qualifying Singapore-flagged ships will enjoy up to 75% reduction of Initial Registration Fees and up to 50% rebate on Annual Tonnage Tax payable. In addition, the Green Port Programme was also commenced in 2011 to encourage ocean-going ships calling at the Port of Singapore to reduce emissions of pollutants. Ocean-going ships that use type-approved abatement/scrubber technology, burn clean fuels or LNG during an entire port stay (of 5 days or less) within Singapore Port Limits (from the point of entry into Singapore Port Limits till the point of exit) are granted 25% reduction in port dues.
Analysis of selected measures promoting the construction and operation of greener ships
32
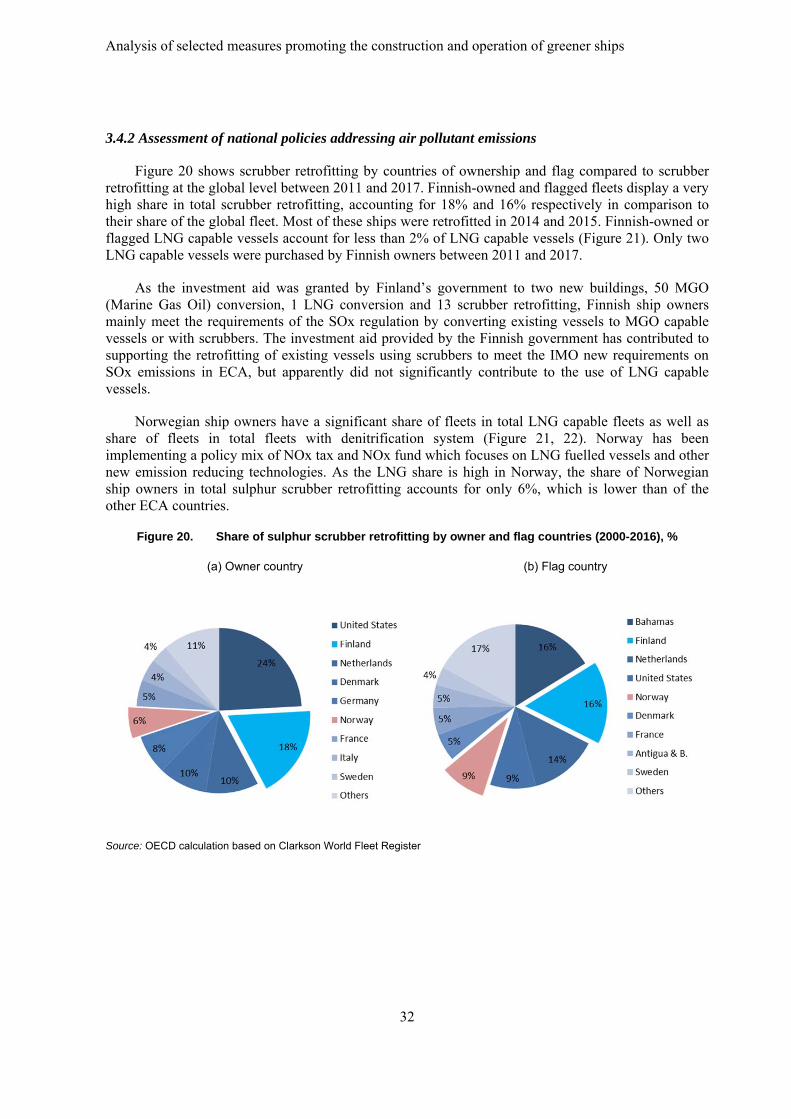
3.4.2 Assessment of national policies addressing air pollutant emissions
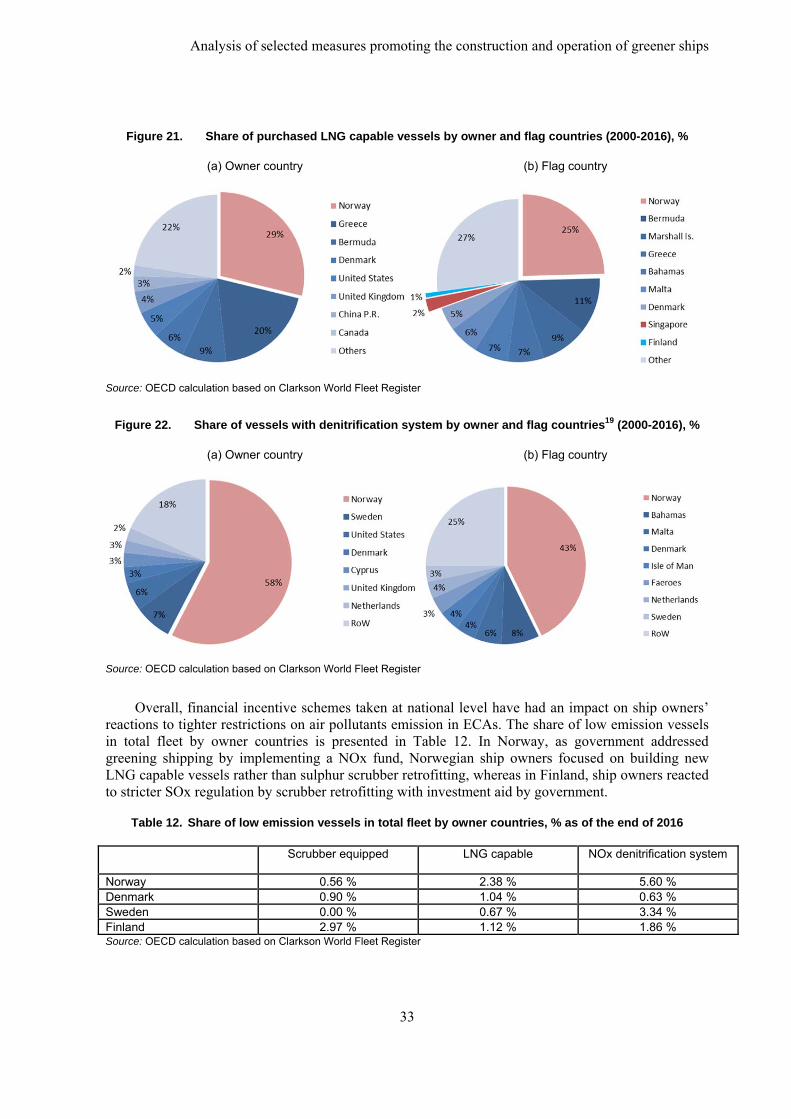
Figure 20 shows scrubber retrofitting by countries of ownership and flag compared to scrubber retrofitting at the global level between 2011 and 2017. Finnish-owned and flagged fleets display a very high share in total scrubber retrofitting, accounting for 18% and 16% respectively in comparison to their share of the global fleet. Most of these ships were retrofitted in 2014 and 2015. Finnish-owned or flagged LNG capable vessels account for less than 2% of LNG capable vessels (Figure 21). Only two LNG capable vessels were purchased by Finnish owners between 2011 and 2017.
As the investment aid was granted by Finland’s government to two new buildings, 50 MGO (Marine Gas Oil) conversion, 1 LNG conversion and 13 scrubber retrofitting, Finnish ship owners mainly meet the requirements of the SOx regulation by converting existing vessels to MGO capable vessels or with scrubbers. The investment aid provided by the Finnish government has contributed to supporting the retrofitting of existing vessels using scrubbers to meet the IMO new requirements on SOx emissions in ECA, but apparently did not significantly contribute to the use of LNG capable vessels.
Norwegian ship owners have a significant share of fleets in total LNG capable fleets as well as share of fleets in total fleets with denitrification system (Figure 21, 22). Norway has been implementing a policy mix of NOx tax and NOx fund which focuses on LNG fuelled vessels and other new emission reducing technologies. As the LNG share is high in Norway, the share of Norwegian ship owners in total sulphur scrubber retrofitting accounts for only 6%, which is lower than of the other ECA countries.
Figure 20. Share of sulphur scrubber retrofitting by owner and flag countries (2000-2016), %
(a) Owner country (b) Flag country
Source: OECD calculation based on Clarkson World Fleet Register
Analysis of selected measures promoting the construction and operation of greener ships
33
Figure 21. Share of purchased LNG capable vessels by owner and flag countries (2000-2016), %
(a) Owner country (b) Flag country
Source: OECD calculation based on Clarkson World Fleet Register
Figure 22. Share of vessels with denitrification system by owner and flag countries19 (2000-2016), %
(a) Owner country (b) Flag country
Source: OECD calculation based on Clarkson World Fleet Register
Overall, financial incentive schemes taken at national level have had an impact on ship owners’ reactions to tighter restrictions on air pollutants emission in ECAs. The share of low emission vessels in total fleet by owner countries is presented in Table 12. In Norway, as government addressed greening shipping by implementing a NOx fund, Norwegian ship owners focused on building new LNG capable vessels rather than sulphur scrubber retrofitting, whereas in Finland, ship owners reacted to stricter SOx regulation by scrubber retrofitting with investment aid by government.
Table 12. Share of low emission vessels in total fleet by owner countries, % as of the end of 2016
Scrubber equipped LNG capable NOx denitrification system
Norway 0.56 % 2.38 % 5.60 % Denmark 0.90 % 1.04 % 0.63 % Sweden 0.00 % 0.67 % 3.34 % Finland 2.97 % 1.12 % 1.86 % Source: OECD calculation based on Clarkson World Fleet Register
Analysis of selected measures promoting the construction and operation of greener ships
34
3.5. Chapter Summary
More stringent restrictions on sulphur content in ECAs had an impact on fleet development of LNG capable vessels and retrofitting of scrubbers. However, it appears that the stricter restriction in ECAs has not given an additional driving force to equip vessels with scrubbers or to build MGO capable vessels, as similar reactions were also observed for fleets flagged in or owned by non-ECA countries. Moreover, impact of tighter restriction on fleet development of vessels with denitrification system was not observed as the stricter restriction is applied for vessels keel laid on and after 1st January 2016.
The policy mix of stricter regulation and financial supports at national level promotes developing greener fleets, and interestingly, the national policies and measures appeared to affect significantly on the owners’ decisions on how they comply with regulations and promote over compliant vessels such as LNG-fuelled vessels depending on the form and nature of support measures.
Analysis of selected measures promoting the construction and operation of greener ships
35
CHAPTER IV: BALLAST WATER TREATMENT
4.1. Background
The International Convention for the Control and Management of Ships' Ballast Water and Sediments (BWM Convention) has significant implications for the ship repair industry, as retrofitting the existing fleet with Ballast Water Management systems could provide market opportunities for repair facilities. Therefore, this chapter focuses on the impact of the BWM Convention on repair industries, notably on their capacity to be used for retrofitting the existing fleet with the BWM equipment.
The BWM Convention entered into force on 8 September 2017, marking a landmark step towards halting the spread of invasive aquatic species, which can cause havoc for local ecosystems, affect biodiversity and lead to substantial economic losses. Under the Convention’s terms, ships will be required to manage their ballast water to remove, render harmless, or avoid the uptake or discharge of aquatic organisms and pathogens within ballast water and sediments (IMO, 2016b).
The MEPC, at its 71st meeting, reached an amendment on compliance dates for ballast water discharge. Under the approved amendments, new ships, i.e., ships constructed on or after 8 September 2017, shall conduct ballast water management that meets the standard from the date they are put into service. For existing ships, i.e., ships constructed before 8 September 2017, the date for compliance is linked with the renewal survey of the ship associated with the International Oil Pollution Prevention (IOPP) Certificate under MARPOL Annex I. For existing ships this would be the first or second five-year renewal survey after 8 September 2017 (IMO, 2017):
First renewal survey: this applies when the first renewal survey of the ship takes place on or after 8 September 2019 or a renewal survey has been completed on or after 8 September 2014 but prior to 8 September 2017.
Second renewal survey: this applies if the first renewal survey after 8 September 2017 takes place before 8 September 2019. In this case, compliance must be achieved by the second renewal survey (provided that the previous renewal survey has not been completed in the period between 8 September 2014 and 8 September 2017).
An existing ship to which the IOPP renewal survey under MARPOL Annex I does not apply shall meet the standard from the date decided by the Administration, but not later than 8 September 2024 (IMO, 2017). Therefore, all ships will be equipped with a Ballast Water Management System (BWMS) in compliance with the BWM Convention no later than 8 September 2024.
4.2 Estimation of yard capacity to be devoted to retrofitting ships with BWMS
This section estimates demand for retrofitting ships with BWMS and repair yards’ time spent for retrofitting activities generated by the BWMC. Demand for retrofitting existing ships with BWMS is calculated by subtracting the number of vessels to be scrapped due to BWMC from the number of vessels which fall under the regulation. Repair yards’ time spent for retrofitting ships with BWMS is
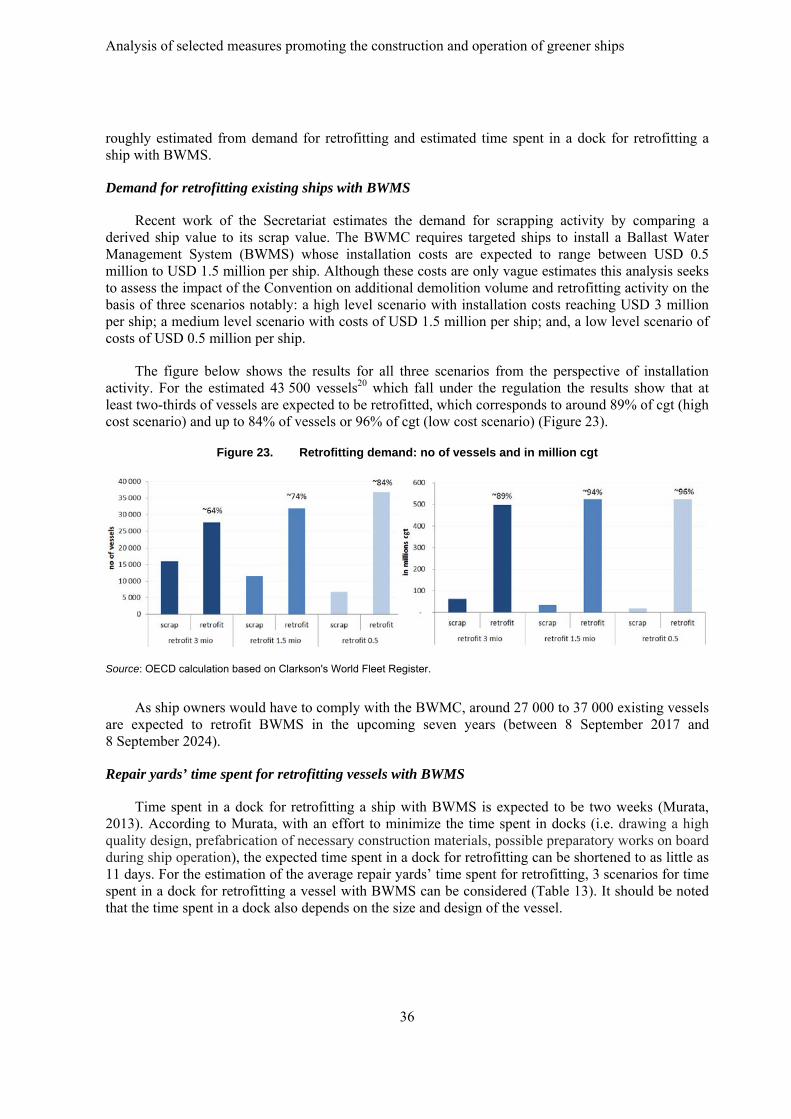
Analysis of selected measures promoting the construction and operation of greener ships
36
roughly estimated from demand for retrofitting and estimated time spent in a dock for retrofitting a ship with BWMS.
Demand for retrofitting existing ships with BWMS
Recent work of the Secretariat estimates the demand for scrapping activity by comparing a derived ship value to its scrap value. The BWMC requires targeted ships to install a Ballast Water Management System (BWMS) whose installation costs are expected to range between USD 0.5 million to USD 1.5 million per ship. Although these costs are only vague estimates this analysis seeks to assess the impact of the Convention on additional demolition volume and retrofitting activity on the basis of three scenarios notably: a high level scenario with installation costs reaching USD 3 million per ship; a medium level scenario with costs of USD 1.5 million per ship; and, a low level scenario of costs of USD 0.5 million per ship.
The figure below shows the results for all three scenarios from the perspective of installation activity. For the estimated 43 500 vessels20 which fall under the regulation the results show that at least two-thirds of vessels are expected to be retrofitted, which corresponds to around 89% of cgt (high cost scenario) and up to 84% of vessels or 96% of cgt (low cost scenario) (Figure 23).
Figure 23. Retrofitting demand: no of vessels and in million cgt
Source: OECD calculation based on Clarkson's World Fleet Register.
As ship owners would have to comply with the BWMC, around 27 000 to 37 000 existing vessels are expected to retrofit BWMS in the upcoming seven years (between 8 September 2017 and 8 September 2024).
Repair yards’ time spent for retrofitting vessels with BWMS
Time spent in a dock for retrofitting a ship with BWMS is expected to be two weeks (Murata, 2013). According to Murata, with an effort to minimize the time spent in docks (i.e. drawing a high quality design, prefabrication of necessary construction materials, possible preparatory works on board during ship operation), the expected time spent in a dock for retrofitting can be shortened to as little as 11 days. For the estimation of the average repair yards’ time spent for retrofitting, 3 scenarios for time spent in a dock for retrofitting a vessel with BWMS can be considered (Table 13). It should be noted that the time spent in a dock also depends on the size and design of the vessel.
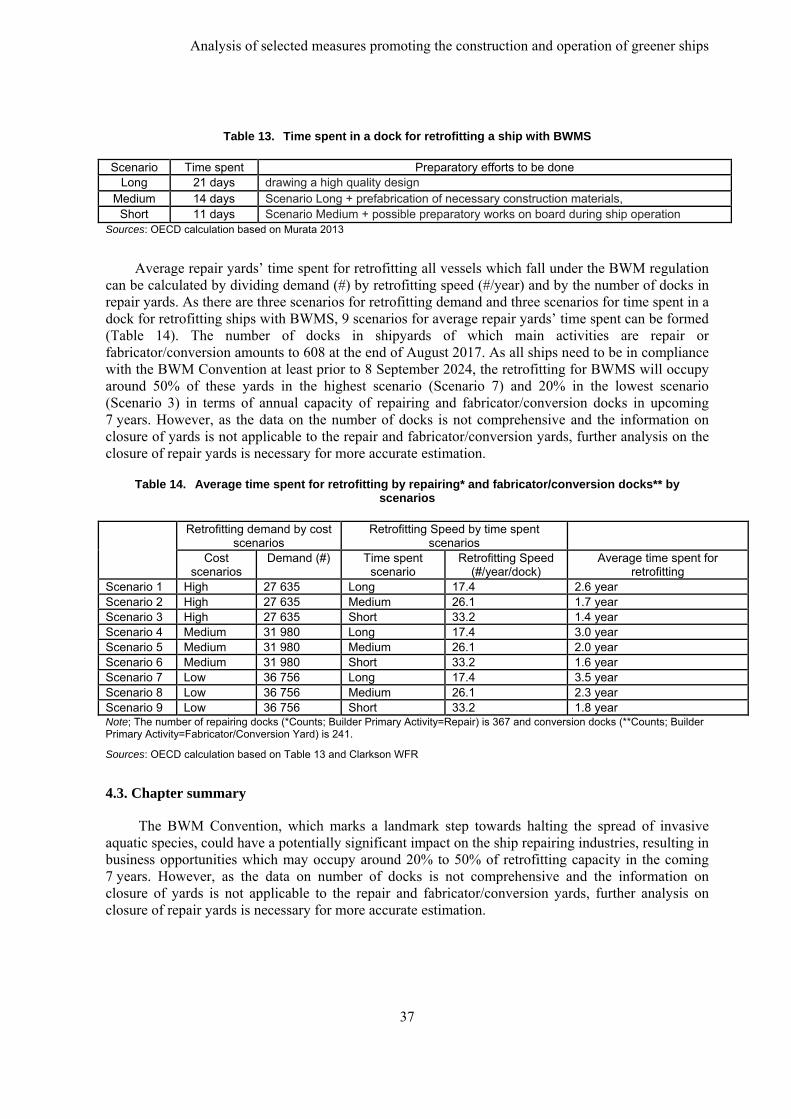
Analysis of selected measures promoting the construction and operation of greener ships
37
Table 13. Time spent in a dock for retrofitting a ship with BWMS
Scenario Time spent Preparatory efforts to be done Long 21 days drawing a high quality design
Medium 14 days Scenario Long + prefabrication of necessary construction materials, Short 11 days Scenario Medium + possible preparatory works on board during ship operation
Sources: OECD calculation based on Murata 2013
Average repair yards’ time spent for retrofitting all vessels which fall under the BWM regulation can be calculated by dividing demand (#) by retrofitting speed (#/year) and by the number of docks in repair yards. As there are three scenarios for retrofitting demand and three scenarios for time spent in a dock for retrofitting ships with BWMS, 9 scenarios for average repair yards’ time spent can be formed (Table 14). The number of docks in shipyards of which main activities are repair or fabricator/conversion amounts to 608 at the end of August 2017. As all ships need to be in compliance with the BWM Convention at least prior to 8 September 2024, the retrofitting for BWMS will occupy around 50% of these yards in the highest scenario (Scenario 7) and 20% in the lowest scenario (Scenario 3) in terms of annual capacity of repairing and fabricator/conversion docks in upcoming 7 years. However, as the data on the number of docks is not comprehensive and the information on closure of yards is not applicable to the repair and fabricator/conversion yards, further analysis on the closure of repair yards is necessary for more accurate estimation.
Table 14. Average time spent for retrofitting by repairing* and fabricator/conversion docks** by scenarios
Retrofitting demand by cost scenarios
Retrofitting Speed by time spent scenarios
Cost scenarios
Demand (#) Time spent scenario
Retrofitting Speed (#/year/dock)
Average time spent for retrofitting
Scenario 1 High 27 635 Long 17.4 2.6 year Scenario 2 High 27 635 Medium 26.1 1.7 year Scenario 3 High 27 635 Short 33.2 1.4 year Scenario 4 Medium 31 980 Long 17.4 3.0 year Scenario 5 Medium 31 980 Medium 26.1 2.0 year Scenario 6 Medium 31 980 Short 33.2 1.6 year Scenario 7 Low 36 756 Long 17.4 3.5 year Scenario 8 Low 36 756 Medium 26.1 2.3 year Scenario 9 Low 36 756 Short 33.2 1.8 year Note; The number of repairing docks (*Counts; Builder Primary Activity=Repair) is 367 and conversion docks (**Counts; Builder Primary Activity=Fabricator/Conversion Yard) is 241.
Sources: OECD calculation based on Table 13 and Clarkson WFR
4.3. Chapter summary
The BWM Convention, which marks a landmark step towards halting the spread of invasive aquatic species, could have a potentially significant impact on the ship repairing industries, resulting in business opportunities which may occupy around 20% to 50% of retrofitting capacity in the coming 7 years. However, as the data on number of docks is not comprehensive and the information on closure of yards is not applicable to the repair and fabricator/conversion yards, further analysis on closure of repair yards is necessary for more accurate estimation.
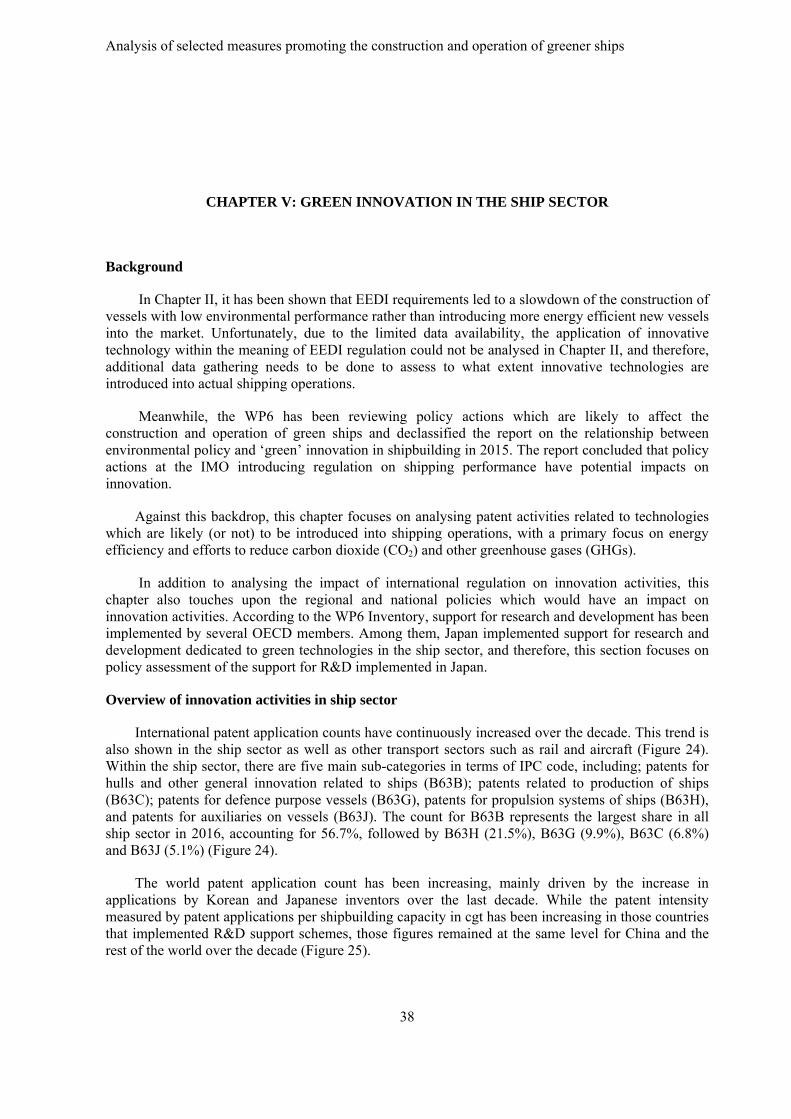
Analysis of selected measures promoting the construction and operation of greener ships
38
CHAPTER V: GREEN INNOVATION IN THE SHIP SECTOR
Background
In Chapter II, it has been shown that EEDI requirements led to a slowdown of the construction of vessels with low environmental performance rather than introducing more energy efficient new vessels into the market. Unfortunately, due to the limited data availability, the application of innovative technology within the meaning of EEDI regulation could not be analysed in Chapter II, and therefore, additional data gathering needs to be done to assess to what extent innovative technologies are introduced into actual shipping operations.
Meanwhile, the WP6 has been reviewing policy actions which are likely to affect the construction and operation of green ships and declassified the report on the relationship between environmental policy and ‘green’ innovation in shipbuilding in 2015. The report concluded that policy actions at the IMO introducing regulation on shipping performance have potential impacts on innovation.
Against this backdrop, this chapter focuses on analysing patent activities related to technologies which are likely (or not) to be introduced into shipping operations, with a primary focus on energy efficiency and efforts to reduce carbon dioxide (CO2) and other greenhouse gases (GHGs).
In addition to analysing the impact of international regulation on innovation activities, this chapter also touches upon the regional and national policies which would have an impact on innovation activities. According to the WP6 Inventory, support for research and development has been implemented by several OECD members. Among them, Japan implemented support for research and development dedicated to green technologies in the ship sector, and therefore, this section focuses on policy assessment of the support for R&D implemented in Japan.
Overview of innovation activities in ship sector
International patent application counts have continuously increased over the decade. This trend is also shown in the ship sector as well as other transport sectors such as rail and aircraft (Figure 24). Within the ship sector, there are five main sub-categories in terms of IPC code, including; patents for hulls and other general innovation related to ships (B63B); patents related to production of ships (B63C); patents for defence purpose vessels (B63G), patents for propulsion systems of ships (B63H), and patents for auxiliaries on vessels (B63J). The count for B63B represents the largest share in all ship sector in 2016, accounting for 56.7%, followed by B63H (21.5%), B63G (9.9%), B63C (6.8%) and B63J (5.1%) (Figure 24).
The world patent application count has been increasing, mainly driven by the increase in applications by Korean and Japanese inventors over the last decade. While the patent intensity measured by patent applications per shipbuilding capacity in cgt has been increasing in those countries that implemented R&D support schemes, those figures remained at the same level for China and the rest of the world over the decade (Figure 25).
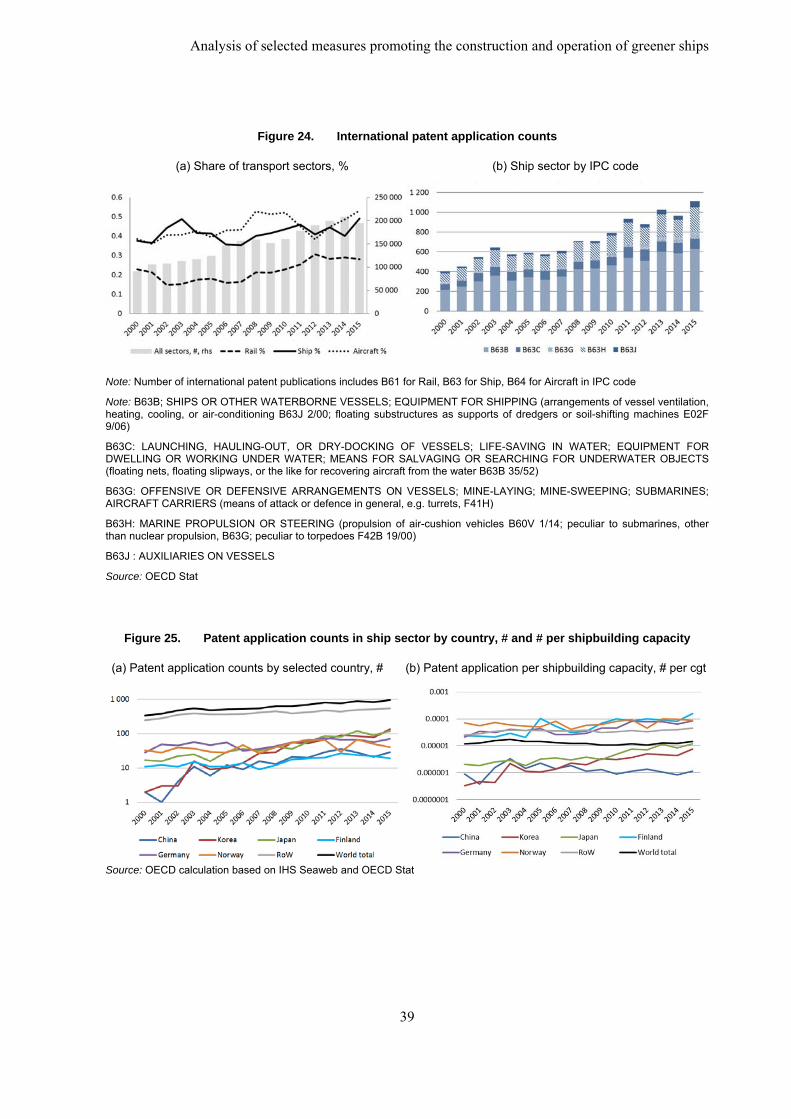
Analysis of selected measures promoting the construction and operation of greener ships
39
Figure 24. International patent application counts
(a) Share of transport sectors, % (b) Ship sector by IPC code
Note: Number of international patent publications includes B61 for Rail, B63 for Ship, B64 for Aircraft in IPC code
Note: B63B; SHIPS OR OTHER WATERBORNE VESSELS; EQUIPMENT FOR SHIPPING (arrangements of vessel ventilation, heating, cooling, or air-conditioning B63J 2/00; floating substructures as supports of dredgers or soil-shifting machines E02F 9/06)
B63C: LAUNCHING, HAULING-OUT, OR DRY-DOCKING OF VESSELS; LIFE-SAVING IN WATER; EQUIPMENT FOR DWELLING OR WORKING UNDER WATER; MEANS FOR SALVAGING OR SEARCHING FOR UNDERWATER OBJECTS (floating nets, floating slipways, or the like for recovering aircraft from the water B63B 35/52)
B63G: OFFENSIVE OR DEFENSIVE ARRANGEMENTS ON VESSELS; MINE-LAYING; MINE-SWEEPING; SUBMARINES; AIRCRAFT CARRIERS (means of attack or defence in general, e.g. turrets, F41H)
B63H: MARINE PROPULSION OR STEERING (propulsion of air-cushion vehicles B60V 1/14; peculiar to submarines, other than nuclear propulsion, B63G; peculiar to torpedoes F42B 19/00)
B63J : AUXILIARIES ON VESSELS
Source: OECD Stat
Figure 25. Patent application counts in ship sector by country, # and # per shipbuilding capacity
(a) Patent application counts by selected country, # (b) Patent application per shipbuilding capacity, # per cgt
Source: OECD calculation based on IHS Seaweb and OECD Stat
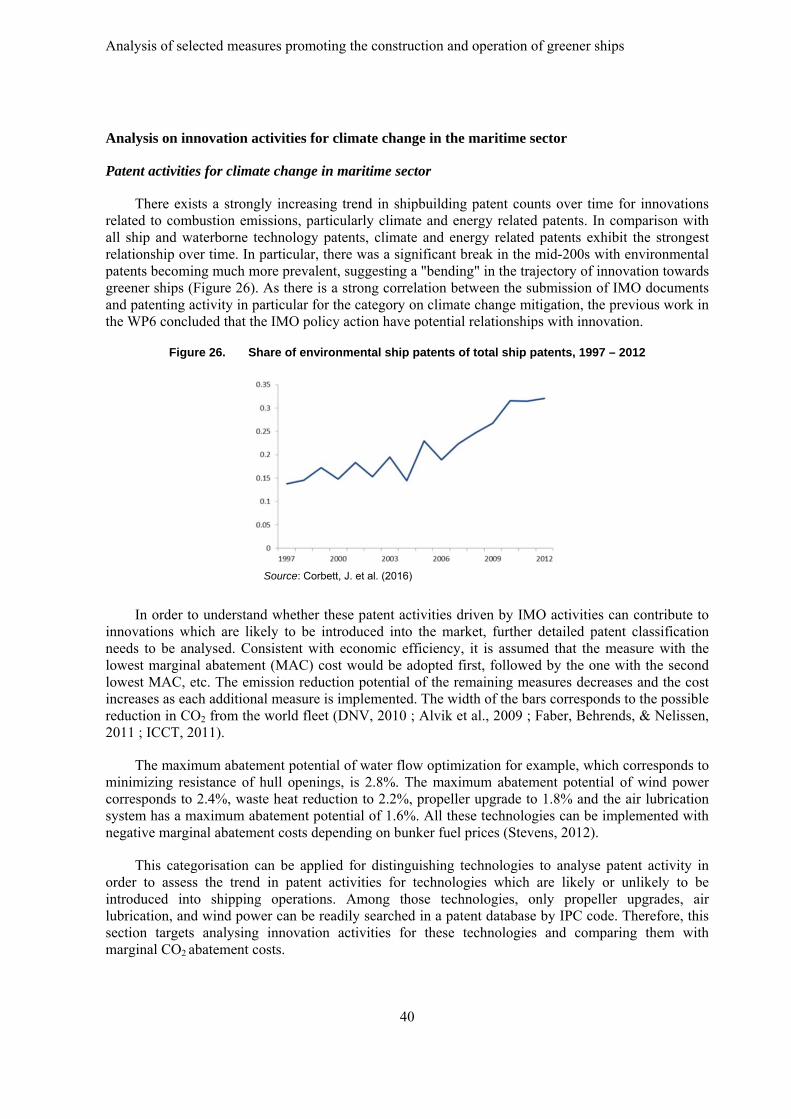
Analysis of selected measures promoting the construction and operation of greener ships
40
Analysis on innovation activities for climate change in the maritime sector
Patent activities for climate change in maritime sector
There exists a strongly increasing trend in shipbuilding patent counts over time for innovations related to combustion emissions, particularly climate and energy related patents. In comparison with all ship and waterborne technology patents, climate and energy related patents exhibit the strongest relationship over time. In particular, there was a significant break in the mid-200s with environmental patents becoming much more prevalent, suggesting a "bending" in the trajectory of innovation towards greener ships (Figure 26). As there is a strong correlation between the submission of IMO documents and patenting activity in particular for the category on climate change mitigation, the previous work in the WP6 concluded that the IMO policy action have potential relationships with innovation.
Figure 26. Share of environmental ship patents of total ship patents, 1997 – 2012
Source: Corbett, J. et al. (2016)
In order to understand whether these patent activities driven by IMO activities can contribute to innovations which are likely to be introduced into the market, further detailed patent classification needs to be analysed. Consistent with economic efficiency, it is assumed that the measure with the lowest marginal abatement (MAC) cost would be adopted first, followed by the one with the second lowest MAC, etc. The emission reduction potential of the remaining measures decreases and the cost increases as each additional measure is implemented. The width of the bars corresponds to the possible reduction in CO2 from the world fleet (DNV, 2010 ; Alvik et al., 2009 ; Faber, Behrends, & Nelissen, 2011 ; ICCT, 2011).
The maximum abatement potential of water flow optimization for example, which corresponds to minimizing resistance of hull openings, is 2.8%. The maximum abatement potential of wind power corresponds to 2.4%, waste heat reduction to 2.2%, propeller upgrade to 1.8% and the air lubrication system has a maximum abatement potential of 1.6%. All these technologies can be implemented with negative marginal abatement costs depending on bunker fuel prices (Stevens, 2012).
This categorisation can be applied for distinguishing technologies to analyse patent activity in order to assess the trend in patent activities for technologies which are likely or unlikely to be introduced into shipping operations. Among those technologies, only propeller upgrades, air lubrication, and wind power can be readily searched in a patent database by IPC code. Therefore, this section targets analysing innovation activities for these technologies and comparing them with marginal CO2 abatement costs.
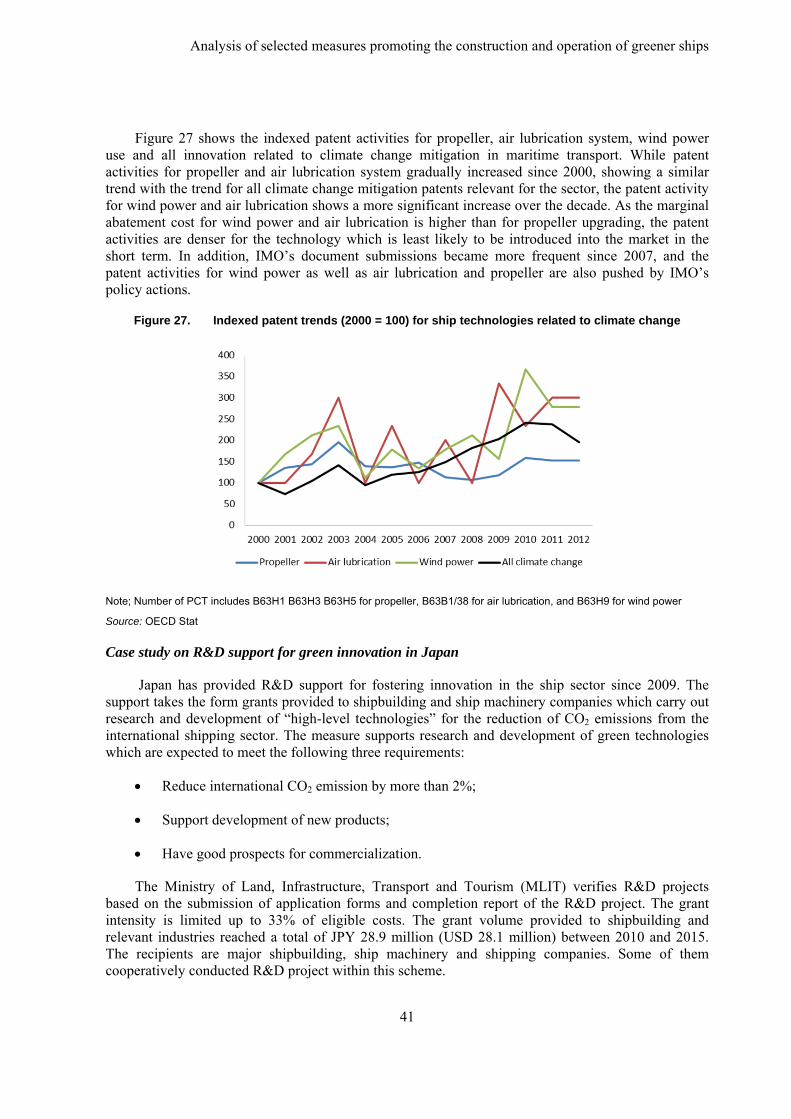
Analysis of selected measures promoting the construction and operation of greener ships
41
Figure 27 shows the indexed patent activities for propeller, air lubrication system, wind power use and all innovation related to climate change mitigation in maritime transport. While patent activities for propeller and air lubrication system gradually increased since 2000, showing a similar trend with the trend for all climate change mitigation patents relevant for the sector, the patent activity for wind power and air lubrication shows a more significant increase over the decade. As the marginal abatement cost for wind power and air lubrication is higher than for propeller upgrading, the patent activities are denser for the technology which is least likely to be introduced into the market in the short term. In addition, IMO’s document submissions became more frequent since 2007, and the patent activities for wind power as well as air lubrication and propeller are also pushed by IMO’s policy actions.
Figure 27. Indexed patent trends (2000 = 100) for ship technologies related to climate change
Note; Number of PCT includes B63H1 B63H3 B63H5 for propeller, B63B1/38 for air lubrication, and B63H9 for wind power
Source: OECD Stat
Case study on R&D support for green innovation in Japan
Japan has provided R&D support for fostering innovation in the ship sector since 2009. The support takes the form grants provided to shipbuilding and ship machinery companies which carry out research and development of “high-level technologies” for the reduction of CO2 emissions from the international shipping sector. The measure supports research and development of green technologies which are expected to meet the following three requirements:
Reduce international CO2 emission by more than 2%;
Support development of new products;
Have good prospects for commercialization.
The Ministry of Land, Infrastructure, Transport and Tourism (MLIT) verifies R&D projects based on the submission of application forms and completion report of the R&D project. The grant intensity is limited up to 33% of eligible costs. The grant volume provided to shipbuilding and relevant industries reached a total of JPY 28.9 million (USD 28.1 million) between 2010 and 2015. The recipients are major shipbuilding, ship machinery and shipping companies. Some of them cooperatively conducted R&D project within this scheme.
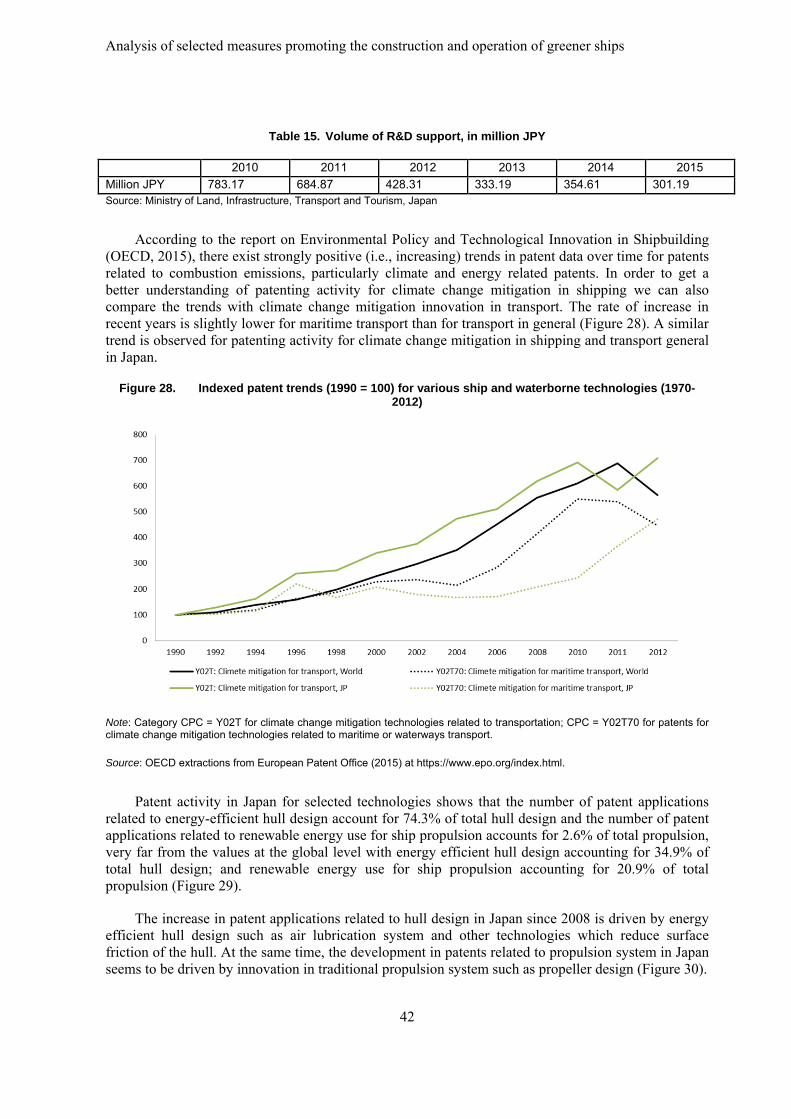
Analysis of selected measures promoting the construction and operation of greener ships
42
Table 15. Volume of R&D support, in million JPY
2010 2011 2012 2013 2014 2015
Million JPY 783.17 684.87 428.31 333.19 354.61 301.19 Source: Ministry of Land, Infrastructure, Transport and Tourism, Japan
According to the report on Environmental Policy and Technological Innovation in Shipbuilding (OECD, 2015), there exist strongly positive (i.e., increasing) trends in patent data over time for patents related to combustion emissions, particularly climate and energy related patents. In order to get a better understanding of patenting activity for climate change mitigation in shipping we can also compare the trends with climate change mitigation innovation in transport. The rate of increase in recent years is slightly lower for maritime transport than for transport in general (Figure 28). A similar trend is observed for patenting activity for climate change mitigation in shipping and transport general in Japan.
Figure 28. Indexed patent trends (1990 = 100) for various ship and waterborne technologies (1970-2012)
Note: Category CPC = Y02T for climate change mitigation technologies related to transportation; CPC = Y02T70 for patents for climate change mitigation technologies related to maritime or waterways transport.
Source: OECD extractions from European Patent Office (2015) at https://www.epo.org/index.html.
Patent activity in Japan for selected technologies shows that the number of patent applications related to energy-efficient hull design account for 74.3% of total hull design and the number of patent applications related to renewable energy use for ship propulsion accounts for 2.6% of total propulsion, very far from the values at the global level with energy efficient hull design accounting for 34.9% of total hull design; and renewable energy use for ship propulsion accounting for 20.9% of total propulsion (Figure 29).
The increase in patent applications related to hull design in Japan since 2008 is driven by energy efficient hull design such as air lubrication system and other technologies which reduce surface friction of the hull. At the same time, the development in patents related to propulsion system in Japan seems to be driven by innovation in traditional propulsion system such as propeller design (Figure 30).
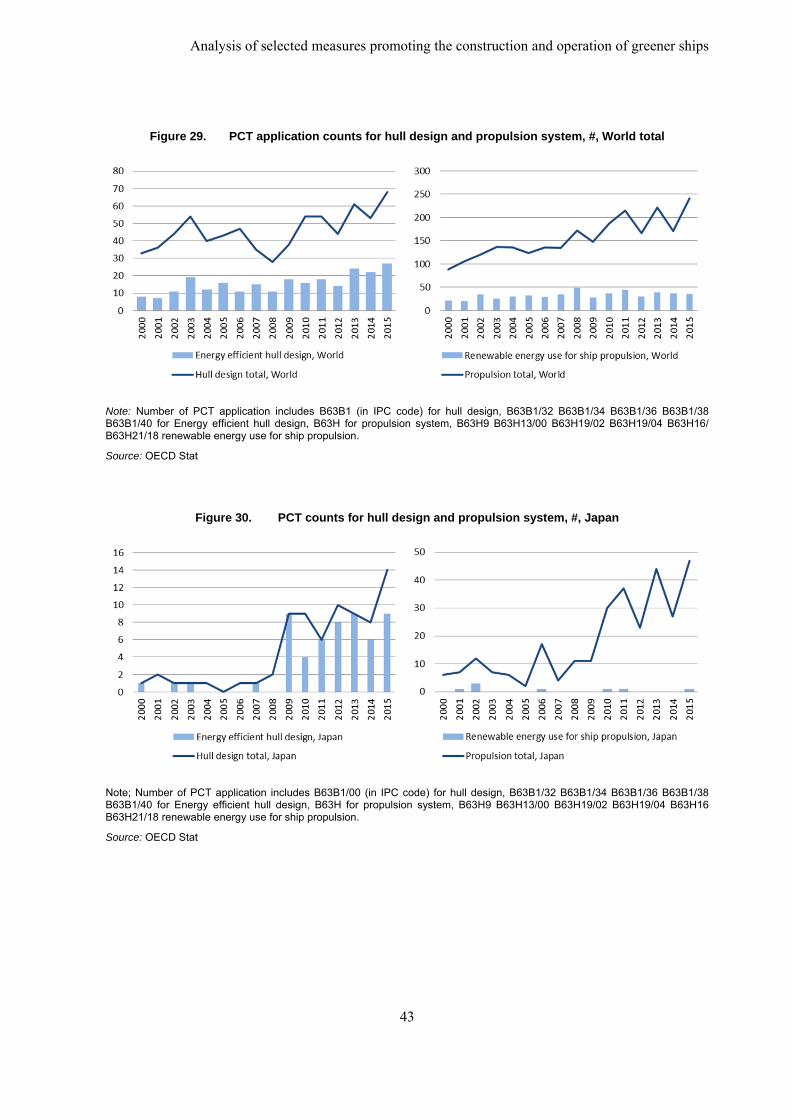
Analysis of selected measures promoting the construction and operation of greener ships
43
Figure 29. PCT application counts for hull design and propulsion system, #, World total
Note: Number of PCT application includes B63B1 (in IPC code) for hull design, B63B1/32 B63B1/34 B63B1/36 B63B1/38 B63B1/40 for Energy efficient hull design, B63H for propulsion system, B63H9 B63H13/00 B63H19/02 B63H19/04 B63H16/ B63H21/18 renewable energy use for ship propulsion.
Source: OECD Stat
Figure 30. PCT counts for hull design and propulsion system, #, Japan
Note; Number of PCT application includes B63B1/00 (in IPC code) for hull design, B63B1/32 B63B1/34 B63B1/36 B63B1/38 B63B1/40 for Energy efficient hull design, B63H for propulsion system, B63H9 B63H13/00 B63H19/02 B63H19/04 B63H16 B63H21/18 renewable energy use for ship propulsion.
Source: OECD Stat
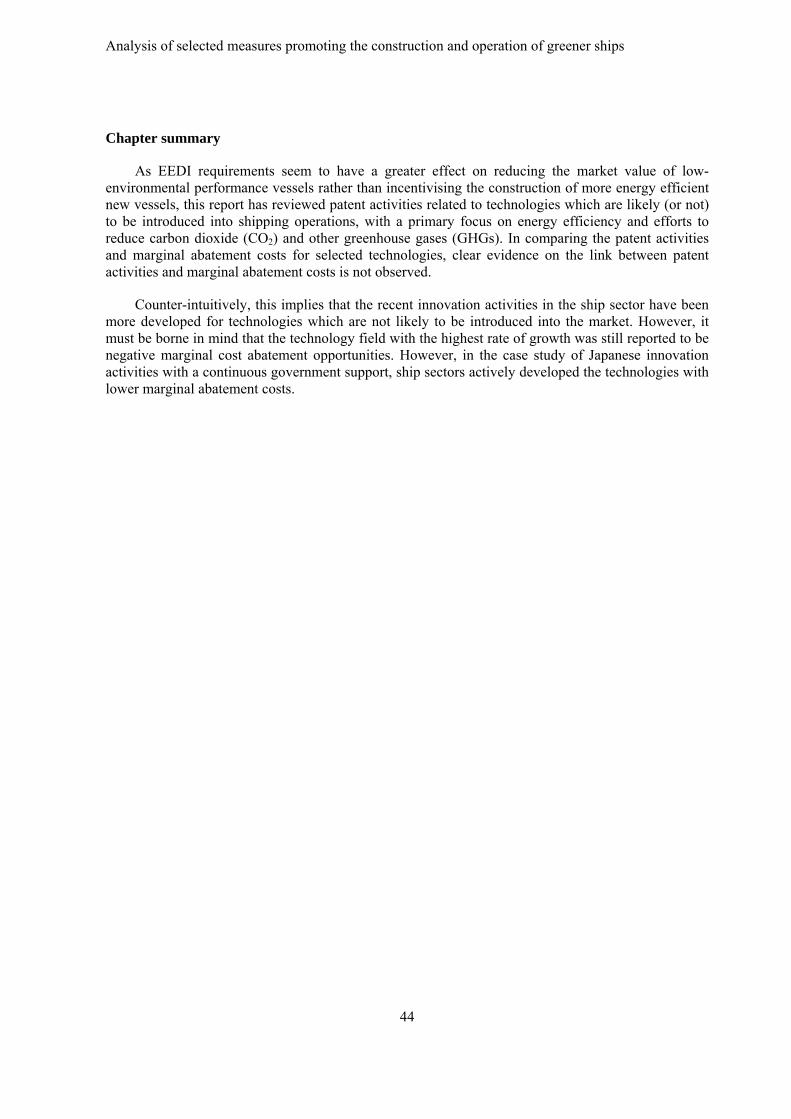
Analysis of selected measures promoting the construction and operation of greener ships
44
Chapter summary
As EEDI requirements seem to have a greater effect on reducing the market value of low-environmental performance vessels rather than incentivising the construction of more energy efficient new vessels, this report has reviewed patent activities related to technologies which are likely (or not) to be introduced into shipping operations, with a primary focus on energy efficiency and efforts to reduce carbon dioxide (CO2) and other greenhouse gases (GHGs). In comparing the patent activities and marginal abatement costs for selected technologies, clear evidence on the link between patent activities and marginal abatement costs is not observed.
Counter-intuitively, this implies that the recent innovation activities in the ship sector have been more developed for technologies which are not likely to be introduced into the market. However, it must be borne in mind that the technology field with the highest rate of growth was still reported to be negative marginal cost abatement opportunities. However, in the case study of Japanese innovation activities with a continuous government support, ship sectors actively developed the technologies with lower marginal abatement costs.
Analysis of selected measures promoting the construction and operation of greener ships
45
CHAPTER VI: CONCLUDING REMARKS
In this report, the impacts of policy actions on the market and technology developments are analysed by type of environmental hazard. Based on the evidence presented policy actions at international, regional and national levels have an impact on reducing environmental burden from shipping (i.e. EEDI requirements, stricter restriction on air pollutants in ECAs) and contribute to technology developments as well as creating new business opportunities (i.e. retrofitting ballast water management system, new building demand stem form scrap and build subsidies). The policy mix of stricter regulation and financial supports at national level promotes the development of greener fleets, and interestingly, national policies appeared to significantly affect how stakeholders comply with regulation.
GHG Emissions
International regulation based on EEDI is expected to have a significant impact on future CO2 emissions. EEDI is expected to contribute to a reduction of emissions from bulkers, tankers and container ships by around 115 million CO2 ton by 2035, which is equivalent to 38% of total CO2 emissions from bulkers, tankers, and container ships in 2015. However, more efforts would be necessary as EEDI requirements are more effective to restrict vessels with very low energy efficiency rather than promote the entry of energy efficient vessels. Therefore complementary policies and measures fostering “over-compliant vessels” in terms of fuel efficiency are necessary in order to seek further reduction in CO2 emission from shipping and to contribute to mitigating climate change.
Some trends in design changes, which impact EEDI values, were observed for bulkers depending on size category, while these trends are not observed for tankers. Reduction in design speed was a measure frequently taken to meet required EEDI level for most vessel classes (except handysize bulkers) until 2015. On the contrary, changes in hull design are more prominent for larger size bulkers. This implies that the first reaction to comply with the EEDI requirement is to improve vessel designs rather than to reduce design speed.
At the national level, the Chinese scrap and build subsidy scheme on the fuel efficiency of vessels may be contributing to decreasing CO2 emissions from bulkers as EEDI values of Chinese owned vessels show improvement in EEDI values for bulkers in comparison between scrapped and new built vessels; however, the opposite result was observed for tankers. Further analysis may be necessary to figure out the reason for this opposite result for tankers by analysing the impact of hull design (double and single hull) on the EEDI values.
Air Pollution
Stricter restriction on sulphur content in ECAs has an impact on developments of LNG capable vessels. However, stricter restrictions in ECAs doesn’t appear to be an additional driving force to equip vessels with scrubbers or to build MGO capable vessels as similar reactions were also observed for fleets flagged in or owned by non-ECA countries. Moreover, an impact of stricter restriction on fleet development of vessels with
Analysis of selected measures promoting the construction and operation of greener ships
46
denitrification system was not observed as the stricter restriction is applied for vessels keel laid on and after 1st January 2016.
The policy mix of stricter regulation and financial support promotes the development of greener fleets, and interestingly, the national policies and measures appeared to significantly affect the owners’ decisions on how they comply with regulations.
Ballast Water Management
The BWM Convention, which represents a landmark step towards halting the spread of invasive aquatic species, could potentially have a significant impact on the ship repair industries, presenting business opportunities which could occupy around 20% to 50% of retrofitting capacity in the upcoming seven years. However, as precise numbers of docks are not known and information on closure of repair yards is not applicable to the repair and fabricator/conversion yards, further analysis on the closure of repair yards is necessary for more accurate estimation.
As EEDI requirements slow down building vessels with low environmental performance rather than boosting the delivery of energy efficient new vessels into the market, this report also reviewed patent activities related to technologies which are likely or unlikely to be introduced into shipping operation, with a primary focus on energy efficiency as well as efforts to reduce carbon dioxide (CO2) and other greenhouse gases (GHGs). There is no significant relationship between patent activities and marginal abatement costs for the selected technologies. This implies that recent innovation activities in the ship sector have been more developed for technologies which are not likely to be introduced into the market. However, in the case study of Japanese innovation activities with a continuous government support, ship sectors actively developed technologies with lower marginal abatement costs.
Overall, further analysis requiring additional data would be necessary to figure out the application of innovative technologies in the ship sector and the impact of policy actions on the use of innovative technologies in shipping operations. As the IMO MEPC 70 (in October 2016) adopted mandatory MARPOL Annex VI requiring ships to record and report their fuel consumption starting from 1 March 2018, this new information might enable researchers to understand the developments in the fuel efficiency of vessels in operation.
Analysis of selected measures promoting the construction and operation of greener ships
47
REFERENCES
Brandt, J. et al. (2013), “Assessment of past, present and future health-cost externalities of air pollution in Europe and the contribution from international ship traffic using the EVA model system”, Atmospheric Chemistry and Physics, No. 13, pp. 7747–7764, http://dx.doi.org/10.5194/acp-13-7747-2013.
Corbett, J. et al. (2016), “Environmental Policy and Technological Innovation in Shipbuilding”, OECD Science, Technology and Industry Policy Papers, No. 28, OECD Publishing, Paris, http://dx.doi.org/10.1787/5jm25wg57svj-en.
ICCT (2011), Reducing Greenhouse Gas Emissions from Ships, International Council on Clean Transportation, Washington, http://www.theicct.org/sites/default/files/publications/ ICCT_GHGfromships_jun2011.pdf.
IEA (2017), Tracking Clean Energy Progress 2017, International Energy Agency, Paris
IMO (2017a), “Sulphur oxides (SOx) and Particulate Matter (PM) – Regulation”, International Maritime Organization, London, http://www.imo.org/en/OurWork/Environment/PollutionPrevention/AirPollution/Pages/Sulphur-oxides-(SOx)-%E2%80%93-Regulation-14.aspx (accessed on 14 Nov 2017)
IMO (2017b), “Special Areas under MARPOL”, International Maritime Organization, London, http://www.imo.org/en/OurWork/Environment/SpecialAreasUnderMARPOL/Pages/Default.aspx (accessed on 14 Nov 2017)
IMO (2017c), “Press release 11 July 2017”, International Maritime Organization, London, http://www.imo.org/en/MediaCentre/PressBriefings/Pages/17-MEPC-71.aspx (accessed on 12 Oct 2017)
IMO (2017d), “NOx control requirements of Annex VI”, International Maritime Organization, London, http://www.imo.org/en/OurWork/Environment/PollutionPrevention/AirPollution/Pages/Nitrogen-oxides-(NOx)-%E2%80%93-Regulation-13.aspx (accessed on 12 Oct 2017)
IMO (2016a), “Frequently Asked Questions, IMO regulations to reduce air pollution from ships and the review of fuel oil availability”, International Maritime Organization, London, http://www.imo.org/en/MediaCentre/HotTopics/GHG/Documents/sulphur%20limits%20FAQ_20-09-2016.pdf (accessed on 22 Aug 2017)
IMO (2016b), “Press release 08 September 2016”, International Maritime Organization, London, http://www.imo.org/en/MediaCentre/PressBriefings/Pages/22-BWM-.aspx (accessed on 12 Oct 2017)
IMO (2016c) “Train the Trainer (TTT) Course on Energy Efficient Ship Operation”, January 2016, http://www.imo.org/en/ourwork/environment/pollutionprevention/airpollution/pages/imo-train-the-trainer-course.aspx
Analysis of selected measures promoting the construction and operation of greener ships
48
IMO (2013), MEPC 1/Circ.815, 2013 guidance on treatment of innovative energy efficiency technologies for calculation and verification of the attained EEDI, International Maritime Organization, London, http://schonescheepvaart.nl/downloads/regelgeving/doc_1386151785.pdf, (accessed on 12 Oct 2017)
IMO (2011), IMO and the Environment, International Maritime Organization, London, http://www.imo.org/en/OurWork/Environment/Documents/IMO%20and%20the%20Environment%202011.pdf (accessed on 12 Oct 2017)
MOF China (2011),”关于印发《老旧运输船舶和单壳油轮报废更新补助专项资金
管理办法》 的通知” Notice on the measures for the administration of subsidy for the aged ships and single-hull oil tankers, Ministry of Finance of the People's Republic of China, Beijing, http://fgcx.bjcourt.gov.cn:4601/law?fn=chl381s210.txt (accessed on 12 Oct 2017)
MOF China (2014), “关于印发《老旧运输船舶和单壳油轮报废更新中央财政补助专项
资金管理办法》的通知” [Circular on the measures for the administration of the subsidy for the aged ships and single-hull oil tankers], Ministry of Finance of the People's Republic of China, Beijing, http://jjs.mof.gov.cn/zhengwuxinxi/tongzhigonggao/201402/t20140227_1047811.html (accessed on 12 Oct 2017)
MOT China (2017), “交通运输部关于修改《老旧运输船舶管理规定》的决定” [The revised implementation plan to promote replacement of old vessels and single hull tankers], Ministry of Transport of the People's Republic of China, Beijing, http://zizhan.mot.gov.cn/zfxxgk/bnssj/zcfgs/201706/t20170619_2221431.html (accessed on 12 Oct 2017)
MPA (2011), “Green Ship Programme”, Maritime and Port Authority of Singapore, http://www.mpa.gov.sg/web/portal/home/maritime-singapore/green-efforts/maritime-singapore-green-initiative/green-ship-programme (accessed on 12 Oct 2017)
Murata, Yuichiro, and Yasuhiko Inomata (2013), バラスト水処理装置追設工事における 工期短縮等への取組みについて (Our Efforts to Reduce the Work Period for Installing Ballast Water Treatment Systems), 三菱重工技報 Vol. 50 No. 2 (2013) available at http://www.mhi.co.jp/technology/review/pdf/502/502087.pdf (accessed on 12 Oct 2017)
Norwegian Environment Agency (2015), “Acid rain”, http://www.environment.no/topics/air-pollution/acid-rain/, (accessed on 22 Aug 2017)
OECD (2016a), Peer review of the Norwegian shipbuilding industry, OECD Publishing, Paris https://www.oecd.org/industry/ind/PeerReviewNorway_FINAL.pdf
OECD (2016b), Imbalances in the shipbuilding industry and assessment of policy responses, OECD Publishing, Paris http://www.oecd.org/industry/ind/Imbalances_Shipbuilding_Industry.pdf
OECD (2014), “Measuring environmental innovation using patent data: policy relevance”, OECD, Paris http://www.oecd.org/officialdocuments/publicdisplaydocumentpdf/?cote=ENV/EPOC/WPEI(2014)6/FINAL&docLanguage=En
Analysis of selected measures promoting the construction and operation of greener ships
49
van Hassel, Edwin (2016), Presentation “The Implementation And Evaluation Of The Eedi” at the 124th session of the WP6
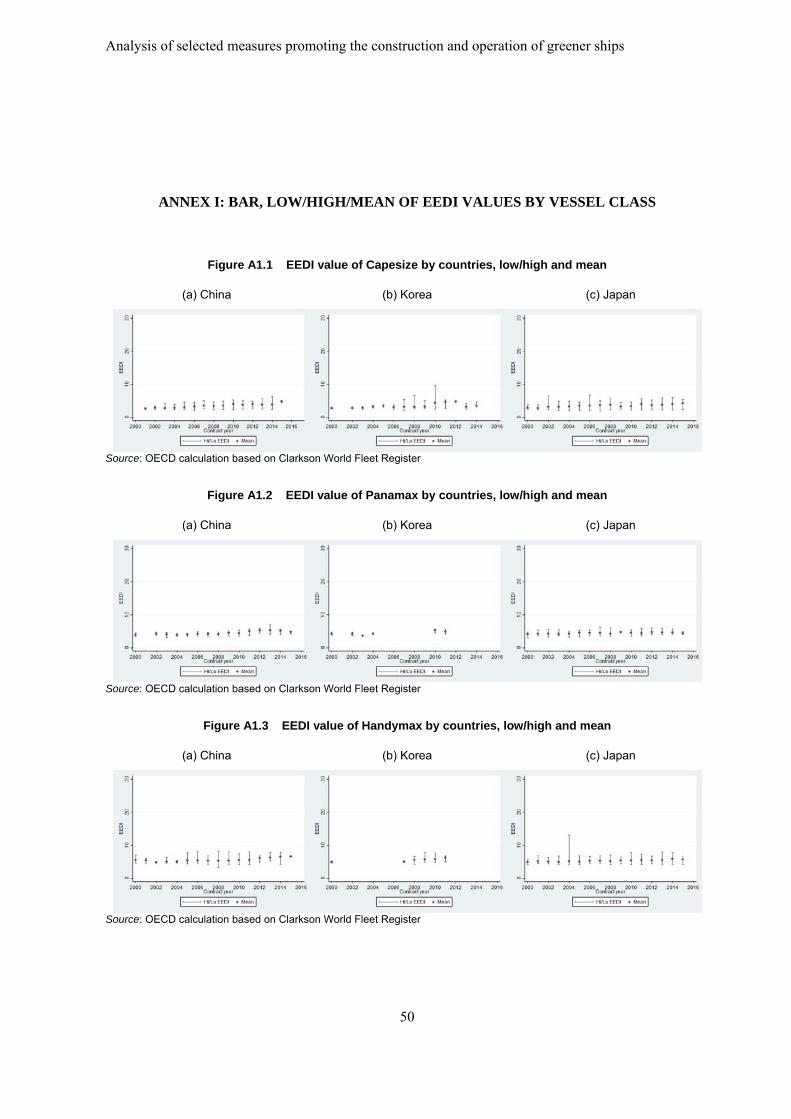
Analysis of selected measures promoting the construction and operation of greener ships
50
ANNEX I: BAR, LOW/HIGH/MEAN OF EEDI VALUES BY VESSEL CLASS
Figure A1.1 EEDI value of Capesize by countries, low/high and mean
(a) China (b) Korea (c) Japan
Source: OECD calculation based on Clarkson World Fleet Register
Figure A1.2 EEDI value of Panamax by countries, low/high and mean
(a) China (b) Korea (c) Japan
Source: OECD calculation based on Clarkson World Fleet Register
Figure A1.3 EEDI value of Handymax by countries, low/high and mean
(a) China (b) Korea (c) Japan
Source: OECD calculation based on Clarkson World Fleet Register
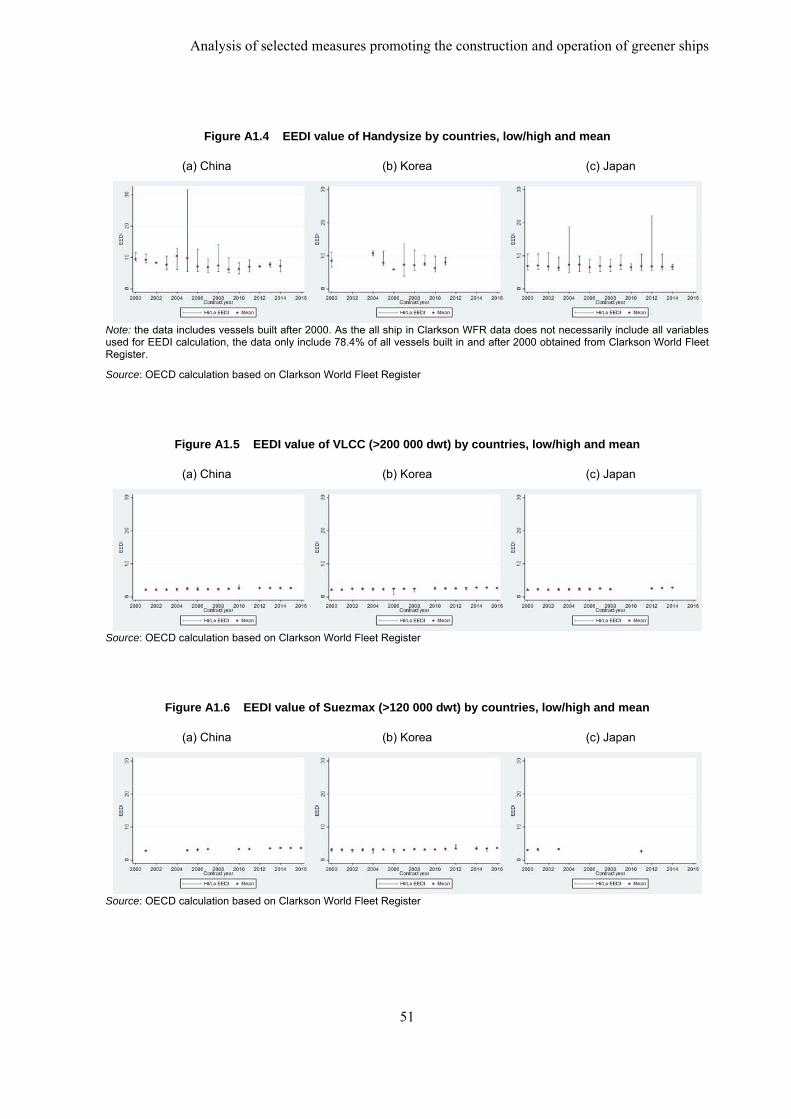
Analysis of selected measures promoting the construction and operation of greener ships
51
Figure A1.4 EEDI value of Handysize by countries, low/high and mean
(a) China (b) Korea (c) Japan
Note: the data includes vessels built after 2000. As the all ship in Clarkson WFR data does not necessarily include all variables used for EEDI calculation, the data only include 78.4% of all vessels built in and after 2000 obtained from Clarkson World Fleet Register.
Source: OECD calculation based on Clarkson World Fleet Register
Figure A1.5 EEDI value of VLCC (>200 000 dwt) by countries, low/high and mean
(a) China (b) Korea (c) Japan
Source: OECD calculation based on Clarkson World Fleet Register
Figure A1.6 EEDI value of Suezmax (>120 000 dwt) by countries, low/high and mean
(a) China (b) Korea (c) Japan
Source: OECD calculation based on Clarkson World Fleet Register
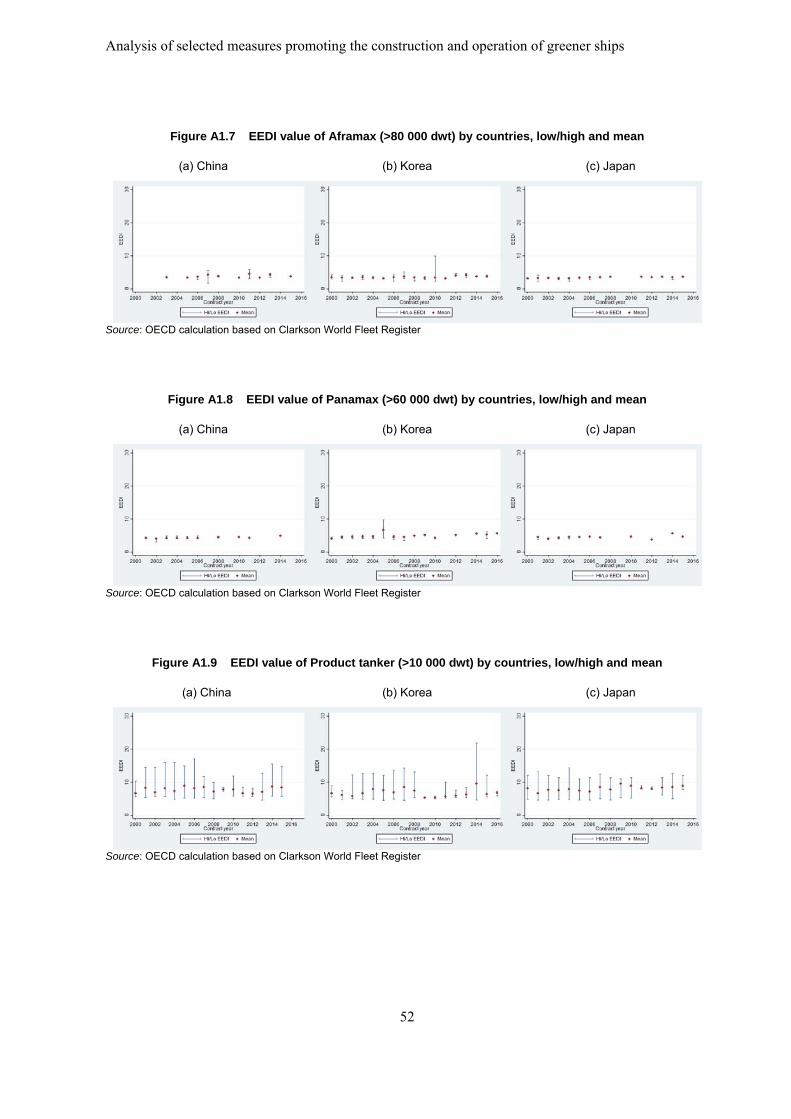
Analysis of selected measures promoting the construction and operation of greener ships
52
Figure A1.7 EEDI value of Aframax (>80 000 dwt) by countries, low/high and mean
(a) China (b) Korea (c) Japan
Source: OECD calculation based on Clarkson World Fleet Register
Figure A1.8 EEDI value of Panamax (>60 000 dwt) by countries, low/high and mean
(a) China (b) Korea (c) Japan
Source: OECD calculation based on Clarkson World Fleet Register
Figure A1.9 EEDI value of Product tanker (>10 000 dwt) by countries, low/high and mean
(a) China (b) Korea (c) Japan
Source: OECD calculation based on Clarkson World Fleet Register
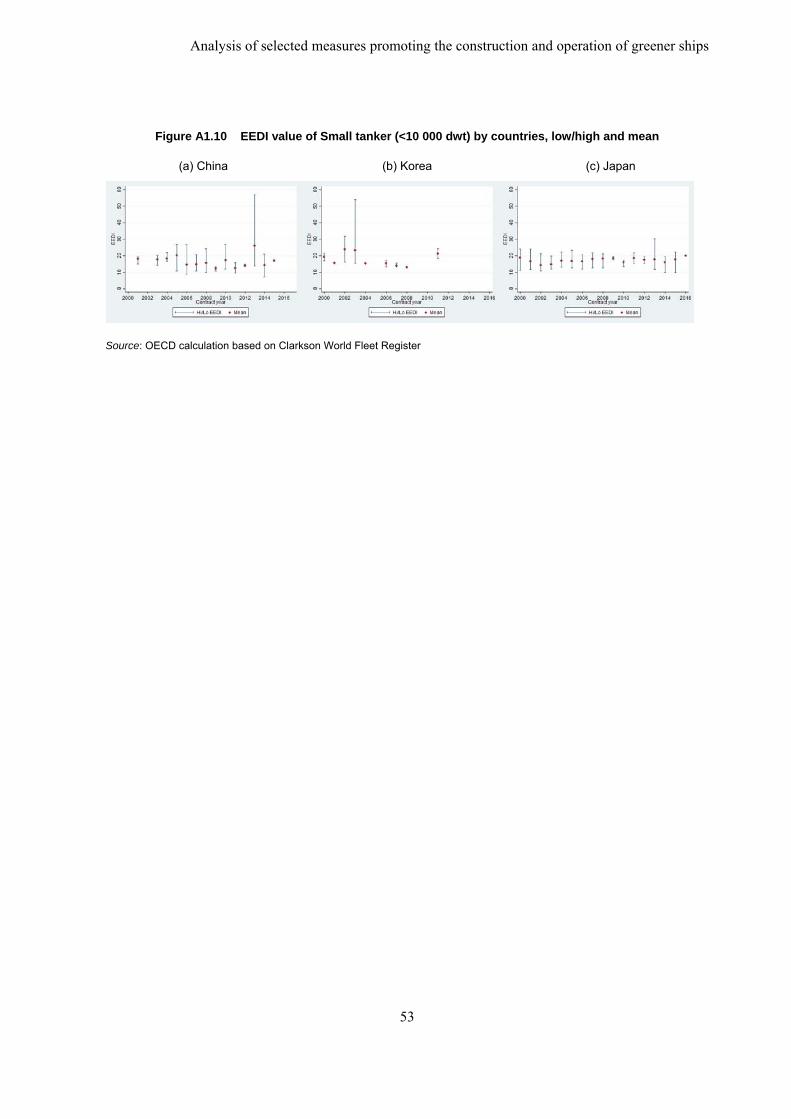
Analysis of selected measures promoting the construction and operation of greener ships
53
Figure A1.10 EEDI value of Small tanker (<10 000 dwt) by countries, low/high and mean
(a) China (b) Korea (c) Japan
Source: OECD calculation based on Clarkson World Fleet Register
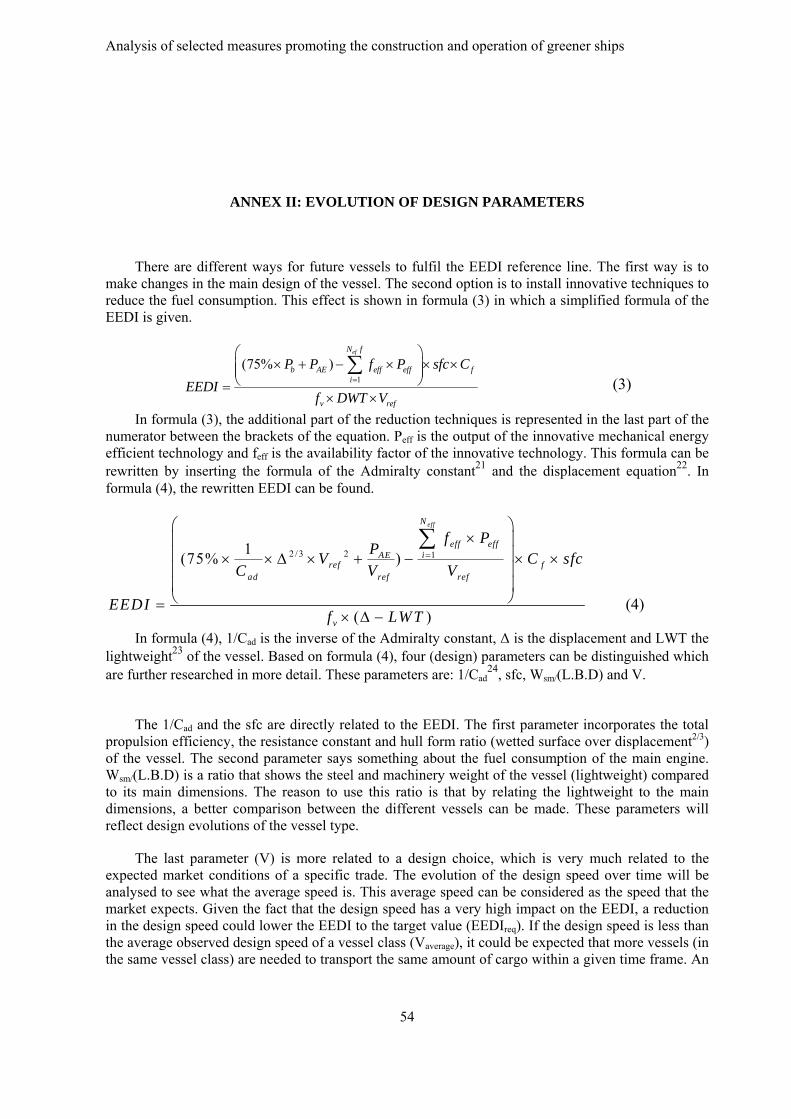
Analysis of selected measures promoting the construction and operation of greener ships
54
ANNEX II: EVOLUTION OF DESIGN PARAMETERS
There are different ways for future vessels to fulfil the EEDI reference line. The first way is to make changes in the main design of the vessel. The second option is to install innovative techniques to reduce the fuel consumption. This effect is shown in formula (3) in which a simplified formula of the EEDI is given.
1
(75% )efN f
b AE eff eff fi
v ref
P P f P sfc C
EEDIf DWT V
(3)
In formula (3), the additional part of the reduction techniques is represented in the last part of the numerator between the brackets of the equation. Peff is the output of the innovative mechanical energy efficient technology and feff is the availability factor of the innovative technology. This formula can be rewritten by inserting the formula of the Admiralty constant21 and the displacement equation22. In formula (4), the rewritten EEDI can be found.
2 /3 2 11(75% )
( )
effN
eff effiAE
ref fad ref ref
v
f PP
V C sfcC V V
EEDIf LWT
(4)
In formula (4), 1/Cad is the inverse of the Admiralty constant, Δ is the displacement and LWT the lightweight23 of the vessel. Based on formula (4), four (design) parameters can be distinguished which are further researched in more detail. These parameters are: 1/Cad
24, sfc, Wsm/(L.B.D) and V.
The 1/Cad and the sfc are directly related to the EEDI. The first parameter incorporates the total
propulsion efficiency, the resistance constant and hull form ratio (wetted surface over displacement2/3) of the vessel. The second parameter says something about the fuel consumption of the main engine. Wsm/(L.B.D) is a ratio that shows the steel and machinery weight of the vessel (lightweight) compared to its main dimensions. The reason to use this ratio is that by relating the lightweight to the main dimensions, a better comparison between the different vessels can be made. These parameters will reflect design evolutions of the vessel type.
The last parameter (V) is more related to a design choice, which is very much related to the expected market conditions of a specific trade. The evolution of the design speed over time will be analysed to see what the average speed is. This average speed can be considered as the speed that the market expects. Given the fact that the design speed has a very high impact on the EEDI, a reduction in the design speed could lower the EEDI to the target value (EEDIreq). If the design speed is less than the average observed design speed of a vessel class (Vaverage), it could be expected that more vessels (in the same vessel class) are needed to transport the same amount of cargo within a given time frame. An
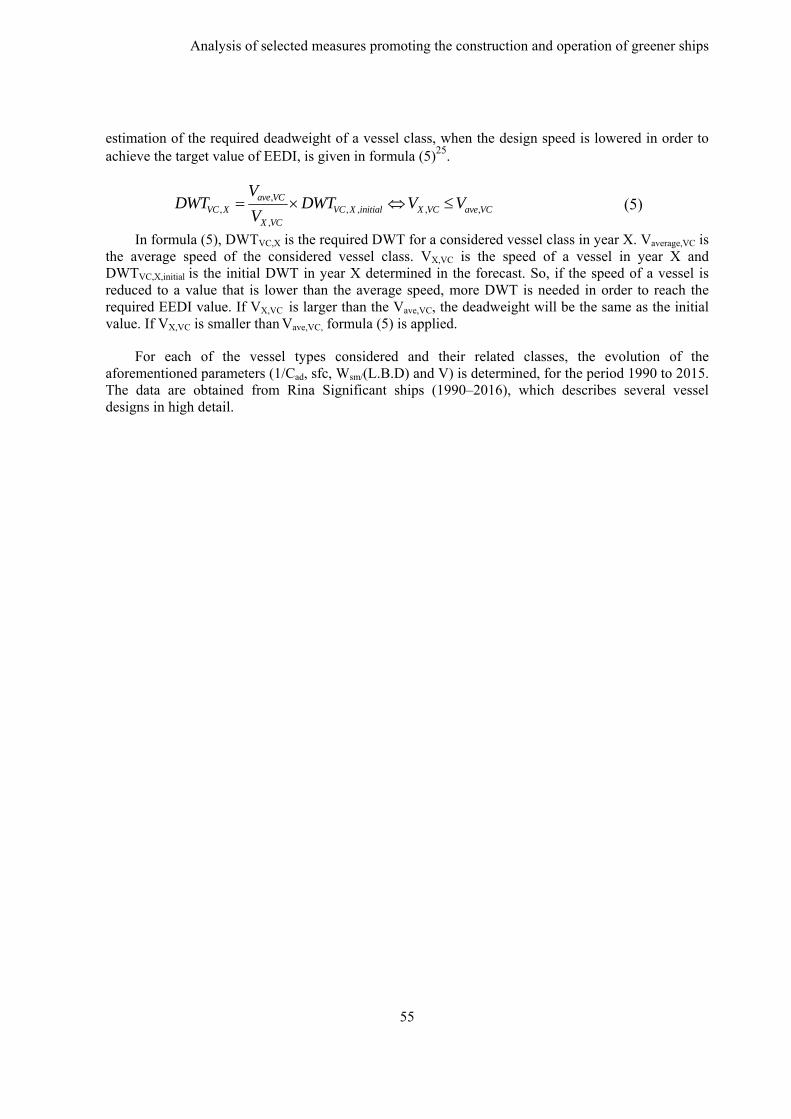
Analysis of selected measures promoting the construction and operation of greener ships
55
estimation of the required deadweight of a vessel class, when the design speed is lowered in order to achieve the target value of EEDI, is given in formula (5)25.
,, , , , ,
,
ave VCVC X VC X initial X VC ave VC
X VC
VDWT DWT V V
V (5)
In formula (5), DWTVC,X is the required DWT for a considered vessel class in year X. Vaverage,VC is the average speed of the considered vessel class. VX,VC is the speed of a vessel in year X and DWTVC,X,initial is the initial DWT in year X determined in the forecast. So, if the speed of a vessel is reduced to a value that is lower than the average speed, more DWT is needed in order to reach the required EEDI value. If VX,VC is larger than the Vave,VC, the deadweight will be the same as the initial value. If VX,VC is smaller than Vave,VC, formula (5) is applied.
For each of the vessel types considered and their related classes, the evolution of the aforementioned parameters (1/Cad, sfc, Wsm/(L.B.D) and V) is determined, for the period 1990 to 2015. The data are obtained from Rina Significant ships (1990–2016), which describes several vessel designs in high detail.
Analysis of selected measures promoting the construction and operation of greener ships
56
ANNEX III: INNOVATIVE TECHNOLOGY FACTORS
As the values estimated in the previous section does not take into account innovative technology factors in the formula to calculate EEDI (see formula (3) ANNEX II), this section assesses the impact of innovative technology factors on the attained EEDI values. Dataset provided in the IMO document, AIR POLLUTION AND ENERGY EFFICIENCY (MEPC 71/INF.14), was used for the analysis in this section. The dataset includes ship by ship data with quantitative variables including attained EEDI value and Dwt as well as qualitative variables on innovative technologies in “yes” or “no”. In the dataset, vessels with innovative technologies are observed only in container ships and Ro-Ro vessels. Therefore the analysis focused on the container vessels and Ro-Ro vessels. The number of observations amounts to 253 for container ships and 23 ships for Ro-Ro vessels. Within these observations, innovation technologies were introduced on 24 container vessels and 4 Ro-Ro vessels.
In order to identify the impact of innovative technology factors, regression analysis was performed with a qualitative variable (0, 1), where 1 means vessels for which innovative technologies are introduced and 0 for vessels for which innovative technologies are not introduced. As the regression fitting between EEDI and Dwt was conducted by IMO to calculate the reference line value of EEDI, same fitting model is applied in this analysis. In the IMO document (IMO, 201326), the reference line was formulated as Reference line value = a (100% deadweight)-c where "a" and "c" are parameters determined from the regression curve fit.
In applying this regression curve in this analysis, coefficient a in the formula above was broken down into the following two factors to figure out the impact of innovative technologies on EEDI values. Using these coefficients, regression formula can be expressed in formula (2).
a; coefficient which represents contribution of basic factors derived from main and axially engine power
b; coefficient which represents contribution of technology factors derived from introducing innovative technologies into vessels
EEDIatt = (a - b* Ii)* Wi c = (a Wi
c) – (b Ii* Wi c) …(2)27
Figure A3.1, Tables A3.1 and A3.2 show the results of regression analysis for container and Ro-Ro vessels. As the P value of coefficient b in the regression fitting for container vessel is 0.964, the analysis for container is not statistically significant. On the other hand, as P value of all coefficients in the regression fitting for Ro-Ro vessel are greater than 0.05, the data on Ro-Ro vessels can be further analysed.
As the second term of the formula (2) represents the impact of innovative technologies on EEDI values, it can be a proxy of EEDI reduction function by introducing innovative technologies for Ro-Ro vessels (Figure A3.2). According to the function, EEDI values for Ro-Ro vessels can be reduced by around 15% by introducing innovative technology factor.
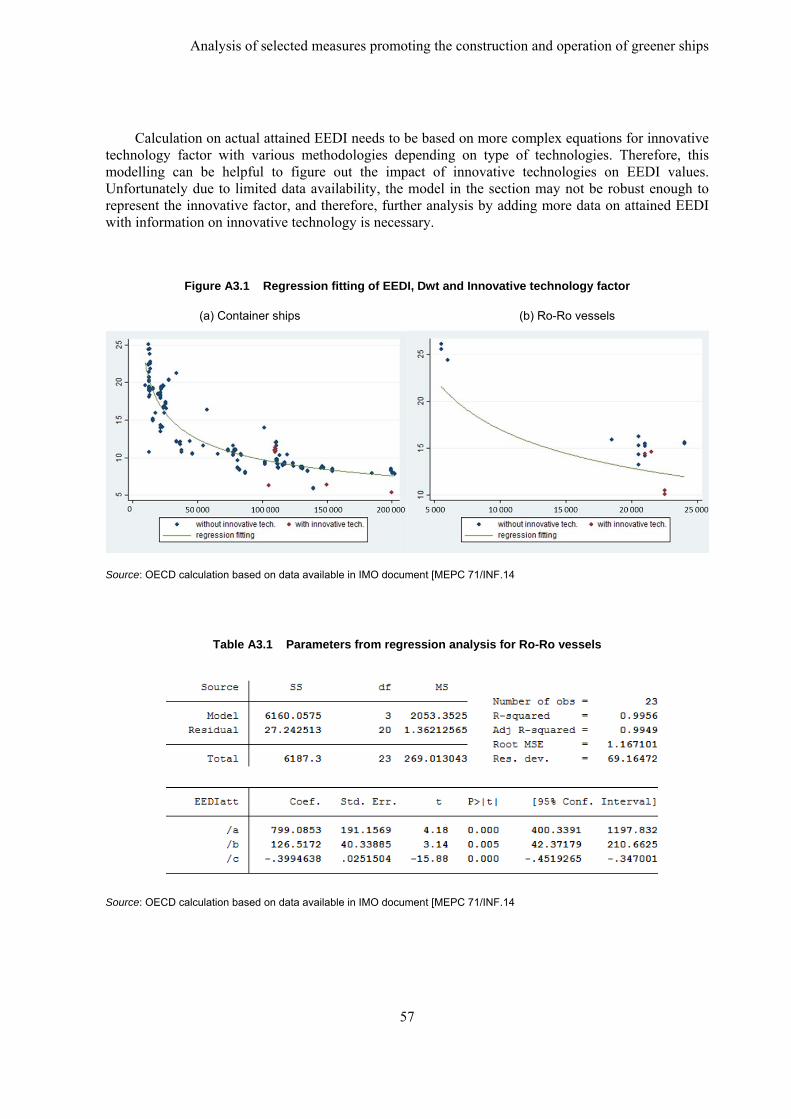
Analysis of selected measures promoting the construction and operation of greener ships
57
Calculation on actual attained EEDI needs to be based on more complex equations for innovative technology factor with various methodologies depending on type of technologies. Therefore, this modelling can be helpful to figure out the impact of innovative technologies on EEDI values. Unfortunately due to limited data availability, the model in the section may not be robust enough to represent the innovative factor, and therefore, further analysis by adding more data on attained EEDI with information on innovative technology is necessary.
Figure A3.1 Regression fitting of EEDI, Dwt and Innovative technology factor
(a) Container ships (b) Ro-Ro vessels
Source: OECD calculation based on data available in IMO document [MEPC 71/INF.14
Table A3.1 Parameters from regression analysis for Ro-Ro vessels
Source: OECD calculation based on data available in IMO document [MEPC 71/INF.14
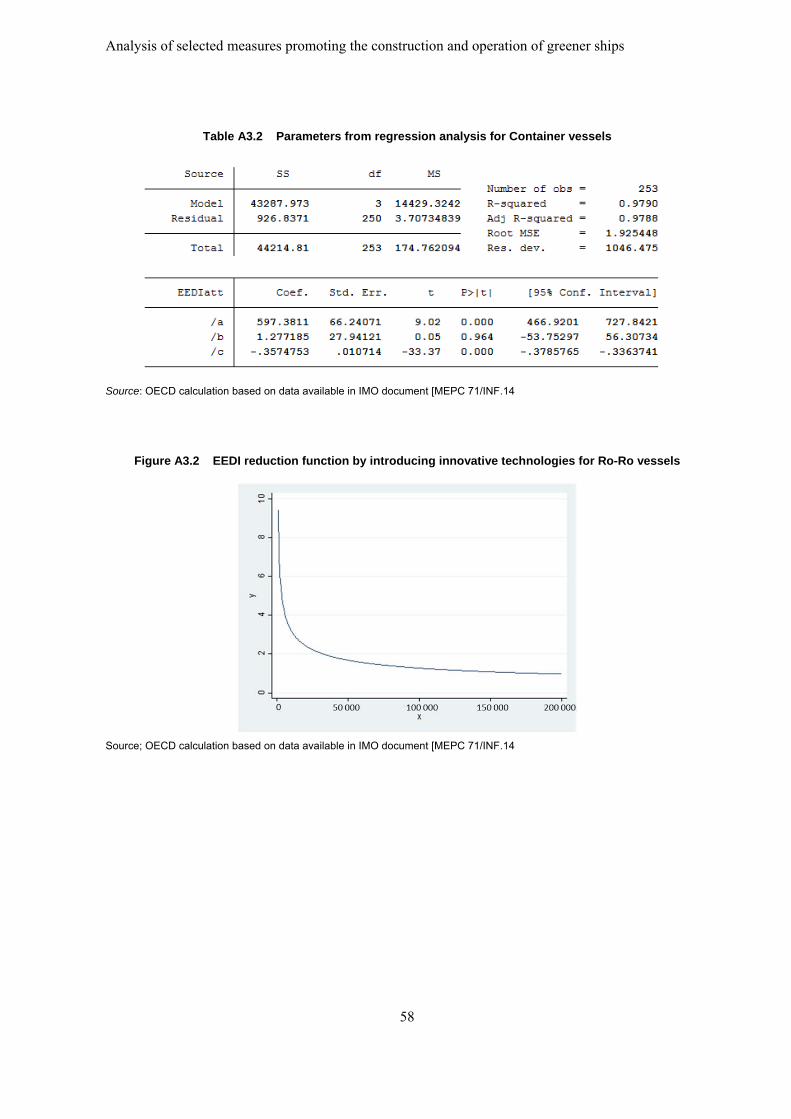
Analysis of selected measures promoting the construction and operation of greener ships
58
Table A3.2 Parameters from regression analysis for Container vessels
Source: OECD calculation based on data available in IMO document [MEPC 71/INF.14
Figure A3.2 EEDI reduction function by introducing innovative technologies for Ro-Ro vessels
Source; OECD calculation based on data available in IMO document [MEPC 71/INF.14
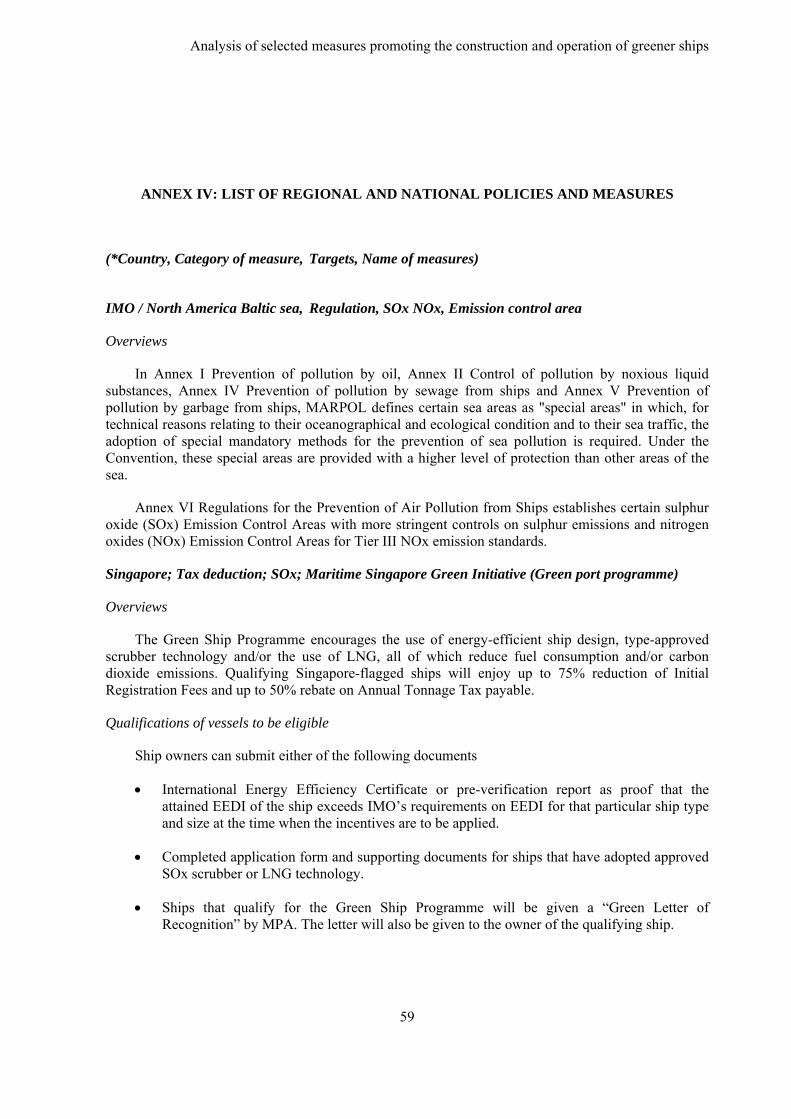
Analysis of selected measures promoting the construction and operation of greener ships
59
ANNEX IV: LIST OF REGIONAL AND NATIONAL POLICIES AND MEASURES
(*Country, Category of measure, Targets, Name of measures)
IMO / North America Baltic sea, Regulation, SOx NOx, Emission control area
Overviews
In Annex I Prevention of pollution by oil, Annex II Control of pollution by noxious liquid substances, Annex IV Prevention of pollution by sewage from ships and Annex V Prevention of pollution by garbage from ships, MARPOL defines certain sea areas as "special areas" in which, for technical reasons relating to their oceanographical and ecological condition and to their sea traffic, the adoption of special mandatory methods for the prevention of sea pollution is required. Under the Convention, these special areas are provided with a higher level of protection than other areas of the sea.
Annex VI Regulations for the Prevention of Air Pollution from Ships establishes certain sulphur oxide (SOx) Emission Control Areas with more stringent controls on sulphur emissions and nitrogen oxides (NOx) Emission Control Areas for Tier III NOx emission standards.
Singapore; Tax deduction; SOx; Maritime Singapore Green Initiative (Green port programme)
Overviews
The Green Ship Programme encourages the use of energy-efficient ship design, type-approved scrubber technology and/or the use of LNG, all of which reduce fuel consumption and/or carbon dioxide emissions. Qualifying Singapore-flagged ships will enjoy up to 75% reduction of Initial Registration Fees and up to 50% rebate on Annual Tonnage Tax payable.
Qualifications of vessels to be eligible
Ship owners can submit either of the following documents
International Energy Efficiency Certificate or pre-verification report as proof that the attained EEDI of the ship exceeds IMO’s requirements on EEDI for that particular ship type and size at the time when the incentives are to be applied.
Completed application form and supporting documents for ships that have adopted approved SOx scrubber or LNG technology.
Ships that qualify for the Green Ship Programme will be given a “Green Letter of Recognition” by MPA. The letter will also be given to the owner of the qualifying ship.
Analysis of selected measures promoting the construction and operation of greener ships
60
Verifications
MPA verify the qualifications of the vessel.
Financial incentives
Tax deduction (up to 75%) and Initial Registration fees (up to 50%)
Singapore Port fee discount SOx Maritime Singapore Green Initiative (Green port programme)
Overviews
The Green Port Programme encourages ocean-going ships calling at the Port of Singapore to reduce emissions of pollutants. Qualifying ocean-going ships that use type-approved abatement/scrubber technology*, burn clean fuels** or LNG during an entire port stay (of 5 days or less) within Singapore Port Limits (from the point of entry into Singapore Port Limits till the point of exit) are granted 25% reduction in port dues.
* The abatement/scrubber technology should be type-approved in accordance with IMO guidelines for reducing sulphur oxides emissions. ** Clean fuels are defined as fuels with sulphur content of less than 0.5% in this Programme. (IMO’s requirement is currently 3.5% until 1st Jan 2020)
Qualifications of vessels to be eligible
Owners/Charterers must fulfil all of the following criteria to qualify;
The programme is only valid for ocean-going vessels (not for harbour or pleasure craft)
Vessels currently under the annual port dues scheme can also participate and enjoy the reduction in port dues if the vessel uses any of the three measures listed above (type-approved abatement/scrubber technology*, burn clean fuels** or LNG) during each call to Singapore.
Vessels using type-approved abatement/scrubber technology should maintain use of the technology throughout the port stay (from the point of entry into Singapore Port Limits till the point of exit) to qualify for the concession.
Vessels using clean fuel or LNG should initiate the switch to clean fuels for the main engines and auxiliary engines from the time of entry into Singapore Port Limits until departure.
Concessions are only applicable to port calls of 5 days or less, regardless of the purpose of the calls
Verifications
MPA verify the qualifications of the vessel. (First notify MPA for the application of the port fee reduction, and then, MPA may request documents for qualifications)
Analysis of selected measures promoting the construction and operation of greener ships
61
Financial incentives
25% port fee reduction for the vessels qualified
EU/ EIB Loan guarantees to buyer; CO2, SOx, NOx, Ballast water etc.; Green Shipping Guarantee Programme
Overviews
Loan guarantees provided by EIB to shipowners which purchase greener vessels.
Qualifications of vessels to be eligible
No information on qualifications except that the vessel has to be European flagged.
Financial incentives
Favourable loans on terms and conditions as a result of the EIB’s AAA rating.
Track records
Guarantee agreement between EIB and Société Générale (EUR 150 mn) and between EIB and ABN AMRO (EUR 150 mn)
Finland Investment aid to buyers; Notably SOx; Investment aid
Overviews
Ministry of Transport and Communications established an investment aid scheme aiming; to encourage shipowners to make environmentally friendly investments; to speed up commercial use of environmentally friendly technology; and to simplify the adaptation to new emission requirements. The scheme gives aid to shipowners to purchase vessels which is qualified
Qualifications of vessels to be eligible
The aid is applicable only for vessels under the Finnish flag. The aid is applicable only for the vessels which …(no info on the qualification of “greenness”)
Verifications
Ministry of Transport and Communications verify the qualifications of the vessel.
Financial incentives
Maximum aid intensities from 10% to 60% depending on; the size of the company and new build or retrofit investment (TBC). Maximum amount of the aid is EUR 30 million per vessel. Individual aid exceeding EUR 7.5 (2013) / 15 (2014) million shall be notified to the Commission.
Track records
New builds, EUR 30 million (scheme of Nov 2010)
Analysis of selected measures promoting the construction and operation of greener ships
62
M/S Viking Grace (delivery 2013), EUR 28 million (SA.33382) for Dual-fuel diesel engines that use LNG as main fuel
M/S Meri (2012), EUR 2 million for special purpose vessel able to use 100% bio-oil •Retrofitting operations EUR 22.5 million
New builds EUR 7.5 million
Finland Investment aid for LNG terminal; Notably SOx; Investment aid for LNG infrastructure
Overviews
The aim is to create a network of LNG terminals to enable large-scale use of LNG in maritime transportation;
Verifications
Ministry of Employment and the Economy verify the qualifications of the vessel.
Financial incentives
Budget: EUR 123 million
Max aid intensity 40 %
Track records
EUR 92.9 million was granted for 4 projects in 2014
Norway; Regulation; GHG, NOx, SOx; Environmental requirements in ferry tenders
Norway; Scrap and build subsidy; GHG, NOx, SOx; Recycling scheme
Denmark; R&D support; GHG, NOx, SOx; Blue INNOship
Overviews
Funding is provided by the public fund Innovation Fund Denmark. In order to gain access to the funding it is required that you are having a collaboration project and engage with academia.
Qualifications of recipients to be eligible
Engagement with academia.
Financial incentives
Grant intensity; up to 50% of eligible costs
Track records
2015 50.0 million DKK
Analysis of selected measures promoting the construction and operation of greener ships
63
Japan; R&D support; GHG; Grant for research and development of more fuel-efficient ships
Overviews
This grant, started from 2009, is provided to shipbuilding and ship machinery companies which carry out research and development of high level technologies for the reduction of CO2 emissions from the international shipping sector.
Qualifications of recipients to be eligible
The measure supports research and development of green technologies which are expected to meet the following three requirements;
- reduce international CO2 emission by more than 2%; (?? need to clarify Japan)
- support development of new products; and
- have good prospects for commercialization.
Verifications
Ministry of Land, Infrastructure, transport and tourism verify the R&D project based on the submission of application forms and completion report of the R&D project.
Financial incentives
Grant intensity; up to 33% of eligible costs
Track records
2010 783.17 million JPY 2011 684.87 million JPY 2012 428.31 million JPY 2013 333.19 million JPY 2014 354.61 million JPY 2015 301.19 million JPY
Turkey; Scrap subsidy ; GHG, SOx, Ballast water; Government Scrap Incentive for old Ships
Overviews
Turkish Government took action to convert old coastal vessels to new vessels which will meet the requirement on Green Ship design. It's planned that some amount of money (more than market price) will be delivered as scrap incentive to encourage ship owners to sell their old ships as scrap.
Qualifications of vessels to be eligible
Rate of domestic products for per vessels has to be between 50 and 60%.
Verifications
No info about verification
Analysis of selected measures promoting the construction and operation of greener ships
64
Financial incentives
Credit will be provided to ship owners on market terms and condition by government which has to be up to 70% credit per vessels.
Romania; Technology-based standards; GHG, NOx, SOx, Ballast waters; environmentally friendly solutions, including energy efficiency measures
Overview
Romanian Government has issued the Law no. 346 / 2016. This law is regulating the sulphur content of the marine fuels. So, the Art. 7, paragraph 3 is quoting “the use of marine fuels with a sulphur content exceeding 0.5% of the mass of marine fuels shall be prohibited on board ships sailing or operating in the internal maritime waters, the territorial seas and the exclusive economic zone of Romania from 1 January 2020”. Some policies relevant to environmentally friendly solutions, including energy efficiency measures, LNG hybrid solutions and zero emission solutions, such as electrical operation are expected to be implemented via Blue growth projects in shipbuilding, maritime projects, such as technology development, maritime safety, inland water and marine projects, including port operations, energy efficiency in ships and new control systems. Romania implements support measures for research and development in the form of grant (competitive grant) with periodical calls for general technical purpose, including maritime & shipbuilding areas.

Analysis of selected measures promoting the construction and operation of greener ships
65
NOTES
1 CO2 emission = 3.114 (t-CO2/t-Fuel)* Cfuture (t-Fuel)
2 This conversion factor is also used for the EEDI calculation as it is instructed in 2014 Guidelines on the method of calculation of the attained energy efficiency design index for new ships (IMO, 2014).
3 Cfuture (t-Fuel) = Cunit (t-Fuel/gt) * GT (gt) * Rimprove (%)
4 The data in Transparency market research (2014) take the bunker volumes of bulkers and general cargo vessels as a whole. The part of the bunkering that can be related to the bulkers is determined by the ratio of the total dwt of the bulk fleet over the dwt of the general cargo fleet. This data is taken from Unctad (2015).
5 The data in Transparency market research (2014) take the bunker volumes of bulkers and general cargo vessels as a whole. The part of the bunkering that can be related to the bulkers is determined by the ratio of the total dwt of the bulk fleet over the dwt of the general cargo fleet. This data is taken from UNCTAD (2015).
6 The data in Transparency market research (2014) take the bunker volumes of bulkers and general cargo vessels as a whole. The part of the bunkering that can be related to the bulkers is determined by the ratio of the total dwt of the bulk fleet over the dwt of the general cargo fleet. This data is taken from Unctad (2015).
7 ,
1
( 10.000 ) 0.025 250nME
AE ME ME ii
P MCR kW MCR
;
,1
( 10.000 ) 0.05nME
AE ME ME ii
P MCR kW MCR
8 PTO is a power take off.
9 The Cf value for LFO (light fuel oil) is 1.17% lower than the one of HFO. Because HFO is still the most used fuel for operation in non-emission controlled areas, the total impact of excluding LFO as a fuel source (mainly for auxiliary engines or in (S)ECA-zone operations) will be much smaller than 1%. The effect of using LFO instead of HFO is, however, large with respect to sulphur emissions.
10 Innovation technology factor is an item which is incorporated into the formula calculating attained EEDI value of a vessel expressed by × in equation (3) described in the section 2.4.
11 Cad is a constant for a given hull and gives the approximate relationships between the needed propulsion powers P, ship speed Vdesign speed and displacement.
12 Lightweight of a vessel is the weight of the vessel itself, excluding cargo and bunkers. Only the supplies needed to operate the vessel, such as weight of the day tank, are included.
Analysis of selected measures promoting the construction and operation of greener ships
66
13 1/Cad can be interpreted as:
2/3
1 . .1 r
ad total
C S S M
C
by applying
1 . .vesselb
total
R V S MP
and 2vessel rR C S V in which Rvessel = vessel resistance, S =
wetted surface of the hull, S.M. = the service margin of the main engine(s) (25%), ηtotal = total propulsion efficiency of the complete propulsion train of the vessel and Cr is the resistance coefficient of the vessel.
14 SECA countries are countries facing emission control area (Belgium, Canada, Denmark, Estonia, Finland, France, Germany, Latvia, Lithuania, Netherlands, Norway, Sweden, United Kingdom United States) and Non-SECAs countries are others.
15 ECA-owned vessels are vessels owned by ship owners with nationality of which countries facing emission control area (Belgium, Canada, Denmark, Estonia, Finland, France, Germany, Latvia, Lithuania, Netherlands, Norway, Sweden, United Kingdom United States)
16 ECA-flagged vessels are vessels with flag of countries facing emission control area (i.e. Belgium, Canada, Denmark, Estonia, Finland, France, Germany, Latvia, Lithuania, Netherlands, Norway, Sweden, United Kingdom United States)
17 NECA countries are countries facing NOx emission control area (Canada and United States) and Non-NECAs countries are others.
18 The Sulphur Directive entered into force 2015. At the start of 2015, the sulphur limit for marine fuels was cut to 0.1 per cent in SOx emission control areas in the Baltic Sea, the North Sea and North America's sea areas.
19 Note by Turkey: The information in this document with reference to “Cyprus” relates to the southern part of the Island.
There is no single authority representing both Turkish and Greek Cypriot people on the Island. Turkey recognises the Turkish Republic of Northern Cyprus (TRNC). Until a lasting and equitable solution is found within the context of the United Nations, Turkey shall preserve its position concerning the “Cyprus issue”.
Note by all the European Union Member States of the OECD and the European Union: The Republic of Cyprus is recognised by all members of the United Nations with the exception of
Turkey. The information in this document relates to the area under the effective control of the Government of the Republic of Cyprus.
20 The analysis excludes all vessels which already have a BWMS installed (~4 600) as well as ships which are domestically trading (~34 000), because they are operating in the same water and therefore do not require a BWMS. The remaining ~43 500 vessels fall under the regulation and for those the analysis is based on a comparison of the vessels' net present value and the scrap value. Furthermore, the analysis is based on a fleet of around 82 000 vessels: According to Clarkson World Fleet Register, the merchant fleet in 2017 amounts to ~94 500 vessels with a total of ~831 million cgt. However, we use only those vessels of the merchant fleet which are in service (- 5 000 vessels) and not all of those vessels have cgt reported, we therefore exclude those vessels (- around 1 500 vessels). Furthermore, a closer look reveals that around 4 600 vessels are older than 50 years (up to 140 years) and are not in continuous service. In addition, we exclude around 1 000 observations for which we could not derive any ship value. We exclude those vessels therefore from the data. We end up with a fleet of ~82 000 vessels which represents a clean sample of the merchant fleet.
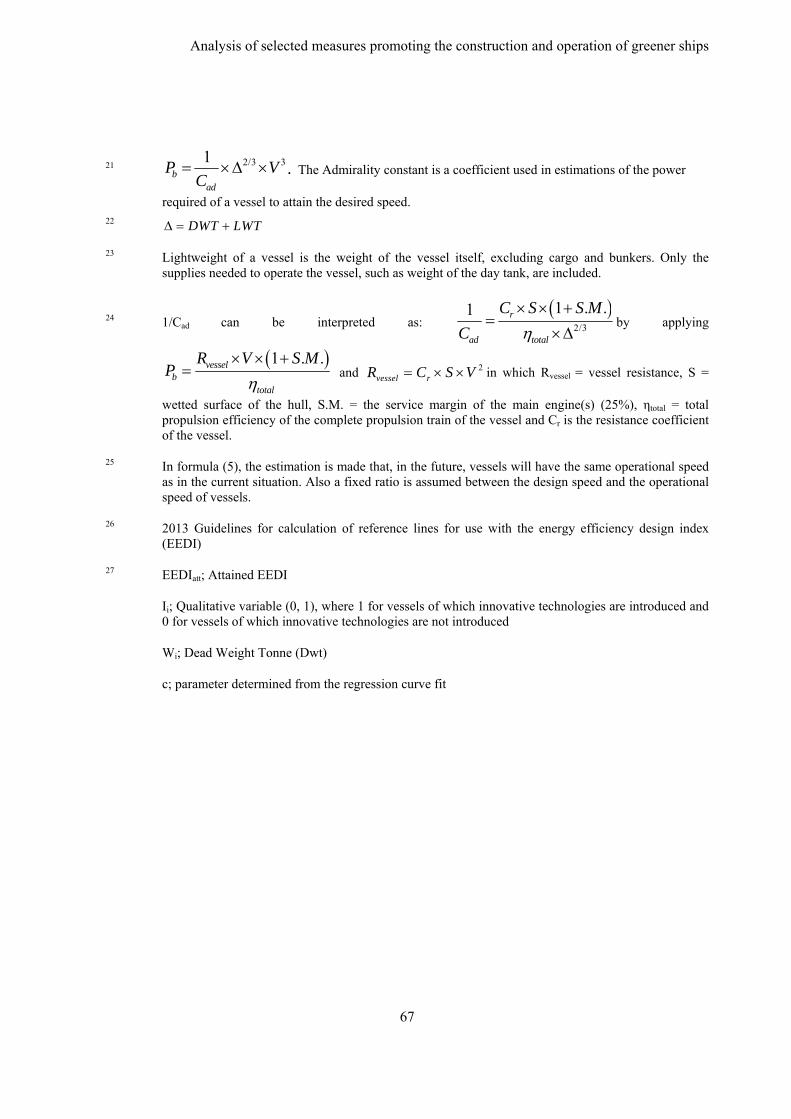
Analysis of selected measures promoting the construction and operation of greener ships
67
21 2/3 31b
ad
P VC
. The Admirality constant is a coefficient used in estimations of the power
required of a vessel to attain the desired speed. 22 DWT LWT
23 Lightweight of a vessel is the weight of the vessel itself, excluding cargo and bunkers. Only the supplies needed to operate the vessel, such as weight of the day tank, are included.
24 1/Cad can be interpreted as:
2/3
1 . .1 r
ad total
C S S M
C
by applying
1 . .vesselb
total
R V S MP
and 2vessel rR C S V in which Rvessel = vessel resistance, S =
wetted surface of the hull, S.M. = the service margin of the main engine(s) (25%), ηtotal = total propulsion efficiency of the complete propulsion train of the vessel and Cr is the resistance coefficient of the vessel.
25 In formula (5), the estimation is made that, in the future, vessels will have the same operational speed as in the current situation. Also a fixed ratio is assumed between the design speed and the operational speed of vessels.
26 2013 Guidelines for calculation of reference lines for use with the energy efficiency design index (EEDI)
27 EEDIatt; Attained EEDI
Ii; Qualitative variable (0, 1), where 1 for vessels of which innovative technologies are introduced and 0 for vessels of which innovative technologies are not introduced
Wi; Dead Weight Tonne (Dwt)
c; parameter determined from the regression curve fit