Embed Size (px)
Citation preview

https://openaccess.leidenuniv.nl
License: Article 25fa pilot End User Agreement
This publication is distributed under the terms of Article 25fa of the Dutch Copyright Act (Auteurswet) with explicit consent by the author. Dutch law entitles the maker of a short scientific work funded either wholly or partially by Dutch public funds to make that work publicly available for no consideration following a reasonable period of time after the work was first published, provided that clear reference is made to the source of the first publication of the work.
This publication is distributed under The Association of Universities in the Netherlands (VSNU) ‘Article 25fa implementation’ pilot project. In this pilot research outputs of researchers employed by Dutch Universities that comply with the legal requirements of Article 25fa of the Dutch Copyright Act are distributed online and free of cost or other barriers in institutional repositories. Research outputs are distributed six months after their first online publication in the original published version and with proper attribution to the source of the original publication.
You are permitted to download and use the publication for personal purposes. All rights remain with the author(s) and/or copyrights owner(s) of this work. Any use of the publication other than authorised under this licence or copyright law is prohibited.
If you believe that digital publication of certain material infringes any of your rights or (privacy) interests, please let the Library know, stating your reasons. In case of a legitimate complaint, the Library will make the material inaccessible and/or remove it from the website. Please contact the Library through email: [email protected]
Article details Musters C.J.M. & Bodegom P.M. van (2018), Analysis of species attributes to determine dominant environmental drivers, illustrated by species decline in the Netherlands since the 1950s, Biological Conservation 219: 68-77. Doi: 10.1016/j.biocon.2018.01.002
Contents lists available at ScienceDirect
Biological Conservation
journal homepage: www.elsevier.com/locate/biocon
Analysis of species attributes to determine dominant environmental drivers,illustrated by species decline in the Netherlands since the 1950s
C.J.M. Musters⁎, Peter M. van BodegomInstitute of Environmental Sciences, Leiden University, P.O. Box 9518, 2300 RA Leiden, The Netherlands
A R T I C L E I N F O
Keywords:Agricultural intensificationBiodiversityClimate changeFragmentationDecision treesReforestation
A B S T R A C T
The relative impact of climate change and land use change on biodiversity loss is still under discussion. Toalleviate drawbacks related to the use of observed species distributions, we introduce a novel approach to se-parate the effects of climate change and land use change, the latter split into fragmentation, agricultural in-tensification and reforestation.
This approach, coined the Attribute Importance Analysis (AIA), uses the ability of species attributes to explainpopulation declines. Through the a priori association between attributes and individual drivers, the relativeimportance of the drivers in causing the species decline can be assessed. We tested this approach on the po-pulation decline of vertebrate, insect, vascular plant, and fungi species in the Netherlands since the 1950s.
Fragmentation was clearly the strongest driver of species decline for vertebrates and plants, and this may alsobe true for insects. For fungi, climate change seems the only driver. We found a weak signal of the importance ofagricultural intensification for the decline of vertebrates only. We ascribe this unexpected low importance ofagricultural intensification to our partitioning of agricultural effects into fragmentation and intensification.
Our generic approach can offer valuable quantitative information on the relative importance of drivers thatchange local community composition without the need for spatial explicit information. Without data on tem-poral trends in drivers, including local climate and land use change, accurate information on species decline,species attribute values and association of attributes with drivers can give insights into the causes of speciesdecline, which, in turn, can be used to adapt nature management accordingly.
1. Introduction
In the Millennium Ecosystem Assessment (2005), land use change isregarded as the most important driver, in the sense that the observedbiodiversity loss is considered as mainly the result of habitat loss. Cli-mate change is the driver that, together with pollution, is expected tohave a large impact on biodiversity in the near future (MEA, 2005).However, the relative importance of climate change versus land usechanges as the main drivers of biodiversity change is presently underdiscussion, while crucial for developing general conservation strategiesand implementation plans (Fox et al., 2014; Bradshaw et al., 2015;Urban, 2015; Fraixedas et al., 2015; Elmhagen et al., 2015a; Lehstenet al., 2015). Feeding this discussion with traditional empirical data isdifficult, because one needs long term data on biodiversity change in anarea that is large enough to include a gradient of climate change as wellas a similar gradient of land use change in which the correlation be-tween climate change and land use change is not so strong that thestatistical separation of the two impacts is impossible. Although such
data are available for certain plant and animal groups for specific areas,such as British birds (Bradshaw et al., 2015) and moths (Fox et al.,2014) or birds in Finland (Luoto et al., 2007; Fraixedas et al., 2015),finding accurate information for clarifying the relative importance ofdrivers across different high-level taxonomic groups is extremely diffi-cult at present.
We propose an alternative, trait-based approach for analyzing thedecline of species, which does not have such data requirements and thatcan be applied to directly compare different taxonomic groups. Such anapproach is possible because ecological traits are supposed to reflect theecological strategies of species in relation to and in interaction withenvironmental drivers (Violle et al., 2007; Webb et al., 2010; Murrayet al., 2011; Angert et al., 2011; Mouillot et al., 2013: van Bodegomet al., 2014). We assume that a change in a local environmental driverresults in the selection in the community sensu Vellend (2016): somespecies will become less abundant and others will thrive, depending ontheir trait values. Recently, traits were used to show selection by landuse change, climate change, and change in nitrogen deposition,
https://doi.org/10.1016/j.biocon.2018.01.002Received 28 June 2017; Received in revised form 15 December 2017; Accepted 2 January 2018
⁎ Corresponding author.E-mail address: [email protected] (C.J.M. Musters).
Biological Conservation 219 (2018) 68–77
Available online 11 January 20180006-3207/ © 2018 Elsevier Ltd. All rights reserved.
T
respectively (Bregman et al., 2017; Siepielski et al., 2017; Bowler et al.,2017; van Strien et al., 2017; Pöyry et al., 2017). In other words, whena specific driver changes the environment, only those species that havea particular combination of trait values will decline. If this is true, wecan, in principle, use the trait values of declining species to study whichenvironmental drivers are responsible for the decline.
To implement this concept, we developed an approach based ondecision trees that we call the Attribute Importance Analysis (AIA). Weuse the word ‘attribute’ instead of ‘trait’ in line with the literature ondecision trees. AIA is a strict a priori approach in the sense that we firsthypothesize which attributes should have a high predictive power fordecline, given a particular driver, and then use the actual predictivepower of the attributes to test this.
Here, we provide a proof of principle and use AIA by applying it toassess the relative effect of four environmental drivers on species de-cline since the 1950s as reported in the Dutch red lists (Kalkman et al.,2010; Wamelink et al., 2013; CBS, PBL, and Wageningen UR, 2014).The first driver is climate change. The other three are different aspectsof land use change: i) fragmentation, which reflects isolation of naturalareas; ii) agricultural intensification, which reflects the change in landuse intensity in cultivated areas; and iii) reforestation, which reflectsthe resent increase of wooded area in the Netherlands both in cultivatedand natural areas. We separately analyzed four widely different speciesgroups - vertebrates, insects, plants and fungi - for which we have datasets of many species and their attributes.
2. Materials and methods
2.1. Species and decline
In the Netherlands, Red lists are available for vertebrates, for insectsbelonging to Plecoptera, Orthoptera, Ephemeroptera, Odonata,Lepidoptera, Trichoptera, and Apidae, for plants belonging to the vas-cular plants, bryophytes and lichens, and for a large number of fungiwith visible fruiting bodies (mushrooms) (Supplementary material,Appendix A). These can be regarded as representative for above-groundterrestrial and freshwater macro-species within the Dutch territory,while small species, marine species and soil species are under-represented (Noordijk et al., 2010; Musters et al., 2013).
To obtain a balanced representation of the high level taxa withineach of our species groups, we randomly selected a similar number ofspecies per taxon. From taxa with only a few species, e.g., reptiles, weselected all species (for details see Musters et al., 2013). In total, weselected 175 vertebrate species (out of a total of 297 species), 371 insectspecies (out of 724 species), 303 plants (out of 2513 species) and 249fungi (out of 2405 species) from the Red lists.
Red lists evaluate the threat state of a species based on both itsrarity and observed decline. The background documentation of the Redlists assesses the decline of the species based on real observations only.The categories used to indicate the trend (‘stable or inclining’, ‘notdeclining’, ‘moderately declining’, etc.) are standardized and equal forall species groups. We defined decline as a binary variable indicatingwhether or not the species range or abundance has been declining in the
Netherlands since the 1950s (categories ‘moderately declining’,‘strongly declining’, ‘very strongly declining’ and ‘maximally declining/extinct’; de Iongh and Bal, 2007; Musters et al., 2013). Declining speciesoccur in any of the Red list categories, from least concerned to criticallyendangered. Of our selected vertebrates, 44% are in our definitiondeclining, as are 52% of the insects, 29% of the plants and 46% of thefungi.
2.2. Attribute Importance Analysis
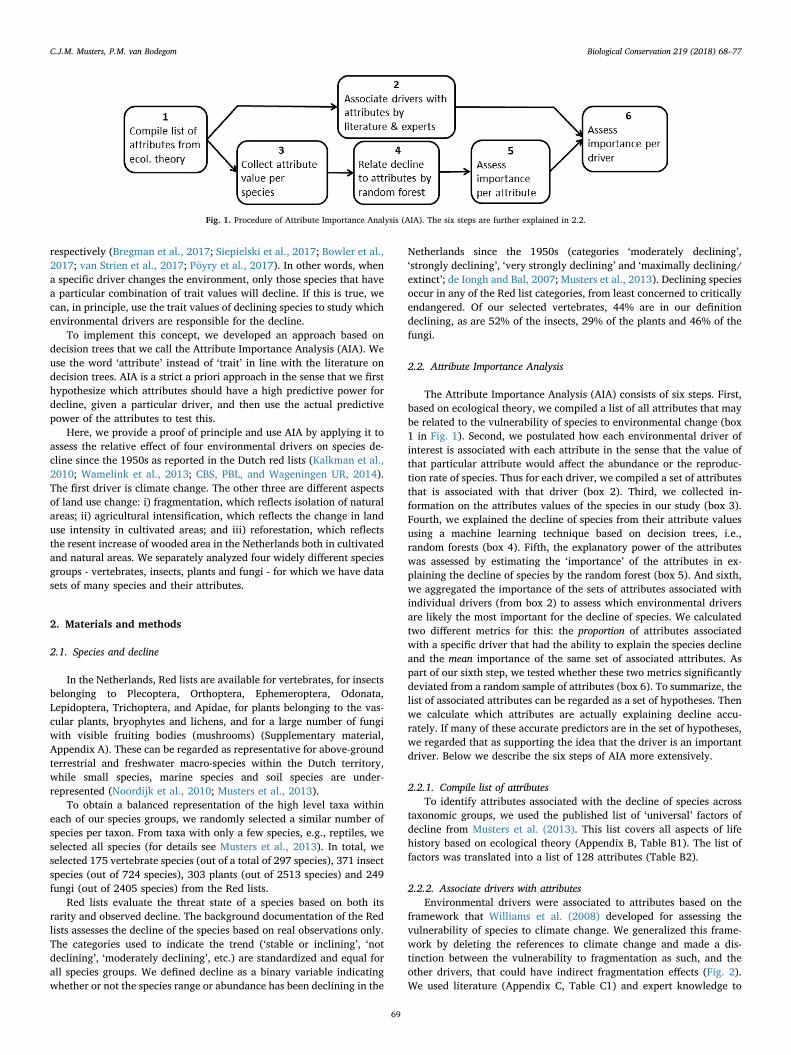
The Attribute Importance Analysis (AIA) consists of six steps. First,based on ecological theory, we compiled a list of all attributes that maybe related to the vulnerability of species to environmental change (box1 in Fig. 1). Second, we postulated how each environmental driver ofinterest is associated with each attribute in the sense that the value ofthat particular attribute would affect the abundance or the reproduc-tion rate of species. Thus for each driver, we compiled a set of attributesthat is associated with that driver (box 2). Third, we collected in-formation on the attributes values of the species in our study (box 3).Fourth, we explained the decline of species from their attribute valuesusing a machine learning technique based on decision trees, i.e.,random forests (box 4). Fifth, the explanatory power of the attributeswas assessed by estimating the ‘importance’ of the attributes in ex-plaining the decline of species by the random forest (box 5). And sixth,we aggregated the importance of the sets of attributes associated withindividual drivers (from box 2) to assess which environmental driversare likely the most important for the decline of species. We calculatedtwo different metrics for this: the proportion of attributes associatedwith a specific driver that had the ability to explain the species declineand the mean importance of the same set of associated attributes. Aspart of our sixth step, we tested whether these two metrics significantlydeviated from a random sample of attributes (box 6). To summarize, thelist of associated attributes can be regarded as a set of hypotheses. Thenwe calculate which attributes are actually explaining decline accu-rately. If many of these accurate predictors are in the set of hypotheses,we regarded that as supporting the idea that the driver is an importantdriver. Below we describe the six steps of AIA more extensively.
2.2.1. Compile list of attributesTo identify attributes associated with the decline of species across
taxonomic groups, we used the published list of ‘universal’ factors ofdecline from Musters et al. (2013). This list covers all aspects of lifehistory based on ecological theory (Appendix B, Table B1). The list offactors was translated into a list of 128 attributes (Table B2).
2.2.2. Associate drivers with attributesEnvironmental drivers were associated to attributes based on the
framework that Williams et al. (2008) developed for assessing thevulnerability of species to climate change. We generalized this frame-work by deleting the references to climate change and made a dis-tinction between the vulnerability to fragmentation as such, and theother drivers, that could have indirect fragmentation effects (Fig. 2).We used literature (Appendix C, Table C1) and expert knowledge to
Fig. 1. Procedure of Attribute Importance Analysis (AIA). The six steps are further explained in 2.2.
C.J.M. Musters, P.M. van Bodegom Biological Conservation 219 (2018) 68–77
69
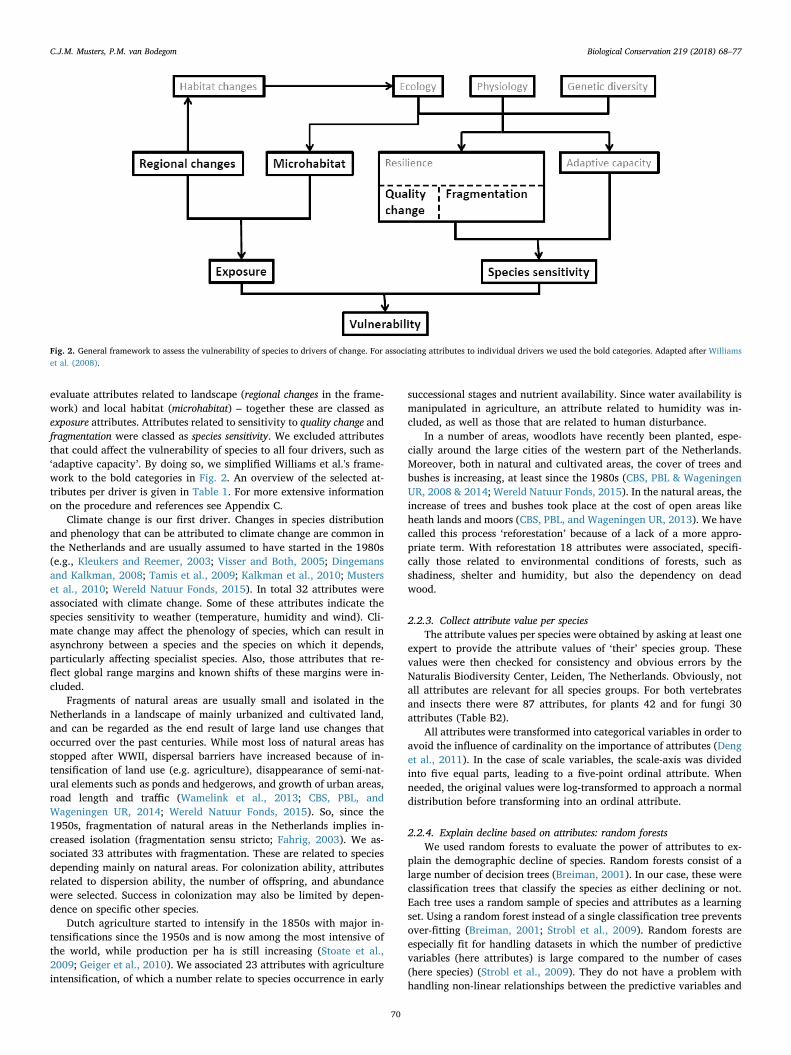
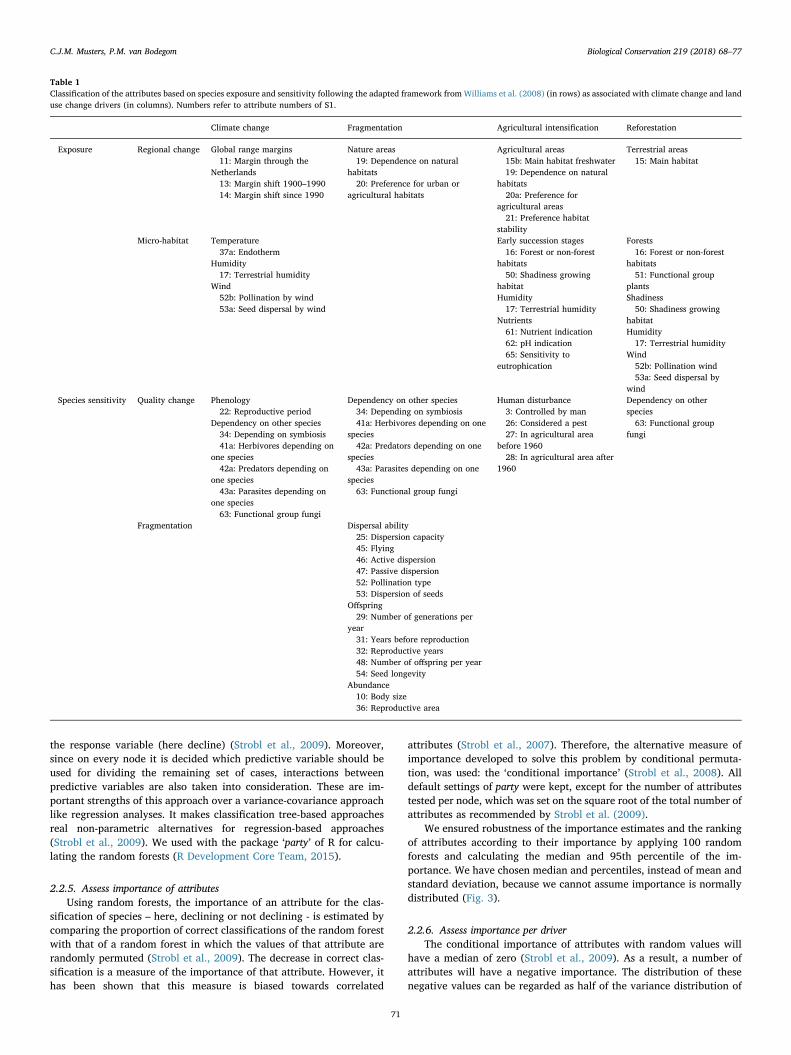
evaluate attributes related to landscape (regional changes in the frame-work) and local habitat (microhabitat) – together these are classed asexposure attributes. Attributes related to sensitivity to quality change andfragmentation were classed as species sensitivity. We excluded attributesthat could affect the vulnerability of species to all four drivers, such as‘adaptive capacity’. By doing so, we simplified Williams et al.'s frame-work to the bold categories in Fig. 2. An overview of the selected at-tributes per driver is given in Table 1. For more extensive informationon the procedure and references see Appendix C.
Climate change is our first driver. Changes in species distributionand phenology that can be attributed to climate change are common inthe Netherlands and are usually assumed to have started in the 1980s(e.g., Kleukers and Reemer, 2003; Visser and Both, 2005; Dingemansand Kalkman, 2008; Tamis et al., 2009; Kalkman et al., 2010; Musterset al., 2010; Wereld Natuur Fonds, 2015). In total 32 attributes wereassociated with climate change. Some of these attributes indicate thespecies sensitivity to weather (temperature, humidity and wind). Cli-mate change may affect the phenology of species, which can result inasynchrony between a species and the species on which it depends,particularly affecting specialist species. Also, those attributes that re-flect global range margins and known shifts of these margins were in-cluded.
Fragments of natural areas are usually small and isolated in theNetherlands in a landscape of mainly urbanized and cultivated land,and can be regarded as the end result of large land use changes thatoccurred over the past centuries. While most loss of natural areas hasstopped after WWII, dispersal barriers have increased because of in-tensification of land use (e.g. agriculture), disappearance of semi-nat-ural elements such as ponds and hedgerows, and growth of urban areas,road length and traffic (Wamelink et al., 2013; CBS, PBL, andWageningen UR, 2014; Wereld Natuur Fonds, 2015). So, since the1950s, fragmentation of natural areas in the Netherlands implies in-creased isolation (fragmentation sensu stricto; Fahrig, 2003). We as-sociated 33 attributes with fragmentation. These are related to speciesdepending mainly on natural areas. For colonization ability, attributesrelated to dispersion ability, the number of offspring, and abundancewere selected. Success in colonization may also be limited by depen-dence on specific other species.
Dutch agriculture started to intensify in the 1850s with major in-tensifications since the 1950s and is now among the most intensive ofthe world, while production per ha is still increasing (Stoate et al.,2009; Geiger et al., 2010). We associated 23 attributes with agricultureintensification, of which a number relate to species occurrence in early
successional stages and nutrient availability. Since water availability ismanipulated in agriculture, an attribute related to humidity was in-cluded, as well as those that are related to human disturbance.
In a number of areas, woodlots have recently been planted, espe-cially around the large cities of the western part of the Netherlands.Moreover, both in natural and cultivated areas, the cover of trees andbushes is increasing, at least since the 1980s (CBS, PBL & WageningenUR, 2008 & 2014; Wereld Natuur Fonds, 2015). In the natural areas, theincrease of trees and bushes took place at the cost of open areas likeheath lands and moors (CBS, PBL, and Wageningen UR, 2013). We havecalled this process ‘reforestation’ because of a lack of a more appro-priate term. With reforestation 18 attributes were associated, specifi-cally those related to environmental conditions of forests, such asshadiness, shelter and humidity, but also the dependency on deadwood.
2.2.3. Collect attribute value per speciesThe attribute values per species were obtained by asking at least one
expert to provide the attribute values of ‘their’ species group. Thesevalues were then checked for consistency and obvious errors by theNaturalis Biodiversity Center, Leiden, The Netherlands. Obviously, notall attributes are relevant for all species groups. For both vertebratesand insects there were 87 attributes, for plants 42 and for fungi 30attributes (Table B2).
All attributes were transformed into categorical variables in order toavoid the influence of cardinality on the importance of attributes (Denget al., 2011). In the case of scale variables, the scale-axis was dividedinto five equal parts, leading to a five-point ordinal attribute. Whenneeded, the original values were log-transformed to approach a normaldistribution before transforming into an ordinal attribute.
2.2.4. Explain decline based on attributes: random forestsWe used random forests to evaluate the power of attributes to ex-
plain the demographic decline of species. Random forests consist of alarge number of decision trees (Breiman, 2001). In our case, these wereclassification trees that classify the species as either declining or not.Each tree uses a random sample of species and attributes as a learningset. Using a random forest instead of a single classification tree preventsover-fitting (Breiman, 2001; Strobl et al., 2009). Random forests areespecially fit for handling datasets in which the number of predictivevariables (here attributes) is large compared to the number of cases(here species) (Strobl et al., 2009). They do not have a problem withhandling non-linear relationships between the predictive variables and
Fig. 2. General framework to assess the vulnerability of species to drivers of change. For associating attributes to individual drivers we used the bold categories. Adapted after Williamset al. (2008).
C.J.M. Musters, P.M. van Bodegom Biological Conservation 219 (2018) 68–77
70
the response variable (here decline) (Strobl et al., 2009). Moreover,since on every node it is decided which predictive variable should beused for dividing the remaining set of cases, interactions betweenpredictive variables are also taken into consideration. These are im-portant strengths of this approach over a variance-covariance approachlike regression analyses. It makes classification tree-based approachesreal non-parametric alternatives for regression-based approaches(Strobl et al., 2009). We used with the package ‘party’ of R for calcu-lating the random forests (R Development Core Team, 2015).
2.2.5. Assess importance of attributesUsing random forests, the importance of an attribute for the clas-
sification of species – here, declining or not declining - is estimated bycomparing the proportion of correct classifications of the random forestwith that of a random forest in which the values of that attribute arerandomly permuted (Strobl et al., 2009). The decrease in correct clas-sification is a measure of the importance of that attribute. However, ithas been shown that this measure is biased towards correlated
attributes (Strobl et al., 2007). Therefore, the alternative measure ofimportance developed to solve this problem by conditional permuta-tion, was used: the ‘conditional importance’ (Strobl et al., 2008). Alldefault settings of party were kept, except for the number of attributestested per node, which was set on the square root of the total number ofattributes as recommended by Strobl et al. (2009).
We ensured robustness of the importance estimates and the rankingof attributes according to their importance by applying 100 randomforests and calculating the median and 95th percentile of the im-portance. We have chosen median and percentiles, instead of mean andstandard deviation, because we cannot assume importance is normallydistributed (Fig. 3).
2.2.6. Assess importance per driverThe conditional importance of attributes with random values will
have a median of zero (Strobl et al., 2009). As a result, a number ofattributes will have a negative importance. The distribution of thesenegative values can be regarded as half of the variance distribution of
Table 1Classification of the attributes based on species exposure and sensitivity following the adapted framework fromWilliams et al. (2008) (in rows) as associated with climate change and landuse change drivers (in columns). Numbers refer to attribute numbers of S1.
Climate change Fragmentation Agricultural intensification Reforestation
Exposure Regional change Global range margins11: Margin through the
Netherlands13: Margin shift 1900–199014: Margin shift since 1990
Nature areas19: Dependence on natural
habitats20: Preference for urban or
agricultural habitats
Agricultural areas15b: Main habitat freshwater19: Dependence on natural
habitats20a: Preference for
agricultural areas21: Preference habitat
stability
Terrestrial areas15: Main habitat
Micro-habitat Temperature37a: Endotherm
Humidity17: Terrestrial humidity
Wind52b: Pollination by wind53a: Seed dispersal by wind
Early succession stages16: Forest or non-forest
habitats50: Shadiness growing
habitatHumidity17: Terrestrial humidity
Nutrients61: Nutrient indication62: pH indication65: Sensitivity to
eutrophication
Forests16: Forest or non-forest
habitats51: Functional group
plantsShadiness50: Shadiness growing
habitatHumidity17: Terrestrial humidity
Wind52b: Pollination wind53a: Seed dispersal by
windSpecies sensitivity Quality change Phenology
22: Reproductive periodDependency on other species
34: Depending on symbiosis41a: Herbivores depending on
one species42a: Predators depending on
one species43a: Parasites depending on
one species63: Functional group fungi
Dependency on other species34: Depending on symbiosis41a: Herbivores depending on one
species42a: Predators depending on one
species43a: Parasites depending on one
species63: Functional group fungi
Human disturbance3: Controlled by man26: Considered a pest27: In agricultural area
before 196028: In agricultural area after
1960
Dependency on otherspecies63: Functional group
fungi
Fragmentation Dispersal ability25: Dispersion capacity45: Flying46: Active dispersion47: Passive dispersion52: Pollination type53: Dispersion of seeds
Offspring29: Number of generations per
year31: Years before reproduction32: Reproductive years48: Number of offspring per year54: Seed longevity
Abundance10: Body size36: Reproductive area
C.J.M. Musters, P.M. van Bodegom Biological Conservation 219 (2018) 68–77
71
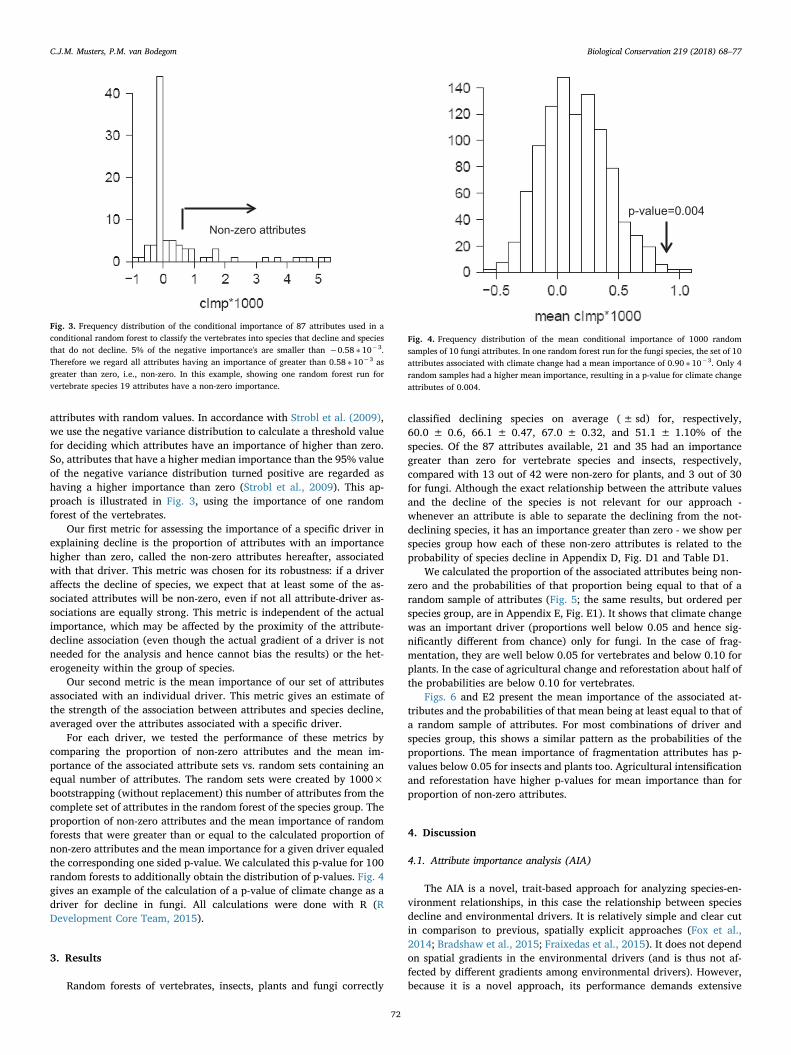
attributes with random values. In accordance with Strobl et al. (2009),we use the negative variance distribution to calculate a threshold valuefor deciding which attributes have an importance of higher than zero.So, attributes that have a higher median importance than the 95% valueof the negative variance distribution turned positive are regarded ashaving a higher importance than zero (Strobl et al., 2009). This ap-proach is illustrated in Fig. 3, using the importance of one randomforest of the vertebrates.
Our first metric for assessing the importance of a specific driver inexplaining decline is the proportion of attributes with an importancehigher than zero, called the non-zero attributes hereafter, associatedwith that driver. This metric was chosen for its robustness: if a driveraffects the decline of species, we expect that at least some of the as-sociated attributes will be non-zero, even if not all attribute-driver as-sociations are equally strong. This metric is independent of the actualimportance, which may be affected by the proximity of the attribute-decline association (even though the actual gradient of a driver is notneeded for the analysis and hence cannot bias the results) or the het-erogeneity within the group of species.
Our second metric is the mean importance of our set of attributesassociated with an individual driver. This metric gives an estimate ofthe strength of the association between attributes and species decline,averaged over the attributes associated with a specific driver.
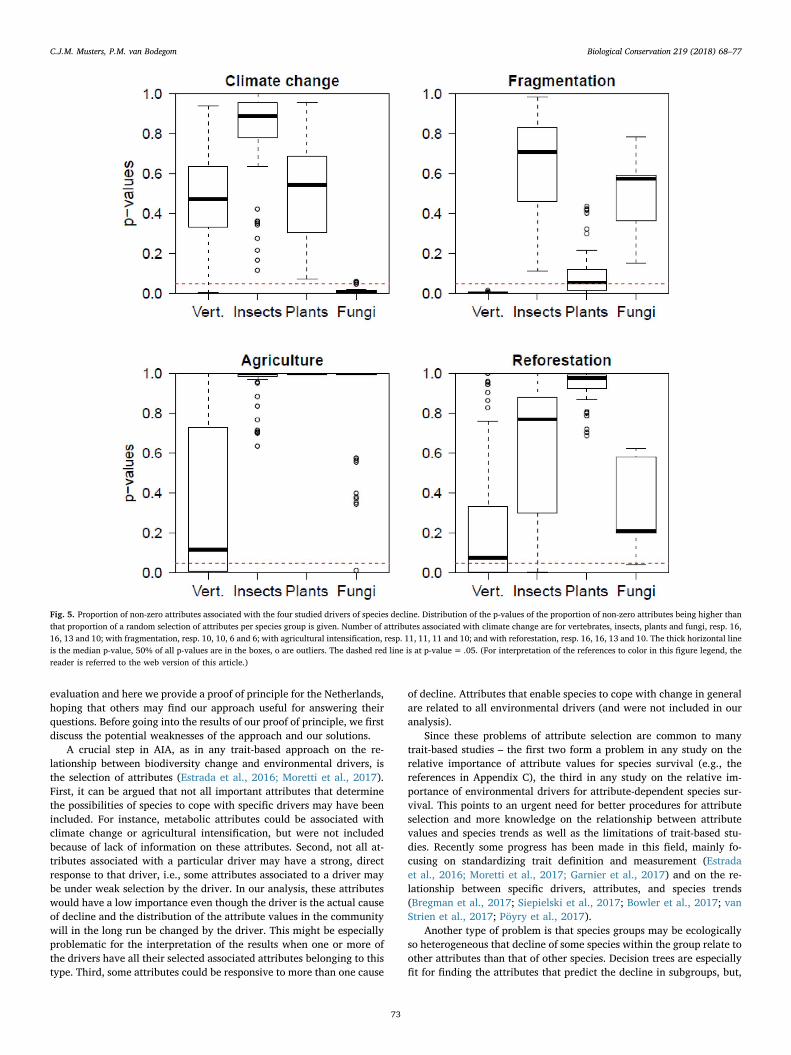
For each driver, we tested the performance of these metrics bycomparing the proportion of non-zero attributes and the mean im-portance of the associated attribute sets vs. random sets containing anequal number of attributes. The random sets were created by 1000×bootstrapping (without replacement) this number of attributes from thecomplete set of attributes in the random forest of the species group. Theproportion of non-zero attributes and the mean importance of randomforests that were greater than or equal to the calculated proportion ofnon-zero attributes and the mean importance for a given driver equaledthe corresponding one sided p-value. We calculated this p-value for 100random forests to additionally obtain the distribution of p-values. Fig. 4gives an example of the calculation of a p-value of climate change as adriver for decline in fungi. All calculations were done with R (RDevelopment Core Team, 2015).
3. Results
Random forests of vertebrates, insects, plants and fungi correctly
classified declining species on average (± sd) for, respectively,60.0 ± 0.6, 66.1 ± 0.47, 67.0 ± 0.32, and 51.1 ± 1.10% of thespecies. Of the 87 attributes available, 21 and 35 had an importancegreater than zero for vertebrate species and insects, respectively,compared with 13 out of 42 were non-zero for plants, and 3 out of 30for fungi. Although the exact relationship between the attribute valuesand the decline of the species is not relevant for our approach -whenever an attribute is able to separate the declining from the not-declining species, it has an importance greater than zero - we show perspecies group how each of these non-zero attributes is related to theprobability of species decline in Appendix D, Fig. D1 and Table D1.
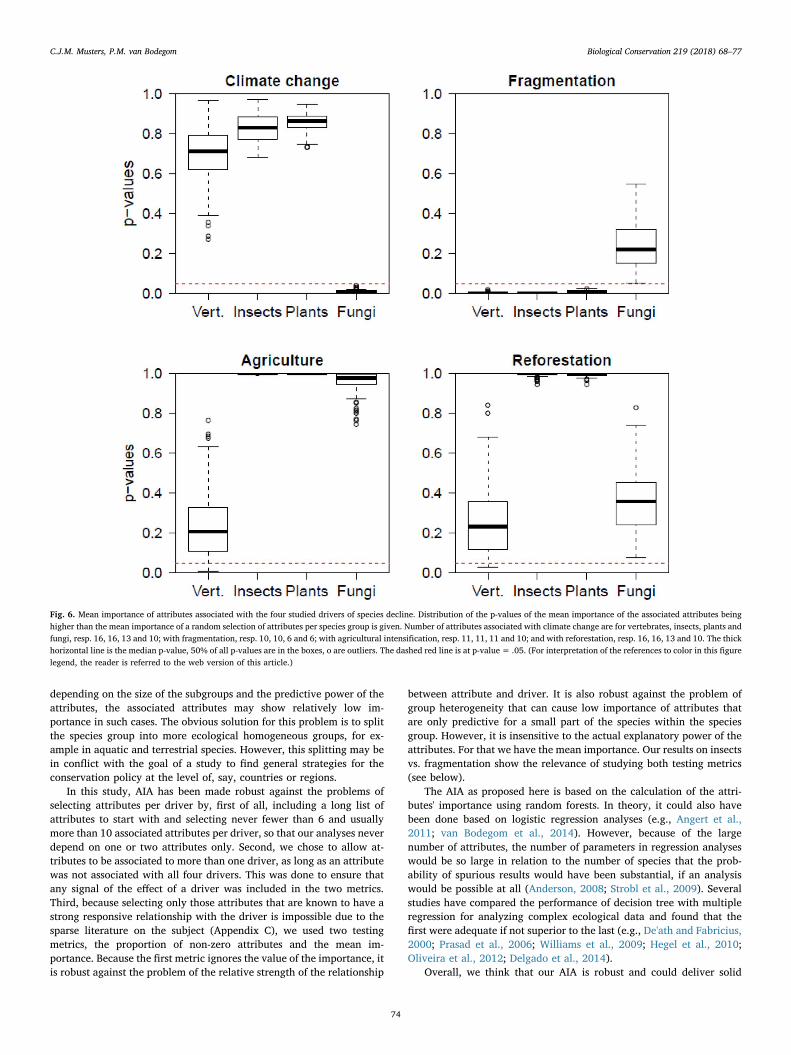
We calculated the proportion of the associated attributes being non-zero and the probabilities of that proportion being equal to that of arandom sample of attributes (Fig. 5; the same results, but ordered perspecies group, are in Appendix E, Fig. E1). It shows that climate changewas an important driver (proportions well below 0.05 and hence sig-nificantly different from chance) only for fungi. In the case of frag-mentation, they are well below 0.05 for vertebrates and below 0.10 forplants. In the case of agricultural change and reforestation about half ofthe probabilities are below 0.10 for vertebrates.
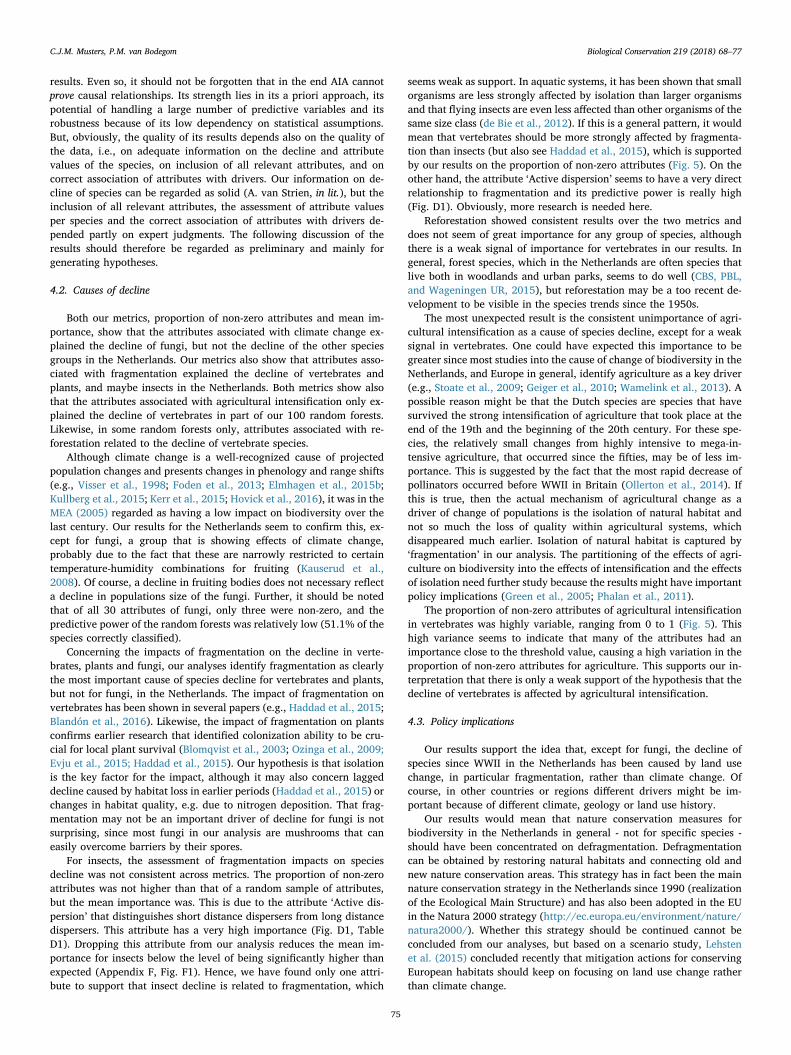
Figs. 6 and E2 present the mean importance of the associated at-tributes and the probabilities of that mean being at least equal to that ofa random sample of attributes. For most combinations of driver andspecies group, this shows a similar pattern as the probabilities of theproportions. The mean importance of fragmentation attributes has p-values below 0.05 for insects and plants too. Agricultural intensificationand reforestation have higher p-values for mean importance than forproportion of non-zero attributes.
4. Discussion
4.1. Attribute importance analysis (AIA)
The AIA is a novel, trait-based approach for analyzing species-en-vironment relationships, in this case the relationship between speciesdecline and environmental drivers. It is relatively simple and clear cutin comparison to previous, spatially explicit approaches (Fox et al.,2014; Bradshaw et al., 2015; Fraixedas et al., 2015). It does not dependon spatial gradients in the environmental drivers (and is thus not af-fected by different gradients among environmental drivers). However,because it is a novel approach, its performance demands extensive
Non-zero attributes
Fig. 3. Frequency distribution of the conditional importance of 87 attributes used in aconditional random forest to classify the vertebrates into species that decline and speciesthat do not decline. 5% of the negative importance's are smaller than −0.58 ∗ 10−3.Therefore we regard all attributes having an importance of greater than 0.58 ∗ 10−3 asgreater than zero, i.e., non-zero. In this example, showing one random forest run forvertebrate species 19 attributes have a non-zero importance.
p-value=0.004
Fig. 4. Frequency distribution of the mean conditional importance of 1000 randomsamples of 10 fungi attributes. In one random forest run for the fungi species, the set of 10attributes associated with climate change had a mean importance of 0.90 ∗ 10−3. Only 4random samples had a higher mean importance, resulting in a p-value for climate changeattributes of 0.004.
C.J.M. Musters, P.M. van Bodegom Biological Conservation 219 (2018) 68–77
72
evaluation and here we provide a proof of principle for the Netherlands,hoping that others may find our approach useful for answering theirquestions. Before going into the results of our proof of principle, we firstdiscuss the potential weaknesses of the approach and our solutions.
A crucial step in AIA, as in any trait-based approach on the re-lationship between biodiversity change and environmental drivers, isthe selection of attributes (Estrada et al., 2016; Moretti et al., 2017).First, it can be argued that not all important attributes that determinethe possibilities of species to cope with specific drivers may have beenincluded. For instance, metabolic attributes could be associated withclimate change or agricultural intensification, but were not includedbecause of lack of information on these attributes. Second, not all at-tributes associated with a particular driver may have a strong, directresponse to that driver, i.e., some attributes associated to a driver maybe under weak selection by the driver. In our analysis, these attributeswould have a low importance even though the driver is the actual causeof decline and the distribution of the attribute values in the communitywill in the long run be changed by the driver. This might be especiallyproblematic for the interpretation of the results when one or more ofthe drivers have all their selected associated attributes belonging to thistype. Third, some attributes could be responsive to more than one cause
of decline. Attributes that enable species to cope with change in generalare related to all environmental drivers (and were not included in ouranalysis).
Since these problems of attribute selection are common to manytrait-based studies – the first two form a problem in any study on therelative importance of attribute values for species survival (e.g., thereferences in Appendix C), the third in any study on the relative im-portance of environmental drivers for attribute-dependent species sur-vival. This points to an urgent need for better procedures for attributeselection and more knowledge on the relationship between attributevalues and species trends as well as the limitations of trait-based stu-dies. Recently some progress has been made in this field, mainly fo-cusing on standardizing trait definition and measurement (Estradaet al., 2016; Moretti et al., 2017; Garnier et al., 2017) and on the re-lationship between specific drivers, attributes, and species trends(Bregman et al., 2017; Siepielski et al., 2017; Bowler et al., 2017; vanStrien et al., 2017; Pöyry et al., 2017).
Another type of problem is that species groups may be ecologicallyso heterogeneous that decline of some species within the group relate toother attributes than that of other species. Decision trees are especiallyfit for finding the attributes that predict the decline in subgroups, but,
Fig. 5. Proportion of non-zero attributes associated with the four studied drivers of species decline. Distribution of the p-values of the proportion of non-zero attributes being higher thanthat proportion of a random selection of attributes per species group is given. Number of attributes associated with climate change are for vertebrates, insects, plants and fungi, resp. 16,16, 13 and 10; with fragmentation, resp. 10, 10, 6 and 6; with agricultural intensification, resp. 11, 11, 11 and 10; and with reforestation, resp. 16, 16, 13 and 10. The thick horizontal lineis the median p-value, 50% of all p-values are in the boxes, o are outliers. The dashed red line is at p-value= .05. (For interpretation of the references to color in this figure legend, thereader is referred to the web version of this article.)
C.J.M. Musters, P.M. van Bodegom Biological Conservation 219 (2018) 68–77
73
depending on the size of the subgroups and the predictive power of theattributes, the associated attributes may show relatively low im-portance in such cases. The obvious solution for this problem is to splitthe species group into more ecological homogeneous groups, for ex-ample in aquatic and terrestrial species. However, this splitting may bein conflict with the goal of a study to find general strategies for theconservation policy at the level of, say, countries or regions.
In this study, AIA has been made robust against the problems ofselecting attributes per driver by, first of all, including a long list ofattributes to start with and selecting never fewer than 6 and usuallymore than 10 associated attributes per driver, so that our analyses neverdepend on one or two attributes only. Second, we chose to allow at-tributes to be associated to more than one driver, as long as an attributewas not associated with all four drivers. This was done to ensure thatany signal of the effect of a driver was included in the two metrics.Third, because selecting only those attributes that are known to have astrong responsive relationship with the driver is impossible due to thesparse literature on the subject (Appendix C), we used two testingmetrics, the proportion of non-zero attributes and the mean im-portance. Because the first metric ignores the value of the importance, itis robust against the problem of the relative strength of the relationship
between attribute and driver. It is also robust against the problem ofgroup heterogeneity that can cause low importance of attributes thatare only predictive for a small part of the species within the speciesgroup. However, it is insensitive to the actual explanatory power of theattributes. For that we have the mean importance. Our results on insectsvs. fragmentation show the relevance of studying both testing metrics(see below).
The AIA as proposed here is based on the calculation of the attri-butes' importance using random forests. In theory, it could also havebeen done based on logistic regression analyses (e.g., Angert et al.,2011; van Bodegom et al., 2014). However, because of the largenumber of attributes, the number of parameters in regression analyseswould be so large in relation to the number of species that the prob-ability of spurious results would have been substantial, if an analysiswould be possible at all (Anderson, 2008; Strobl et al., 2009). Severalstudies have compared the performance of decision tree with multipleregression for analyzing complex ecological data and found that thefirst were adequate if not superior to the last (e.g., De'ath and Fabricius,2000; Prasad et al., 2006; Williams et al., 2009; Hegel et al., 2010;Oliveira et al., 2012; Delgado et al., 2014).
Overall, we think that our AIA is robust and could deliver solid
Fig. 6. Mean importance of attributes associated with the four studied drivers of species decline. Distribution of the p-values of the mean importance of the associated attributes beinghigher than the mean importance of a random selection of attributes per species group is given. Number of attributes associated with climate change are for vertebrates, insects, plants andfungi, resp. 16, 16, 13 and 10; with fragmentation, resp. 10, 10, 6 and 6; with agricultural intensification, resp. 11, 11, 11 and 10; and with reforestation, resp. 16, 16, 13 and 10. The thickhorizontal line is the median p-value, 50% of all p-values are in the boxes, o are outliers. The dashed red line is at p-value= .05. (For interpretation of the references to color in this figurelegend, the reader is referred to the web version of this article.)
C.J.M. Musters, P.M. van Bodegom Biological Conservation 219 (2018) 68–77
74
results. Even so, it should not be forgotten that in the end AIA cannotprove causal relationships. Its strength lies in its a priori approach, itspotential of handling a large number of predictive variables and itsrobustness because of its low dependency on statistical assumptions.But, obviously, the quality of its results depends also on the quality ofthe data, i.e., on adequate information on the decline and attributevalues of the species, on inclusion of all relevant attributes, and oncorrect association of attributes with drivers. Our information on de-cline of species can be regarded as solid (A. van Strien, in lit.), but theinclusion of all relevant attributes, the assessment of attribute valuesper species and the correct association of attributes with drivers de-pended partly on expert judgments. The following discussion of theresults should therefore be regarded as preliminary and mainly forgenerating hypotheses.
4.2. Causes of decline
Both our metrics, proportion of non-zero attributes and mean im-portance, show that the attributes associated with climate change ex-plained the decline of fungi, but not the decline of the other speciesgroups in the Netherlands. Our metrics also show that attributes asso-ciated with fragmentation explained the decline of vertebrates andplants, and maybe insects in the Netherlands. Both metrics show alsothat the attributes associated with agricultural intensification only ex-plained the decline of vertebrates in part of our 100 random forests.Likewise, in some random forests only, attributes associated with re-forestation related to the decline of vertebrate species.
Although climate change is a well-recognized cause of projectedpopulation changes and presents changes in phenology and range shifts(e.g., Visser et al., 1998; Foden et al., 2013; Elmhagen et al., 2015b;Kullberg et al., 2015; Kerr et al., 2015; Hovick et al., 2016), it was in theMEA (2005) regarded as having a low impact on biodiversity over thelast century. Our results for the Netherlands seem to confirm this, ex-cept for fungi, a group that is showing effects of climate change,probably due to the fact that these are narrowly restricted to certaintemperature-humidity combinations for fruiting (Kauserud et al.,2008). Of course, a decline in fruiting bodies does not necessary reflecta decline in populations size of the fungi. Further, it should be notedthat of all 30 attributes of fungi, only three were non-zero, and thepredictive power of the random forests was relatively low (51.1% of thespecies correctly classified).
Concerning the impacts of fragmentation on the decline in verte-brates, plants and fungi, our analyses identify fragmentation as clearlythe most important cause of species decline for vertebrates and plants,but not for fungi, in the Netherlands. The impact of fragmentation onvertebrates has been shown in several papers (e.g., Haddad et al., 2015;Blandón et al., 2016). Likewise, the impact of fragmentation on plantsconfirms earlier research that identified colonization ability to be cru-cial for local plant survival (Blomqvist et al., 2003; Ozinga et al., 2009;Evju et al., 2015; Haddad et al., 2015). Our hypothesis is that isolationis the key factor for the impact, although it may also concern laggeddecline caused by habitat loss in earlier periods (Haddad et al., 2015) orchanges in habitat quality, e.g. due to nitrogen deposition. That frag-mentation may not be an important driver of decline for fungi is notsurprising, since most fungi in our analysis are mushrooms that caneasily overcome barriers by their spores.
For insects, the assessment of fragmentation impacts on speciesdecline was not consistent across metrics. The proportion of non-zeroattributes was not higher than that of a random sample of attributes,but the mean importance was. This is due to the attribute ‘Active dis-persion’ that distinguishes short distance dispersers from long distancedispersers. This attribute has a very high importance (Fig. D1, TableD1). Dropping this attribute from our analysis reduces the mean im-portance for insects below the level of being significantly higher thanexpected (Appendix F, Fig. F1). Hence, we have found only one attri-bute to support that insect decline is related to fragmentation, which
seems weak as support. In aquatic systems, it has been shown that smallorganisms are less strongly affected by isolation than larger organismsand that flying insects are even less affected than other organisms of thesame size class (de Bie et al., 2012). If this is a general pattern, it wouldmean that vertebrates should be more strongly affected by fragmenta-tion than insects (but also see Haddad et al., 2015), which is supportedby our results on the proportion of non-zero attributes (Fig. 5). On theother hand, the attribute ‘Active dispersion’ seems to have a very directrelationship to fragmentation and its predictive power is really high(Fig. D1). Obviously, more research is needed here.
Reforestation showed consistent results over the two metrics anddoes not seem of great importance for any group of species, althoughthere is a weak signal of importance for vertebrates in our results. Ingeneral, forest species, which in the Netherlands are often species thatlive both in woodlands and urban parks, seems to do well (CBS, PBL,and Wageningen UR, 2015), but reforestation may be a too recent de-velopment to be visible in the species trends since the 1950s.
The most unexpected result is the consistent unimportance of agri-cultural intensification as a cause of species decline, except for a weaksignal in vertebrates. One could have expected this importance to begreater since most studies into the cause of change of biodiversity in theNetherlands, and Europe in general, identify agriculture as a key driver(e.g., Stoate et al., 2009; Geiger et al., 2010; Wamelink et al., 2013). Apossible reason might be that the Dutch species are species that havesurvived the strong intensification of agriculture that took place at theend of the 19th and the beginning of the 20th century. For these spe-cies, the relatively small changes from highly intensive to mega-in-tensive agriculture, that occurred since the fifties, may be of less im-portance. This is suggested by the fact that the most rapid decrease ofpollinators occurred before WWII in Britain (Ollerton et al., 2014). Ifthis is true, then the actual mechanism of agricultural change as adriver of change of populations is the isolation of natural habitat andnot so much the loss of quality within agricultural systems, whichdisappeared much earlier. Isolation of natural habitat is captured by‘fragmentation’ in our analysis. The partitioning of the effects of agri-culture on biodiversity into the effects of intensification and the effectsof isolation need further study because the results might have importantpolicy implications (Green et al., 2005; Phalan et al., 2011).
The proportion of non-zero attributes of agricultural intensificationin vertebrates was highly variable, ranging from 0 to 1 (Fig. 5). Thishigh variance seems to indicate that many of the attributes had animportance close to the threshold value, causing a high variation in theproportion of non-zero attributes for agriculture. This supports our in-terpretation that there is only a weak support of the hypothesis that thedecline of vertebrates is affected by agricultural intensification.
4.3. Policy implications
Our results support the idea that, except for fungi, the decline ofspecies since WWII in the Netherlands has been caused by land usechange, in particular fragmentation, rather than climate change. Ofcourse, in other countries or regions different drivers might be im-portant because of different climate, geology or land use history.
Our results would mean that nature conservation measures forbiodiversity in the Netherlands in general - not for specific species -should have been concentrated on defragmentation. Defragmentationcan be obtained by restoring natural habitats and connecting old andnew nature conservation areas. This strategy has in fact been the mainnature conservation strategy in the Netherlands since 1990 (realizationof the Ecological Main Structure) and has also been adopted in the EUin the Natura 2000 strategy (http://ec.europa.eu/environment/nature/natura2000/). Whether this strategy should be continued cannot beconcluded from our analyses, but based on a scenario study, Lehstenet al. (2015) concluded recently that mitigation actions for conservingEuropean habitats should keep on focusing on land use change ratherthan climate change.
C.J.M. Musters, P.M. van Bodegom Biological Conservation 219 (2018) 68–77
75
Along with this focus on nature conservation areas, since 1975 therehas also been a strategy to mitigate agricultural intensification in theform of Agri-Environmental Schemes (AES, in the EU since 1985, Batáryet al., 2015). AES are presently under discussion in the Netherlandsbecause of their disappointing results so far (Kleijn, 2012). Batáry et al.(2015) found that schemes that take out areas from agricultural pro-duction have been more effective than schemes that tried to changeproduction. Our results support the idea that mitigation of land useintensity may not have been a very promising general strategy forbiodiversity conservation in the Netherlands.
Authors' contributions
Both authors conceived the ideas and designed methodology; CMcollected and analyzed the data; he also wrote the manuscript; PvBcontributed critically to drafts and both authors gave final approval forpublication.
Acknowledgement
We would like to thank Arco van Strien, Vincent Kalkman, and threeanonymous reviewers for their critical and fruitful comments on earlierversions of this paper. Ellen Cieraad helped us with the graphs and ourEnglish.
Supplementary data
Supplementary data to this article can be found online at https://doi.org/10.1016/j.biocon.2018.01.002.
References
Anderson, D.R., 2008. Model Based Inference in the Life Sciences. A Primer on Evidence.Springer, New York.
Angert, A.L., Crozier, L.G., Rissler, L.J., Gilman, S.E., Tewksbury, J.J., Chunco, A.J., 2011.Do species' traits predict recent shifts at expanding range edges? Ecol. Lett. 14,677–689.
Batáry, P., Dicks, L.V., Kleijn, D., Sutherland, W.J., 2015. The role of agri-environmentalschemes in conservation and environmental management. Conserv. Biol. 29,1006–1016.
de Bie, T., De Meester, L., Brendonck, L., et al., 2012. Body size and dispersal mode as keytraits determining metacommunity structure of aquatic organisms. Ecol. Lett. 15,740–747.
Blandón, A.C., Perelman, S.B., Ramírez, M., López, A., Javier, O., Robbins, C.S., 2016.Temporal bird community dynamics are strongly affected by landscape fragmenta-tion in a Central American tropical forest region. Biodivers. Conserv. 25, 311–330.
Blomqvist, M.M., Vos, P., Klinkhamer, P.G.L., ter Keurs, W.J., 2003. Declining plantspecies richness of grassland ditch banks - a problem of colonisation or extinction?Biol. Conserv. 109, 391–406.
van Bodegom, P.M., Douma, J.C., Verheijen, L.M., 2014. A fully traits-based approach tomodeling global vegetation distribution. PNAS 111, 13733–13738.
Bowler, D.E., Hof, C., Haase, P., et al., 2017. Cross-realm assessment of climate changeimpacts on species' abundance trends. Nat. Ecol. Evol. 1, 0067.
Bradshaw, C.J.A., Brook, B.W., Delean, S., et al., 2015. Predictors of contraction andexpansion of area of occupancy for British birds. Proc. R. Soc. B 281, 20140744.
Bregman, T.P., Lees, A.C., MacGrego, H.E.A., et al., 2017. Using avian functional traits toassess the impact of land-cover change on ecosystem processes linked to resilience intropical forests. Proc. R. Soc. B 283, 20161289.
Breiman, L., 2001. Random forests. Mach. Learn. 45, 5–32.CBS, PBL, Wageningen UR, 2008. Areaalverandering van duinbiotopen (indicator 1122,
versie 02, 24 april 2008). www.compendiumvoordeleefomgeving.nl (CBS, Den Haag;Planbureau voor de Leefomgeving, Den Haag/Bilthoven en Wageningen UR,Wageningen).
CBS, PBL, Wageningen UR, 2013. Bodemgebruik, 1900–2008 (indicator 1001, versie 07,22 augustus 2013). www.compendiumvoordeleefomgeving.nl (CBS, Den Haag;Planbureau voor de Leefomgeving, Den Haag/Bilthoven en Wageningen UR,Wageningen).
CBS, PBL, Wageningen UR, 2014. Inleiding natuur en milieu (indicator 1091, versie 05,24 januari 2014) & Areaal bostypen 1984–2013 (indicator 1160, versie 07, 23 juli2014). CBS, Den Haag; Planbureau voor de Leefomgeving, Den Haag/Bilthoven enWageningen UR, Wageningen.
CBS, PBL, Wageningen UR, 2015. Flora van naaldbossen, 1999–2014 (indicator 1545,versie 05, 15 december 2015) & Flora van loof- en gemengde bossen, 1999–2014(indicator 1546, versie 05, 11 december 2015) & Trend fauna in bossen, 1990–2014(indicator 1162, versie 13, 29 oktober 2015) & Vogels van oude bossen op hogerezandgronden, 1990–2012 (indicator 1170, versie 12, 8 januari 2014). www.
compendiumvoordeleefomgeving.nl (CBS, Den Haag; Planbureau voor deLeefomgeving, Den Haag/Bilthoven en Wageningen UR, Wageningen).
De'ath, G., Fabricius, K.E., 2000. Classification and regression trees: a powerful yet simpletechnique for ecological data analysis. Ecology 81, 3178–3192.
Delgado, M.F., Cernadas, E., Barro, S., 2014. Do we need hundreds of classifiers to solvereal world classification problems? J. Mach. Learn. Res. 15, 3133–3181.
Deng, H., Runger, G., Tuv, E., 2011. Bias of importance measures for multi-valued at-tributes and solutions. In: Proceedings of the 21st International Conference onArtificial Neural Networks, pp. 1–9.
Dingemans, N.J., Kalkman, V.J., 2008. Changing temperature regimes have advanced thephenology of Odonata in the Netherlands. Ecol. Entomol. http://dx.doi.org/10.1111/j.1365-2311.2007.00982.x.
Elmhagen, B., Eriksson, O., Lindborg, R., 2015a. Implications of climate and land-usechange for landscape processes, biodiversity, ecosystem services, and governance.Ambio 44 (Suppl. 1), S1–S5.
Elmhagen, B., Kindberg, J., Hellström, P., Angerbjörn, A., 2015b. A boreal invasion inresponse to climate change? Range shifts and community effects in the borderlandbetween forest and tundra. Ambio 44 (Suppl. 1), S39–S50.
Estrada, A., Morales-Castilla, I., Caplat, P., Early, R., 2016. Usefulness of species traits inpredicting range shifts. Trends Ecol. Evol. 31, 190–203.
Evju, M., Blumentrath, S., Skarpaas, O., Stabbetorp, O.E., Sverdrup-Thygeson, A., 2015.Plant species occurence in a fragmented grassland landscape: the importance ofspecies traits. Biodivers. Conserv. 24, 547–561.
Fahrig, L., 2003. Effects of habitat fragmentation on biodiversity. Annu. Rev. Ecol. Evol.Syst. 34, 487–515.
Foden, W.B., Butchart, S.H.M., Stuart, S.N., et al., 2013. Identifying the world's mostclimate change vulnerable species: a systematic trait-based assessment of all birds,amphibians and corals. PLoS One 8, e65427.
Fox, R., Oliver, T.H., Harrower, C., Parsons, M.S., Thomas, C.D., Roy, D.B., 2014. Long-term changes to the frequency of occurrence of British moths are consistent withopposing and synergistic effects of climate and land-use changes. J. Appl. Ecol. 51,949–957.
Fraixedas, S., Lehikoinen, A., Lindén, A., 2015. Impact of climate and land use change onwintering bird populations in Finland. J. Avian Biol. 46, 63–72.
Garnier, E., Stahl, U., Laporte, M.-A., 2017. Towards a thesaurus of plant characteristics:an ecological contribution. J. Ecol. 105, 298–309.
Geiger, F., de Snoo, G.R., Berendse, F., et al., 2010. Landscape composition influencesfarm management effects on farmland birds in winter: a pan-European approach.Agric. Ecosyst. Environ. 130, 571–577.
Green, R.E., Cornell, S.J., Scharlemann, J.P., Balmford, A., 2005. Farming and the fate ofwild nature. Science 307, 550–555.
Haddad, N.M., Brudvig, L.A., Clobert, J., et al., 2015. Habitat fragmentation and itslasting impact on Earth's ecosystems. Sci. Adv. 1, e1500052.
Hegel, T.M., Cushman, S.A., Evans, J., Huettmann, F., 2010. Current state of the art forstatistical modelling pf species distributions. In: Cushman, S.A., Huettmann, F. (Eds.),Spacial Complexity, Informatics, and Wildlife Conservation. Springer, Tokyo, pp.273–311.
Hovick, T.J., Allred, B.W., McGranahan, D.A., Palmer, M.W., Elmore, R.D., Fuhlendorf,S.D., 2016. Informing conservation by identifying range shift pattern across breedinghabitats and migration strategies. Biodivers. Conserv. 25, 345–356.
de Iongh, H.H., Bal, D., 2007. Harmonization of Red Lists in Europe: some lessons learnedin the Netherlands when applying the new IUCN Red List Categories and Criteriaversion 3.1. Endanger. Species Res. 3, 53–60.
Kalkman, V.J., van Duuren, L., Gmelig Meyling, A.W., Odé, B., 2010. Veranderingen in deNederlandse biodiversiteit. In: Noordijk, J., Kleukers, R.M.J.C., van Nieuwkerken,E.J., van Loon, A.J. (Eds.), De Nederlandse biodiversiteit. Nederlandse Fauna 10.Nederlands Centrum voor Biodiversiteit Naturalis & European Invertebrate Survey,Leiden, pp. 339–354.
Kauserud, H., Stige, L.C., Vik, J.O., Økland, R.H., Høiland, K., Stenseth, N.C., 2008.Mushroom fruiting and climate change. PNAS 105, 3811–3814.
Kerr, J.T., Pindar, A., Galpern, P., et al., 2015. Climate change impacts on bumblebeesconverge across continents. Science 349, 177–180.
Kleijn, D., 2012. De effectiviteit van Agrarisch Natuurbeheer. Alterra, Wageningen.http://www.rli.nl/sites/default/files/u61/david_kleijn_-_de_effectiviteit_van_agrarisch_natuurbeheer.pdf.
Kleukers, R., Reemer, M., 2003. Verandering in de Nederlandse ongewervelden fauna. DeLevende Natuur. vol. 104. pp. 86–89.
Kullberg, C., Fransson, T., Hedlund, J., Jonzén, N., Langvall, O., Nilsson, J., Bolmgren, K.,2015. Change in spring arrival of migratory birds under an era of climate change,Swedish data from the last 140 years. Ambio 44 (Suppl. 1), S69–S77.
Lehsten, V., Sykes, M.T., Scott, A.V., et al., 2015. Disentangling the effects of land-usechange, climate and CO2 on projected future European habitat types. Glob. Ecol.Biogeogr. 24, 653–663.
Luoto, M., Virkkala, R., Heikkinen, 2007. The role of land cover in bioclimatic modelsdepends on spatial resolution. Glob. Ecol. Biogeogr. 16, 34–42.
MEA, 2005. Millennium Ecosystem Assessment. Ecosystems and Human Well-being:Synthesis. Island Press, Washington, DC.
Moretti, M., Dias, A.T.C., de Bello, F., et al., 2017. Handbook of protocols for standardizedmeasurement of terrestrial invertebrate functional traits. Funct. Ecol. 31, 558–567.
Mouillot, D., Graham, N.A.J., Villéger, S., Norman, W.H., Mason, N.W.H., Bellwood, D.R.,2013. A functional approach reveals community responses to disturbances. TrendsEcol. Evol. 28, 167–177.
Murray, K.A., Rosauer, D., McCallum, H., Skerratt, L.F., 2011. Integrating species traitswith extrinsic threats: closing the gap between predicting and preventing speciesdeclines. Proc. R. Soc. B 278, 1515–1523.
Musters, C.J.M., ter Keurs, W.J., de Snoo, G.R., 2010. Timing of the breeding season of
C.J.M. Musters, P.M. van Bodegom Biological Conservation 219 (2018) 68–77
76
Black-tailed Godwit Limosa limosa and Northern Lapwing Vanellus vanellus in TheNetherlands. Ardea 98, 195–202.
Musters, C.J.M., Kalkman, V., van Strien, A., 2013. Predicting rarity and decline in ani-mals, plants, and mushrooms based on species attributes and indicator groups. Ecol.Evol. 3, 3401–3414.
van Nieuwkerken, E.J., van Loon, A.J., 2010. In: Noordijk, J., Kleukers, R.M.J.C. (Eds.),De Nederlandse biodiversiteit. Nederlandse Fauna 10. Nederlands Centrum voorBiodiversiteit Naturalis & European Invertebrate Survey, Leiden.
Oliveira, S., Oehler, F., San-Miguel-Ayanz, J., Camia, A., Periera, J.M.C., 2012. Modelingspatial patterns of fire occurrence in Mediterranean Europe using multiple regressionand random forest. For. Ecol. Manag. 275, 117–129.
Ollerton, J., Erenler, H., Edwards, M., Crockett, R., 2014. Extinctions of aculeate polli-nators in Britain and the role of large-scale agricultural changes. Science 346,1360–1362.
Ozinga, W.A., Romermann, C., Bekker, R.M., et al., 2009. Dispersal failure contributes toplant losses in NW Europe. Ecol. Lett. 12, 66–74.
Phalan, B., Onial, M., Balmford, A., Green, R.E., 2011. Reconciling food production andbiodiversity conservation: land sharing and land sparing compared. Science 333,1289–1291.
Pöyry, J., Carvalheiro, L.G., Heikkinen, R.K., et al., 2017. The effects of soil eutroficationpropagate to higher trophic levels. Glob. Ecol. Biogeogr. 26, 18–30.
Prasad, A.M., Iverson, L.R., Liaw, A., 2006. Newer classification and regression treetechniques: bagging and random forests for ecological prediction. Ecosystems 9,181–199.
R Development Core Team, 2015. R: A Language and Environment for StatisticalComputing. R Foundation for Dtatistical Computing, Vienna. http://www.R-project.org.
Siepielski, A.M., Morrissey, M.B., Buoro, M., et al., 2017. Precipitation drives globalvariation in natural selection. Science 355, 959–962.
Stoate, C., Báldi, A., Beja, P., et al., 2009. Ecological impacts of early 21st century agri-cultural change in Europe. J. Environ. Manag. 91, 22–46.
van Strien, A.J., Boomsluiter, M., Noordeloos, M.E., et al., 2017. Woodland ectomy-corrizal fungi benetit from large-scale reduction in nitrogen deposition in the
Netherlands. J. Appl. Ecol. http://dx.doi.org/10.1111/1365-2664.12944.Strobl, C., Boulesteix, A.-L., Zeileis, A., Hothorn, T., 2007. Bias in random forest variable
importance measures: illustrations, sources and a solution. BMC Bioinf. 8, 25.Strobl, C., Boulesteix, A.-L., Kneib, T., Augustin, T., Zeileis, A., 2008. Conditional variable
importance for random forests. BMC Bioinf. 9, 307.Strobl, C., Malley, J., Tutz, G., 2009. An introduction to recursive partitioning: rationale,
application, and characteristics of classification and regression trees, bagging, andrandom forests. Psychol. Methods 14, 323–348.
Tamis, W.W.L.M., Duistermaat, L.H., van Moorsel, R.R.C.M.J., 2009. Het verdwijnen en(weer) verschijnen van plantensoorten in Nederland. Gorteria 33, 166–185.
Urban, M.C., 2015. Accelerating extinction risk from climate change. Science 348,571–573.
Vellend, M., 2016. The theory of ecological communities. In: Monographs in PopulationBiology 57. Princeton University Press, Princeton and Oxford.
Violle, C., Navas, M.-L., Vile, D., Kazakou, E., Fortunel, C., Hummel, I., Garnier, E., 2007.Let the concept of trait be functional!. Oikos 116, 882–892.
Visser, M.E., Both, C., 2005. Shifts in phenology due to global climate change: the needfor a yardstick. Proc. R. Soc. B 272, 2561–2569.
Visser, M.E., van Noordwijk, A.J., Tinbergen, J.M., Lessells, C.M., 1998. Warmer springslead to mistimed reproduction in great tits. Proc. R. Soc. Lond. B 265, 1867–1870.
Wamelink, G.W.W., de Knegt, B., Pouwels, R., et al., 2013. Considerable environmentalbottlenecks for species listed in the Habitats and Birds Directives in the Netherlands.Biol. Conserv. 165, 43–53.
Webb, C.T., Hoeting, J.A., Ames, G.M., Pyne, M.I., Poff, N.L., 2010. A structured anddynamic framework to advance traits-based theory and prediction in ecology. Ecol.Lett. 13, 267–283.
Wereld Natuur Fonds, 2015. Living Planet Report. Natuur in Nederland. WNF, Zeist.Williams, S.E., Shoo, L.P., Isaac, J.L., Hoffmann, A.A., Langham, G., 2008. Towards an
integrated framework for assessing the vulnerability of species to climate change.PLoS Biol. 6, 2621–2626.
Williams, J.N., Seo, C., Thorne, J., Nelson, J.K., Erwin, S., O'Brien, J.M., Schwartz, M.W.,2009. Using species distribution models to predict new occurrences of rare plants.Divers. Distrib. 15, 565–576.
C.J.M. Musters, P.M. van Bodegom Biological Conservation 219 (2018) 68–77
77