Embed Size (px)
Citation preview

Analysis of the 2002 Census Data
National Bureau of StatisticsFriday 2nd February 2007

Population Growth and Distribution
Population is an important resource for development.
It is a resource for labour supply for production as well as consumption of various products
Hence the size of a population is one of the important parameters for economic development
Growth of the population increase demands for food, water, energy and other natural resources

Tanzania Population Trends
12.3
17.5
23.1
34.4
0
5
10
15
20
25
30
35
40
1967 1978 1988 2002
Census Years
Popu
latio
n in
Mill
ions

Population Structure of Tanzania
Tanzania Total Percent of Total Population
Percent
0 1 2 3 4 5 6 7 8 90123456789
0-4
10-14
20-24
30-34
40-44
50-54
60-64
70-74
80+
Male Female

Population Structure of Tanzania
A population pyramid shows the total picture of a population by age and sex.
It is a useful way of illustrating the age structure of the population.
Tanzania population pyramid with a broad base indicating high fertility rates and mortality rates and a youthful age structure in Tanzania.
The proportion of population under 15 years was 44 percent

Population Structure of Tanzania
The working group (15-64) accounted for 52 percent
The proportion of population 65+ years was 4 percent

District Variations in terms of Population Growth Rate – 2002 Census
Districts with higher population growth rate:West (Urban West) - Zanzibar 9.2%Bukombe (Shinyanga) 7.4%Simanjiro (Manyara) 7.0%
Districts with lower population growth rateLindi Urban (Lindi) -0.1%Makete (Iringa) 0.2%Morogoro (Morogoro) 0.5%

District Variations in terms of Population Growth Rate – 2002 Census
Districts with lower population growth rate:
Rungwe (Mbeya) 0.9%
Newala (Mtwara 0.9%
The rest of the districts had a population growth rate between 1.0% to 6.9% per annum.

Marital Status
At national level: 2002 Population and Housing Census showed that 56 percent of males aged 15 years and above were currently married; two percent were widowed, one percent were divorced; two percent were separated
For females aged 15 years and above showed that 60 percent were married, 9 percent were widowed, 2 percent were divorced and 5 percent were separated

Marital Status
Analysis of Data by sex has shown that most of the widows/widowers were females.

Marital Status: District Variations
Incidence of WidowhoodDistrict with high number of
Widows/WidowersMakete 10.2%Bukoba Rural 8.0%Njombe 7.0%Dodoma Rural 6.7%

Marital Status: District Variations
The following districts had a lower number of Widows/widowers:Mbeya Urban (Mbeya) 0.9%West (Urban West) 1.9%Central (South Unguja) 2.4%Bukombe (Shinyanga) 2.4%

Survival of Parents
Census data showed that at national level one percent of population aged 0 to 17 years were orphans (both parents dead). Similar results obtained in 2004-05 -TDHS

Survival of Parents: District Variations
Districts with highest number of orphans (aged 10 – 17 years):Makete (Iringa) 4.6%Iringa Urban (Iringa) 3.8%Bukoba Rural (Kagera) 3.6%Kyela (Mbeya) 3.2%Rungwe (Mbeya) 3.2%
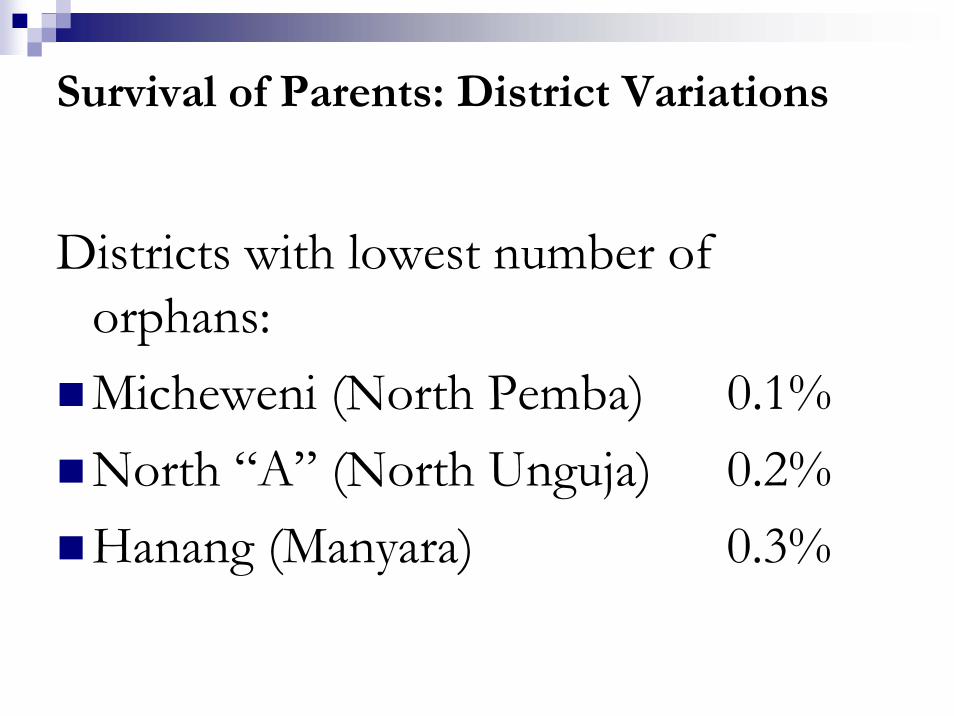
Survival of Parents: District Variations
Districts with lowest number of orphans:Micheweni (North Pemba) 0.1%North “A” (North Unguja) 0.2%Hanang (Manyara) 0.3%

Economic Activities
Main economic occupations were:Agriculture 70%Business operations 10%Elementary occupations more than 9%

Building Materials: Roofing and Wall Materials
The census results portrayed that iron sheets were the most commonly used as roofing materials for their houses, this accounts for 46.3 percent for all private households
Concerning wall materials census results showed that a significant proportion of households in Tanzania (34 percent) lived in the houses with mud and poles walls, followed by sun-dried bricks (33 percent)


Housing Conditions: District Variations
Districts whose household members used iron sheets or tiles for roofing by more than 90%:Nyamagana 98%Moshi Urban 98%Rombo 97%Arusha 97%Kinondoni 97%Mbeya Urban 96%

Housing Conditions: District Variations
Districts whose household members used iron sheets or tiles by less than 15%
Ngorongoro 9%Kishapu 12%Lindi Rural 13%Sumbawanga Rural 13%

Water scarcity is a problem of all ages: Universal access to Safe Water (Tanzania Development Vision 2025 : Goal)

Universal access to Safe Water
This is one of the Tanzania Development Vision 2025 goal
But what we have seen from the previous censuses was that, the proportion of the private households indicated piped water as the main source of drinking water was 34.4 percent slightly increased from 31.6 percent in 1988.

Universal access to Safe Water: District Variations
There were 69 districts whose households had access to safe and clean water by more than 50%. Best five districts were:Arusha (Arusha Region) 99%Urban ( Urban West Region 98%Nyamagana (Mwanza) 97%Mbeya Urban (Mbeya) 96%South Unguja 95%

Universal access to Safe Water: District Variations
Districts whose household members had less than 15% access to safe and clean waterUrambo (Tabora) 5%Igunga (Tabora) 9%Mkuranga (Pwani) 11%Uyui (Tabora) 11%Kishapu (Shinyanga) 13%

Main Source of Energy for Cooking
The 2002 Census data portrayed that firewood is the main source of energy for cooking in Tanzania (accounts for 77.4 percent of all private households, followed by charcoal (16.7 percent)
In the rural areas, 95.6 percent of the private households used fire wood as the main source of energy for cooking,
While in the urban areas the main source of energy for cooking is charcoal accounts for 53 percent of all private households
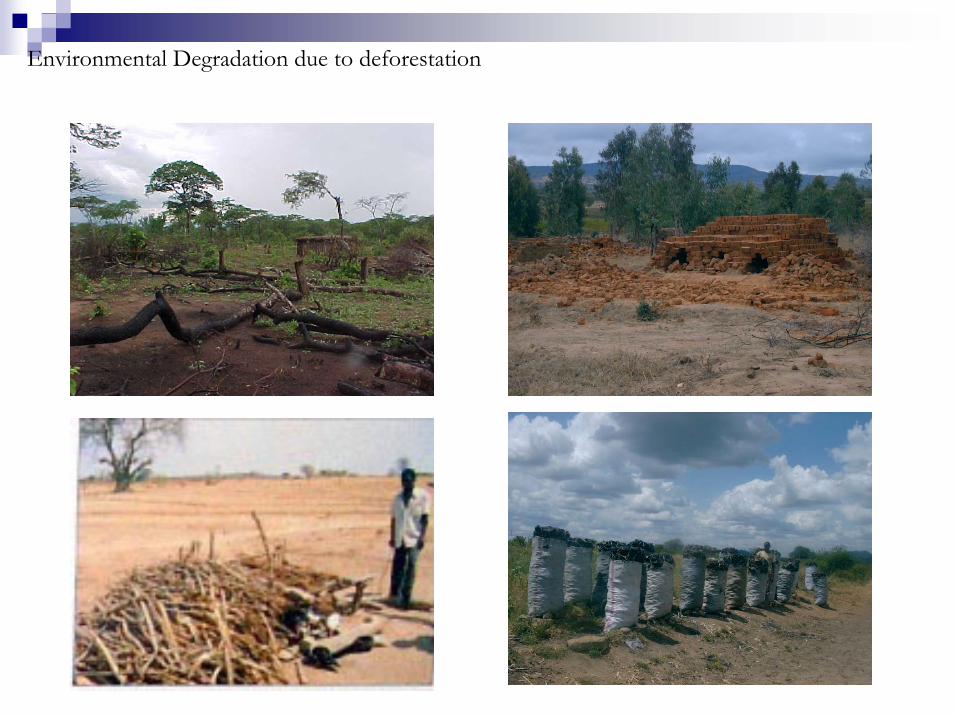
Environmental Degradation due to deforestation

Main Source of Energy for Lighting: District Variations
Districts whose household members used electricity for lighting by more than 50%
Moshi Urban 52%Urban (Urban – West in Zanzibar) 63%

Main Source of Energy for Lighting: District Variations
Five districts whose households used electricity for lighting by between 40% and 50%Ilala 49%Kinondoni 47%Iringa Urban 47%Arusha 41%Temeke 40%

Main Source of Energy for Lighting: District Variations
Some of the 21 districts whose households used electricity for lighting by below 1%.
Mbeya Rural Sumbawanga RuralUyuiBiharamuloKasulu

Toilet Facilities
At National Level: The 2002 Census results showed that; most commonly used toilet facility is traditional pit latrine86 percent of all private households reported to use pit latrine9 percent of all private households reported no toilet facilities in their houses

Toilet Facilities: District Variations
Districts which lacked toilet facilities by more than 50%Kiteto (Manyara) 50%Chake Chake (South Pemba) 52%Ngorongoro (Arusha) 54%North “A” (Unguja North) 58%Wete ( North Pemba) 63%Monduli (Arusha) 67%

Toilet Facilities: District Variations
Districts which lacked toilet facilities by more than 50%
Mkoani (South Pemba) 70%Micheweni (North Pemba) 83%

Fertility
Previous censuses portrayed a slightly decline of fertility in Tanzania from 1967 -2004

Trends in Fertility in Tanzania
6.6 6.96.5 6.3
5.7
0
1
2
3
4
5
6
7
8
1967 1978 1988 2002 2004-05TDHS
Tota
l Fer
tility
Rat
e

Trends in IMR and U5MR Using Census Data
137115
95
50
231
191
153
79
0
50
100
150
200
250
1978 1988 2002 2010
Years
Num
ber
of D
eath
s pe
r 1 ,
000
Live
Bir
ths
IMRU5MR
GOAL
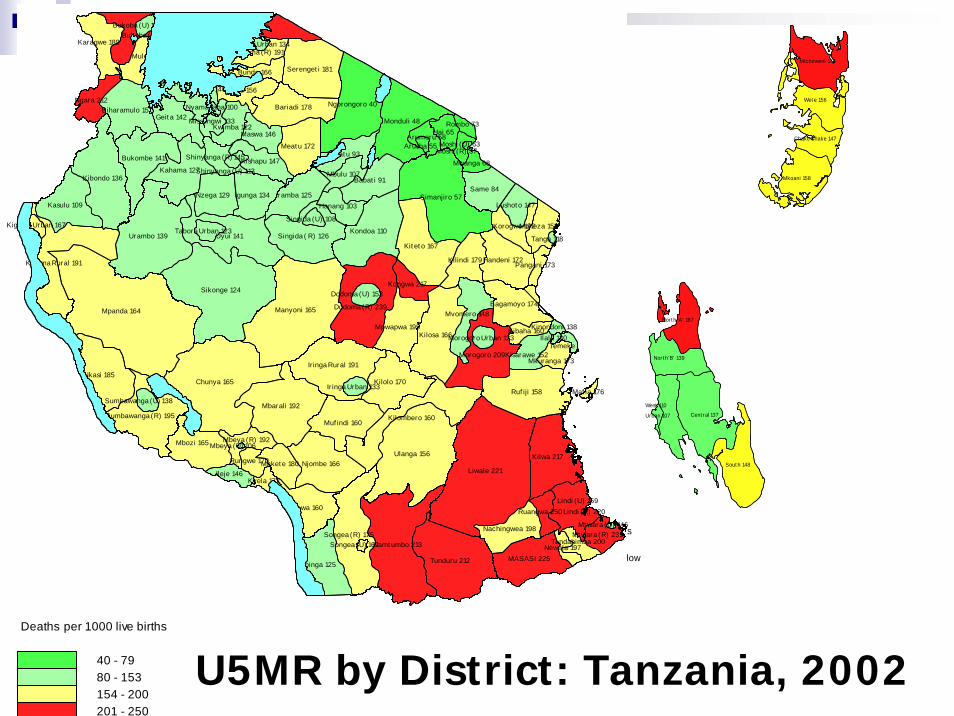
Deaths per 1000 live births
141 and Below142 - 160Above 160
Cent ral 137 Urban 107
West 110
Nort h'B' 139
Nort h 'A' 187
Sout h 148
Wet e 156
Mkoani 158
Chake Chake 147
Micheweni 176
U5MR by District: Tanzania, 2002Deaths per 1000 live births
40 - 7980 - 153154 - 200201 - 250
Songea (R) 175
Singida ( R) 126
Ileje 146
Mpanda 164
Sumbawanga (R) 195
Nkasi 185
Mbozi 165
Sumbawanga (U) 138
Chunya 165
Urambo 139
Kigoma Rural 191
Sikonge 124
Uyui 141
Muf indi 160
Maket e 180
Kyela 172
Mbeya (R) 192
Rungwe 170
Mbinga 125
Ludewa 160
Njombe 166
Manyoni 165
Mbeya (U) 106
Mbarali 192
Dodoma (R) 239
Ir inga Rural 191
Kondoa 110 Tabora Urban 123
Kahama 127
Kasulu 109
Kigoma Urban 167
Kibondo 136
Bukombe 141
Biharamulo 153 Ngara 212
Karagwe 189 Bukoba (R) 204
Sengerema 127
Geit a 142
Muleba 182
Bukoba (U) 113
Kwimba 122 Maswa 146
Nzega 129 Igunga 134
Shinyanga (R) 145 Kishapu 147 Shinyanga (U) 113
Iramba 125
Singida (U) 108
Hanang 103
Meat u 172 Karat u 93
Mbulu 107
Ngorongoro 40
Magu 156 Ilemela 140
Missungwi 133
Nyamagana 100
Ukerewe 176
Tarime 207
Serenget i 181
Bariadi 178
Musoma (R) 191
Bunda 166
Musoma Urban 134
Temeke
Mvomero 148
Ulanga 156
Namt umbo 213 Songea (U) 162
Tunduru 212
Liwale 221
Mpwapwa 195
Kilombero 160
Ir inga Urban 133 Kilolo 170
Morogoro 209
Kilosa 166
Kilwa 217
Ruangwa 250
MASASI 225
Nachingwea 198 Mt wara (R) 231
Newala 197 Tandahimba 200
Lindi (R) 220
Mt wara (U) 146
Lindi (U) 159
Kisarawe 152
Ruf iji 158 Maf ia 176
Mkuranga 173
Bagamoyo 174
Simanjiro 57
Kit et o 167
Dodoma (U) 153 Kongwa 217
Morogoro Urban 123
Kilindi 179 Handeni 172
Arusha 55
Babat i 91
Monduli 48
Arumeru 58
Moshi (R) 57
Mwanga 68
Same 84
Hai 65
Moshi (U) 63
Rombo 73
Kinondoni 138 Kibaha 160
Pangani 173
Ilala 130
Tanga 118
Korogwe 192 Muheza 158
Lushot o 147

Lessons Learnt from the 2002 Population and Housing Census
The failings today are the learning’s tomorrow
The success of today are the lessons of tomorrow

Use Census Data for Quality and evidenced Planning

End
Thank you