Embed Size (px)
Citation preview
ANALYSIS OF THE BEIJING GREENBELTS PLAN
USING GEOGRAPHIC INFORMATION SYSTEMS (GIS)
By
HUIFENG PENG
A thesis submitted in partial fulfillment of the requirements for the degree of
MASTER OF SCIENCE IN LANDSCAPE ARCHITECTURE
WASHINGTON STATE UNIVERSITY Department of Horticulture and Landscape Architecture
AUGUST 2005

To the Faculty of Washington State University:
The members of the Committee appointed to examine the thesis of HUIFENG PENG find it satisfactory and recommend that it be accepted.
___________________________________ Chair ___________________________________ ___________________________________
ii
ACKNOWLEDGEMENTS
I would like to express my deepest gratitude to many people who supported, advised and
contributed to the writing of this thesis. Dr. Kerry Brooks who supervised my research, and who
provided both his enthusiastic support and guidance to me from the first step of this research.
Without his help this research would not have been the best of what I can produce. My greatest
thanks go as well to the members of the thesis committee Dr. Bob Scarfo and Dr. Sean Michael,
who helped me with their guidance and comments.
I dedicate my thesis to my parents, to my husband, who provided the right balance of
support both financial and emotional. I extend heartfelt thanks to all my friends: you have been
kind, supportive, and generous. Among these friends a special thank you goes to Richard Chmura,
Larissa Hebel and Karl Scheller for their editing and advice on this research.
Thanks are also due to: Shigao Wang, and Prof. Zhang at Beijing Architecture and
Engineering University, for all of their information and assistance pertaining to Beijing Greenbelts
Plan; Doug Pineo, with Washington Dept. of Ecology, for the information and knowledge
pertaining to the case study of London Plan. I owe special thanks to Baicao Du from China
Architecture Design And Research Institute for his encouragement and help.
Finally, I owe a debt of gratitude to my husband, Fanbin Kong for his continuous help and
encouragement.
iii
ANALYSIS OF THE BEIJING GREENBELTS PLAN
USING GEOGRAPHIC INFORMATION SYSTEMS (GIS)
ABSTRACT
By Huifeng Peng, MS Washington State University
August 2005 Chair: Kerry Brooks
Greenbelts are an important part of urban ecosystems and provide significant ecosystem
benefits. Beijing, the capital city of China, started the Beijing Greenbelts Plan to achieve a
sustainable ecosystem and ameliorate environmental problems including sandstorms and air
pollution. As well, Beijing has the prospect of developing Beijing into an Eco-City for the Olympic
Game in 2008.
This thesis explores the Beijing Greenbelts Plan and examines ecological services created
by the Beijing Greenbelts Plan from qualitative and quantitative perspectives. Landscape
ecological principles provide conceptual and qualitative explanations for examining the greenbelts.
Two software packages, ARCGIS and CITYgreen, are applied to analyze the ecology aspects with
quantitative evaluation of the greenbelt plan. Three scenarios are developed, analyzed, and
compared to provide environmental statistics reports and approaches on improving the Beijing
greenbelt plan.
The thesis concludes that the Beijing Greenbelts Plan almost reaches its goal on the
percentage of tree canopy. As well, modifications are suggested to improve the Beijing Greenbelts
Plan and increase the ecological benefits. The recommendations on the sustainable development of
Beijing may be considered by planners and land-use decision makers.
iv
TABLE OF CONTENTS
ACKNOWLEDGEMENTS .............................................................................................................III
ABSTRACT .......................................................................................................................................IV
LIST OF FIGURES .................................................................................................................VIII
LIST OF TABLES.......................................................................................................................IX
LIST OF MAPS .............................................................................................................................X
CHAPTER ONE: INTRODUCTION ...................................................................................1
Background of Study.............................................................................................................................1
Purpose of Study ...................................................................................................................................2
Outline of Thesis ...................................................................................................................................3
CHAPTER TWO: LITERATURE REVIEW ...................................................................5
Definition and Benefits .........................................................................................................................5 Definition...........................................................................................................................................5 Benefits ..............................................................................................................................................8
Landscape Ecological Principles and Design Scheme.......................................................................12 Landscape Ecology Principles .......................................................................................................13 Design Schemes...............................................................................................................................16 Theoretical Alternatives of Distributions of Green Space at City Level .......................................18
GIS and CITYgreen Application ........................................................................................................21 GIS ...................................................................................................................................................21 CITYgreen .......................................................................................................................................22
Case Studies.........................................................................................................................................26 Properly Designed Greenbelts in Canada .....................................................................................27 Green Space System for New York City .........................................................................................29 Overview..........................................................................................................................................31
Summary..............................................................................................................................................32
CHAPTER THREE: STUDY AREA ..................................................................................33
v
The General Background of Beijing...................................................................................................33 Topography and Geology ...............................................................................................................33 Population .......................................................................................................................................35 Vegetation and Wildlife...................................................................................................................36 Climate ............................................................................................................................................36 History and Features ......................................................................................................................37
Eco-Environmental Problems .............................................................................................................38 Air Pollution ....................................................................................................................................39 Sandstorms and Desertification......................................................................................................40
“Three-North” Protective Forest System and Development of Beijing Greenbelts .........................44 “Three-North” Protective Forest System.......................................................................................44 Development of Beijing Greenbelts................................................................................................45
The Beijing Greenbelts Plan ...............................................................................................................47 The First Greenbelt .........................................................................................................................48 The Second Greenbelt .....................................................................................................................49 The Third Greenbelt........................................................................................................................52
Issues....................................................................................................................................................53
Summary..............................................................................................................................................55
CHAPTER FOUR: METHODOLOGY.............................................................................56
Modeling Scenario and Analysis ........................................................................................................56 The First Scenario: THE EXISTING GREEN SPACE OF BEIJING IN 1999 .............................56 The Second Scenario: THE BEIJING GREENBELTS PLAN .......................................................57 The Third Scenario: IMPROVED GREENBELTS.........................................................................57
Data Preparation..................................................................................................................................58
CITYgreen Processing ........................................................................................................................58
Overview of Procedures......................................................................................................................59
CHAPTER FIVE: ANALYSIS ..............................................................................................61
Data Preparation..................................................................................................................................61 Data Collection ...............................................................................................................................61 Image Processing and Unsupervised Reclassification ..................................................................63 Land Categories ..............................................................................................................................65 Digitizing Beijing Greenbelts Plan.................................................................................................67 Digitizing Features of Landcover...................................................................................................67
The First Scenario: The Existing Green Space of Beijing in 1999....................................................69
vi
Data Processing ..............................................................................................................................69 Result: The CITYgreen Report........................................................................................................73
The Second Scenario: The Beijing Greenbelts Plan ..........................................................................75 Data Processing ..............................................................................................................................75 Result: The CITYgreen Report........................................................................................................77
The Third Scenario: Improved Greenbelts .........................................................................................82 Data Processing ..............................................................................................................................82 Result: The CITYgreen Report......................................................................................................104
Discussion..........................................................................................................................................104 Scenarios Comparison ..................................................................................................................104 Other Considerations....................................................................................................................111
Summary............................................................................................................................................114
CHAPTER SIX: CONCLUSION AND RECOMMENDATIONS .......................117
Conclusion.........................................................................................................................................117
Recommendations .............................................................................................................................118
Limitations and Future Research ......................................................................................................119 Limitation on Data Collection ......................................................................................................119 Influence of Periphery Region ......................................................................................................119 Limitation on CITYgreen Software...............................................................................................120
BIBLIOGRAPHY......................................................................................................................121
vii
List of Figures
Figure 1: Edge width .............................................................................................................................................. 14 Figure 2: Network Connectivity And Circuitry ................................................................................................. 14 Figure 3: Corridors.................................................................................................................................................. 15 Figure 4: Transition................................................................................................................................................ 16 Figure 5: Theoretical Alternatives For The Distribution Of Open Space .................................................... 19 Figure 6: Skyways And Roof Gardens................................................................................................................. 21 Figure 7: Location Of Beijing............................................................................................................................... 34 Figure 8: The Topography Of Beijing Region .................................................................................................. 34 Figure 9: Beijing’s Population 1970-2005............................................................................................................ 35 Figure 10: Beijing Ringroads Map....................................................................................................................... 38 Figure 11: The Map of Chinese Desert ............................................................................................................... 41 Figure 12: Aerial Image Of Sandstorm ............................................................................................................... 43 Figure 13: Effects Of Beijing Sandstorm On Pollutants.................................................................................. 43 Figure 14: Three-North Forest ............................................................................................................................. 45 Figure 15: 1958 Master Plan................................................................................................................................... 46 Figure 16. The First Greenbelt Plan .................................................................................................................... 48 Figure 17: The Second Greenbelt Plan ............................................................................................................... 49 Figure 18: Plan For Green Wedge And Parks .................................................................................................... 51 Figure 19: The Third Greenbelt Map ................................................................................................................. 52 Figure 20: Beijing Comprehensive Master Plan ............................................................................................... 54 Figure 21: Analysis Flow Chart............................................................................................................................. 60 Figure 22: Analysis Report For Beijing In 1999................................................................................................. 74 Figure 23: Analysis Report For The Beijing Greenbelts Plan ........................................................................ 81 Figure 24: Analysis Report For Sample 1: Site Study........................................................................................ 93 Figure 25: Analysis Report For Sample 2: Improved Canopy ........................................................................ 94 Figure 26: Analysis Report For Improved Greenbelts Scenario...................................................................103 Figure 27: Comparison Of Total Tree Canopy................................................................................................107 Figure 28: Comparison Of Total Tree Canopy Percentage ..........................................................................107 Figure 29: Comparison Of Total Air Pollution Removal...............................................................................108 Figure 30: Comparison Of Total Dollar Value ................................................................................................108 Figure 31: Comparison Of Total Particulate Matter.......................................................................................109 Figure 32: Comparison Of Total Carbon Storage ...........................................................................................109 Figure 33: Comparison Of Total Carbon Sequestration................................................................................110
viii
List of Tables
Table 1: Landcover Categories In CITYgreen .................................................................................................. 23 Table 2: Trees And Air Quality In American Cities ......................................................................................... 24 Table 3: Air Pollutant Concentrations In National Grade II Standard And Actual Values In 1999 ........ 40 Table 4: Categories In Beijing Landcover Reclassify Map............................................................................. 65 Table 5: Categories In Beijing Landcover Reclassify Map And CITYgreen............................................... 71 Table 6: Comparison Between Existing And Improved Models ................................................................... 91 Table 7: Table Of CITYgreen Indicators For Each Parcel Of The Urban Area......................................... 98 Table 8: Table Of Environmental Indicators For The Improved Greenbelts Scenario...........................104 Table 9: Comparisons Of Three Scenarios On Landcover And The Environmental Indicators ..........106
ix
List of Maps
Map 1: Beijing Region Landcover Map 1999 .............................................................................................62 Map 2: Beijing Region Infrared Image In 1999.........................................................................................64 Map 3: Beijing Region Landcover Map in 1999 ........................................................................................66 Map 4: The Beijing Greenbelts Plan ...........................................................................................................68 Map 5: Beijing Landcover In 1999 ...............................................................................................................70 Map 6: Beijing Landcover 1999 In CITYgreen..........................................................................................72 Map 7: Beijing Landcover And Greenbelts Plan.......................................................................................76 Map 8: The Beijing Greenbelts Plan In CITYgreen ................................................................................80 Map 9: Wider Edges On Sides Facing The Wind Direction ..................................................................83 Map 10: Leaving The South Open ...............................................................................................................85 Map 11: Beijing Improved Greenbelts At City Level ................................................................................87 Map 12: Green Network Connectivity.........................................................................................................89 Map 13: Beijing Improved Greenbelts Plan At Neighborhood Level ...................................................92 Map 14: Beijing Neighborhood Study: Building Fishnet........................................................................96 Map 15: Beijing Neighborhood Study: Urban Core .................................................................................97 Map 16: Beijing Improved Greenbelts Plan ............................................................................................ 101 Map 17: Beijing Improved Greenbelts Plan In CITYgreen ................................................................. 102
x
Chapter One: Introduction
In the twentieth century, many countries faced a growing urban pollution problem as
urbanization and industrialization flourished. Urbanization has been a major historical trend for the
past 150 years. It influences the urban environment in which people live, the air city dwellers
breathe, the water they drink and bathe in, the indoor and outdoor noise they hear, and the
geological and climate conditions they experience (Moore et al., 2003). Air pollution and noise
exposure in the world increased steadily as urbanization progressed. Highways and streets pollute
water through runoff and destroy green space. Urban buildings contribute to urban heat by
increasing the temperature in cities (Lawrence, 1999).
A sufficient provision of green space such as greenbelts within urban areas is regarded as
an effective way to mitigate environmental deterioration, which is associated with rapid
urbanization. Urban green space improves the urban environment by purifying air and water,
regulating micro-climate, reducing noise, protecting soil and water, and maintaining biodiversity.
Green space contributes to public health, increases the quality of life of urban citizens and has
recreational, cultural, and social values (Bound & Hunhammar, 1999).
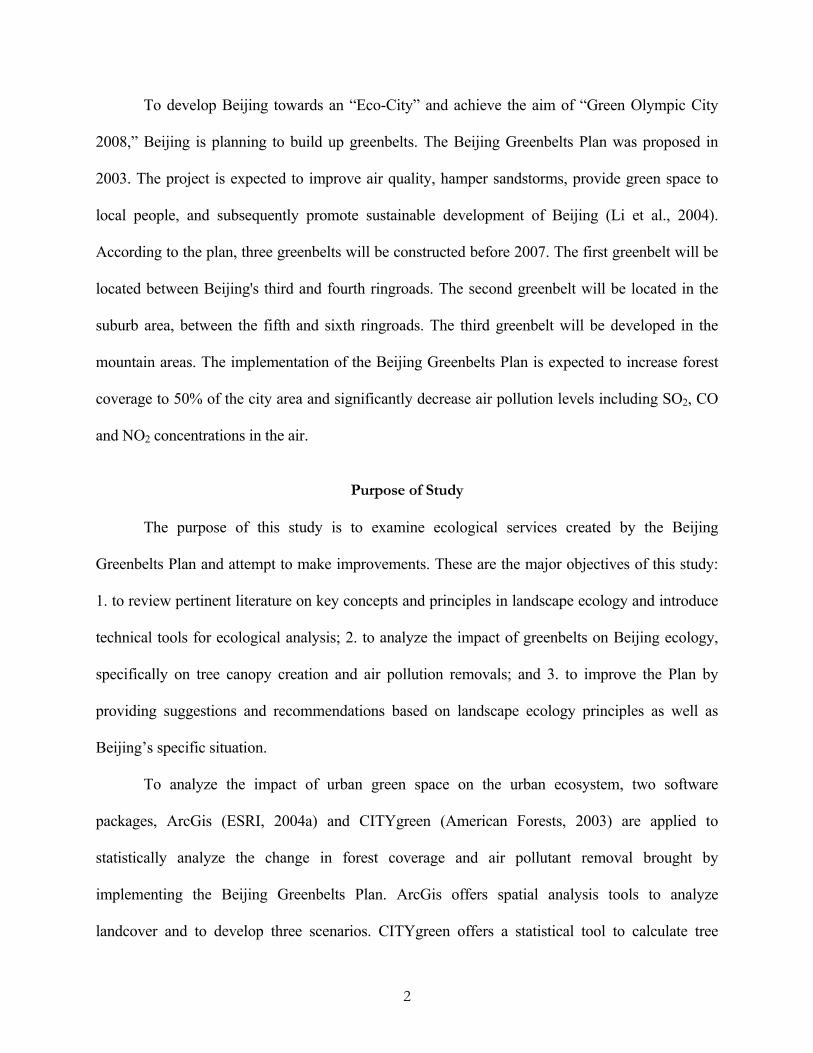
Background of Study
Beijing, the capital city of China, has more than 3,000 years of history. It is located in the
north of China within a temperate climatic zone. It has a total area of 16,800 km2 and a population
of about 13.8 million with an average population density of 821 persons/km2 (Beijing Municipal
Statistical Bureau, 2002). The rapid urbanization and the growing population continue to influence
the urban environment in Beijing. The air quality in the city is getting worse. Sandstorms have
frequently happened in spring in the last five years.
1
To develop Beijing towards an “Eco-City” and achieve the aim of “Green Olympic City
2008,” Beijing is planning to build up greenbelts. The Beijing Greenbelts Plan was proposed in
2003. The project is expected to improve air quality, hamper sandstorms, provide green space to
local people, and subsequently promote sustainable development of Beijing (Li et al., 2004).
According to the plan, three greenbelts will be constructed before 2007. The first greenbelt will be
located between Beijing's third and fourth ringroads. The second greenbelt will be located in the
suburb area, between the fifth and sixth ringroads. The third greenbelt will be developed in the
mountain areas. The implementation of the Beijing Greenbelts Plan is expected to increase forest
coverage to 50% of the city area and significantly decrease air pollution levels including SO2, CO
and NO2 concentrations in the air.
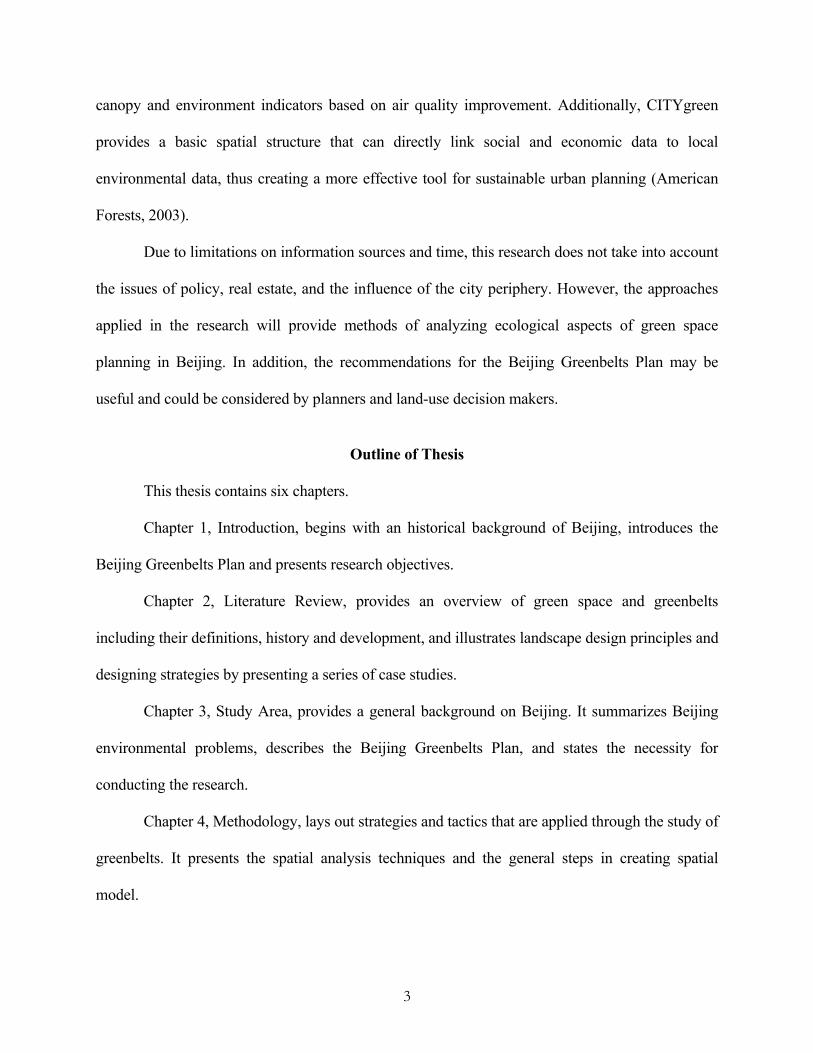
Purpose of Study
The purpose of this study is to examine ecological services created by the Beijing
Greenbelts Plan and attempt to make improvements. These are the major objectives of this study:
1. to review pertinent literature on key concepts and principles in landscape ecology and introduce
technical tools for ecological analysis; 2. to analyze the impact of greenbelts on Beijing ecology,
specifically on tree canopy creation and air pollution removals; and 3. to improve the Plan by
providing suggestions and recommendations based on landscape ecology principles as well as
Beijing’s specific situation.
To analyze the impact of urban green space on the urban ecosystem, two software
packages, ArcGis (ESRI, 2004a) and CITYgreen (American Forests, 2003) are applied to
statistically analyze the change in forest coverage and air pollutant removal brought by
implementing the Beijing Greenbelts Plan. ArcGis offers spatial analysis tools to analyze
landcover and to develop three scenarios. CITYgreen offers a statistical tool to calculate tree
2
canopy and environment indicators based on air quality improvement. Additionally, CITYgreen
provides a basic spatial structure that can directly link social and economic data to local
environmental data, thus creating a more effective tool for sustainable urban planning (American
Forests, 2003).
Due to limitations on information sources and time, this research does not take into account
the issues of policy, real estate, and the influence of the city periphery. However, the approaches
applied in the research will provide methods of analyzing ecological aspects of green space
planning in Beijing. In addition, the recommendations for the Beijing Greenbelts Plan may be
useful and could be considered by planners and land-use decision makers.
Outline of Thesis
This thesis contains six chapters.
Chapter 1, Introduction, begins with an historical background of Beijing, introduces the
Beijing Greenbelts Plan and presents research objectives.
Chapter 2, Literature Review, provides an overview of green space and greenbelts
including their definitions, history and development, and illustrates landscape design principles and
designing strategies by presenting a series of case studies.
Chapter 3, Study Area, provides a general background on Beijing. It summarizes Beijing
environmental problems, describes the Beijing Greenbelts Plan, and states the necessity for
conducting the research.
Chapter 4, Methodology, lays out strategies and tactics that are applied through the study of
greenbelts. It presents the spatial analysis techniques and the general steps in creating spatial
model.
3
Chapter 5, Analysis, explicates three spatial geographic scenarios, which were the existing
green space of Beijing in 1999, the Beijing Greenbelts Plan and an improved greenbelts scenario.
The three scenarios would be simulated, analyzed, and compared in order to provide statistical
reports and further insights on improving the Beijing Greenbelts Plan.
Chapter 6, Conclusion and Recommendation, takes a macro-view of the completed work
and synthesizes the methods to improve the Beijing Greenbelts Plan. Limitations of this study and
suggestions for future work are also presented.
4
Chapter Two: Literature Review
The purpose of this Literature Review is to provide background and principles on green
space planning in the urban region. It starts with the definitions and history of green space,
including greenbelts and greenways, which are the two main types of green space. Furthermore,
it interprets the benefits of green space to ecology, recreation, and culture. Several landscape
ecology principles and theoretical alternatives for distribution of green space are presented.
Discussed next are the two software packages, ArcGis and CITYgreen, used to simulate and
evaluate land-use planning from scientific perspective. Finally, three case studies are conducted
to provide the strategies and guidelines for green space planning based on landscape ecology
principles.
Green Space Definition and Benefits
Definition
Green space
The general term for green space is open space. Although a “standard” definition of green
space keeps broad, there are specific characteristic features that set green space apart from other
types of space. Green space in urban areas exists mainly as semi-natural areas and is essential
for urban sustainability and the people's quality of life (Smith & Hellmund, 1993).
All land units regarded as green space may be viewed as ecosystems, which are defined
as areas containing organisms, a physical environment, and the interactions and exchanges
among the organisms and the environment (Thompson, 2002). Green space is an important part
of complex urban ecosystems that provides significant ecosystem benefits. The history of green
5
space planning began with the idea of the Garden City advocated by Ebenezer Howard. After
Frederick Law Olmsted expounded the large urban park idea in the US, public green space have
been increasingly designated in cities (Little, 1990).
Greenbelts, greenways, and urban parks are three main types of urban green space, which
have significant ecological, social, and recreational functions (Shafer, 1999). They benefit urban
communities environmentally, esthetically, recreationally, and economically.
Greenbelts
The notion of green space encircling a central city has been translated into the planning
instrument of the greenbelt to confine unbridled urban sprawl (Wilson, 1989). A greenbelt is a
ring of countryside where urbanization will be resisted for the foreseeable future, maintaining an
area where agriculture, forestry, and outdoor leisure can be expected to prevail (Howard, 1898).
The purposes of greenbelts are to check the unrestricted sprawl of large built-up areas and
safeguard the surrounding countryside from further encroachment, to protect the natural
environment and improve air quality in urban areas, to ensure that urban dwellers have easy access
to the countryside, with consequent educational and recreational opportunities, and to protect the
unique character of rural communities, which might otherwise be absorbed by expanding suburbs
(Thompson, 2002).
The protection of greenbelts was pioneered in the United Kingdom, where there are
fourteen greenbelt areas, covering 13% of England (Thompson, 2002). Greenbelts were
introduced around London following the Second World War. The notion was included in an
advisory Greater London Plan prepared in 1944. Local councils were strongly urged to follow
this detailed advice when considering whether to permit additional buildings in the greenbelt or
assent to new uses being made of existing premises (Wikipedia, 2004).
6
Greenbelts were used in America in the design of several new planned communities, and
towns (Teal et al., 1998). Benton MacKaye proposed systems of wooded open space that “would
form a linear area, or belt around and through the locality” (Anderson, 2002, p. 33). His intent
was more than just to surround cities with green space as a means of blocking urban sprawl.
In recent years, greenbelts have captured the attention and imaginations of land managers,
landscape architects and planners interested in open space conservation. Greenbelts were
implemented in different regions of the world, such as Canada and Germany, as well as in Asia
(Sousa, 2003).
Greenways
A concept similar to a greenbelt is the greenway which has a linear character and may run
through an urban area instead of around it. ‘Greenway’ is a more general term in the U.S. The
purposes of greenways are to link landscape elements to form a linear networks system, usually
along terrain features such as natural (e.g. ridgelines or rivers) and artificial (e.g. roads, canals,
and railways) features (Smith & Hellmund, 1993).
The definition and purposes of greenways suggest a variety of greenway types and a
multiplicity of uses. The typology distinguishes the types of greenways according to their
dominant purpose, yet there is potential for overlap between each greenway type (Wikipedia,
2004). Recreational greenways may follow waterways, becoming riparian greenways. They are
distinguished from greenways established along natural corridors and across land developed for
human purposes. Ecological greenways most commonly follow natural landscape features, while
the other greenway types are commonly found on both natural landscapes and landscapes altered
by people for various purposes (Wikipedia, 2004).
7
As early as the 1860s, Frederick Law Olmsted recognized the great potential of linear open
spaces for providing access to city parks and extending the benefits of parks into nearby
neighborhoods. In 1866 and 1867, Frederick Law Olmsted and Calvert Vaux planned two
connecting parkways for Central Park in New York City. They designed Central Park "to bring
back a bit of nature" into the fast growing cities. Meanwhile, they anticipated that all major parks
and open spaces would link together into comprehensive networks of greenways and green space
(Smith & Hellmund, 1993, p. 8).
Benefits
Green space provides a large number of ecological, recreational and social benefits to
communities. Although it would be a rather lengthy submission to list and identify every single
benefit, the following is just a short list of the most important benefits that green space provides.
The values and benefits of green space depend on their physical characteristics as well as the
interests of those with a stake in their performance. Green space improves air quality and protects
natural resources vital to people, plants, and wildlife. They can also preserve the biological
diversity of plant and animal species by maintaining the connections between natural communities
(Thompson, 2002). Some major ecological benefits of green space are air filtering, micro-climate
regulation, noise reduction, and rainwater drainage. The social benefits of green space are to
provide health benefits and quality of life to people.
Ecological Benefits
Green space has a host of important ecological benefits and maintains the ecological
balance of regions. They protect natural areas and provide habitat for plants and animals. They
cool down air and counteract excessive heat build up in cities through shading and vegetative
evaporate transpiration. They also contribute to urban air quality by filtering out particulate
8
matter, especially pollutants emanating from adjacent roadways. Moreover, they supply clean
water to aquifers and maintain the quality of water resource by filtering excess nutrients in
ground water (Lütz & Bastian, 2002). More details of the benefits are discussed below.
Air Filtering
Urbanization often produces large amounts of pollutants. Hazardous gaseous emissions,
industrial effluents, and wastes adversely affect human health, vegetation, and property. As late as
the mid-1990s, researchers estimated that urban air pollution contributed to 30,000–60,000 deaths
per year in the U.S. (Leitão & Ahern, 2002).
It is clear that green space is an important and efficient way to attenuate air pollution.
Green space abates the impact of pollutants by vegetation filtering pollution and particulates from
the air (Jo, 2002). Vegetation is important for its ability to filter the air. Previous research indicates
that up to 85% of air pollution in a park can be filtered out, and in a street with trees, up to 70%. In
general, vegetation is much better than water or non-vegetated open spaces for filtering the air (Jo,
2002). Therefore, green space can be applied as a pollution mitigation tool in an industrial, urban
development or for an historical site/sensitive area protection plan.
Planting trees in green space is the most important and efficient way to attenuate air
pollution. Trees are efficient air cleaning machines that sequester many pollutants from the
atmosphere, including nitrogen dioxide (NO2), sulfur dioxide (SO2), ozone (O3), carbon monoxide
(CO), and particulate matter (PM) with sizes of ten microns or less (Jo, 2002).
Noise Reduction
Noise from traffic and other sources creates health problems for people in urban areas.
Noise exposure, a common urban problem, may contribute to hearing impairment, hypertension,
and ischemic heart disease. Green space can be an effective way to reduce noise by causing noise
9
diffraction. Increasing green areas with soft ground is an easy way to decrease these noise levels
(Nijwening, 1997).
Micro-Climate Regulation
Green space plays an important role in influencing climatic factors such as precipitation,
evaporation and direction of prevailing winds. Green space in the city can regulate temperature
deviations during both summer and winter. In this way green space can lower summer
temperatures of cities. Green space can also decrease energy use for heating and air conditioning
substantially in urban areas by shading houses in summer and reducing wind speed in winter (Mao
et al., 1993).
Many cities benefit from green space by reducing heating costs. A study of Chicago found
that the value of long-term benefits from trees was more than twice the present value of costs (Mao
et al., 1993). Green space can also reduce wind velocity and increase atmospheric and soil moisture
(Quam et al., 2005).
Rainwater Drainage
Green space contributes to solving problems of rainwater drainage. The soft ground of
vegetated areas allows water to seep through, and the vegetation takes up water and releases it into
the air through transpiration. Rainwater runoff is less in vegetated areas than vegetation-free areas.
This benefits both the local climate and increases groundwater levels (Jo, 2002).
Cities can benefit economically from improved rainwater drainage through pervious and
vegetated ground as the building and maintenance of storm water drainage systems involve large
costs. Using this ecosystem service could lower these costs. The benefits of green space also
include inhibition of erosion and increased nutrient recycling (Schrijnen, 2000).
10
Social Benefits
Green space provides social benefits including recreational, economic, aesthetic, and
cultural benefits. It is essential to achieve the quality of life that creates a great city and that makes
it possible for people to live a reasonable life within an urban environment (Davey, 1993).
According to the Swedish economist Nils Lundgren, a good urban environment is an important
argument for regions when trying to attract a highly qualified workforce (Kühn, 2003). Specific
social benefits are discussed below.
Recreational and Health Benefits
Of all the benefits green space provides, recreation has received the most popular attention.
With the increase of leisure time, people like to engage in more outside activities. Green space
provides an attractive physical environment and a source of enjoyment for people to go jogging,
biking, hiking, and so on (Francis & Paxson, 1984).
A city can be a stressful environment for its citizens. The overall speed and number of
pressures cause hectic lifestyles with little room for rest and contemplation. Green space helps
people escape from the asphalt world. Green space is also psychologically very important. A study
of recovery of patients in a hospital showed that patients with rooms facing vegetation had 10%
faster recovery and needed 50% less pain-relieving medication compared to patients in rooms
facing a building wall (Ulrich, 1984). Such studies imply that green space can increase the physical
and psychological well-being of urban citizens.
Aesthetic and Cultural Benefits
Green space has other social benefits that are less tangible than recreation but equally
important. For instance, green space can add to the aesthetic appeal of landscapes. Visibility and
11
legibility of green space is important to citizens. According to Lynch (1960), a legible landscape
is important to provide a "sense of place" to its inhabitants.
Greenways can also provide nature education and routes for non-consumptive
transportation modes, such as walking and cycling (Baschak & Brown, 1995). Combined with
aesthetic enhancement, this significance adds to the sense of history and culture that is important
to people’s experience of a landscape and their overall sense of place. Greenways can also tie
communities together by linking features such as parks, historic sites, residential areas, and
shopping districts without the noise and rush of automobiles (Baschak & Brown, 1995).
Economic Benefits
Although green space is planned to control development and protect scenery (Cook & Lier,
1994), they can also increase property values, enhance tourism, and create employment and
commercial opportunities. As green space benefits the health of urban citizens, they provide
billions of dollars in saved costs of health expenses, making them a truly invaluable asset.
Therefore, green space provides combination of “economic, health, scenic and cultural
benefits. Together, green space may function as an air/water purifier, a temperature modulator or
energy saver, a soil stabilizer, a wildlife habitat, a noise barrier, a landscape beautifier, a real estate
value booster, and even a psychological comforter” (Cook & Lier, 1994, pp. 1-4).
Landscape Ecological Principles and Design Scheme
Landscape ecology is the science and art of studying the spatial pattern of landscapes and
its ecological consequences. The “art” of landscape ecology reflects the humanistic perspectives
necessary for integrating biophysical and socioeconomic and cultural components within
landscape design and planning. The “science” of landscape ecology provides the theoretical basis
for understanding the formation, dynamics, and ecological effects of spatial heterogeneity, and
12
the relationship between landscape pattern and ecological processes over different scales in space
and time (Forman, 1996).
Landscape Ecology Principles
Landscape ecological principles are the essential principles guiding landscape planning
and urban green space design. Three elements in landscape ecology that handle the development
of general principles are patches, corridors, and matrix (Dramstad et al., 1996) demonstrates the
key attributes of patches as large or small, round or elongated, smooth or convoluted, few or
numerous, dispersed or clustered, and so forth, while corridors appear narrow or wide, straight or
curvy, continuous or disconnected, and so on. As well, he presents the matrix combines to form
the variety of land mosaics on earth (Dramstad et al., 1996). Several landscape ecological
principles are simply stated with a diagram below.
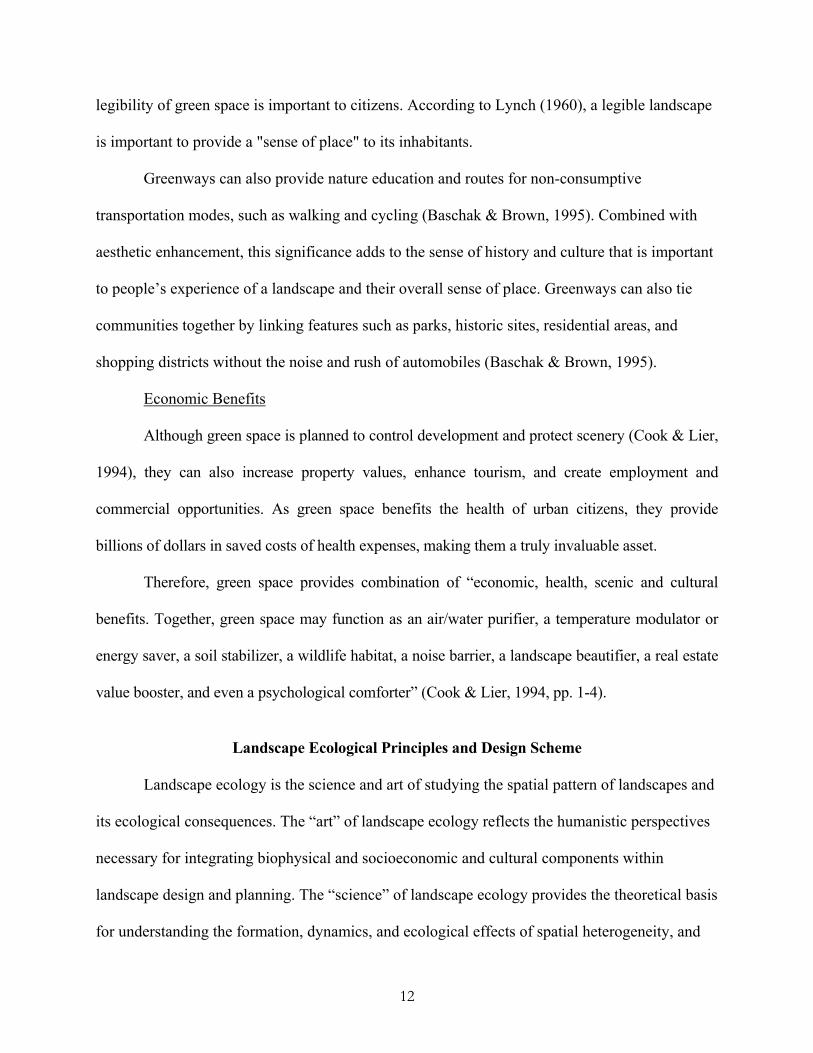
Edge width
An edge is described as the outer portion of a patch where the environment differs
significantly from the interior of the patch. Edge width differs around a patch, with wider edges on
sides facing the predominant wind direction and solar exposure (Figure 1).
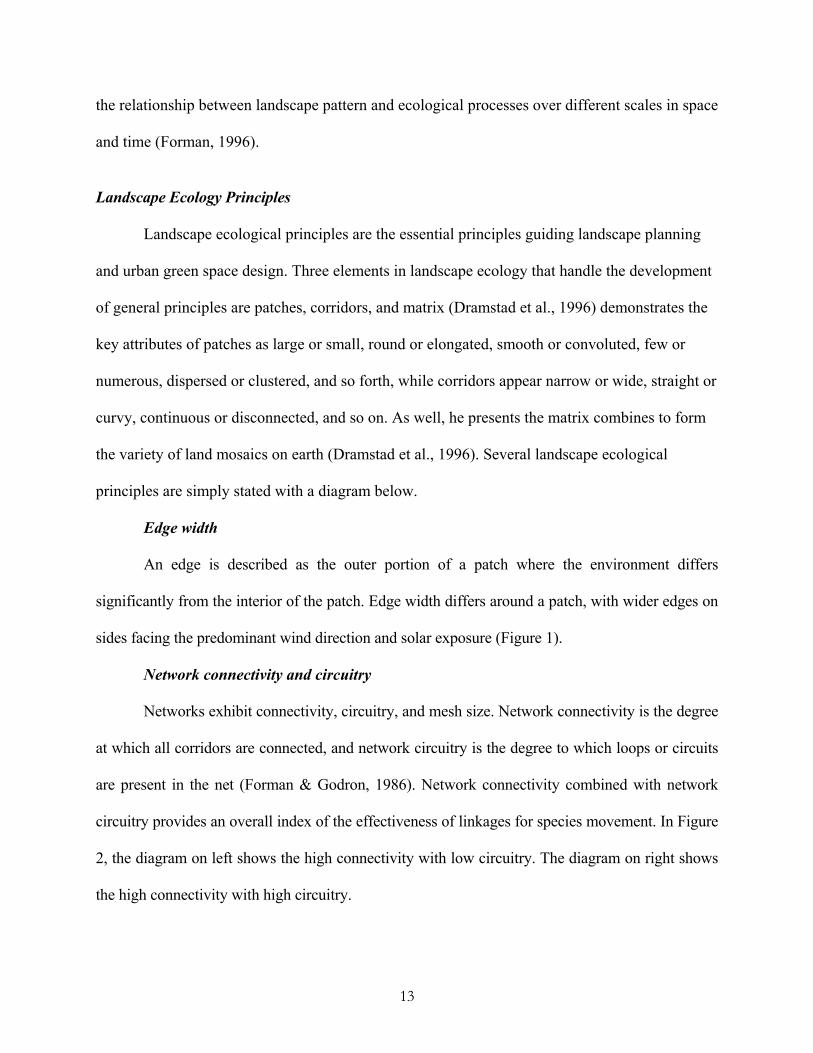
Network connectivity and circuitry
Networks exhibit connectivity, circuitry, and mesh size. Network connectivity is the degree
at which all corridors are connected, and network circuitry is the degree to which loops or circuits
are present in the net (Forman & Godron, 1986). Network connectivity combined with network
circuitry provides an overall index of the effectiveness of linkages for species movement. In Figure
2, the diagram on left shows the high connectivity with low circuitry. The diagram on right shows
the high connectivity with high circuitry.
13
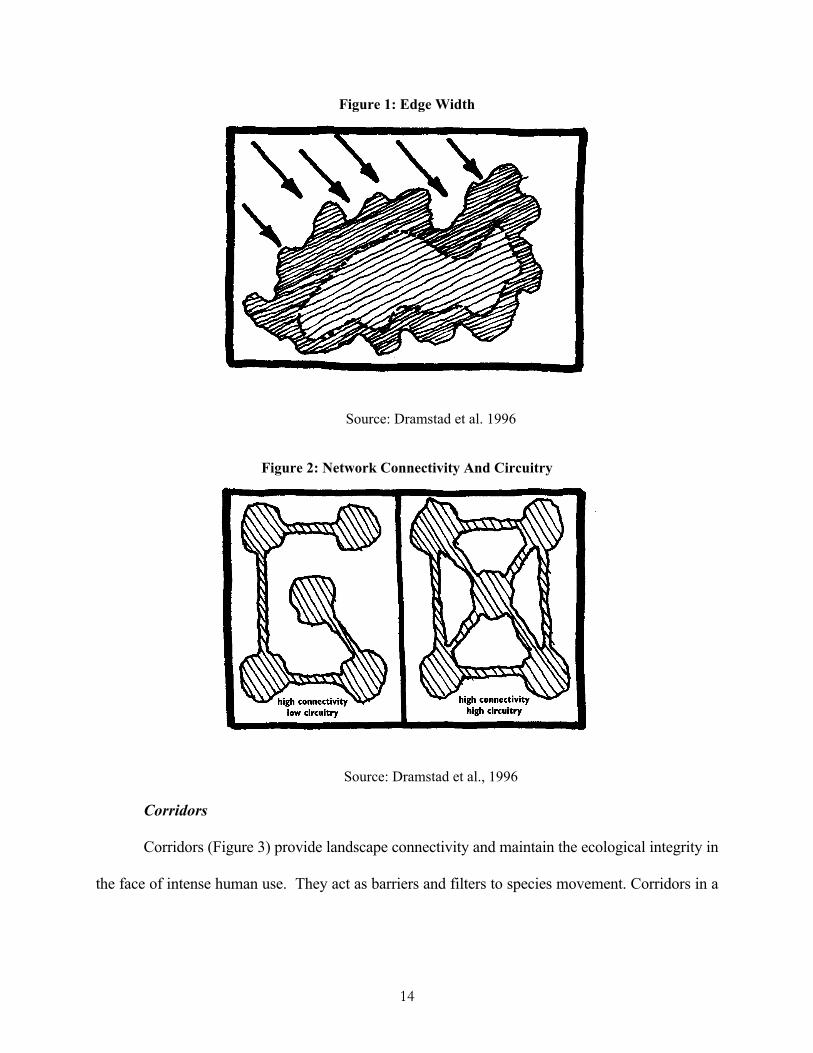
Figure 1: Edge Width
Source: Dramstad et al. 1996
Figure 2: Network Connectivity And Circuitry
Source: Dramstad et al., 1996
Corridors
Corridors (Figure 3) provide landscape connectivity and maintain the ecological integrity in
the face of intense human use. They act as barriers and filters to species movement. Corridors in a
14
network reduce the negative effects of gaps and disturbances, thus increasing efficiency of
movement (Dramstad et al., 1996).
Figure 3: Corridors
Source: Dramstad et al., 1996
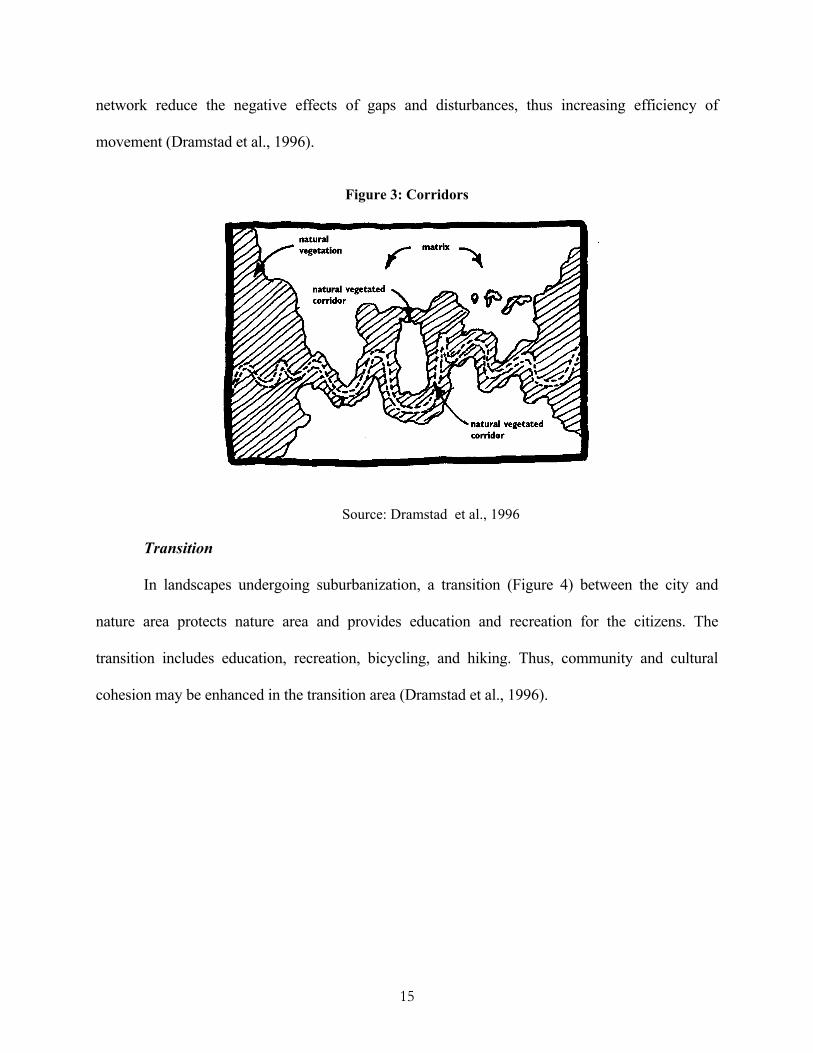
Transition
In landscapes undergoing suburbanization, a transition (Figure 4) between the city and
nature area protects nature area and provides education and recreation for the citizens. The
transition includes education, recreation, bicycling, and hiking. Thus, community and cultural
cohesion may be enhanced in the transition area (Dramstad et al., 1996).
15
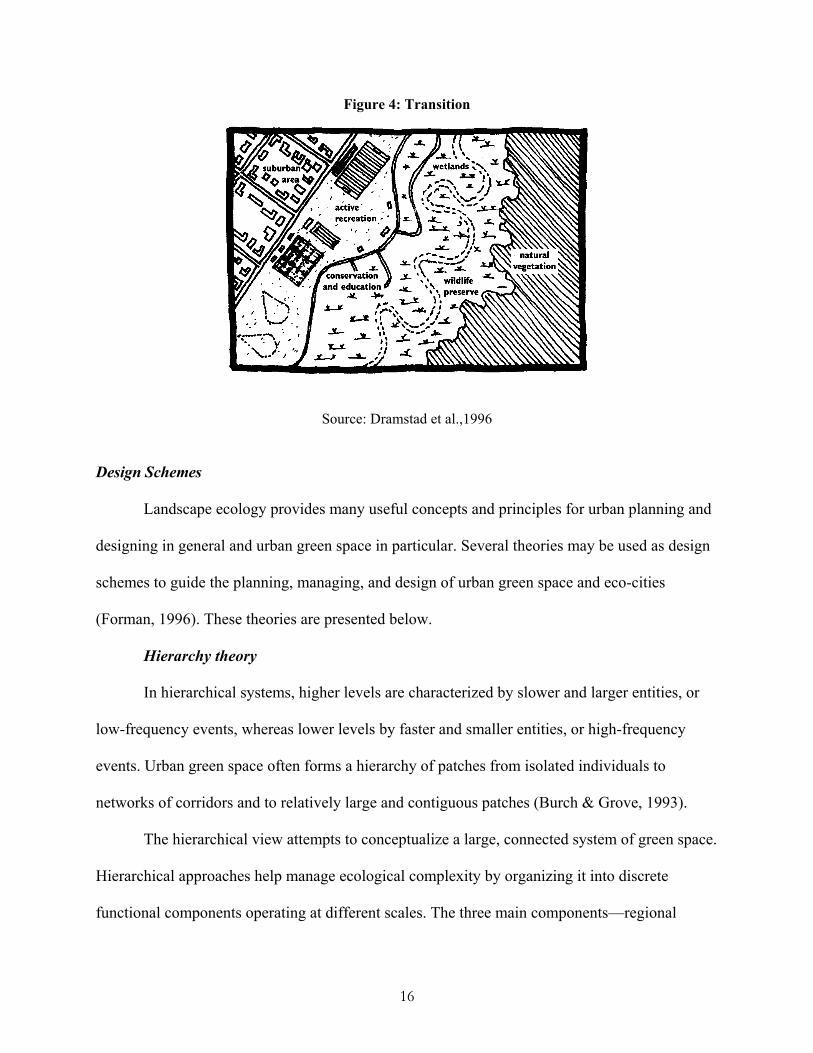
Figure 4: Transition
Source: Dramstad et al.,1996
Design Schemes
Landscape ecology provides many useful concepts and principles for urban planning and
designing in general and urban green space in particular. Several theories may be used as design
schemes to guide the planning, managing, and design of urban green space and eco-cities
(Forman, 1996). These theories are presented below.
Hierarchy theory
In hierarchical systems, higher levels are characterized by slower and larger entities, or
low-frequency events, whereas lower levels by faster and smaller entities, or high-frequency
events. Urban green space often forms a hierarchy of patches from isolated individuals to
networks of corridors and to relatively large and contiguous patches (Burch & Grove, 1993).
The hierarchical view attempts to conceptualize a large, connected system of green space.
Hierarchical approaches help manage ecological complexity by organizing it into discrete
functional components operating at different scales. The three main components—regional
16
patches, urban green space, and greenways—set a fitting spatial framework that is useful for
planning. The hierarchical view suggests that an understanding and appreciation of urban green
space can be gained by considering them at multiple scales and hierarchical linkages among
green space (Burch & Grove, 1993).
Landscape connectivity
Landscape connectivity refers to the degree of connectedness among landscape elements
(patch, corridor and matrix) of the same or similar type (e.g., forest habitats, lakes or rivers).
Buffers and corridors are linear landscape elements that may function as habitats, conduits,
filters/barriers, sources, or sinks (Forman 1995). A network of patches and corridors can provide
connectivity between natural elements and help to preserve linkages between different
ecosystems. Corridors of the same or similar types interconnect to form a network whose
functionality is determined by network density, network connectivity, and network circuitry
(Forman & Godron 1986).
Heterogeneity
The green space in urban areas may be most appropriate to treat as a landscape that
consists of a variety of dynamic, interacting patch ecosystems of different shape, size, and
history. It is considered that the urban environment is extremely heterogeneous in space and
dynamic in time (Forman 1995). The heterogeneity concept acknowledges that ecological
heterogeneity, which is crucial to the functioning and maintenance of natural systems, provides
environmental benefits. Heterogeneity, diversity, and connectivity within the components of
green space contribute powerfully to the features and process for which people and institutions
value them (Forman & Godron. 1986).
17
Biodiversity
Landscape units and green space combine several ecological functions rather than a
mono-function. Appropriate ecosystem services have high green space quality and diversity.
Biodiversity improves specific conditions for endangered species by reducing negative effects on
their habitat (e.g. linkage of fragmented habitats). Buffer zones are efficient green space to
protect biodiversity and natural reserves (Forman, 1996).
In essence, landscape ecology is a highly interdisciplinary field that focuses on spatial
patterning of landscape elements and its relationships to ecological processes on different scales.
Landscape ecological principles and design schemes provide a variety of useful concepts and
principles for urban planning and designing and can be applied in specific situations.
Theoretical Alternatives of Distributions of Green Space at City Level
Turner (1995) generalized a series of theoretical alternatives for distribution of open space
through the history of London’s greenbelts plans. These theoretical alternatives provide the
methods to build green networks linked by greenways and green buffers in cities. It provides a
diversity of greenways patterns and advantages of each pattern. The theoretical alternatives of
distributions of green space are showed in Figure 5.
18
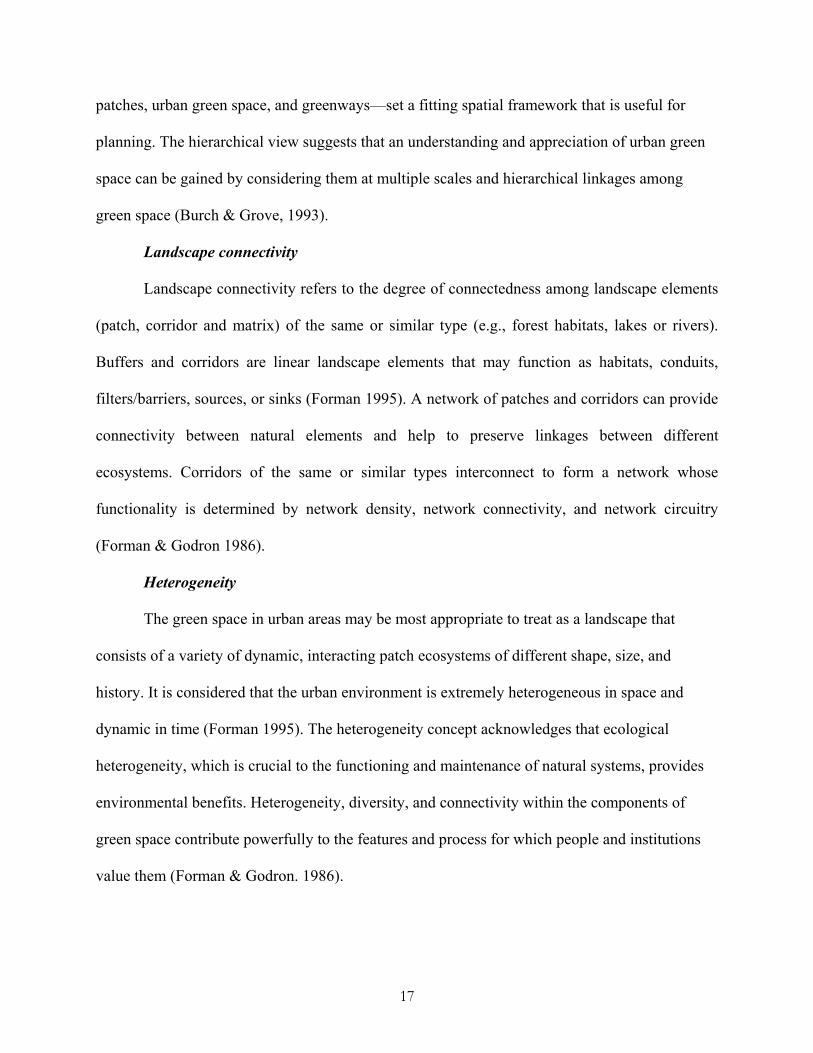
Figure 5: Theoretical Alternatives For The Distribution Of Open Space
Source: Turner, 1995 Diagram A represents a hierarchy of parks of different sizes which were first proposed in
the Greater London Council’s 1976 proposal. The plan was based on careful and extensive social
science research. The findings led to the conclusion that London should be provided with more
parks, arranged in a hierarchy of different sizes: Metropolitan Parks, District Parks, and Local
Parks
Diagram B represents a typical greenway in an urban area, which is short of connection. It
does not provide either a useful route or useful recreational space.
Diagram C represents an interconnected park system which was mentioned in London’s
1944 proposal. The plan carried forward the idea that introduced a visionary proposal for creating
an immense network of greenways to interlink green space in central areas with those on the
periphery of Greater London.
Diagram D represents a series of overlapping networks as the green strategy. The idea is to
create a “green web” which would function as a citywide pedestrian zone, combining paved and
vegetated space. Overlapping networks are composed of different layers as a pedestrian layer and
19
ecological corridors linked by greenways and green buffers within the surrounding landscape
matrix (Turner, 1995).
Further, Turner proposed that greenways may be the best single marketing concept in a
green space plan and can improve the quality of green space in urban areas. Greenway promotion
and diversification can lead to the different types, including parkway, blueway, glazeway,
cycleway, skyway, and ecoway, which are becoming as familiar components of the urban
environment. Each type should be recognized as an archetype for environmentally sound places,
and each should be subject to further diversification.
Turner illustrated six greenways from which urban areas can build networks and links. 1).
The parkway is designed for providing the active recreation which the residents may use for their
everyday life. 2). The cycleways link roads and paths to improve physical fitness and benefit
people’s health. 3).The blueway is designed for citizens to access to water, pools and streams.
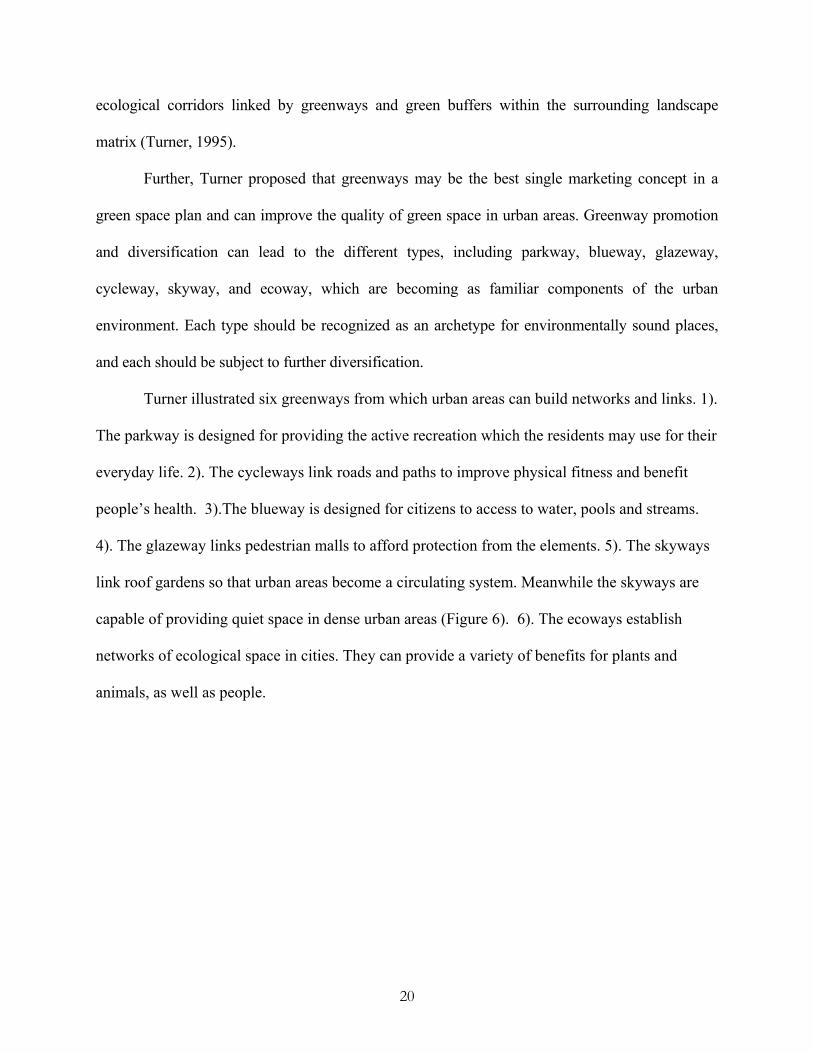
4). The glazeway links pedestrian malls to afford protection from the elements. 5). The skyways
link roof gardens so that urban areas become a circulating system. Meanwhile the skyways are
capable of providing quiet space in dense urban areas (Figure 6). 6). The ecoways establish
networks of ecological space in cities. They can provide a variety of benefits for plants and
animals, as well as people.
20
Figure 6: Skyways And Roof Gardens
Source: Turner, 1987 In summary, the theoretical alternatives provide the methods to build green networks
linked by greenways and green buffers in cities. It presents a diversity of greenways patterns and
advantages on building urban-green space.
GIS and CITYgreen Application
GIS
The understanding of green space plans and ecological processes are based on a great
variety of geographical data collected at many spatial scales. Geographic Information Systems
(GIS) are spatial tools useful for evaluating land-use plans and land-use suitability by integrating
topography, vegetation cover, and land-use types (Lavely, 1989).
GIS provides a variety of tools for mapping and manipulating spatial data. The
characteristics of GIS not only facilitate a better understanding of green space plans and
ecological processes but can also improve decision-making efficiency (Clarke & Gaydos, 1998).
Some useful functions provided by GIS include the following:
21
Manipulating spatial data
GIS provides the abilities to input, store, analyze, display, and handle geographical data
and spatial information. GIS allows one to store data from various origins and facilitates the
design of maps meeting specific needs (ERIS, 2004).
Modeling ecological changes and simulate evolution
GIS can simulate impacts on environmental diversity and predict potential changes so
that the implementation of management strategies may avoid or reduce some negative impacts.
Also, space-time modeling from the information stored in a database can be helpful in making an
accurate evaluation on ecosystems (Clarke & Gaydos, 1998).
Detecting change
GIS can provide visual information and detect change over time. The ability to detect
change is crucial for efficient land management. It is fundamental for administrators to quickly
know change affecting an area in order to take action (Lavely, 1989).
Making efficient decisions
The database held in the GIS offers the potential for many more analyses to be carried
out. By providing accurate spatial data and predicting future change, GIS can lead to the
development of suitable management decisions and a better understanding of an ecosystem. GIS
is a tool for decision support provided that time is invested in data collection (ERIS, 2004).
CITYgreen
CITYgreen is a software extension for the ArcGis package. It provides an effective tool for
measuring ecological services of green space and facilitates an assessment of environmental
impacts based on landcover and air quality. Also, it provides model-basic estimates that could
directly link social and economic data to local environmental data.
22
Background
CITYgreen is a software extension developed by American Forests. When the first version
of CITYgreen was released in 1996, it represented a groundbreaking collaboration between cities
and conservation groups to both calculate the economic and environmental benefits provided by
trees and other vegetation. With each release based on the most up-to-date, peer-reviewed science,
CITYgreen analysis has increasingly became an important decision-making tool for local and
regional planners (CITYgreen Manual, 2004).
Operation procedures
CITYgreen uses aerial imagery for an analysis of a study area. The first step of operating
CITYgreen is usually creating shape files of the study boundary and landcover data, followed by
converting vector data to raster data. Then CITYgreen conducts an analysis by converting input
raster landcover values to its own specific categories. Finally, a statistics report is created to show
basic ecological services, including air pollution removal, carbon capture and sequestration
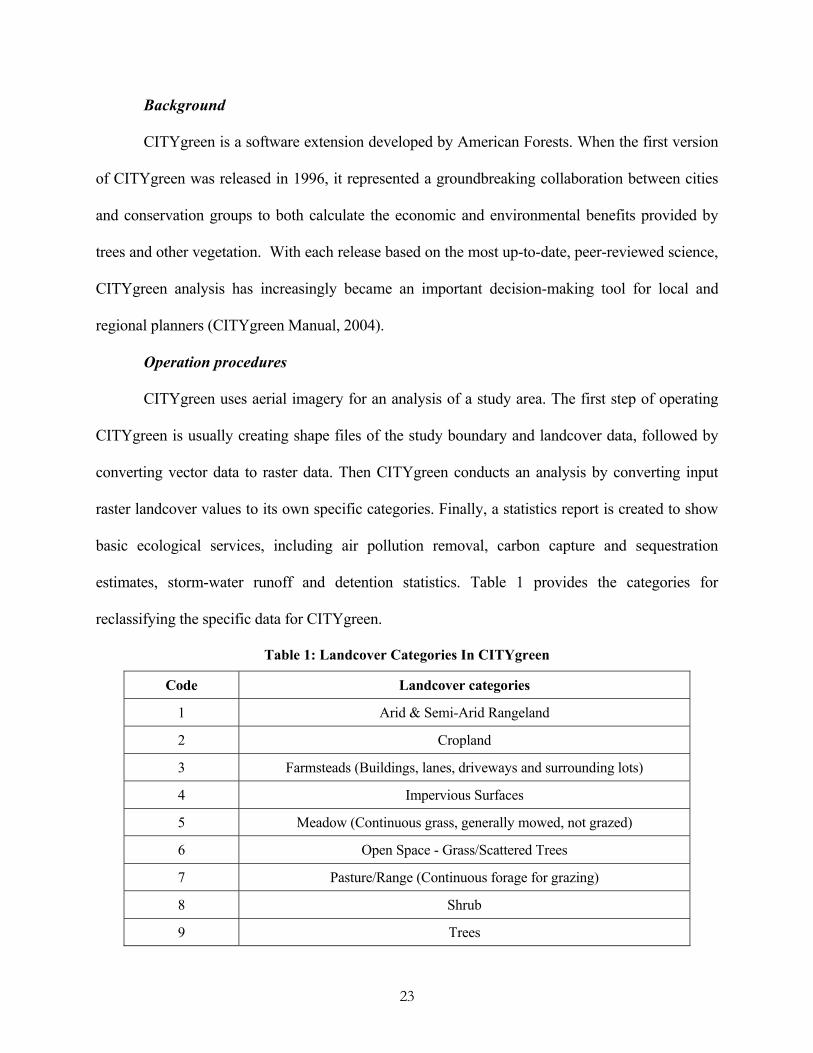
estimates, storm-water runoff and detention statistics. Table 1 provides the categories for
reclassifying the specific data for CITYgreen.
Table 1: Landcover Categories In CITYgreen
Code Landcover categories
1 Arid & Semi-Arid Rangeland
2 Cropland
3 Farmsteads (Buildings, lanes, driveways and surrounding lots)
4 Impervious Surfaces
5 Meadow (Continuous grass, generally mowed, not grazed)
6 Open Space - Grass/Scattered Trees
7 Pasture/Range (Continuous forage for grazing)
8 Shrub
9 Trees
23
10 Tropical
11 Unclassified
12 Urban
13 Water Area
Source: Author, 2005
Models.
CITYgreen performs basic ecological services analysis functions based on the four models.
The models are demonstrated below.
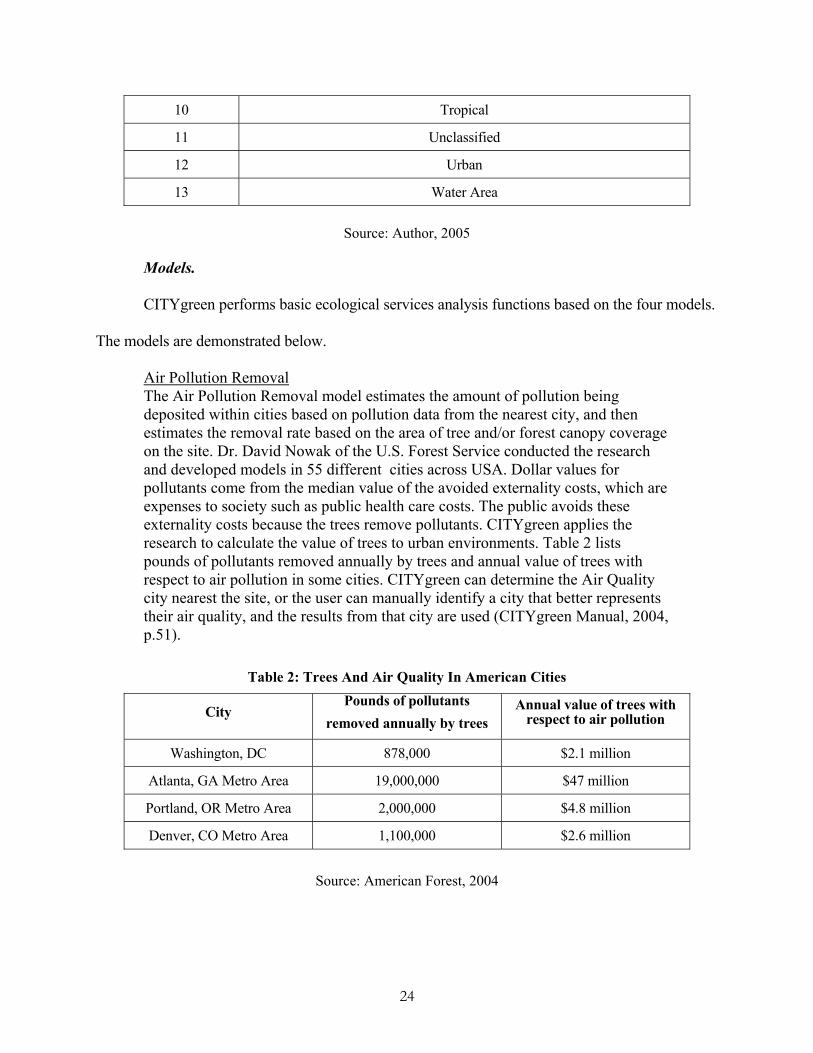
Air Pollution Removal The Air Pollution Removal model estimates the amount of pollution being deposited within cities based on pollution data from the nearest city, and then estimates the removal rate based on the area of tree and/or forest canopy coverage on the site. Dr. David Nowak of the U.S. Forest Service conducted the research and developed models in 55 different cities across USA. Dollar values for pollutants come from the median value of the avoided externality costs, which are expenses to society such as public health care costs. The public avoids these externality costs because the trees remove pollutants. CITYgreen applies the research to calculate the value of trees to urban environments. Table 2 lists pounds of pollutants removed annually by trees and annual value of trees with respect to air pollution in some cities. CITYgreen can determine the Air Quality city nearest the site, or the user can manually identify a city that better represents their air quality, and the results from that city are used (CITYgreen Manual, 2004, p.51).
Table 2: Trees And Air Quality In American Cities
City Pounds of pollutants
removed annually by trees Annual value of trees with
respect to air pollution
Washington, DC 878,000 $2.1 million
Atlanta, GA Metro Area 19,000,000 $47 million
Portland, OR Metro Area 2,000,000 $4.8 million
Denver, CO Metro Area 1,100,000 $2.6 million
Source: American Forest, 2004
24
Carbon Storage and Sequestration The carbon model estimates annual sequestration, or the rate at which carbon is removed, and the current storage in existing trees. The carbon model multiplies a per unit value of carbon storage by the area of canopy coverage. Economic benefits can also be associated with carbon sequestration rates using whatever valuation method the user feels appropriate. In estimating urban carbon storage and sequestration, the study area (in acres) and the percentage of crown cover are required (CITYgreen Manual, 2004, p.81). Stormwater Runoff Reduction The CITYgreen stormwater runoff analysis estimates the amount of stormwater that runs off a land area during a major storm, as well as the time of concentration and peak flow. The program determines runoff volume based on the percentage of tree canopy, and other landcover features, as digitized by the user in the CITYgreen view or as reported in a raster data set. The Stormwater Runoff program incorporates procedures and formulas developed by the Natural Conservation Service (NRCS). In addition, the program estimates the additional volume of water in cubic feet, which can be associated with an economic value since planners generally know the cost per cubic foot to build a retention pond in their municipality (CITYgreen Manual, 2004, p.82). Water Quality Model The water quality model calculates the effect of landcover on the amount of pollutants and suspended solids in surface water runoff. The model is based on a storm event calculation; that is how landcover affects the runoff from a typical 2-year, 24- hour storm. The relationship between the landcover and water quality is predicted using the L-THIA spread sheet model, which was developed by Purdue University an the U.S. Environmental Protection Agency (EPA) (CITYgreen Manual, 2004, p.86).
Application of CITYgreen
The application of CITYgreen is expounded by a project, which applied CITYgreen
software and analyzed ecological insights at two “regional” and “local” scales, surrounding
Clemson and within the city. The project built ecologically improved versions of developments
at region and local levels. Three scenarios were created to compare the change of tree canopy
and identified additional ecological services. The statistical reports produced by CITYgreen
emphasized the benefits of trees, and recommendations were presented to the city of Clemson.
The processing is presented below. (Brooks et al., 1999)
25
At Regional Level
The project employed multi-date Thematic Mapper satellite imagery to detect vegetative
changes over a ten-year period (1988-1998) for the Clemson region. By applying zoning and
development regulations to the vacant parcels, the analysis estimated the amount of vegetation
remaining after development. Additionally, it assessed the proposed overall zoning and land-use
changes in terms of urban trees and a number of their related benefits. Consequently, the section
concludes with recommendations to the city of Clemson on ecological insight.
At Local Level
In this section, the project developed and compared three development scenarios,
including a baseline scenario, a conventional scenario, and an environmental scenario. The
baseline scenario served as a control which compared the alternative designs. The conventional
scenario was a representation of a scheme allowable under current city regulations. The
environmental scenario delineated the best ecological development practices applied to the site.
Linking CITYgreen results, the project compared three scenario models based on the ecological
services, including storm-water run-off and detention statistics, carbon capture and sequestration
estimates, pollution removals and energy savings. Results included development regulation
recommendations for the City of Clemson and demonstrated the benefits of sensitive design to
the city and to development of the community.
Case Studies
To provide the guidelines and methodology on the modern ecological framework, two
case studies have been chosen to explain green space planning in the historic metropolitan
regions. The first case study shows how well-designed greenbelts in Canada can hamper
sandstorms and reduce wind speed. The second case is the green space system for New York
26
City. It summarizes the green space network by presenting five key ecological principles. The
two case studies provide the guidelines and methodology on the modern ecological framework
for further study and are presented below.
Properly Designed Greenbelts in Canada
The research on greenbelts in Canada presents the primary benefit of greenbelts being to
reduce wind speed. Moreover, it describes the methods of properly designed greenbelts and
choice of tree species. Tests of wind speed were conducted on four greenbelts surrounding the
Regina, Alberta plains area. By correlating with wind speed, the effect of differences in greenbelt
density could be detected. It was found that the denser greenbelts on the north side reduced wind
speeds by 83%, and the moderate density greenbelts on the east and west sides reduced wind
speed by an average of 70%. For the light density belt on the south side wind speed was reduced
by 52% (Agriculture and Agri-Food Canada, 2003).
The research reports that the best design for greenbelts in Canada is with the maximum
protection on the northwest due to the prevailing winds that come from the northwest in most of
Canada. It pointed out that “a five-row shelterbelt on these two sides consisting of an outside row
of shrubs, a double row of deciduous trees and a double inner row of conifers with staggered
spaces is the ideal design for protection from both wind and blowing snow” (Agriculture and
Agri-Food Canada, 2003, np).
The second aspect of a properly designed greenbelt in Canada is leaving more openness
in the south. Because south and east winds are generally warmer than north and west winds, it is
desirable to leave the south open and restricted to rows of deciduous trees and shrubs. The
benefit of more openness to the south is to gain maximum solar light in the winter and allow
27
more ventilation of the farmyard or living area in the summer (Agriculture and Agri-Food
Canada, 2003).
In addition, the study proposes that the wind is deflected up and over the greenbelts,
creating a well protected zone in the lee of the greenbelts. By testing, the research found that “the
zone of maximum protection extends outward five times the height of the trees” (Agriculture and
Agri-Food Canada, 2003, np). The study also found that the use of conifers and other densely
branched species is essential for winter protection (Agriculture and Agri-Food Canada, 2003).
Furthermore, the research presented other details that should be noticed when a greenbelt
plan is created. Openings in greenbelts should be designed to avoid creating a wind tunnel effect.
Because of the cold weather in Canada, the research proposes that the belt should be continuous
on the north and west. “Any openings on these sides should be perpendicular to prevailing winds
so that wind is not allowed direct access. Trees and shrubs can also be planted around the
openings to baffle the winds and keep the snow from piling up in laneways” (Agriculture and
Agri-Food Canada, 2003, np). The distance between buildings and belts was also studied. It is
found that buildings should be about 30 meters away from the inner row of trees to avoid the
accumulation of snow occurring immediately inside the belt. Specimen plants can be planted
closer to the buildings for addition of protection and attractiveness.
In summary, the research conducted tests to examine different percentages of reducing
wind speeds in greenbelts with different densities. It presents methods to design a greenbelt plan
according to the climate and location of the site. The results of this study provide useful methods
on design and improvement of existing greenbelts.
28
Green Space System for New York City
To preserve natural areas and improve environmental quality, New York City developed
the green space plan, called Metropolitan Greensward Plan. In addition, the city developed
approaches on green space to assist communities in implementing effective land development in
neighborhoods. The approaches on green space aim to preserve natural area and rehabilitate
urban green space to build the long-term livability of urban areas.
The Metropolitan Greensward Plan is an attempt to address these overall concerns through
green space planning and improved natural resource management. To protect and restore
environmental systems, green space with large-scale regional natural reserves is linked into a
single green space system. Flores summarizes this framework by presenting five key ecological
principles: content, context, dynamics, heterogeneity, and hierarchies (Flores et al., 1998).
The ecological content principle is based on the concept of the ecosystem. All ecosystems
have structure and function, which cannot be separated. Structure refers to the physical
arrangement of biological and non-biological components of the system, whereas function refers
to the way the components interact with one another.
The context principle states that ecosystems often are strongly affected by the external
landscape providing a specific context to each site. The size and shape of land units play a key
role in the way ecosystem function is influenced by external interactions.
The dynamics principle states that the structure and function of ecosystems are in
constant flux. Ecosystem dynamics result from two major ecological concepts, succession and
disturbance. The more dynamic view of green space within the modern framework has important
implications for both planning and management.
29
The heterogeneity principle acknowledges that ecological heterogeneity is crucial to the
functioning and maintenance of natural systems. Heterogeneity, diversity, and connectivity
contribute powerfully to green space.
The hierarchical principle helps manage ecological complexity by organizing it into
discrete functional components operating at different scales. Three main components—the
regional reserves, urban green space, and greenways—set a fitting spatial framework that is
useful for land development.
Furthermore, New York City developed approaches on green space which emphasizes a
dynamic view of a rich urban environment and interactions among multiple sites in urban area.
Those approaches are listed below.
Green space provides benefits for physical health and often reduces stress. It is also good
for spiritual revitalization. Community parks in New York create a more livable environment but
also enhance property values (Flores et al., 1998). Parks are also sites for athletic recreation
which is so important to residents. The qualities of communities can be greatly improved, and
living environments become more beautiful and enjoyable if more parks are established (Flores
et al., 1998).
Buffer zones between natural vegetation and settlement provide the benefit of
biodiversity as well as provide spaces for recreation and environmental education. Interpretive
walks and classes conducted in buffer zones can increase one’s appreciation for the environment.
Public access offers visual hints of access to natural or cultural resources. Communities
are more pleasant places to visit when their residents can have visual and direct access to diverse
views.
30
A number of historic districts in New York City have historic or aesthetic interest as part
of the cultural, political, and economic history of the state and nation. Protecting and
rehabilitating historic sites is an important commitment in a green space plan. New York State
municipalities have enacted some form of historic preservation regulations, and most of these
municipalities have established historic preservation commissions.
The green space plan protects and restores environmental and life-supported systems for
the region's cities, suburbs, and rural communities. The plan explores explicitly the connection
between ecological process and quality of life. Also, the approaches on green space presented
can be used to rehabilitate urban green space and reach specific planning goals.
Overview
Two examples of green space planning in different regions offer insight to the green
space planning in metropolitan areas. The case of greenbelts in Canada offers the way of
reducing wind speed by employing wider edges on sides facing the predominant wind direction.
Also, it indicates that leaving more openness in the south can gain maximum solar light and
more ventilation. Moreover, the case specifies parameters for properly designed greenbelts and
species selection. The study aids in the improvement of existing greenbelts to provide maximum
protection from wind.
The case study of New York applies the landscape ecological principles and analyzes the
green space plan strategies by using five ecological principles: content, context, dynamics,
heterogeneity, and hierarchy. Additionally, it represents the approaches on enriching green space
to rehabilitate environmental quality of urban areas.
31
Summary
The literature review identifies several key issues associated with green space planning in
urban areas. The illustration of landscape ecology and case studies provides general principles
for analyzing the Beijing Greenbelts Plan. In addition, the interpretation on GIS and CITYgreen
presents that the two software packages offer analysis tools to the greenbelts plan from
quantitative perspective.
How to develop a proper greenbelts plan to improve a sustainable ecosystem and hamper
sandstorms? According to landscape ecology and the case studies, the principles and strategies of
developing greenbelts plans are as below:
At the regional level, widening edges on sides facing the predominant wind direction
offers a way of reducing wind speed. Also, leaving more openness in the south can gain
maximum solar light and more ventilation. At city level, building green networks and green
buffers can enhance the connectivity of green space in cities. At neighborhood level, developing
more community parks is the approach on enhancing green space to build sustainable and livable
place environment in compacted urban areas.
Furthermore, how to apply the software package to analyze greenbelts from a quantitative
perspective? The Clemson study presents a method for application of CITYgreen, which is
creating three scenarios to analyze ecological services at the local scale and by using the Landsat
image to detect the landcover change at the regional and district scales.
32
Chapter Three: Study Area
This chapter introduces the general background of Beijing, and provides an overview of the
history of greenbelts in Beijing. It also illustrates the details of the Beijing Greenbelts Plan
proposed in 2003.
The General Background of Beijing
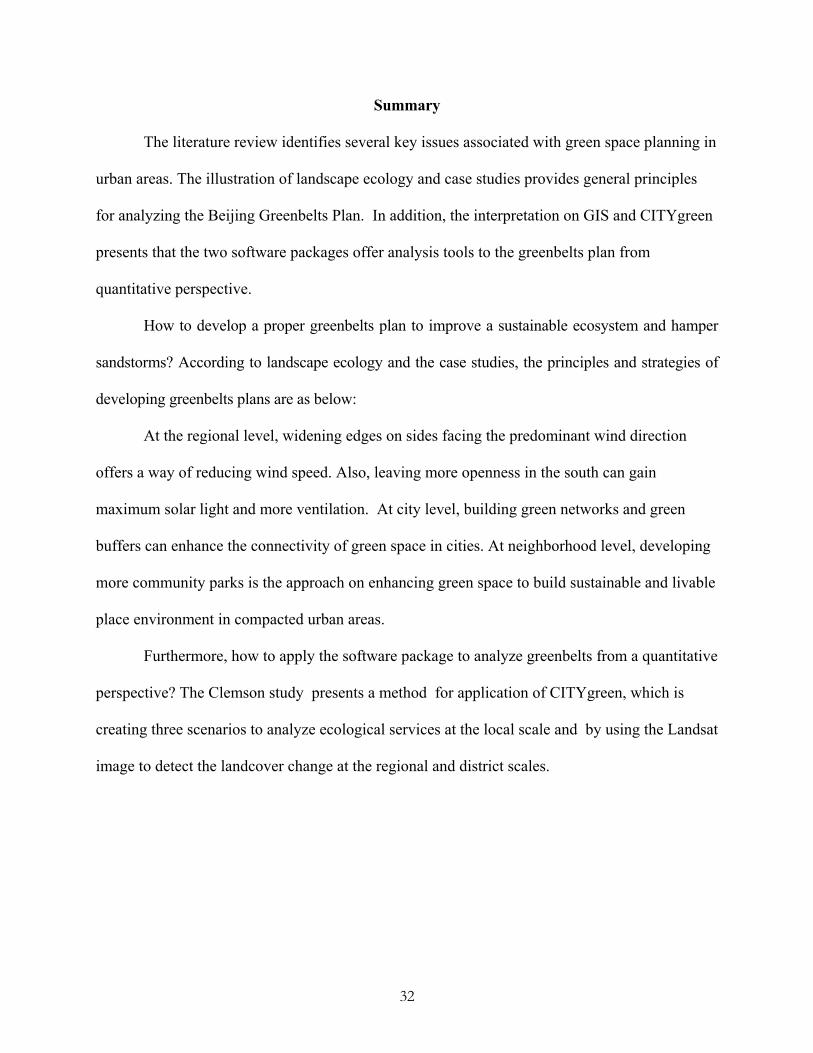
Beijing is situated at the northwest end of the North China Plain. The region of Beijing
spreads over a total area of 16,800 square kilometers (4,151,000 acres), of mountain land accounts
for approximately one third (Figure 7). The city core covers an area of 62 square kilometers
(15,320 acres). Beijing has more than 3000 years of history with a multitude of national cultural
and historic sites (Mann, 1984).
Topography and Geology
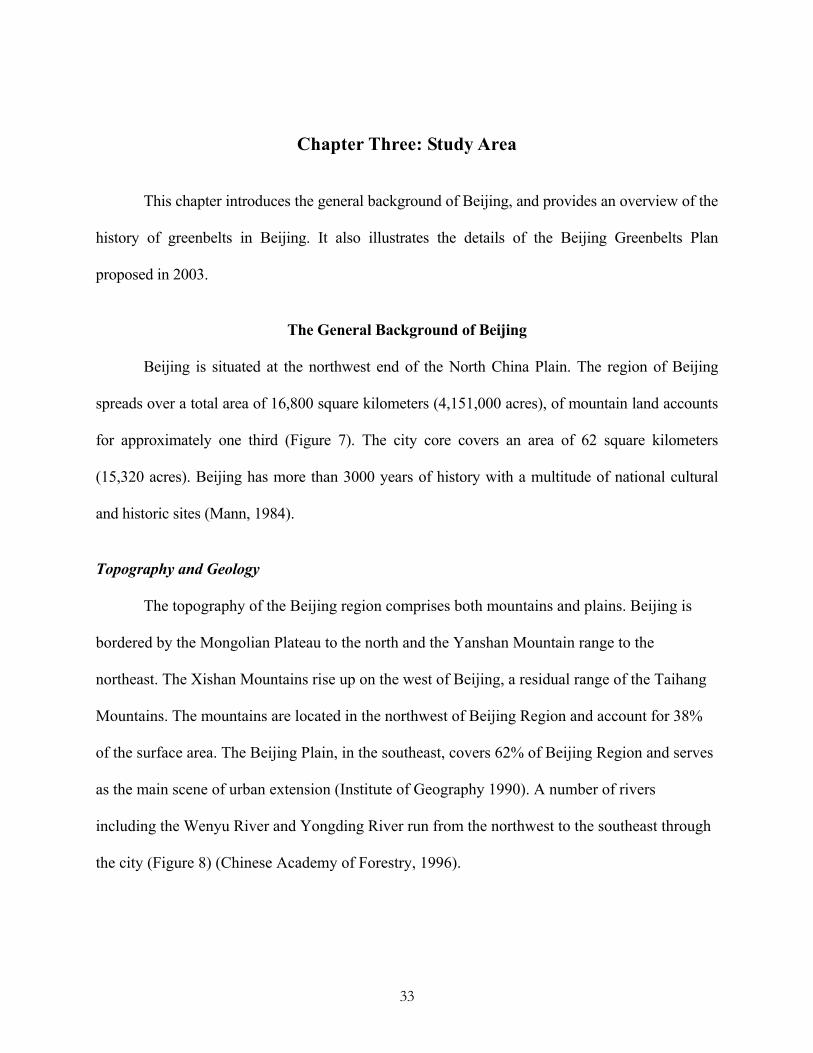
The topography of the Beijing region comprises both mountains and plains. Beijing is
bordered by the Mongolian Plateau to the north and the Yanshan Mountain range to the
northeast. The Xishan Mountains rise up on the west of Beijing, a residual range of the Taihang
Mountains. The mountains are located in the northwest of Beijing Region and account for 38%
of the surface area. The Beijing Plain, in the southeast, covers 62% of Beijing Region and serves
as the main scene of urban extension (Institute of Geography 1990). A number of rivers
including the Wenyu River and Yongding River run from the northwest to the southeast through
the city (Figure 8) (Chinese Academy of Forestry, 1996).
33
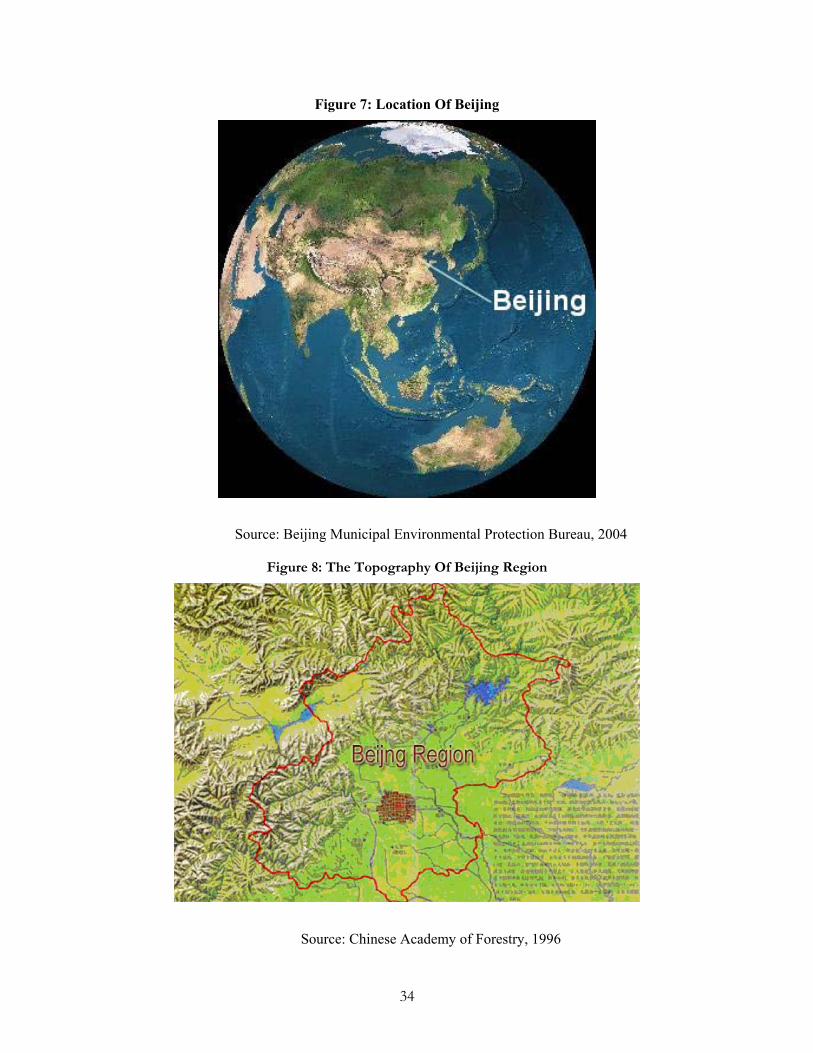
Figure 7: Location Of Beijing
Source: Beijing Municipal Environmental Protection Bureau, 2004
Figure 8: The Topography Of Beijing Region
Source: Chinese Academy of Forestry, 1996
34
Population
Beijing has a population of about 13.8 million with an average population density of 821
persons/km2. The urban and suburban regions are very heavily populated with 11 million
residents on one fourth of Beijing’s total landmass. The remaining people are spread over the
eight rural counties. In addition, it has a transient population of 3.295 million (Beijing Municipal
Statistical Bureau, 2002).
Although Beijing’s rate of population growth is stabilizing at around 2.5% annually due
to government policies to restrict fertility and movement, growth in absolute numbers continues
to soar. Figure 9 shows that Beijing had a population of approximately 8 million in 1970. By the
year 2005, that number is anticipated to have doubled to 16 million (Population Division of
United Nations, 1995).
Figure 9: Beijing’s Population 1970-2005
Source: Beijing Municipal Statistical Bureau, 1996
35
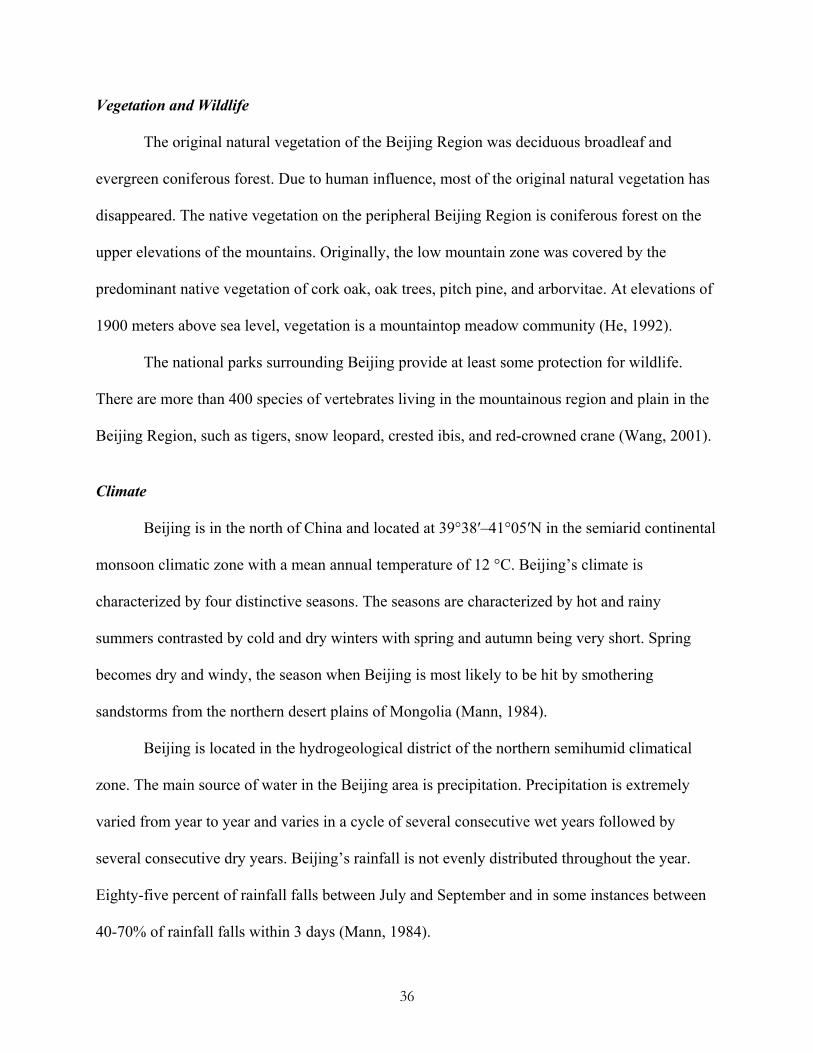
Vegetation and Wildlife
The original natural vegetation of the Beijing Region was deciduous broadleaf and
evergreen coniferous forest. Due to human influence, most of the original natural vegetation has
disappeared. The native vegetation on the peripheral Beijing Region is coniferous forest on the
upper elevations of the mountains. Originally, the low mountain zone was covered by the
predominant native vegetation of cork oak, oak trees, pitch pine, and arborvitae. At elevations of
1900 meters above sea level, vegetation is a mountaintop meadow community (He, 1992).
The national parks surrounding Beijing provide at least some protection for wildlife.
There are more than 400 species of vertebrates living in the mountainous region and plain in the
Beijing Region, such as tigers, snow leopard, crested ibis, and red-crowned crane (Wang, 2001).
Climate
Beijing is in the north of China and located at 39°38′–41°05′N in the semiarid continental
monsoon climatic zone with a mean annual temperature of 12 °C. Beijing’s climate is
characterized by four distinctive seasons. The seasons are characterized by hot and rainy
summers contrasted by cold and dry winters with spring and autumn being very short. Spring
becomes dry and windy, the season when Beijing is most likely to be hit by smothering
sandstorms from the northern desert plains of Mongolia (Mann, 1984).
Beijing is located in the hydrogeological district of the northern semihumid climatical
zone. The main source of water in the Beijing area is precipitation. Precipitation is extremely
varied from year to year and varies in a cycle of several consecutive wet years followed by
several consecutive dry years. Beijing’s rainfall is not evenly distributed throughout the year.
Eighty-five percent of rainfall falls between July and September and in some instances between
40-70% of rainfall falls within 3 days (Mann, 1984).
36
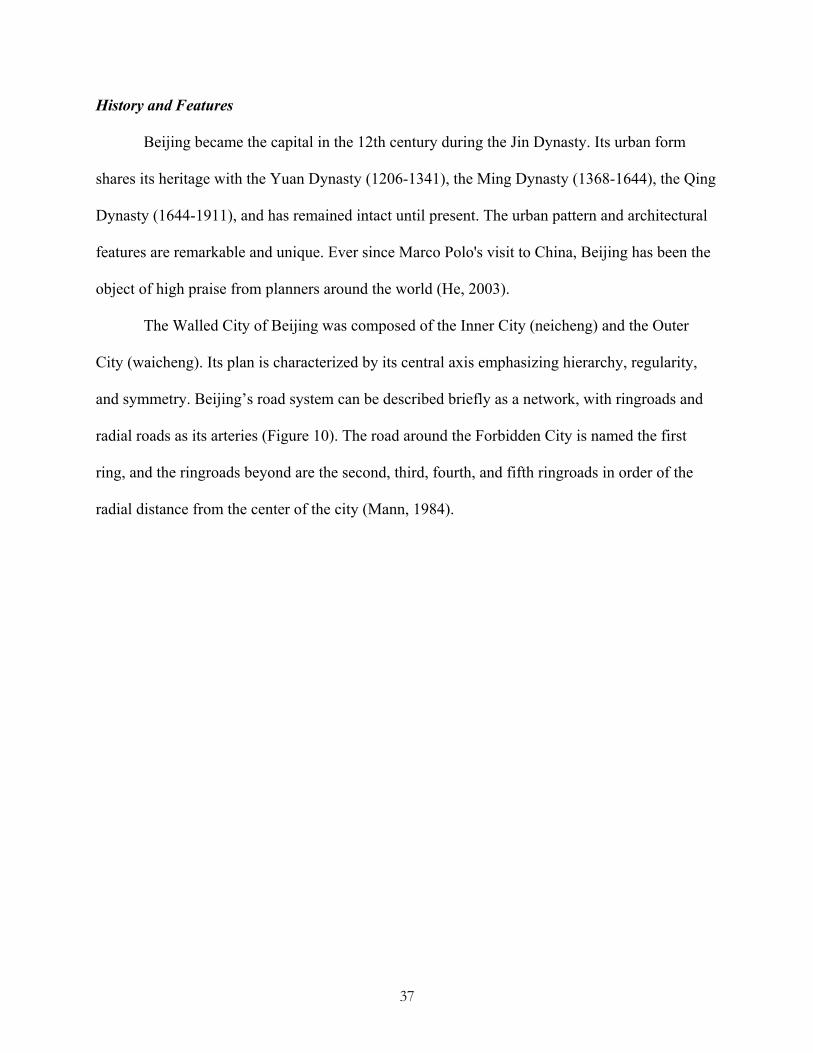
History and Features
Beijing became the capital in the 12th century during the Jin Dynasty. Its urban form
shares its heritage with the Yuan Dynasty (1206-1341), the Ming Dynasty (1368-1644), the Qing
Dynasty (1644-1911), and has remained intact until present. The urban pattern and architectural
features are remarkable and unique. Ever since Marco Polo's visit to China, Beijing has been the
object of high praise from planners around the world (He, 2003).
The Walled City of Beijing was composed of the Inner City (neicheng) and the Outer
City (waicheng). Its plan is characterized by its central axis emphasizing hierarchy, regularity,
and symmetry. Beijing’s road system can be described briefly as a network, with ringroads and
radial roads as its arteries (Figure 10). The road around the Forbidden City is named the first
ring, and the ringroads beyond are the second, third, fourth, and fifth ringroads in order of the
radial distance from the center of the city (Mann, 1984).
37
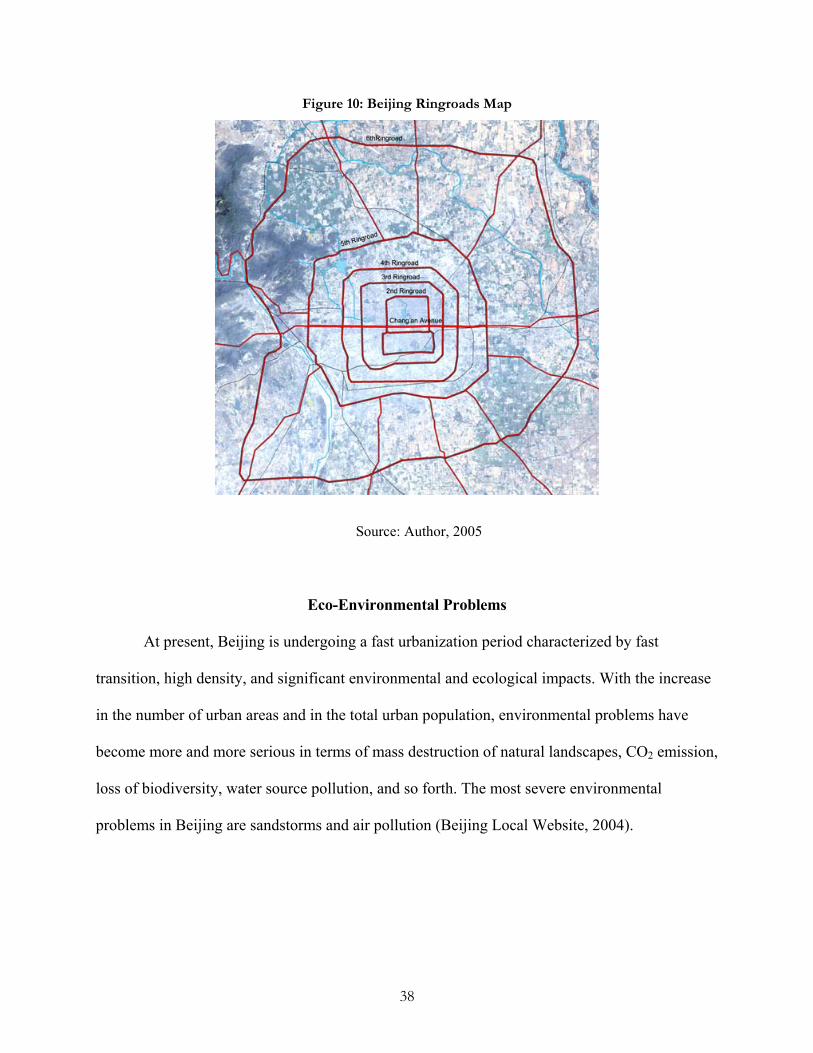
Figure 10: Beijing Ringroads Map
Source: Author, 2005
Eco-Environmental Problems
At present, Beijing is undergoing a fast urbanization period characterized by fast
transition, high density, and significant environmental and ecological impacts. With the increase
in the number of urban areas and in the total urban population, environmental problems have
become more and more serious in terms of mass destruction of natural landscapes, CO2 emission,
loss of biodiversity, water source pollution, and so forth. The most severe environmental
problems in Beijing are sandstorms and air pollution (Beijing Local Website, 2004).
38
Air Pollution
The air pollution of Beijing comes mainly from three sources: dust pollution, traffic
pollution and sulfur dioxide pollution, which are caused by urbanization and industrialization.
An important air pollutant source is coal burning. The consumption of coal in Beijing in 2000
was about 27 million tons. In addition, according to the Beijing Environmental Protection
Bureau (BEPB), around 10-15% of the inner city's 6 million residents still heat their homes with
coal-burning stoves in the winter (Beijing Academy of Environmental Sciences, 1998).
Heavy traffic also contributes to air pollution, and motor vehicle ownership is increasing.
The concentration of nitrogen oxides, suspended particulates, and photochemical pollution on
major traffic arteries has a severe impact on the physical and mental health of the inhabitants. In
addition, the air quality of Beijing is greatly affected by factories. More than one hundred polluting
factories exist in the urban area of Beijing (Cernet, 1997). The increased number of motor vehicles
in the city is responsible for the increase in ambient levels of NO2. The dominant sources of SO2 in
Beijing are heavy industries and power plants, which make up 72% per cent of total SO2
emissions.
The plans for the 2008 Beijing Olympics have catalyzed efforts to improve Beijing’s
environment. Beijing has adopted strict emission standards since 1999, which require a reduction
of emissions by 80%, and even stricter standards are planned to further reduce emissions by 60%
from 2004 to 2007 (Asian Development Bank, 2002). Consequently, the air quality is expected to
meet the National Grade II Standard which sets limit values for concentrations of SO2, NO2, CO
and particulate matter (PM). The regulated values and the calculated total emissions are shown in
Table 3. The actual pollutant concentrations and total emissions are given as well to make
39
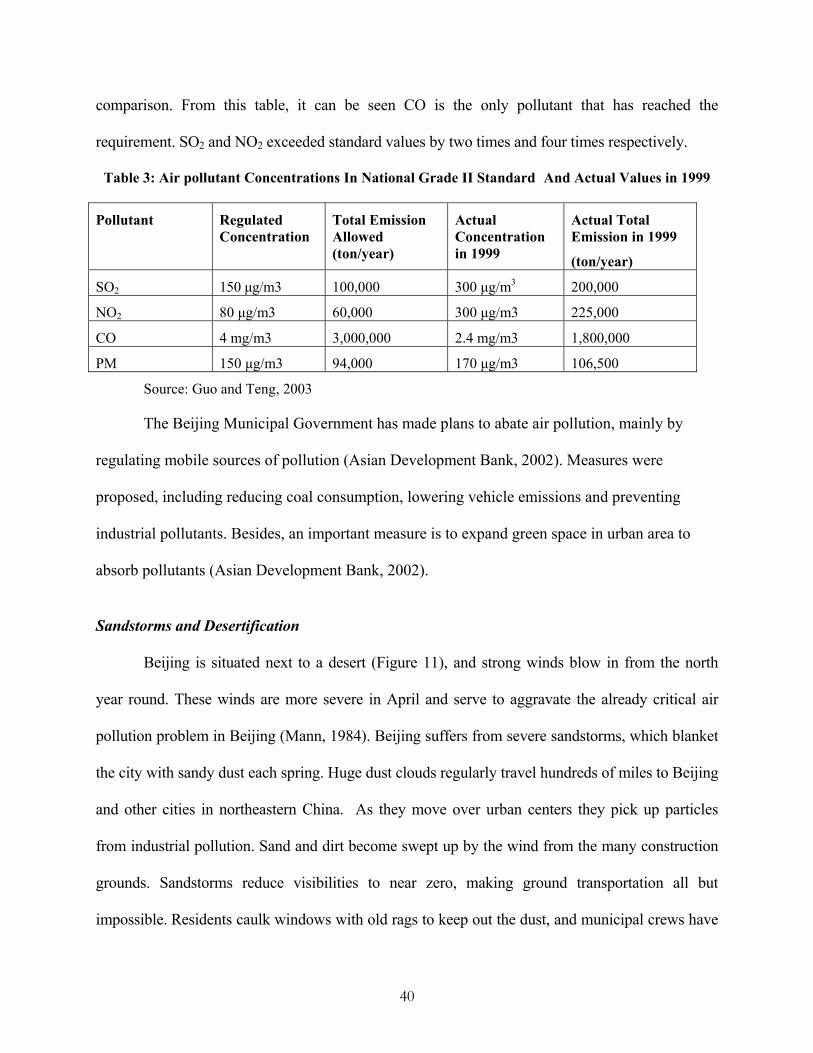
comparison. From this table, it can be seen CO is the only pollutant that has reached the
requirement. SO2 and NO2 exceeded standard values by two times and four times respectively.
Table 3: Air pollutant Concentrations In National Grade II Standard And Actual Values in 1999
Pollutant Regulated Concentration
Total Emission Allowed (ton/year)
Actual Concentration in 1999
Actual Total Emission in 1999
(ton/year)
SO2 150 µg/m3 100,000 300 µg/m3 200,000
NO2 80 µg/m3 60,000 300 µg/m3 225,000
CO 4 mg/m3 3,000,000 2.4 mg/m3 1,800,000
PM 150 µg/m3 94,000 170 µg/m3 106,500
Source: Guo and Teng, 2003
The Beijing Municipal Government has made plans to abate air pollution, mainly by
regulating mobile sources of pollution (Asian Development Bank, 2002). Measures were
proposed, including reducing coal consumption, lowering vehicle emissions and preventing
industrial pollutants. Besides, an important measure is to expand green space in urban area to
absorb pollutants (Asian Development Bank, 2002).
Sandstorms and Desertification
Beijing is situated next to a desert (Figure 11), and strong winds blow in from the north
year round. These winds are more severe in April and serve to aggravate the already critical air
pollution problem in Beijing (Mann, 1984). Beijing suffers from severe sandstorms, which blanket
the city with sandy dust each spring. Huge dust clouds regularly travel hundreds of miles to Beijing
and other cities in northeastern China. As they move over urban centers they pick up particles
from industrial pollution. Sand and dirt become swept up by the wind from the many construction
grounds. Sandstorms reduce visibilities to near zero, making ground transportation all but
impossible. Residents caulk windows with old rags to keep out the dust, and municipal crews have
40
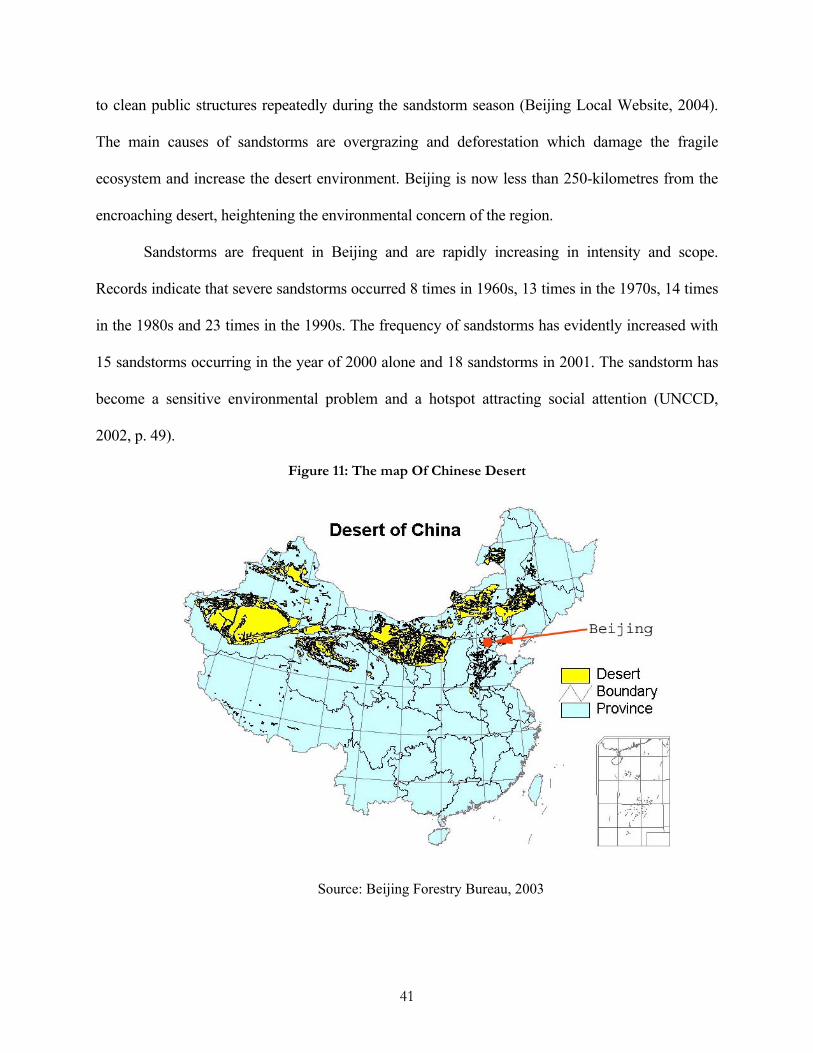
to clean public structures repeatedly during the sandstorm season (Beijing Local Website, 2004).
The main causes of sandstorms are overgrazing and deforestation which damage the fragile
ecosystem and increase the desert environment. Beijing is now less than 250-kilometres from the
encroaching desert, heightening the environmental concern of the region.
Sandstorms are frequent in Beijing and are rapidly increasing in intensity and scope.
Records indicate that severe sandstorms occurred 8 times in 1960s, 13 times in the 1970s, 14 times
in the 1980s and 23 times in the 1990s. The frequency of sandstorms has evidently increased with
15 sandstorms occurring in the year of 2000 alone and 18 sandstorms in 2001. The sandstorm has
become a sensitive environmental problem and a hotspot attracting social attention (UNCCD,
2002, p. 49).
Figure 11: The map Of Chinese Desert
Source: Beijing Forestry Bureau, 2003
41
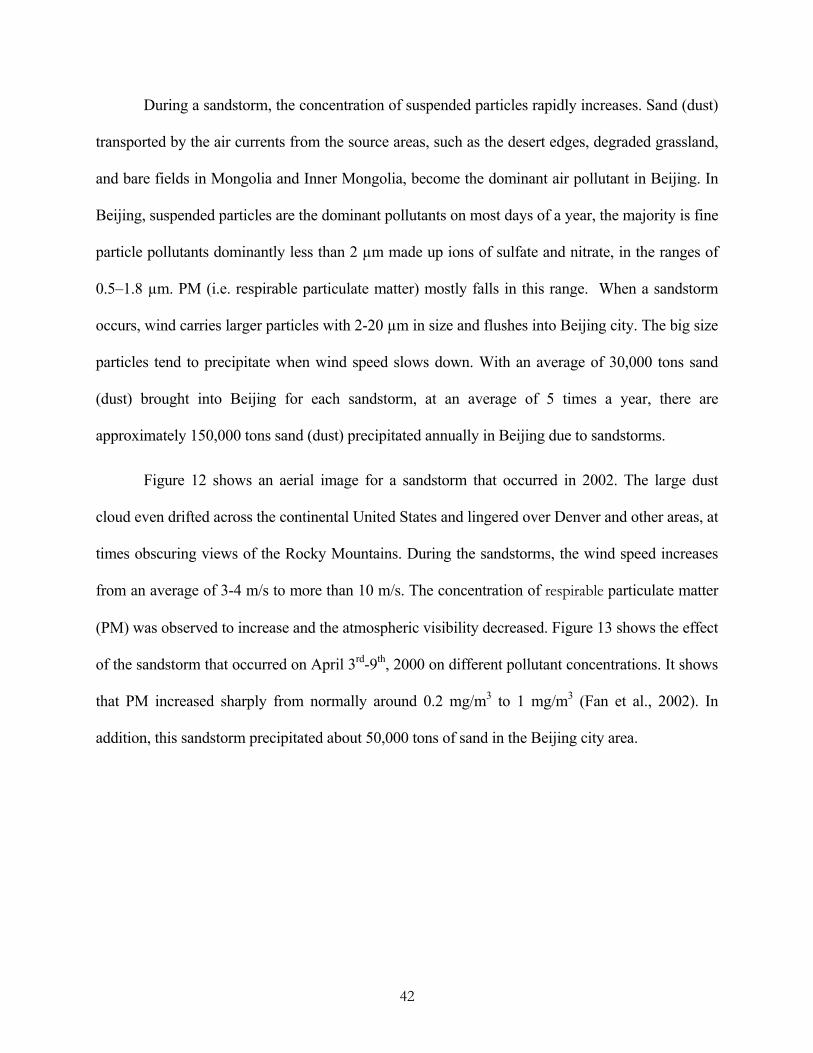
During a sandstorm, the concentration of suspended particles rapidly increases. Sand (dust)
transported by the air currents from the source areas, such as the desert edges, degraded grassland,
and bare fields in Mongolia and Inner Mongolia, become the dominant air pollutant in Beijing. In
Beijing, suspended particles are the dominant pollutants on most days of a year, the majority is fine
particle pollutants dominantly less than 2 µm made up ions of sulfate and nitrate, in the ranges of
0.5–1.8 µm. PM (i.e. respirable particulate matter) mostly falls in this range. When a sandstorm
occurs, wind carries larger particles with 2-20 µm in size and flushes into Beijing city. The big size
particles tend to precipitate when wind speed slows down. With an average of 30,000 tons sand
(dust) brought into Beijing for each sandstorm, at an average of 5 times a year, there are
approximately 150,000 tons sand (dust) precipitated annually in Beijing due to sandstorms.
Figure 12 shows an aerial image for a sandstorm that occurred in 2002. The large dust
cloud even drifted across the continental United States and lingered over Denver and other areas, at
times obscuring views of the Rocky Mountains. During the sandstorms, the wind speed increases
from an average of 3-4 m/s to more than 10 m/s. The concentration of respirable particulate matter
(PM) was observed to increase and the atmospheric visibility decreased. Figure 13 shows the effect
of the sandstorm that occurred on April 3rd-9th, 2000 on different pollutant concentrations. It shows
that PM increased sharply from normally around 0.2 mg/m3 to 1 mg/m3 (Fan et al., 2002). In
addition, this sandstorm precipitated about 50,000 tons of sand in the Beijing city area.
42
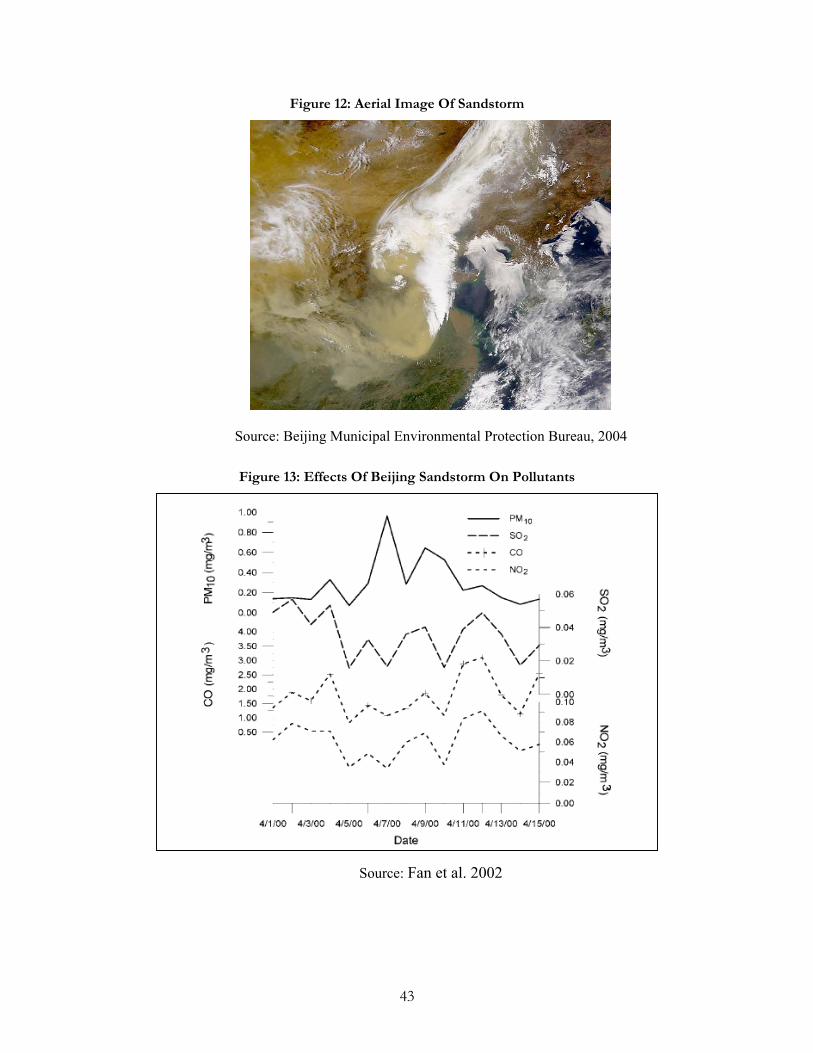
Figure 12: Aerial Image Of Sandstorm
Source: Beijing Municipal Environmental Protection Bureau, 2004
Figure 13: Effects Of Beijing Sandstorm On Pollutants
Source: Fan et al. 2002
43
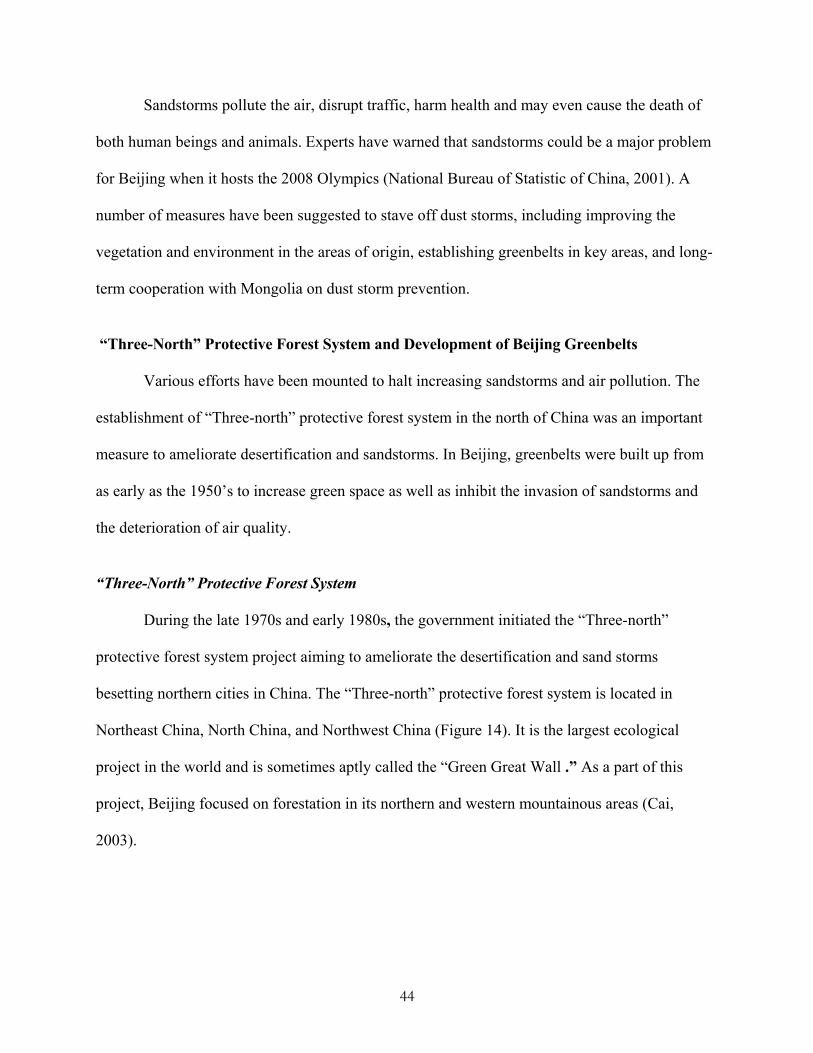
Sandstorms pollute the air, disrupt traffic, harm health and may even cause the death of
both human beings and animals. Experts have warned that sandstorms could be a major problem
for Beijing when it hosts the 2008 Olympics (National Bureau of Statistic of China, 2001). A
number of measures have been suggested to stave off dust storms, including improving the
vegetation and environment in the areas of origin, establishing greenbelts in key areas, and long-
term cooperation with Mongolia on dust storm prevention.
“Three-North” Protective Forest System and Development of Beijing Greenbelts
Various efforts have been mounted to halt increasing sandstorms and air pollution. The
establishment of “Three-north” protective forest system in the north of China was an important
measure to ameliorate desertification and sandstorms. In Beijing, greenbelts were built up from
as early as the 1950’s to increase green space as well as inhibit the invasion of sandstorms and
the deterioration of air quality.
“Three-North” Protective Forest System
During the late 1970s and early 1980s, the government initiated the “Three-north”
protective forest system project aiming to ameliorate the desertification and sand storms
besetting northern cities in China. The “Three-north” protective forest system is located in
Northeast China, North China, and Northwest China (Figure 14). It is the largest ecological
project in the world and is sometimes aptly called the “Green Great Wall .” As a part of this
project, Beijing focused on forestation in its northern and western mountainous areas (Cai,
2003).
44
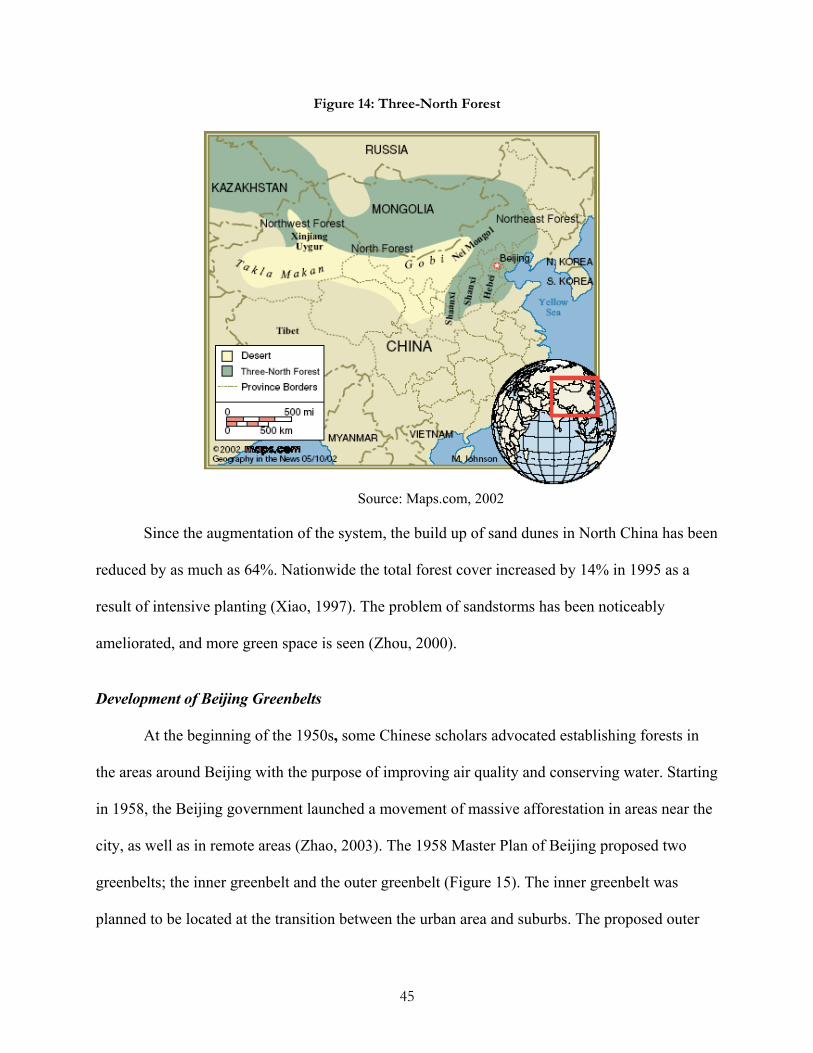
Figure 14: Three-North Forest
Source: Maps.com, 2002
Since the augmentation of the system, the build up of sand dunes in North China has been
reduced by as much as 64%. Nationwide the total forest cover increased by 14% in 1995 as a
result of intensive planting (Xiao, 1997). The problem of sandstorms has been noticeably
ameliorated, and more green space is seen (Zhou, 2000).
Development of Beijing Greenbelts
At the beginning of the 1950s, some Chinese scholars advocated establishing forests in
the areas around Beijing with the purpose of improving air quality and conserving water. Starting
in 1958, the Beijing government launched a movement of massive afforestation in areas near the
city, as well as in remote areas (Zhao, 2003). The 1958 Master Plan of Beijing proposed two
greenbelts; the inner greenbelt and the outer greenbelt (Figure 15). The inner greenbelt was
planned to be located at the transition between the urban area and suburbs. The proposed outer
45
greenbelt was planned to be located at the transition between the city and the rural area (Beijing
Annals Editorial Board, 2000).
In the early 1980s, green space development in Beijing was transformed from
government-oriented to a market-oriented policy after the economic reform, and the opening-up
policy has been occurred. The greenbelt area was opened to private commercial development
(Beijing Forestry Bureau, 2003). As a result, the greenbelt areas created in the previous planning
were fragmented by urban development and industrialization. The existing greenbelt was
fragmented by overwhelming urbanization (Zhu & Wu, 1995). For example, the total area of the
inner greenbelt was 314 km2 in the 1958 Master Plan, but it had shrunk to 241.37 km2 by 1999
(Li, 2002).
Figure 15: 1958 Master Plan
Source: Beijing Annals Editorial Board, 2000
46
The Beijing Greenbelts Plan
To promote a sustainable ecosystem, as well as control the expansion of the urban area on
the basis of existing planning, the Beijing Greenbelts Plan was developed by the Beijing
Municipal Institute of City Planning and Design in 2003. The plan focuses on alleviating the
sandstorms and improving air quality by developing greenbelts. With Beijing hosting the
Olympic Game in 2008, the plan is expected to create an attractive environment for the games
(Chen et, 1998). According to the plan, three greenbelts will be established in urban, suburb
(plain), and mountain areas respectively (Li, 2002). An annual investment of 600 million Yuan
(US$72.3 million) will be allocated to the project from the municipal government (Beijing
Forestry Bureau, 2003).
The major goal of the Beijing Greenbelts Plan is to build a sound ecological basis for the
city by developing more forested areas, hampering sandstorms and preventing air pollution. The
three greenbelts will be completed by 2007. The construction of the greenbelts is expected to
increase forest coverage by 50% in the city area, and to reduce PM, SO2, NO2 and CO
concentrations in the air. The air quality is expected to meet the National Grade II Standard that
sets limit values for concentrations of SO2, NO2, CO and particulate matter (PM).
47
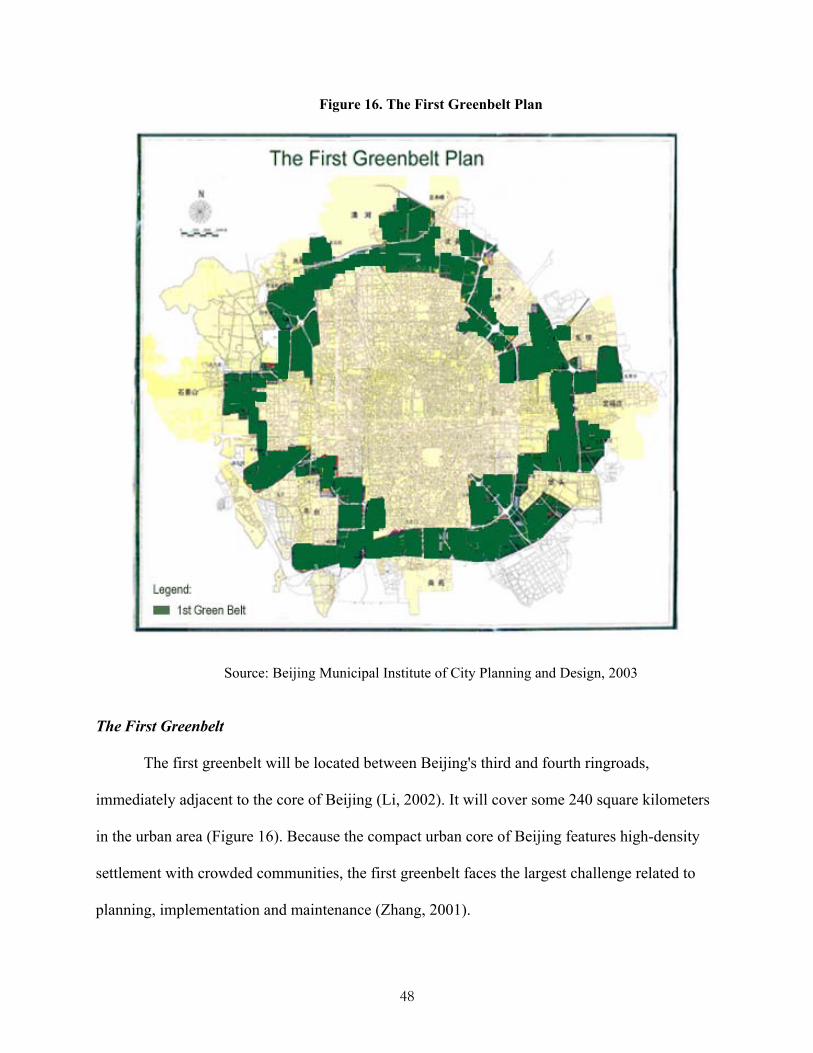
Figure 16. The First Greenbelt Plan
Source: Beijing Municipal Institute of City Planning and Design, 2003
The First Greenbelt
The first greenbelt will be located between Beijing's third and fourth ringroads,
immediately adjacent to the core of Beijing (Li, 2002). It will cover some 240 square kilometers
in the urban area (Figure 16). Because the compact urban core of Beijing features high-density
settlement with crowded communities, the first greenbelt faces the largest challenge related to
planning, implementation and maintenance (Zhang, 2001).
48
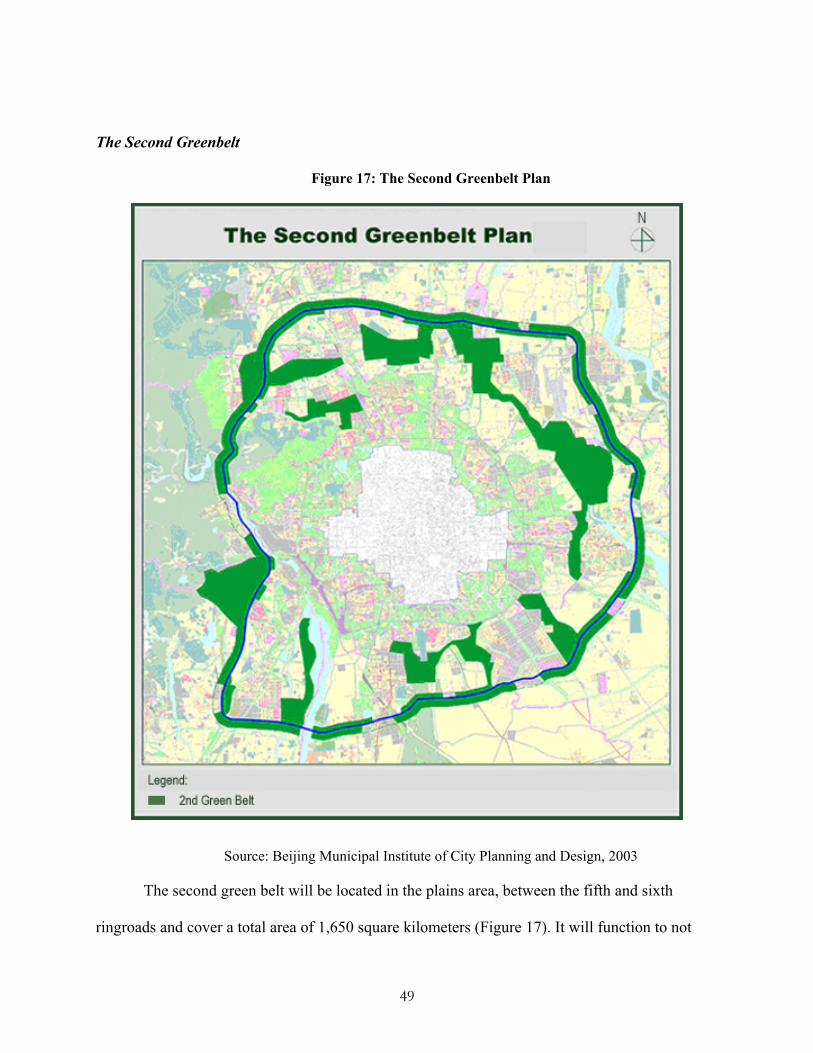
The Second Greenbelt
Figure 17: The Second Greenbelt Plan
Source: Beijing Municipal Institute of City Planning and Design, 2003
The second green belt will be located in the plains area, between the fifth and sixth
ringroads and cover a total area of 1,650 square kilometers (Figure 17). It will function to not
49
only improve urban environmental quality but also limit future urban expansion. Arbor trees will
be planted along a 200-meter stretch on both sides of city roads. The second greenbelt is
composed of the green circle, greenways, nine green wedges, and five community parks. The
greenways are linear networks along two major rivers (the WenYu River and the Yongding
River), and will serve to create corridors that link the surrounding green space (Zhao, 2003).
The nine green wedges and community parks are proposed in both suburbs and urban
areas. The green wedges are composed of parks, gardens, forest patches, farmlands, rivers, and
wetlands. These green wedges and green corridors form an integrated ecological network by
connecting the urban center, mountain forest and outer regional green space. The green wedges
and community parks proposed at the city scale are shown in Figure 18.
50
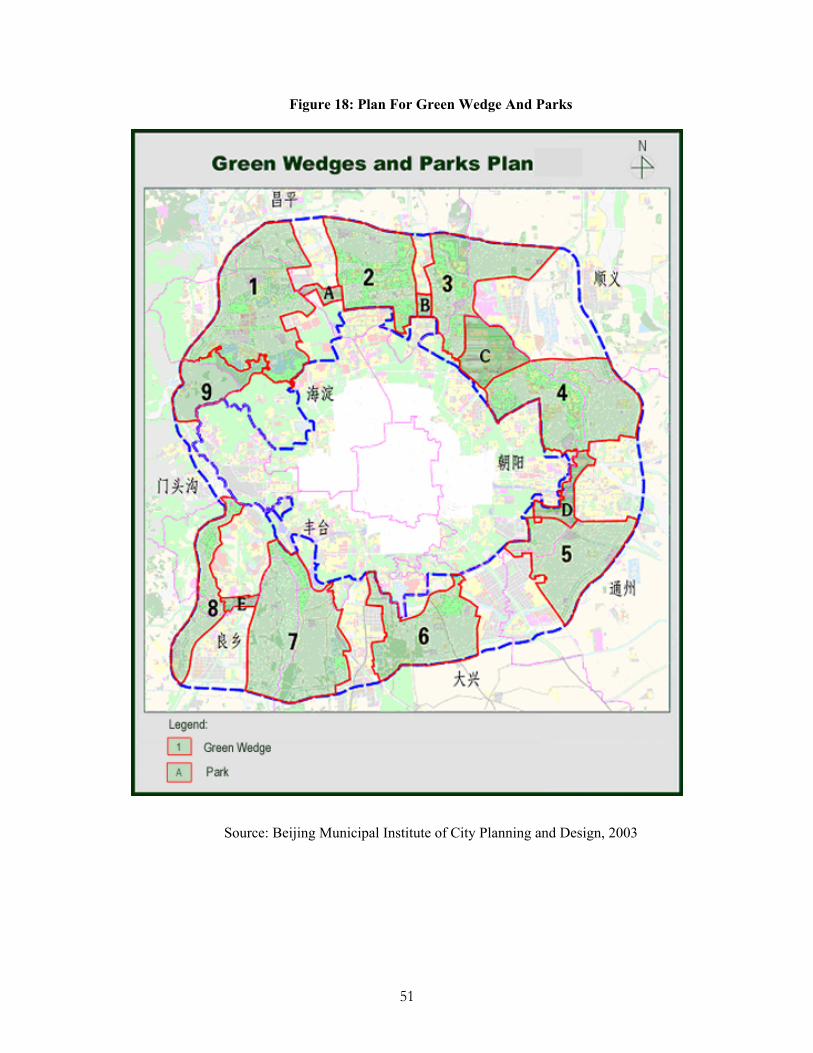
Figure 18: Plan For Green Wedge And Parks
Source: Beijing Municipal Institute of City Planning and Design, 2003
51
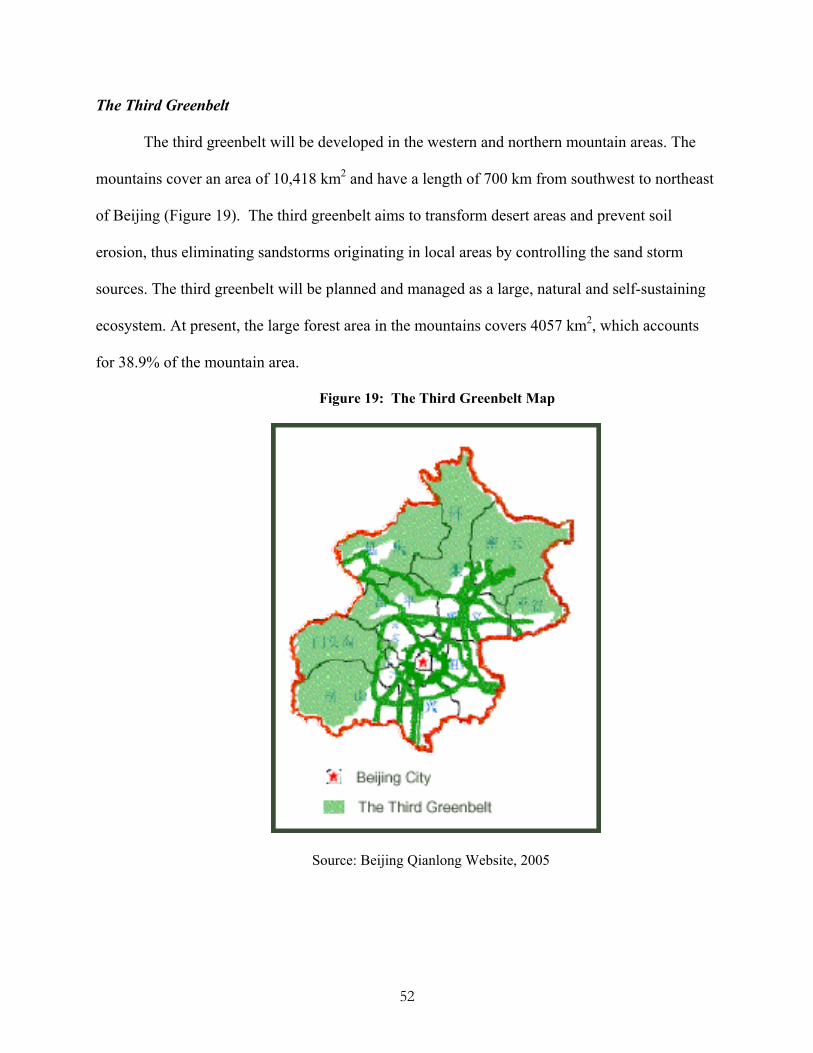
The Third Greenbelt
The third greenbelt will be developed in the western and northern mountain areas. The
mountains cover an area of 10,418 km2 and have a length of 700 km from southwest to northeast
of Beijing (Figure 19). The third greenbelt aims to transform desert areas and prevent soil
erosion, thus eliminating sandstorms originating in local areas by controlling the sand storm
sources. The third greenbelt will be planned and managed as a large, natural and self-sustaining
ecosystem. At present, the large forest area in the mountains covers 4057 km2, which accounts
for 38.9% of the mountain area.
Figure 19: The Third Greenbelt Map
Source: Beijing Qianlong Website, 2005
52
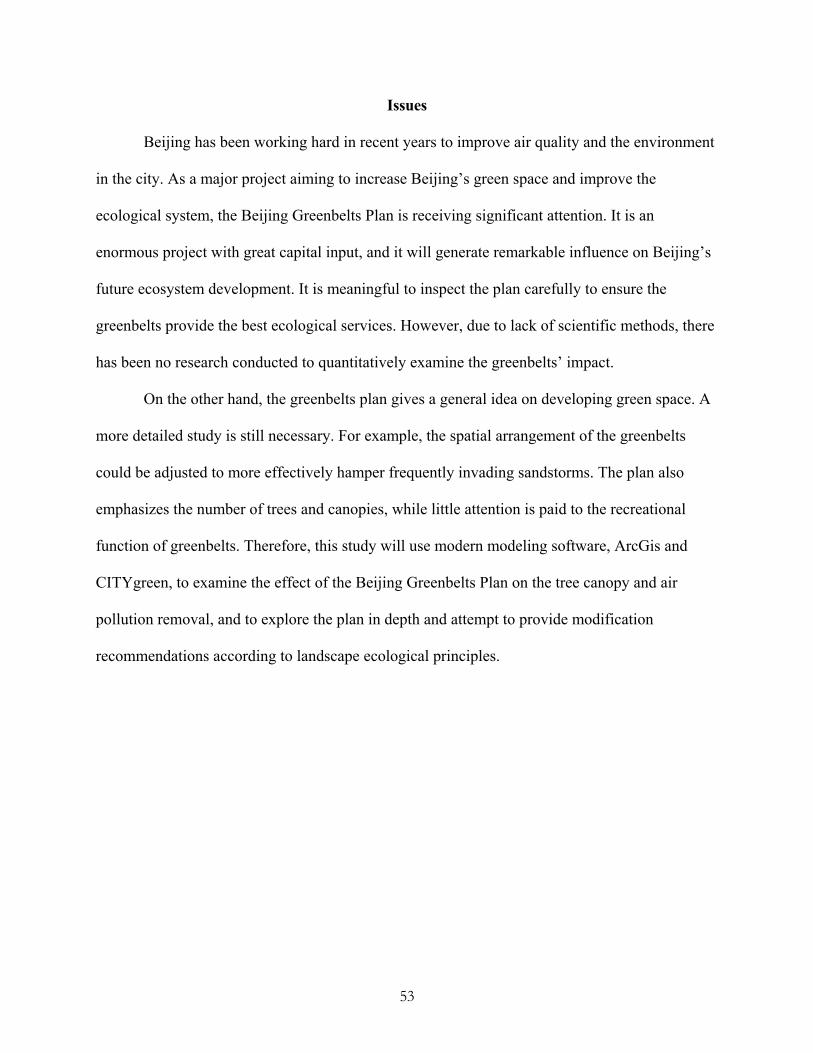
Issues
Beijing has been working hard in recent years to improve air quality and the environment
in the city. As a major project aiming to increase Beijing’s green space and improve the
ecological system, the Beijing Greenbelts Plan is receiving significant attention. It is an
enormous project with great capital input, and it will generate remarkable influence on Beijing’s
future ecosystem development. It is meaningful to inspect the plan carefully to ensure the
greenbelts provide the best ecological services. However, due to lack of scientific methods, there
has been no research conducted to quantitatively examine the greenbelts’ impact.
On the other hand, the greenbelts plan gives a general idea on developing green space. A
more detailed study is still necessary. For example, the spatial arrangement of the greenbelts
could be adjusted to more effectively hamper frequently invading sandstorms. The plan also
emphasizes the number of trees and canopies, while little attention is paid to the recreational
function of greenbelts. Therefore, this study will use modern modeling software, ArcGis and
CITYgreen, to examine the effect of the Beijing Greenbelts Plan on the tree canopy and air
pollution removal, and to explore the plan in depth and attempt to provide modification
recommendations according to landscape ecological principles.
53
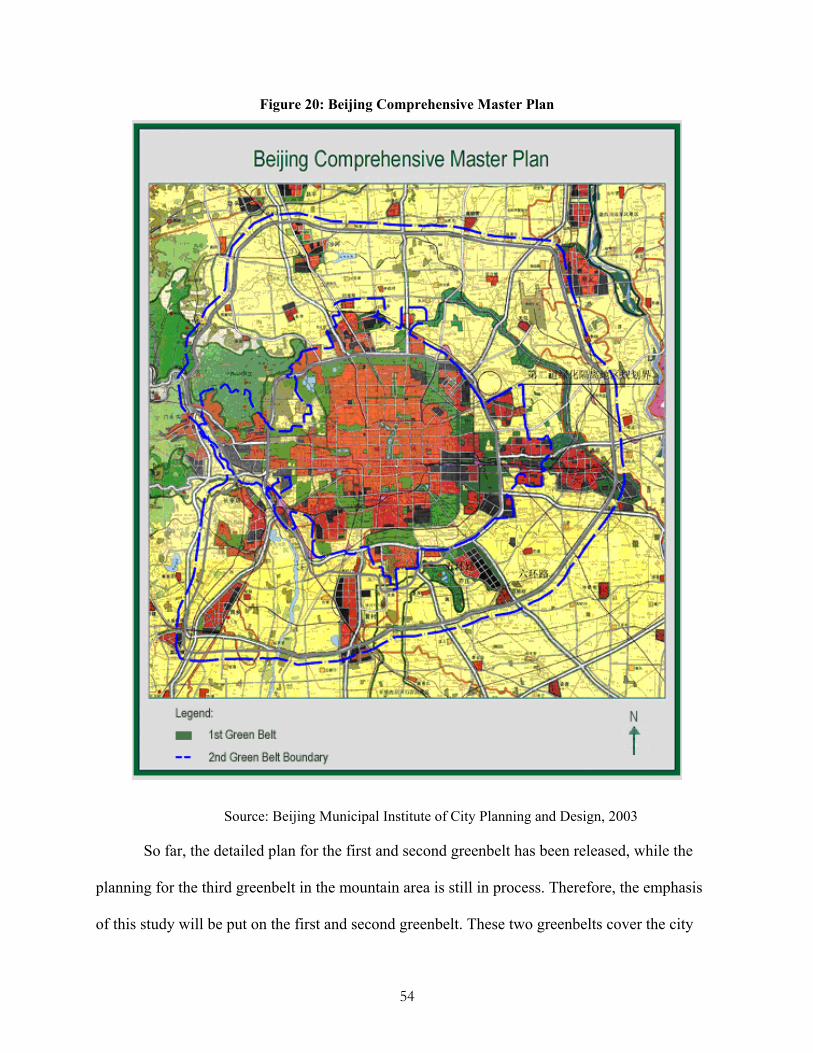
Figure 20: Beijing Comprehensive Master Plan
Source: Beijing Municipal Institute of City Planning and Design, 2003
So far, the detailed plan for the first and second greenbelt has been released, while the
planning for the third greenbelt in the mountain area is still in process. Therefore, the emphasis
of this study will be put on the first and second greenbelt. These two greenbelts cover the city
54
area, including the urban area of Beijing with its suburbs, as well as the surrounding peri-urban
zone (Figure 20).
In addition, in support of greenbelts project, Beijing has proposed some other greening
projects to provide more green space (Zhang, 2001). For instance, the City Street Green Project
proposes a green ring along the internal side of the second ringroad. The Olympic Green Park
aims to build up a large scale park near the site of athlete village. Because the official
information is very limited, the latter green space will not be included during the analysis. This is
reasonable considering the predominant role the greenbelts will play in Beijing’s green space
system.
Summary
Due to desertification and urbanization, Beijing is facing serious environmental problems
such as sandstorms and air pollution. To improve the environment, the Beijing Greenbelts Plan
was developed. Three greenbelts will be built- up by 2007 in urban, suburb (plain), and mountain
areas. The construction of the greenbelts will improve air quality and hamper the sandstorms
and contribute to a successful “Green Olympic” event in 2008. In-depth study is needed to
improve the plan for providing the best ecological service. Modern modeling tools such as GIS
and CITYgreen are necessary to simulate the mechanism and anticipate its impact on air quality.
55
Chapter Four: Methodology
This chapter describes the methodology and the procedures employed in the research.
The research was conducted in three steps: The first step was to prepare data. Secondly, three
scenarios were created and analysis was conducted with CITYgreen software. In the final step
the three scenarios were compared and the analysis results were discussed. In this chapter, the
first section introduces the method of modeling three scenarios. The second section introduces
the data preparation methods. The third section presents the procedures employed in CITYgreen.
A flow chart presents information in the fourth section to provide an overview of the analysis.
Modeling Scenario and Analysis
Three spatial scenarios providing descriptive and visual information of greenbelts were
created to analyze the impact of urban green space. The three scenarios include EXISTING
GREEN SPACE IN 1999, THE BEIJING GREENBELTS PLAN, and IMPROVED
GREENBELTS.
The First Scenario: THE EXISTING GREEN SPACE OF BEIJING IN 1999
The first scenario was to analyze the existing green space of Beijing in 1999. The study
area of Beijing were defined according to the boundary in the map of Beijing Comprehensive Plan.
By clipping the original raster data, the city raster data were obtained for CITYgreen analysis.
CITYgreen software can convert the raster data to their own identifying categories and calculate
the environmental indicators, including tree canopy, air pollution removal, carbon storage and
sequestration values. These environmental indicators for Beijing in 1999 are the baseline before the
Beijing Greenbelts Plan.
56
The Second Scenario: THE BEIJING GREENBELTS PLAN
The second scenario was created to analyze the impact of the Beijing Greenbelts Plan.
Because CITYgreen software can only identify its own categories, appropriate raster data was
created for CITYgreen analysis. The strategy of preparing the appropriate raster data was to
convert city raster data to a polygon and then edit its attributes. The purpose of editing the
attributes was to create a new category for raster conversion. The raster data of greenbelts was
created using Arc Map. By using CITYgreen, a statistic report on the area of tree canopy and the
amount of air pollution removal were generated.
The Third Scenario: IMPROVED GREENBELTS
To improve the Beijing Greenbelts Plan, the third scenario was developed based on the
landscape ecology principles and strategies applied in the case studies presented in Literature
Review. The scenario development and analysis was conducted at three different levels: region
level, city level, and neighborhood level.
At the region level, two approaches were proposed to improve the Beijing Greenbelts
Plan: widening edges on the sides facing the predominant wind direction and leaving the south
side open.
At the city level, two methods were suggested: creating green network connectivity and
build up buffer zones along roads and rivers. 100-meter-wide tree buffers along rivers and roads
and a 50-meter wide tree buffer along the city central axis were developed.
At the neighborhood level, the analysis included two sections: Section 1 was to study an
example site (a basic unit cell) in the urban core. Section 2 was to analyze the whole urban core
57
area according to the results found in Section 1. By manipulating ArcGis and CITYgreen, the
amount of tree canopy and air pollution removal in each unit cell zone were estimated.
Data Preparation
This study used Landsat image data to detect the spatial patterns of the land use and
landcover. The Landsat image of Beijing was taken in the summer of 1999. It was multi-spectral
satellite imagery with high resolution in order to provide detailed and reliable information about
the region’s landcover features, especially tree canopy.
The Landsat image was processed by using unsupervised reclassification in PCI Image
Processing software, ISO_ Cluster Program. Landcover was grouped into categories based on
the landcover categories system used by the U.S. Geological Survey (USGS) in the U.S. national
landcover data. Eight landcover types were classified to represent the feature of Beijing’s
landcover.
According to the Beijing Greenbelts Plan, a unionized layer of greenbelts was created by
individually digitizing the three greenbelts in ArcGis. To provide descriptive and visual
information of Beijing, the key features of major roads, rivers, lakes, and parks were also
digitized.
CITYgreen Processing
CITYgreen software converts input landcover data to its identifying categories and
generates the statistics report of the landcover and environmental indicators. In CITYgreen
report, the landcover section summarizes the percentage of different landcover categories by
showing a pie chart of the landcover composition. In addition, the report shows the
58

environmental indicators including air pollution removal, carbon storage, and sequestration
(CITYgreen User Manual, 2004).
In CITYgreen, Washington, D.C. was used as the reference city to calculate dollar values.
The reason is that Washington, D.C. and Beijing have similar features in geography and climate.
They are both adjacent to oceans and have continental monsoon climate.
Overview of Procedures
Data preparation was the first stage of the study. Then three scenarios were created, and
statistics reports were generated by CITYgreen. The final stage of the research was to compare
three scenarios from a quantitative, and other considerations were presented based on landscape
ecological principles. Figure 21 is the analysis flow chart for this study.
59
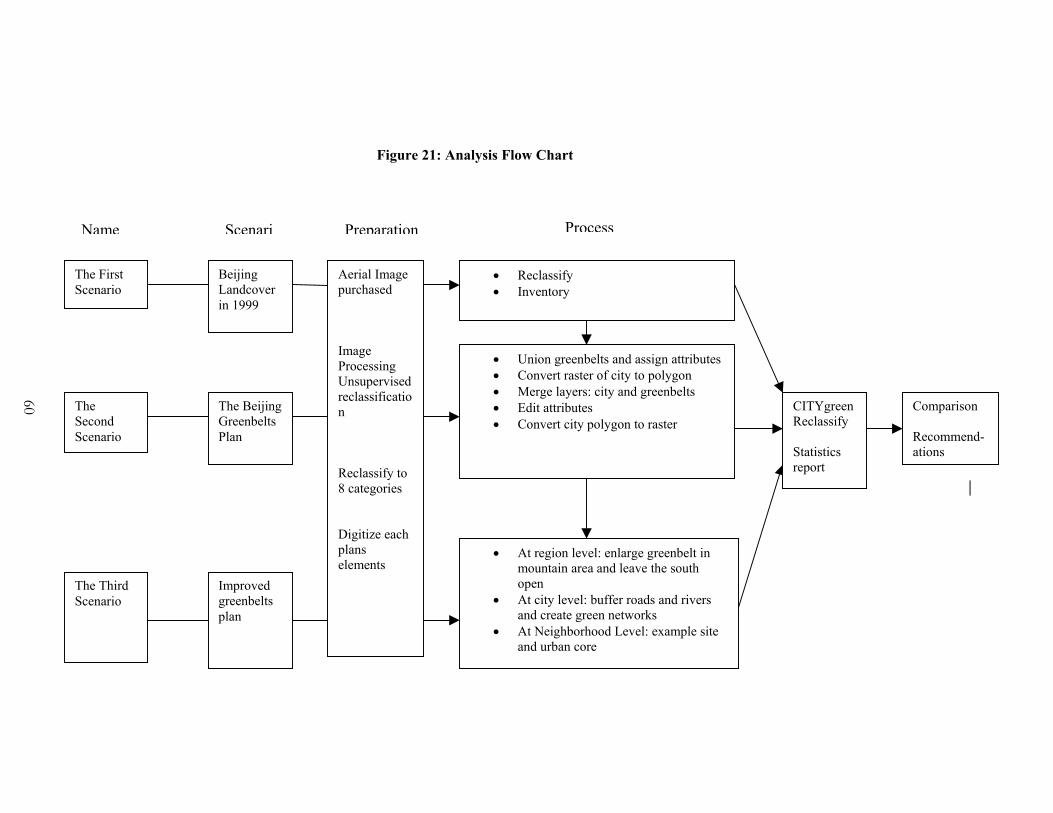
Figure 21: Analysis Flow Chart
ProcessName Scenari Preparation
The First Scenario
Beijing Landcover in 1999
Aerial Image purchased Image Processing Unsupervised reclassification Reclassify to 8 categories Digitize each plans elements
• Reclassify • Inventory
• Union greenbelts and assign attributes• Convert raster of city to polygon • Merge layers: city and greenbelts • Edit attributes • Convert city polygon to raster
60 The Second Scenario
The Beijing Greenbelts Plan
CITYgreenReclassify Statistics report
Comparison Recommend-ations
• At region level: enlarge greenbelt in mountain area and leave the south open
• At city level: buffer roads and rivers and create green networks
• At Neighborhood Level: example site and urban core
The Third Scenario
Improved greenbelts plan
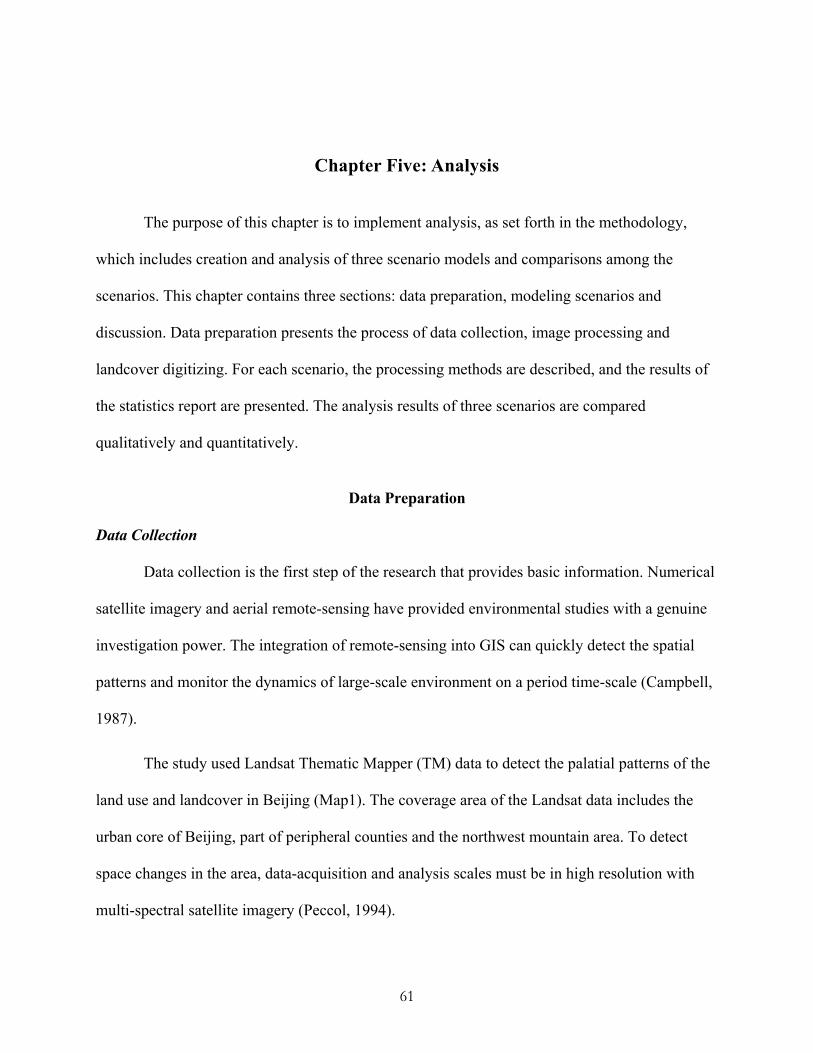
Chapter Five: Analysis
The purpose of this chapter is to implement analysis, as set forth in the methodology,
which includes creation and analysis of three scenario models and comparisons among the
scenarios. This chapter contains three sections: data preparation, modeling scenarios and
discussion. Data preparation presents the process of data collection, image processing and
landcover digitizing. For each scenario, the processing methods are described, and the results of
the statistics report are presented. The analysis results of three scenarios are compared
qualitatively and quantitatively.
Data Preparation
Data Collection
Data collection is the first step of the research that provides basic information. Numerical
satellite imagery and aerial remote-sensing have provided environmental studies with a genuine
investigation power. The integration of remote-sensing into GIS can quickly detect the spatial
patterns and monitor the dynamics of large-scale environment on a period time-scale (Campbell,
1987).
The study used Landsat Thematic Mapper (TM) data to detect the palatial patterns of the
land use and landcover in Beijing (Map1). The coverage area of the Landsat data includes the
urban core of Beijing, part of peripheral counties and the northwest mountain area. To detect
space changes in the area, data-acquisition and analysis scales must be in high resolution with
multi-spectral satellite imagery (Peccol, 1994).
61
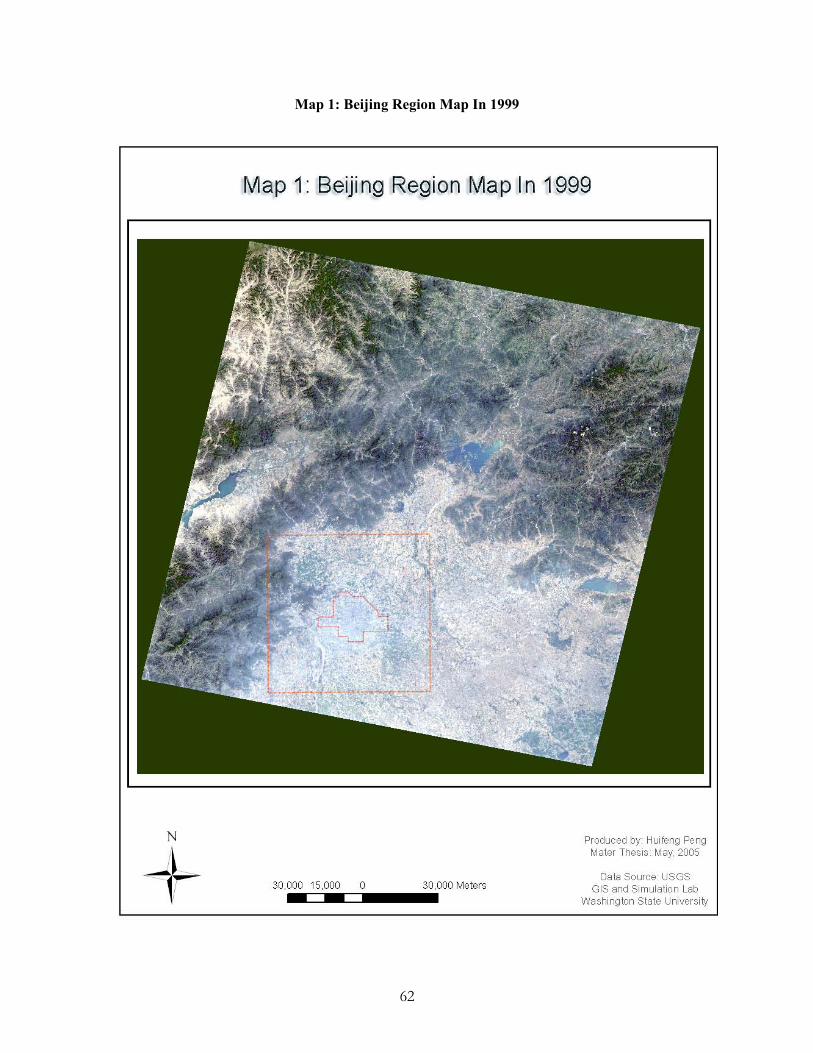
Map 1: Beijing Region Map In 1999
62
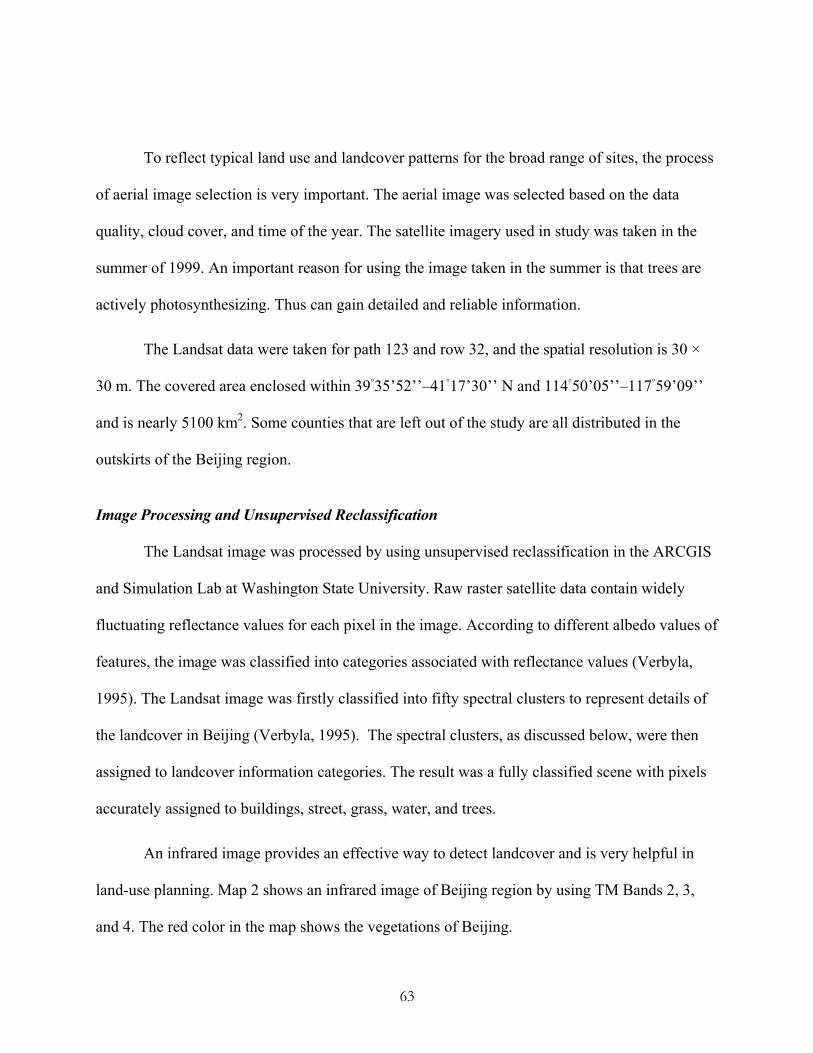
To reflect typical land use and landcover patterns for the broad range of sites, the process
of aerial image selection is very important. The aerial image was selected based on the data
quality, cloud cover, and time of the year. The satellite imagery used in study was taken in the
summer of 1999. An important reason for using the image taken in the summer is that trees are
actively photosynthesizing. Thus can gain detailed and reliable information.
The Landsat data were taken for path 123 and row 32, and the spatial resolution is 30 ×
30 m. The covered area enclosed within 39◦35’52’’–41◦17’30’’ N and 114◦50’05’’–117◦59’09’’
and is nearly 5100 km2. Some counties that are left out of the study are all distributed in the
outskirts of the Beijing region.
Image Processing and Unsupervised Reclassification
The Landsat image was processed by using unsupervised reclassification in the ARCGIS
and Simulation Lab at Washington State University. Raw raster satellite data contain widely
fluctuating reflectance values for each pixel in the image. According to different albedo values of
features, the image was classified into categories associated with reflectance values (Verbyla,
1995). The Landsat image was firstly classified into fifty spectral clusters to represent details of
the landcover in Beijing (Verbyla, 1995). The spectral clusters, as discussed below, were then
assigned to landcover information categories. The result was a fully classified scene with pixels
accurately assigned to buildings, street, grass, water, and trees.
An infrared image provides an effective way to detect landcover and is very helpful in
land-use planning. Map 2 shows an infrared image of Beijing region by using TM Bands 2, 3,
and 4. The red color in the map shows the vegetations of Beijing.
63
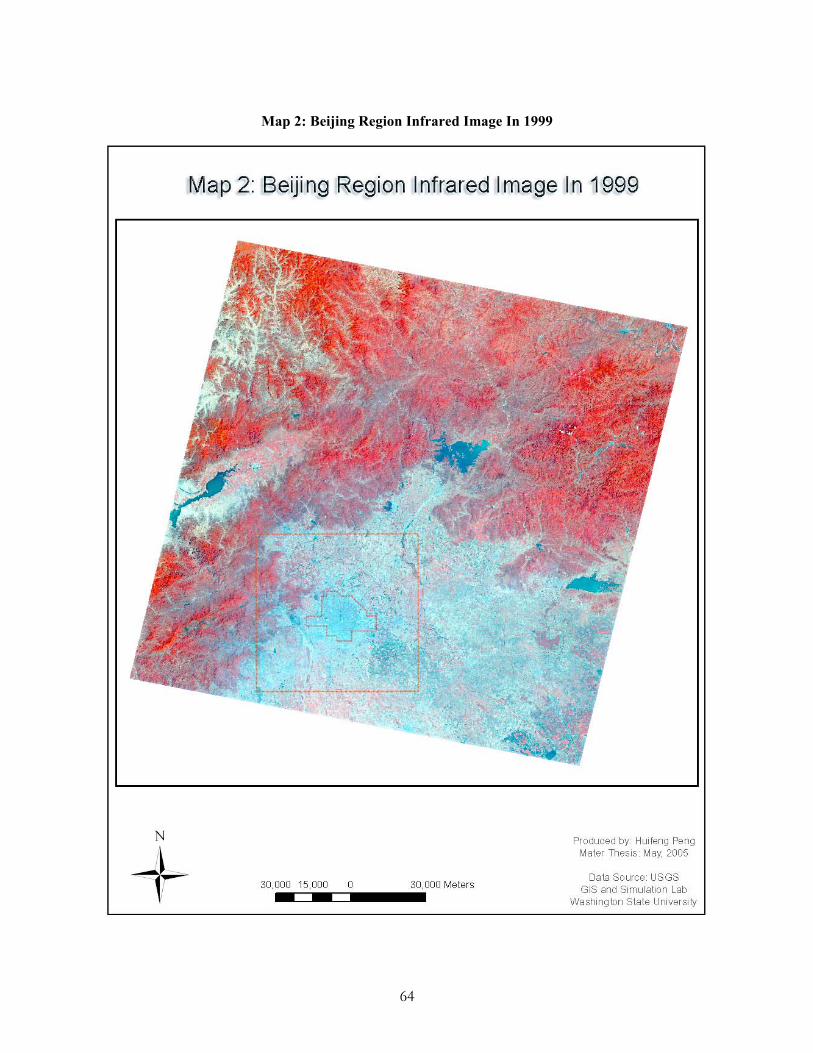
Map 2: Beijing Region Infrared Image In 1999
64
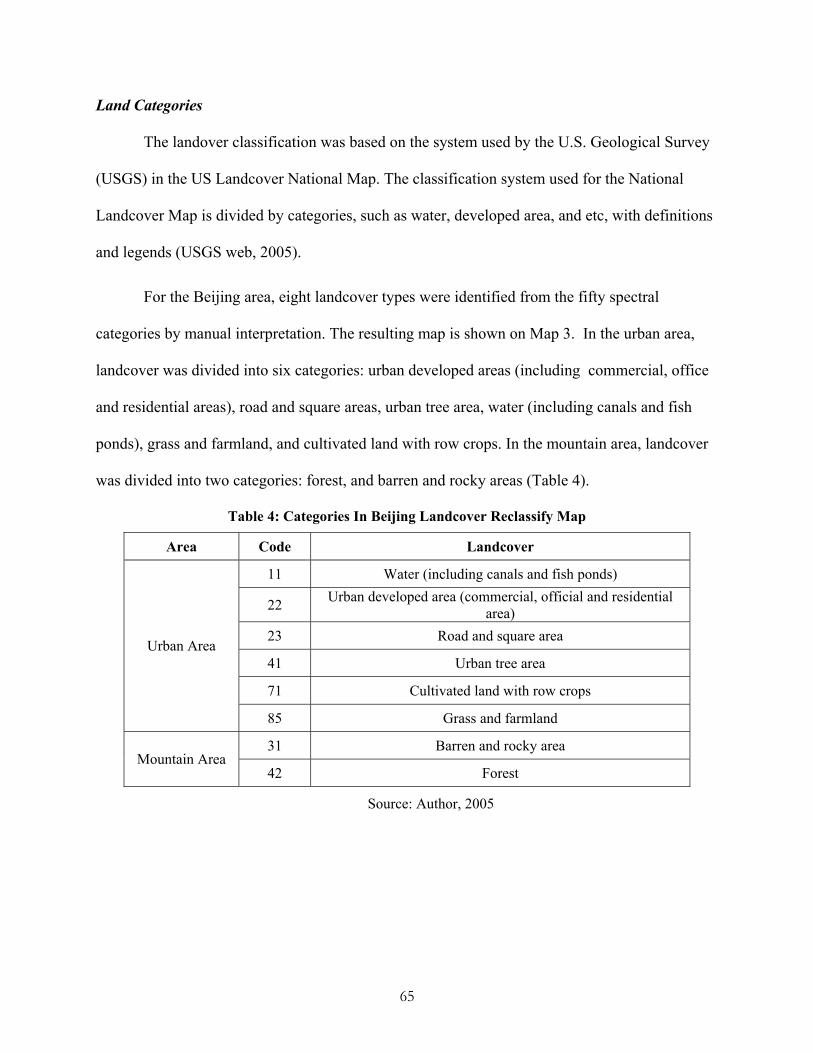
Land Categories
The landover classification was based on the system used by the U.S. Geological Survey
(USGS) in the US Landcover National Map. The classification system used for the National
Landcover Map is divided by categories, such as water, developed area, and etc, with definitions
and legends (USGS web, 2005).
For the Beijing area, eight landcover types were identified from the fifty spectral
categories by manual interpretation. The resulting map is shown on Map 3. In the urban area,
landcover was divided into six categories: urban developed areas (including commercial, office
and residential areas), road and square areas, urban tree area, water (including canals and fish
ponds), grass and farmland, and cultivated land with row crops. In the mountain area, landcover
was divided into two categories: forest, and barren and rocky areas (Table 4).
Table 4: Categories In Beijing Landcover Reclassify Map
Area Code Landcover
11 Water (including canals and fish ponds)
22 Urban developed area (commercial, official and residential area)
23 Road and square area
41 Urban tree area
71 Cultivated land with row crops
Urban Area
85 Grass and farmland
31 Barren and rocky area Mountain Area
42 Forest
Source: Author, 2005
65
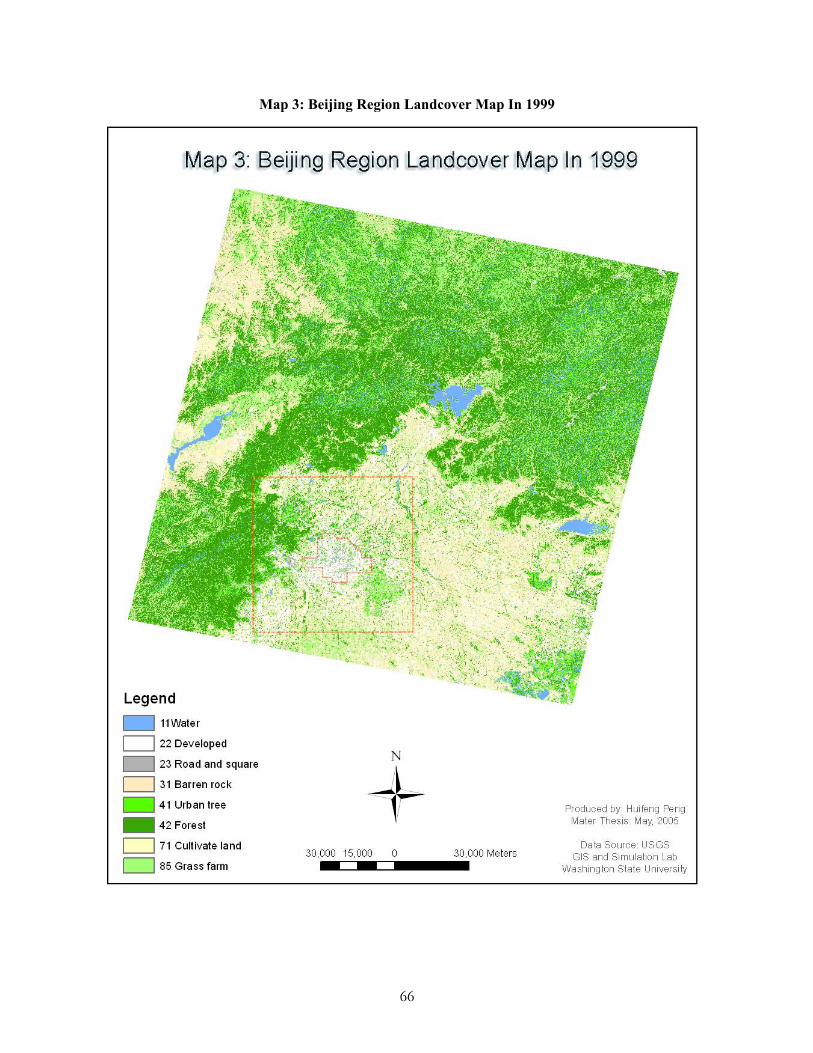
Map 3: Beijing Region Landcover Map In 1999
66
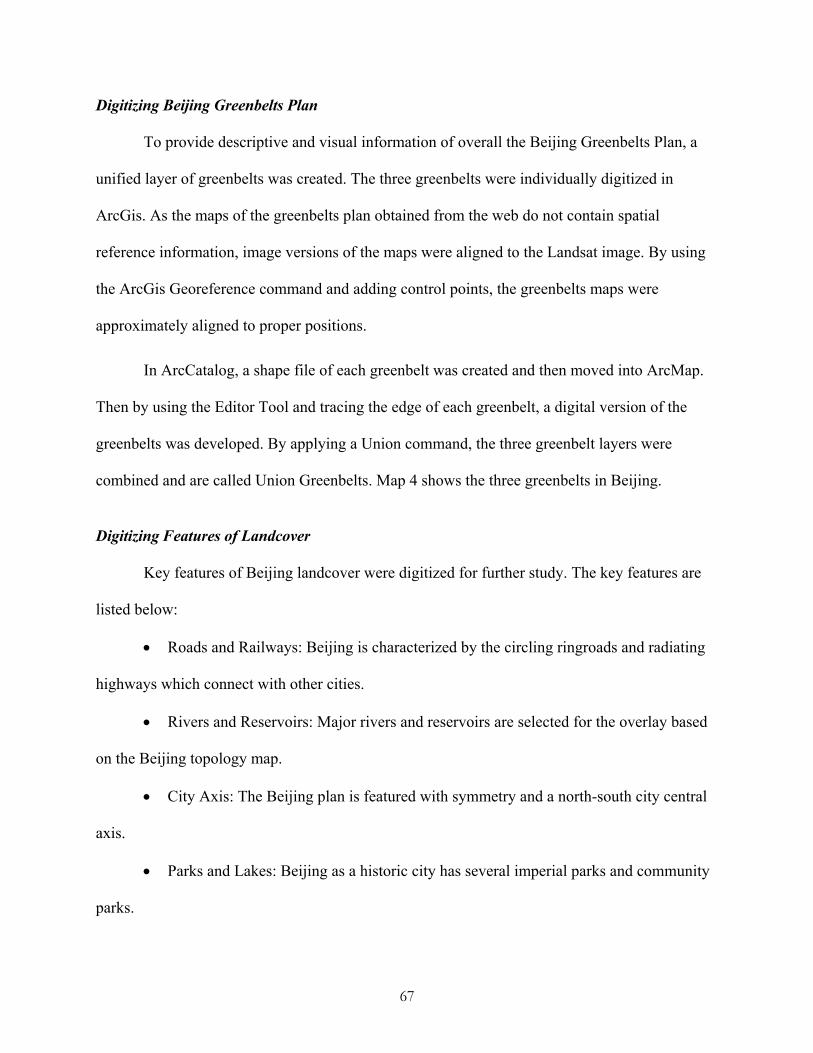
Digitizing Beijing Greenbelts Plan
To provide descriptive and visual information of overall the Beijing Greenbelts Plan, a
unified layer of greenbelts was created. The three greenbelts were individually digitized in
ArcGis. As the maps of the greenbelts plan obtained from the web do not contain spatial
reference information, image versions of the maps were aligned to the Landsat image. By using
the ArcGis Georeference command and adding control points, the greenbelts maps were
approximately aligned to proper positions.
In ArcCatalog, a shape file of each greenbelt was created and then moved into ArcMap.
Then by using the Editor Tool and tracing the edge of each greenbelt, a digital version of the
greenbelts was developed. By applying a Union command, the three greenbelt layers were
combined and are called Union Greenbelts. Map 4 shows the three greenbelts in Beijing.
Digitizing Features of Landcover
Key features of Beijing landcover were digitized for further study. The key features are
listed below:
• Roads and Railways: Beijing is characterized by the circling ringroads and radiating
highways which connect with other cities.
• Rivers and Reservoirs: Major rivers and reservoirs are selected for the overlay based
on the Beijing topology map.
• City Axis: The Beijing plan is featured with symmetry and a north-south city central
axis.
• Parks and Lakes: Beijing as a historic city has several imperial parks and community
parks.
67
Map 4: The Beijing Greenbelts Plan
68
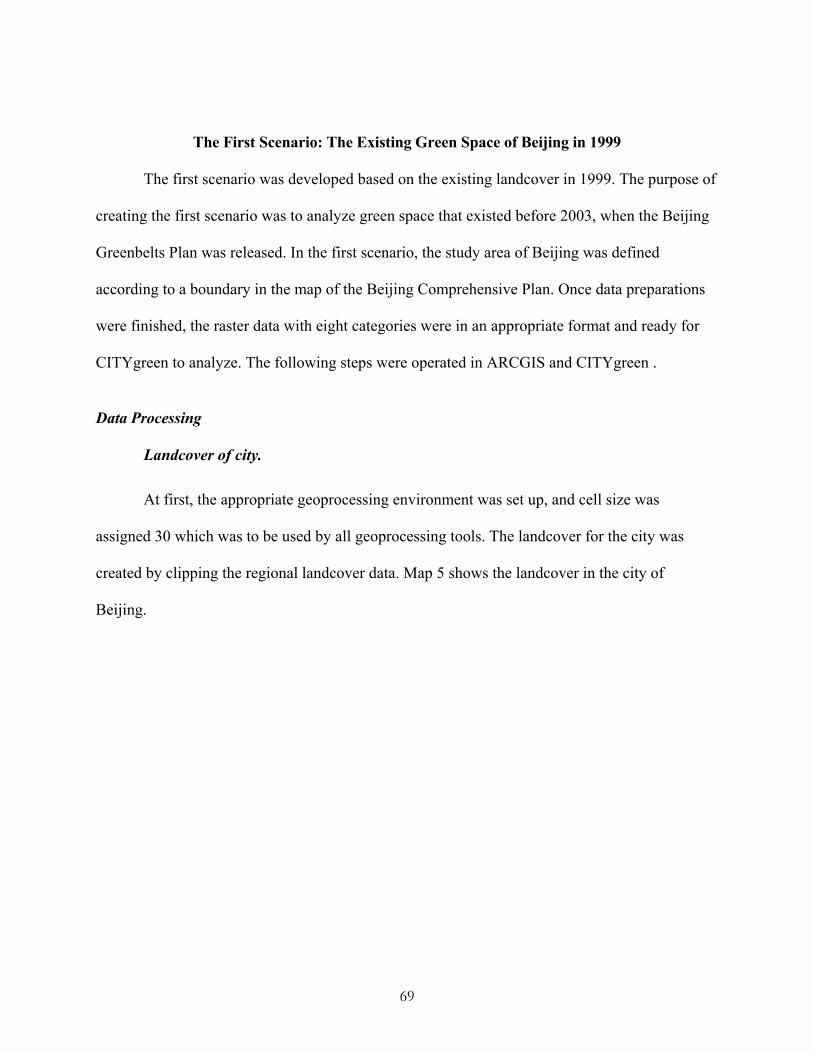
The First Scenario: The Existing Green Space of Beijing in 1999
The first scenario was developed based on the existing landcover in 1999. The purpose of
creating the first scenario was to analyze green space that existed before 2003, when the Beijing
Greenbelts Plan was released. In the first scenario, the study area of Beijing was defined
according to a boundary in the map of the Beijing Comprehensive Plan. Once data preparations
were finished, the raster data with eight categories were in an appropriate format and ready for
CITYgreen to analyze. The following steps were operated in ARCGIS and CITYgreen .
Data Processing
Landcover of city.
At first, the appropriate geoprocessing environment was set up, and cell size was
assigned 30 which was to be used by all geoprocessing tools. The landcover for the city was
created by clipping the regional landcover data. Map 5 shows the landcover in the city of
Beijing.
69
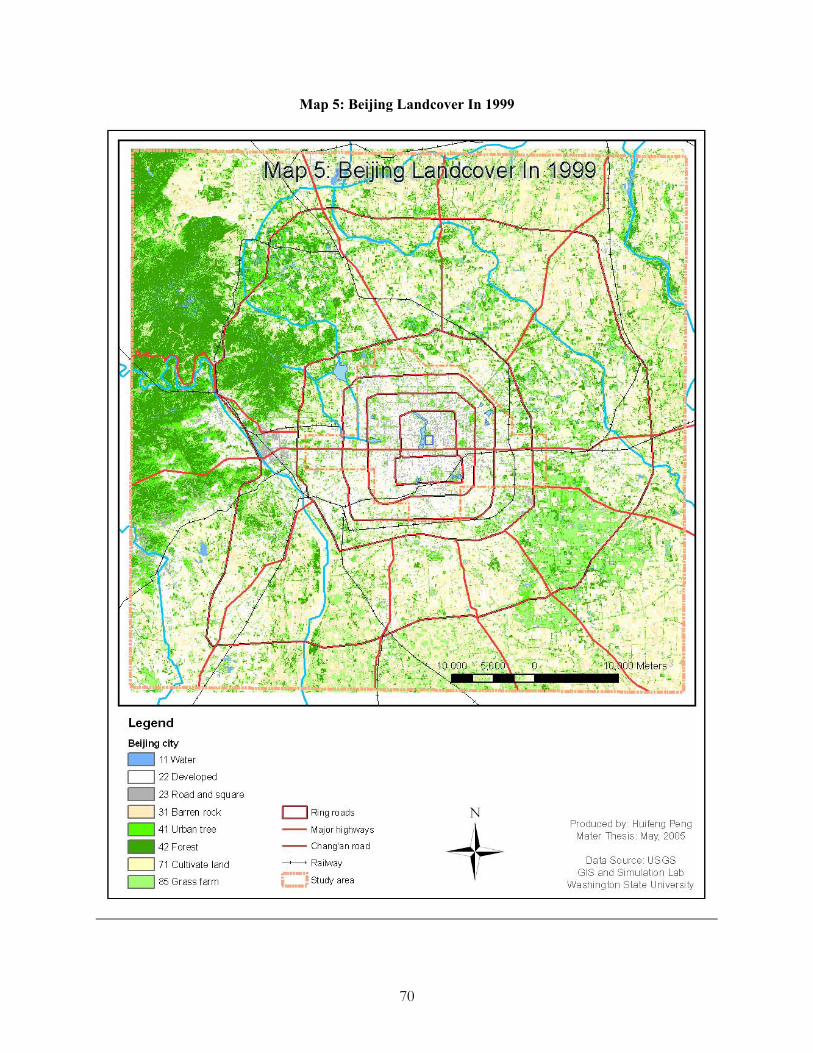
Map 5: Beijing Landcover In 1999
70
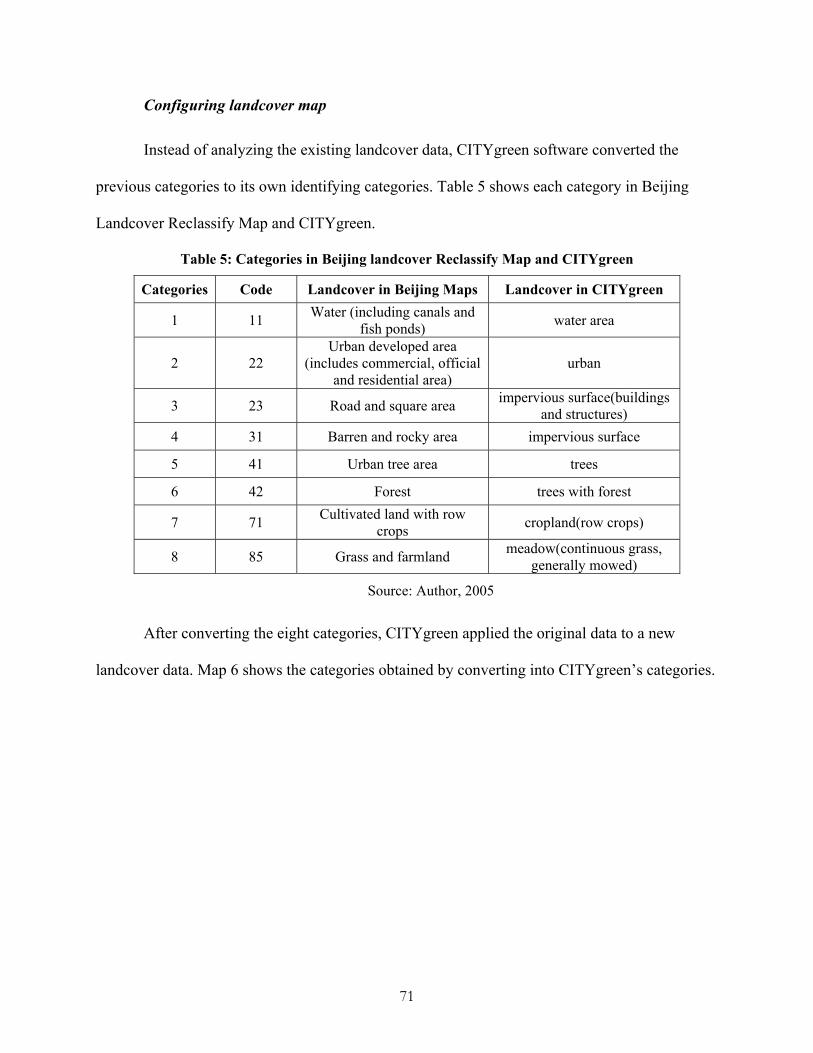
Configuring landcover map
Instead of analyzing the existing landcover data, CITYgreen software converted the
previous categories to its own identifying categories. Table 5 shows each category in Beijing
Landcover Reclassify Map and CITYgreen.
Table 5: Categories in Beijing landcover Reclassify Map and CITYgreen
Categories Code Landcover in Beijing Maps Landcover in CITYgreen
1 11 Water (including canals and fish ponds) water area
2 22 Urban developed area
(includes commercial, official and residential area)
urban
3 23 Road and square area impervious surface(buildings and structures)
4 31 Barren and rocky area impervious surface
5 41 Urban tree area trees
6 42 Forest trees with forest
7 71 Cultivated land with row crops cropland(row crops)
8 85 Grass and farmland meadow(continuous grass, generally mowed)
Source: Author, 2005
After converting the eight categories, CITYgreen applied the original data to a new
landcover data. Map 6 shows the categories obtained by converting into CITYgreen’s categories.
71
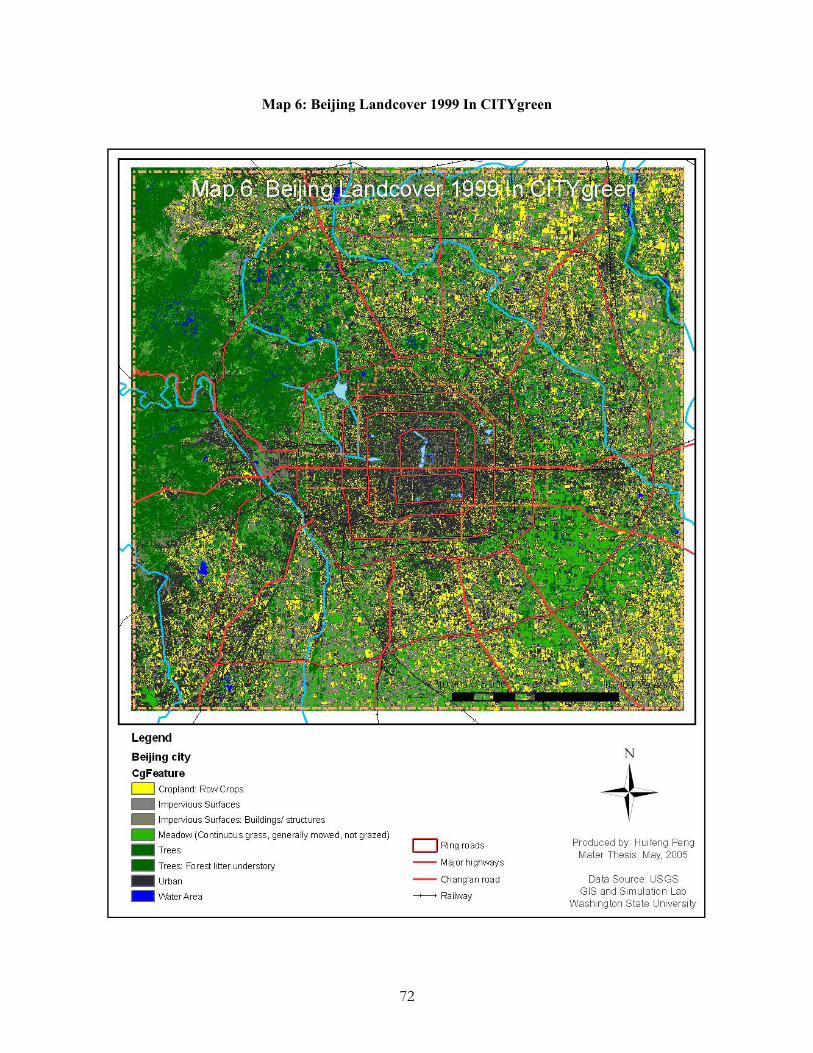
Map 6: Beijing Landcover 1999 In CITYgreen
72
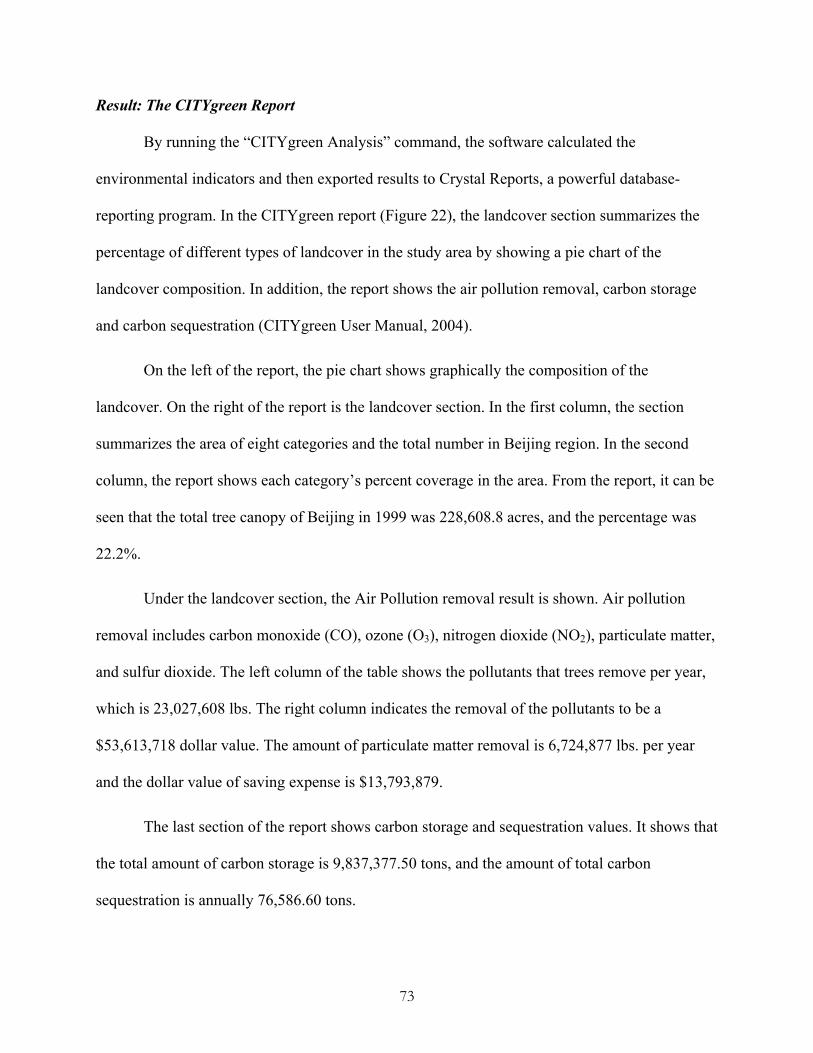
Result: The CITYgreen Report
By running the “CITYgreen Analysis” command, the software calculated the
environmental indicators and then exported results to Crystal Reports, a powerful database-
reporting program. In the CITYgreen report (Figure 22), the landcover section summarizes the
percentage of different types of landcover in the study area by showing a pie chart of the
landcover composition. In addition, the report shows the air pollution removal, carbon storage
and carbon sequestration (CITYgreen User Manual, 2004).
On the left of the report, the pie chart shows graphically the composition of the
landcover. On the right of the report is the landcover section. In the first column, the section
summarizes the area of eight categories and the total number in Beijing region. In the second
column, the report shows each category’s percent coverage in the area. From the report, it can be
seen that the total tree canopy of Beijing in 1999 was 228,608.8 acres, and the percentage was
22.2%.
Under the landcover section, the Air Pollution removal result is shown. Air pollution
removal includes carbon monoxide (CO), ozone (O3), nitrogen dioxide (NO2), particulate matter,
and sulfur dioxide. The left column of the table shows the pollutants that trees remove per year,
which is 23,027,608 lbs. The right column indicates the removal of the pollutants to be a
$53,613,718 dollar value. The amount of particulate matter removal is 6,724,877 lbs. per year
and the dollar value of saving expense is $13,793,879.
The last section of the report shows carbon storage and sequestration values. It shows that
the total amount of carbon storage is 9,837,377.50 tons, and the amount of total carbon
sequestration is annually 76,586.60 tons.
73
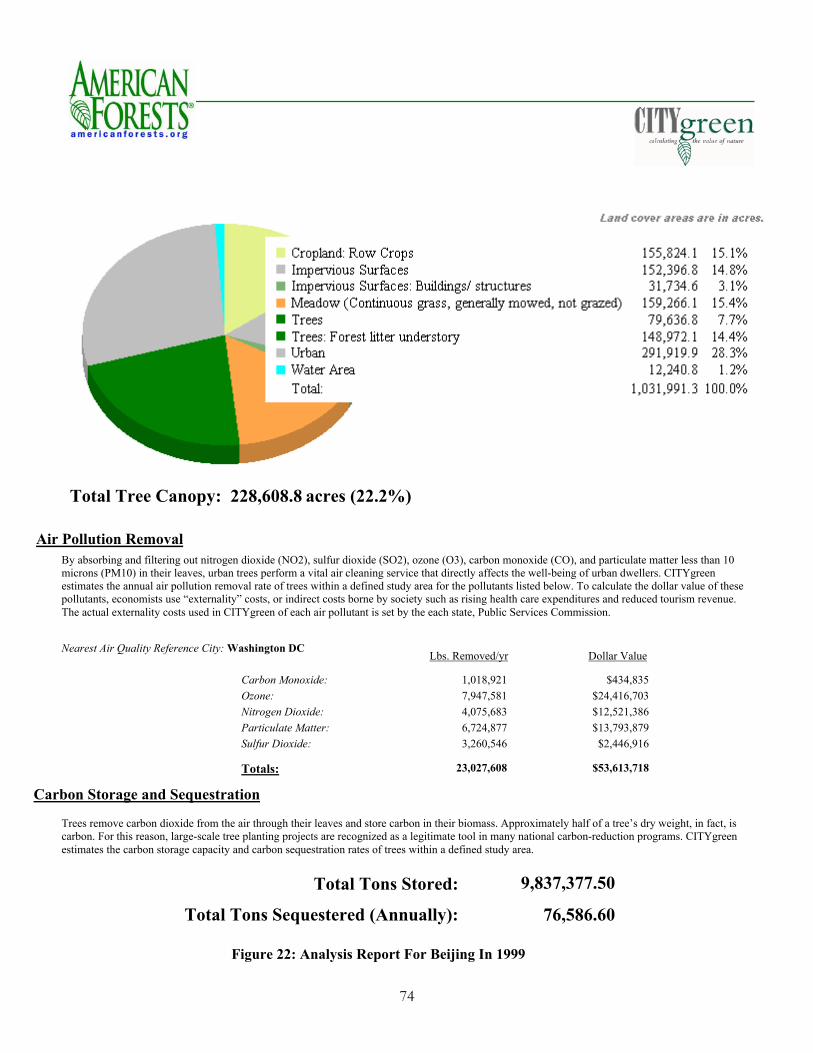
Total Tree Canopy: 228,608.8 acres (22.2%)
Air Pollution Removal By absorbing and filtering out nitrogen dioxide (NO2), sulfur dioxide (SO2), ozone (O3), carbon monoxide (CO), and particulate matter less than 10 microns (PM10) in their leaves, urban trees perform a vital air cleaning service that directly affects the well-being of urban dwellers. CITYgreen estimates the annual air pollution removal rate of trees within a defined study area for the pollutants listed below. To calculate the dollar value of these pollutants, economists use “externality” costs, or indirect costs borne by society such as rising health care expenditures and reduced tourism revenue. The actual externality costs used in CITYgreen of each air pollutant is set by the each state, Public Services Commission.
Nearest Air Quality Reference City: Washington DC Dollar ValueLbs. Removed/yr
Sulfur Dioxide: Particulate Matter:Nitrogen Dioxide: Ozone: Carbon Monoxide: 1,018,921 $434,835
$24,416,703 7,947,581$12,521,386 4,075,683$13,793,879 6,724,877
$2,446,916 3,260,546
Totals: 23,027,608 $53,613,718
Carbon Storage and Sequestration
Trees remove carbon dioxide from the air through their leaves and store carbon in their biomass. Approximately half of a tree’s dry weight, in fact, is carbon. For this reason, large-scale tree planting projects are recognized as a legitimate tool in many national carbon-reduction programs. CITYgreen estimates the carbon storage capacity and carbon sequestration rates of trees within a defined study area.
9,837,377.50Total Tons Stored:
76,586.60Total Tons Sequestered (Annually):
Figure 22: Analysis Report For Beijing In 1999
74
The Second Scenario: The Beijing Greenbelts Plan
The second scenario was created to analyze the impact of the Beijing Greenbelts Plan
proposed in 2003. The Second Scenario used the landcover created in the first scenario. The
landcover was merged into the coverage of the Beijing Greenbelts Plan. By applying CITYgreen
, a statistic report on tree canopy and air pollution removal was generated.
Data Processing
Creating landcover raster data with greenbelts.
As CITYgreen software can only identify its own categories, an appropriate raster is
needed for CITYgreen analysis. To prepare the specific raster data, the attributes table of Union
Greenbelts was edited by assigning the code “41 urban tree areas” to all greenbelts. Then, the
raster data of the city were converted to the polygon using Conversion Tools. By using Union
Tools again, the polygon of city and union greenbelts were merged into a same layer. The
attributes of the union layer were edited to modify tree coverage. Data of water and roads were
maintained and other data changed to tree coverage. The final step was using Conversion Tools
to convert the new city polygon with greenbelts back to the raster data corresponding to the new
category (Map 7).
75
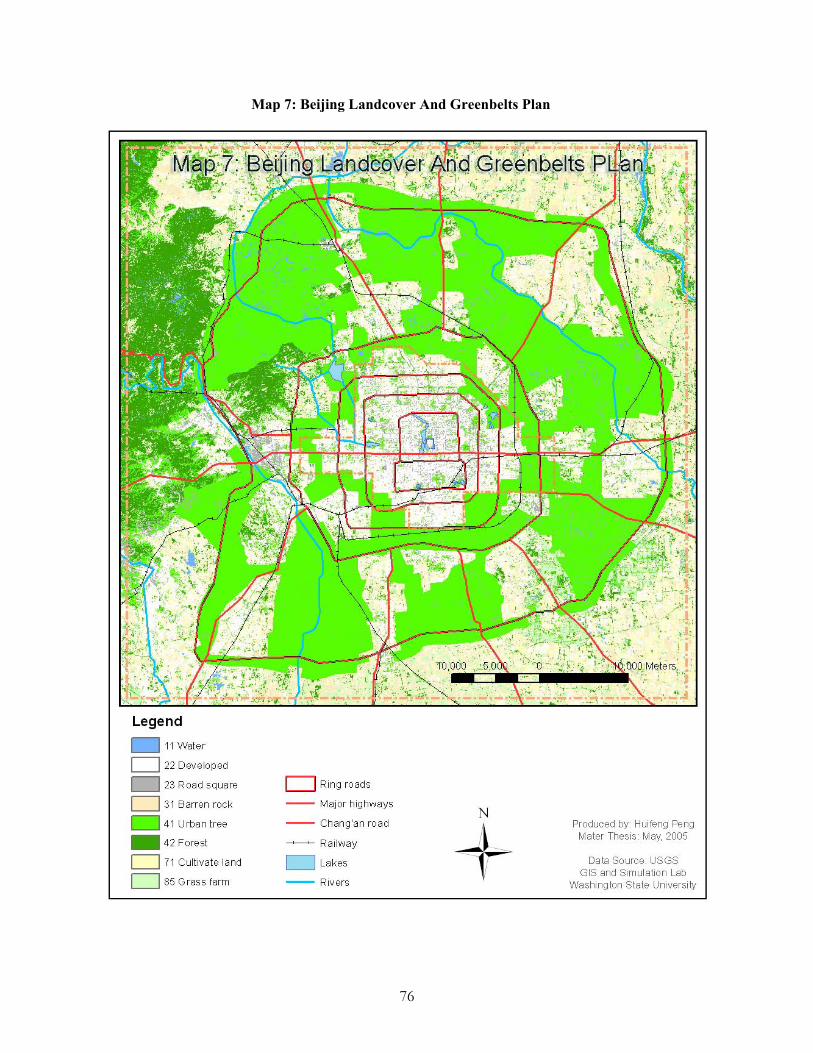
Map 7: Beijing Landcover And Greenbelts Plan
76
Configuring landcover map.
The new raster data created were suitable for CITYgreen analysis. The step of
reclassifying categories was the same as the one performed in the first scenario. By running
“Configuring Raster Data” in CITYgreen , the eight categories were reclassified, and new
landcover data were generated (Map 8).
Result: The CITYgreen Report
By replacing the first scenario model with the second one and performing analysis,
CITYgreen generated the statistical report (Figure 23) for the Beijing Greenbelts Plan. The report
shows the percentage of landcover, air pollution removal, carbon storage, and the dollar value of
tree canopy.
Figure 23 shows the area of tree coverage is 495,601.7 acres, and the percentage of
canopy is 48.0%. The total of air pollution removals is 49,921,608 lbs. per year, and the dollar
value of saving expense is $116,229,312. The amount of particulate matter removal is
14,578,877 lbs. per year, corresponding to $29,903,784 dollar value.
As mentioned in Chapter 3, a major goal of the Beijing Greenbelts Plan is to realize 50%
of tree canopy in the city area. The canopy of 48% in the CITYgreen report indicates that Beijing
can almost reach its goal if the greenbelts are developed successfully as the plan proposed.
Comparing the report of The Beijing Greenbelts Plan (Figure 23) with Beijing in 1999
(Figure 22), it can be seen after implementation of the Beijing Greenbelts Plan in the city area,
the PM removal will increase by 7.85×10⁶ lbs. per year. According to Guo and Teng (2003), PM
is the dominant pollutant affecting Beijing air quality. As seen in Table 4, the total PM emissions
allowed in Beijing urban area is 94,000 ton/year (2.10×10⁸ lbs./year), while the actual PM
77
emissions in 1999 was 106,500 ton/year (2.40×10⁸ lbs./year). This results with 3.0×10⁷ lbs. PM
amount needed to be removed, which is four times of the capability of the greenbelts. Moreover,
Figures 20 and 21 show the removal of SO2, and NO2 will increase by 3.81×10⁶, 4.76×10⁶ lbs./yr
respectively by implementing the Beijing Greenbelts Plan, while Table 4 shows that the removal
amounts of SO2, NO2 need to increase 100,000 ton (2.22×10⁸ lbs.) and 165,000 ton (3.67×10⁸
lbs.) per year respectively to reach National Grade II Standard, which are much larger than the
capability of the greenbelts. Therefore, the construction of the greenbelts will not improve
Beijing air quality to reach the regulations in National Grade II Standard. The third greenbelt to
be constructed in the mountain area is expected to produce more profound effect due to its
location, direction and by being the largest canopy area among the three greenbelts. In addition,
other measures are to be taken by Beijing authority that will contribute to realize the goal, such
as reducing the proportion of high pollution industries, moving industry out of the core urban
area, using clean coal and natural gas to replace the low quality coal, limiting motor vehicles and
strengthening emission control systems (Asian Development Bank, 2002).
During sandstorms, greenbelts will function to decrease sand volume transported by
reducing wind speed. It was found that greenbelts could reduce wind speeds by 52% to 83%
depending on canopy density (Agriculture and Agri-Food Canada, 2003). Another study shows
as density of the canopy increases from 20.8 to 55.5%, the wind reduction factor rises from
approximately 30 to 40% (Tran & Pyree, 1999). On the other hand, the overall volume of sand
moved has an exponential relationship with wind velocity, i.e. as wind speeds increase, the
downwind rate of sand movement increases exponentially (Mangimeli, 1981). Figure 20 and 21
shows the tree canopy will increase from 22.2% in 1999 to 48% after implementation of the
Beijing Greenbelts Plan. As a rough estimate, there will be a 10% wind reduction on the basis of
78
the 1999 sandstorm conditions. Subsequently, the sand volume carried by the wind will be
greatly decreased. Therefore, the construction of the greenbelts may significantly inhibit the
severity of sandstorms in terms of reducing sand volume transported into Beijing city.
79
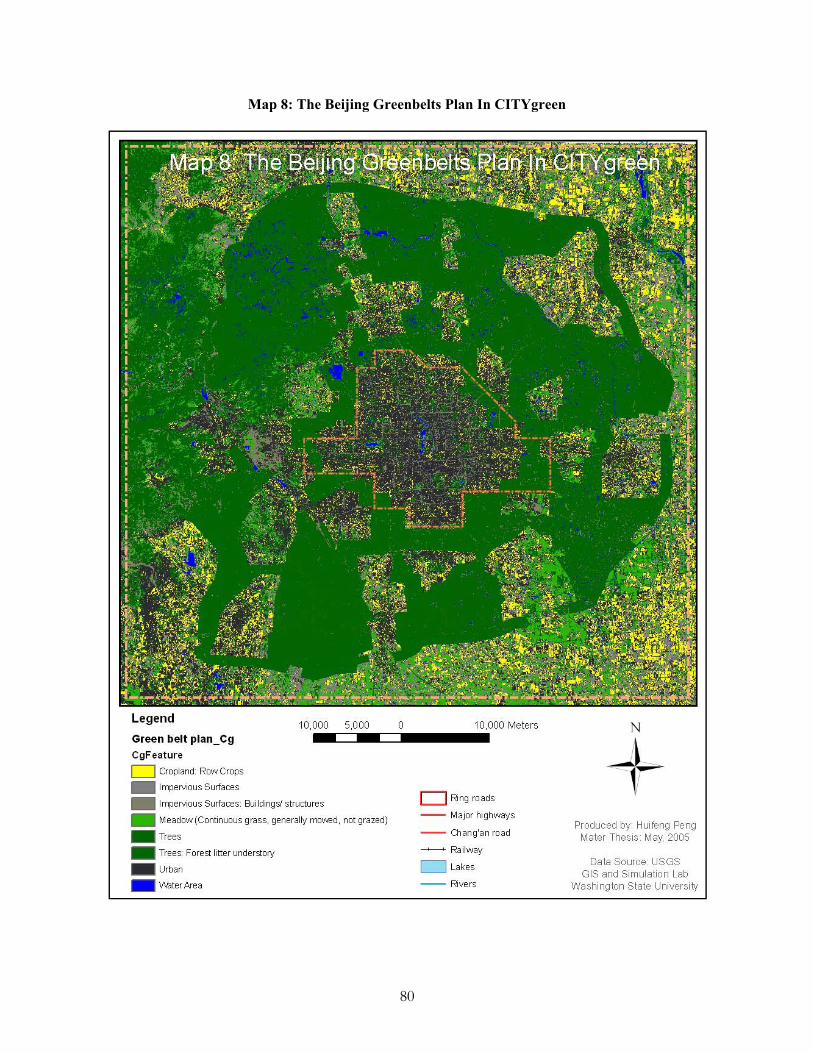
Map 8: The Beijing Greenbelts Plan In CITYgreen
80
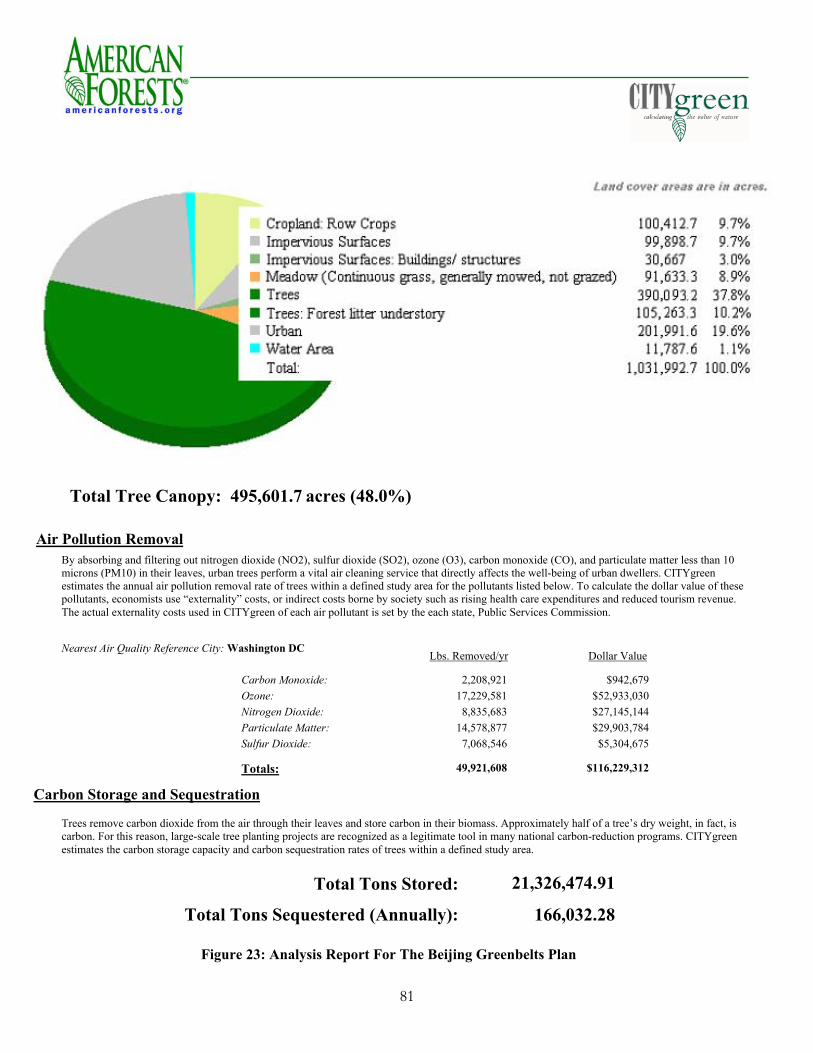
Total Tree Canopy: 495,601.7 acres (48.0%)
Air Pollution Removal By absorbing and filtering out nitrogen dioxide (NO2), sulfur dioxide (SO2), ozone (O3), carbon monoxide (CO), and particulate matter less than 10 microns (PM10) in their leaves, urban trees perform a vital air cleaning service that directly affects the well-being of urban dwellers. CITYgreen estimates the annual air pollution removal rate of trees within a defined study area for the pollutants listed below. To calculate the dollar value of these pollutants, economists use “externality” costs, or indirect costs borne by society such as rising health care expenditures and reduced tourism revenue. The actual externality costs used in CITYgreen of each air pollutant is set by the each state, Public Services Commission.
Nearest Air Quality Reference City: Washington DC Dollar ValueLbs. Removed/yr
Sulfur Dioxide: Particulate Matter:Nitrogen Dioxide: Ozone: Carbon Monoxide: 2,208,921 $942,679
$52,933,030 17,229,581$27,145,144 8,835,683$29,903,784 14,578,877
$5,304,675 7,068,546
Totals: 49,921,608 $116,229,312
Carbon Storage and Sequestration
Trees remove carbon dioxide from the air through their leaves and store carbon in their biomass. Approximately half of a tree’s dry weight, in fact, is carbon. For this reason, large-scale tree planting projects are recognized as a legitimate tool in many national carbon-reduction programs. CITYgreen estimates the carbon storage capacity and carbon sequestration rates of trees within a defined study area.
21,326,474.91Total Tons Stored:
166,032.28Total Tons Sequestered (Annually):
Figure 23: Analysis Report For The Beijing Greenbelts Plan
81
The Third Scenario: Improved Greenbelts
To improve the Beijing Greenbelts Plan, the third scenario was developed based on
Beijing’s specific situation and combined with landscape ecology principles. The scenario
development and analysis were conducted at three different levels: region level, city level, and
neighborhood level. For each level, approaches were proposed to improve the effect of the
greenbelts on ecological system in the study area.
Data Processing
At region level
Widen Edges on the Sides Facing the Predominant Wind Direction
One of the major purposes of the greenbelts is to prevent sandstorms from the northwest.
The greenbelts in Beijing should always target the original goals. According to the methods
illustrated in the case study of the Canadian greenbelts in Chapter 2, the greenbelt on the
northwest of Beijing could be enlarged to maximize the capability of resisting sandstorms. More
trees should be planted in northwest instead of evenly distributed across the city.
Furthermore, the prevailing winds in the winter bring snow and cold air from the
northwest. If the area of the greenbelt increases in the northwest, it can not only strengthen the
ability to hamper the sandstorms but also prevent cold winds in the winter. Map 9 shows that the
green area is enlarged in the northwest of Beijing. The continuous greenbelts ranging from
suburb to mountain area form a natural solid barrier to hamper the sandstorm and cold winds.
82
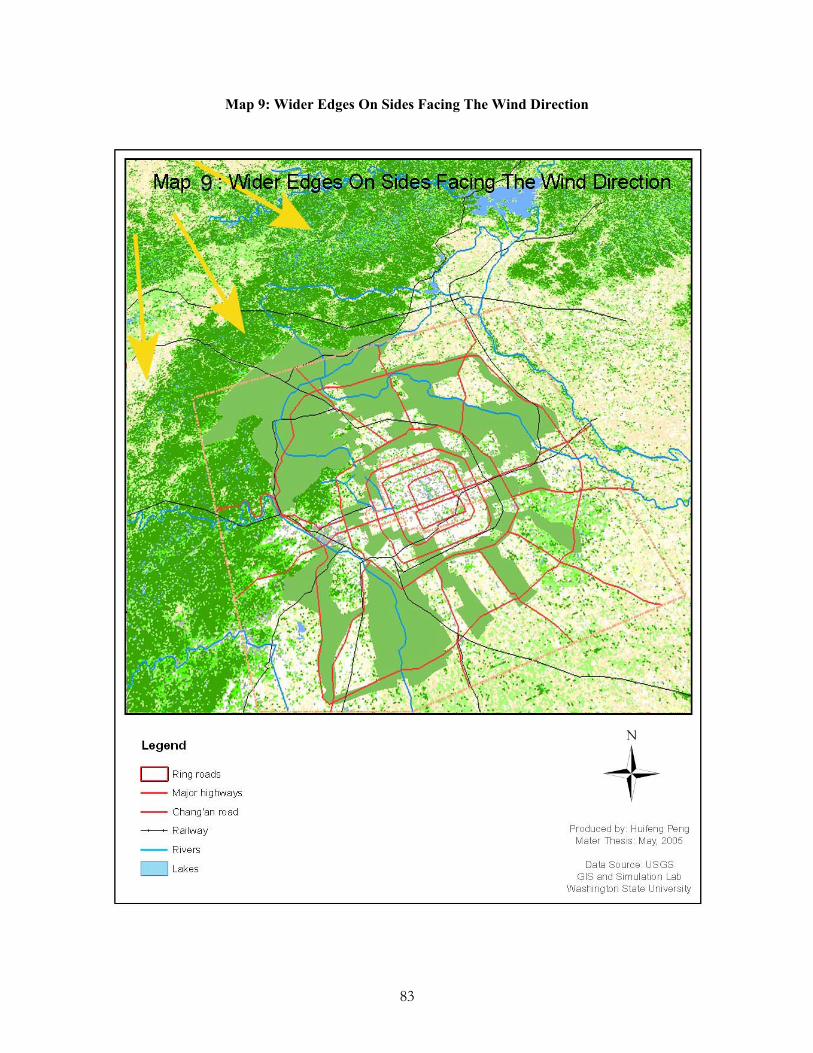
Map 9: Wider Edges On Sides Facing The Wind Direction
83
Leaving the South Open
Beijing lies in the semiarid continental monsoon climatic zone and receives the majority of
precipitation in summer. The monsoon comes from the southeast of Beijing and brings the
moisture and precipitation from the ocean.
According to the case study of Canadian greenbelts, it is preferred to leave the south open
and let the moist monsoon enter easily into the mass of urban area. Thus the city is capable of
gaining maximum solar energy in the winter and enjoying enough ventilation of living area in
the summer. In GIS Arc Map, the planned greenbelt in the south is reduced, and some parts of
green wedges are cut off (Map 10).
In addition, it is recommended to create more moderate density of the greenbelt on the
southeast than the northwest. Fewer tall arbor trees should be planted in the southeast; high-rise
buildings should be restricted from situating in the southeast of the city.
84
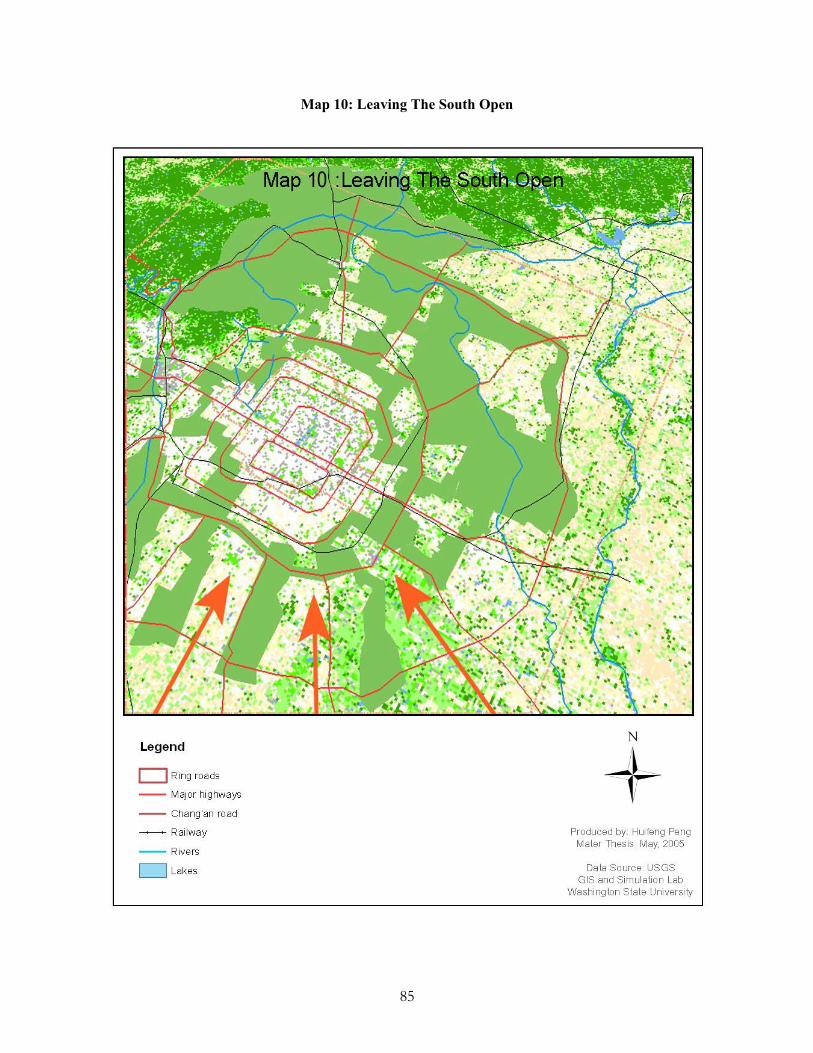
Map 10: Leaving The South Open
85
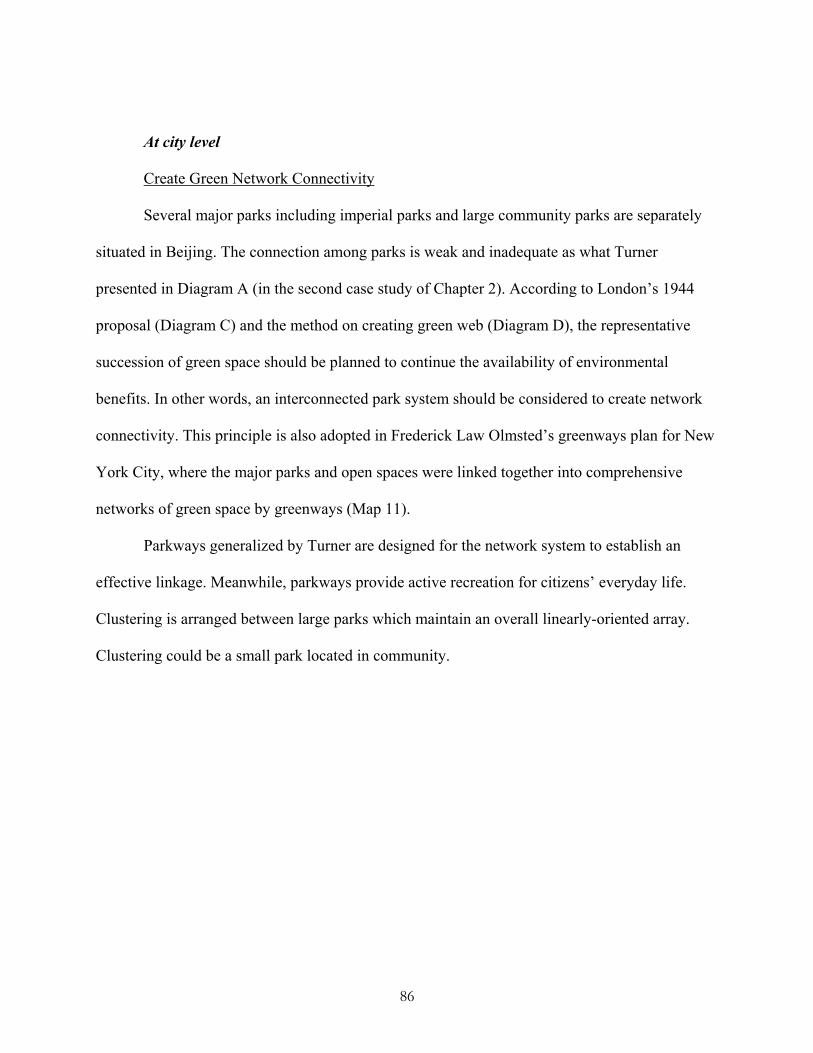
At city level
Create Green Network Connectivity
Several major parks including imperial parks and large community parks are separately
situated in Beijing. The connection among parks is weak and inadequate as what Turner
presented in Diagram A (in the second case study of Chapter 2). According to London’s 1944
proposal (Diagram C) and the method on creating green web (Diagram D), the representative
succession of green space should be planned to continue the availability of environmental
benefits. In other words, an interconnected park system should be considered to create network
connectivity. This principle is also adopted in Frederick Law Olmsted’s greenways plan for New
York City, where the major parks and open spaces were linked together into comprehensive
networks of green space by greenways (Map 11).
Parkways generalized by Turner are designed for the network system to establish an
effective linkage. Meanwhile, parkways provide active recreation for citizens’ everyday life.
Clustering is arranged between large parks which maintain an overall linearly-oriented array.
Clustering could be a small park located in community.
86
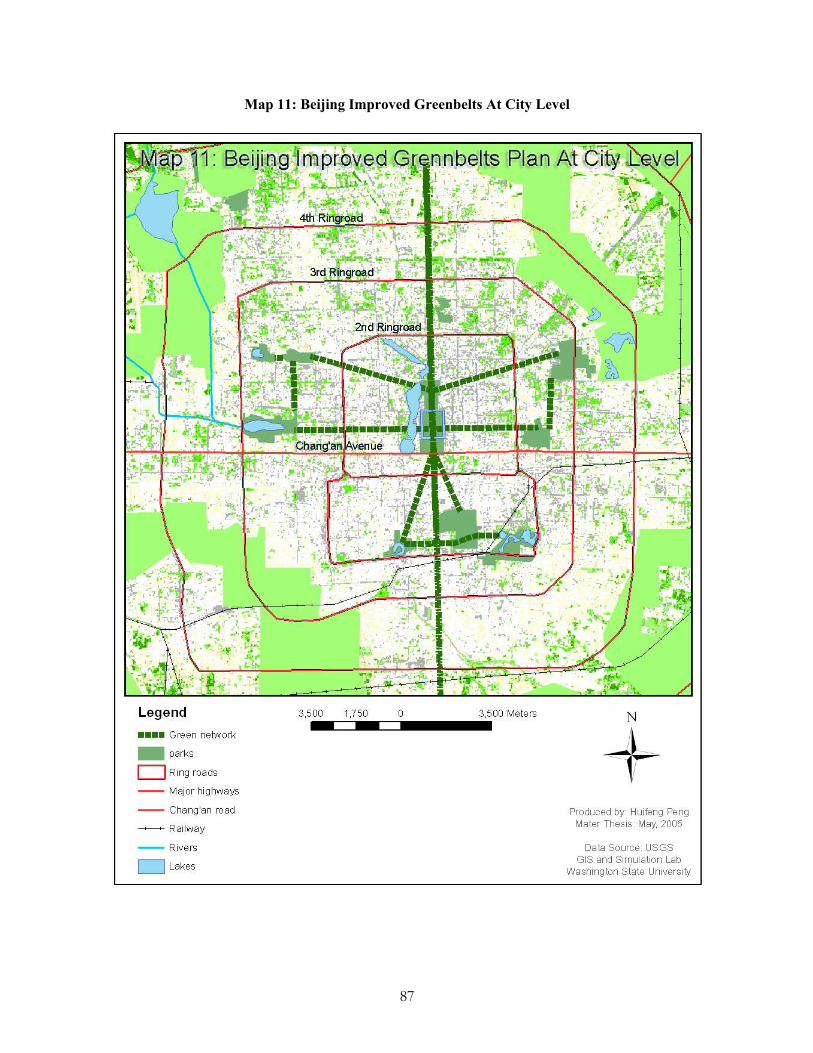
Map 11: Beijing Improved Greenbelts At City Level
87
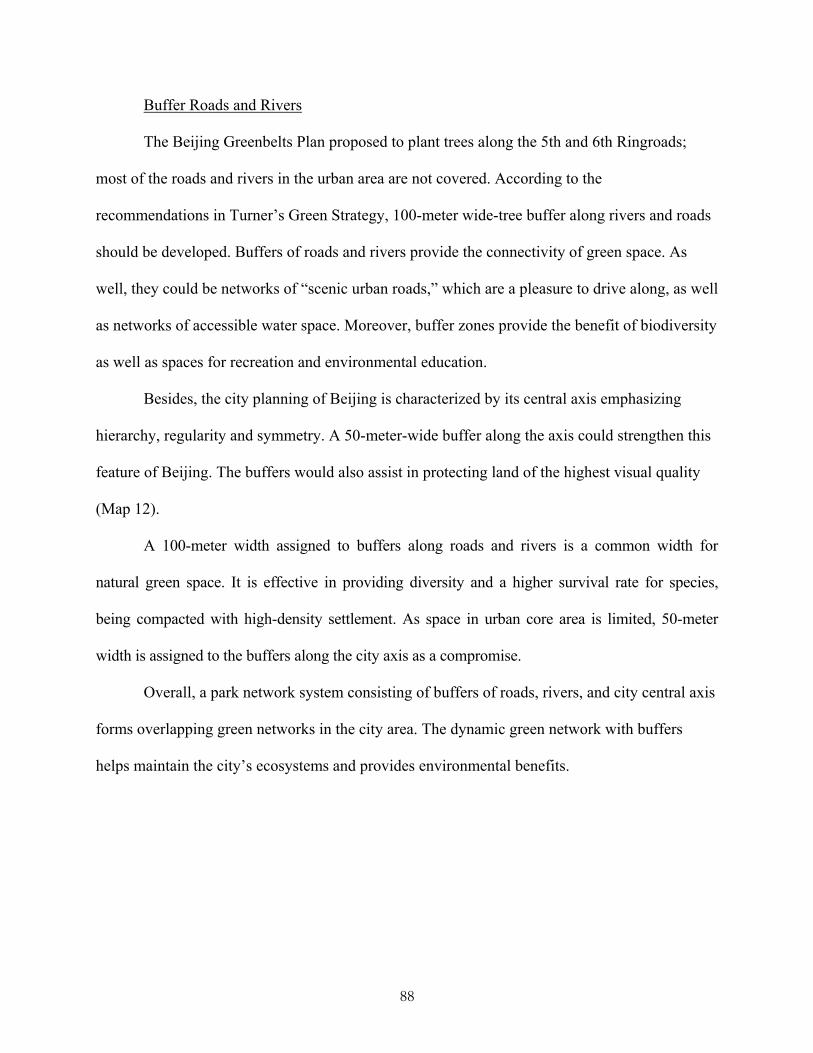
Buffer Roads and Rivers
The Beijing Greenbelts Plan proposed to plant trees along the 5th and 6th Ringroads;
most of the roads and rivers in the urban area are not covered. According to the
recommendations in Turner’s Green Strategy, 100-meter wide-tree buffer along rivers and roads
should be developed. Buffers of roads and rivers provide the connectivity of green space. As
well, they could be networks of “scenic urban roads,” which are a pleasure to drive along, as well
as networks of accessible water space. Moreover, buffer zones provide the benefit of biodiversity
as well as spaces for recreation and environmental education.
Besides, the city planning of Beijing is characterized by its central axis emphasizing
hierarchy, regularity and symmetry. A 50-meter-wide buffer along the axis could strengthen this
feature of Beijing. The buffers would also assist in protecting land of the highest visual quality
(Map 12).
A 100-meter width assigned to buffers along roads and rivers is a common width for
natural green space. It is effective in providing diversity and a higher survival rate for species,
being compacted with high-density settlement. As space in urban core area is limited, 50-meter
width is assigned to the buffers along the city axis as a compromise.
Overall, a park network system consisting of buffers of roads, rivers, and city central axis
forms overlapping green networks in the city area. The dynamic green network with buffers
helps maintain the city’s ecosystems and provides environmental benefits.
88
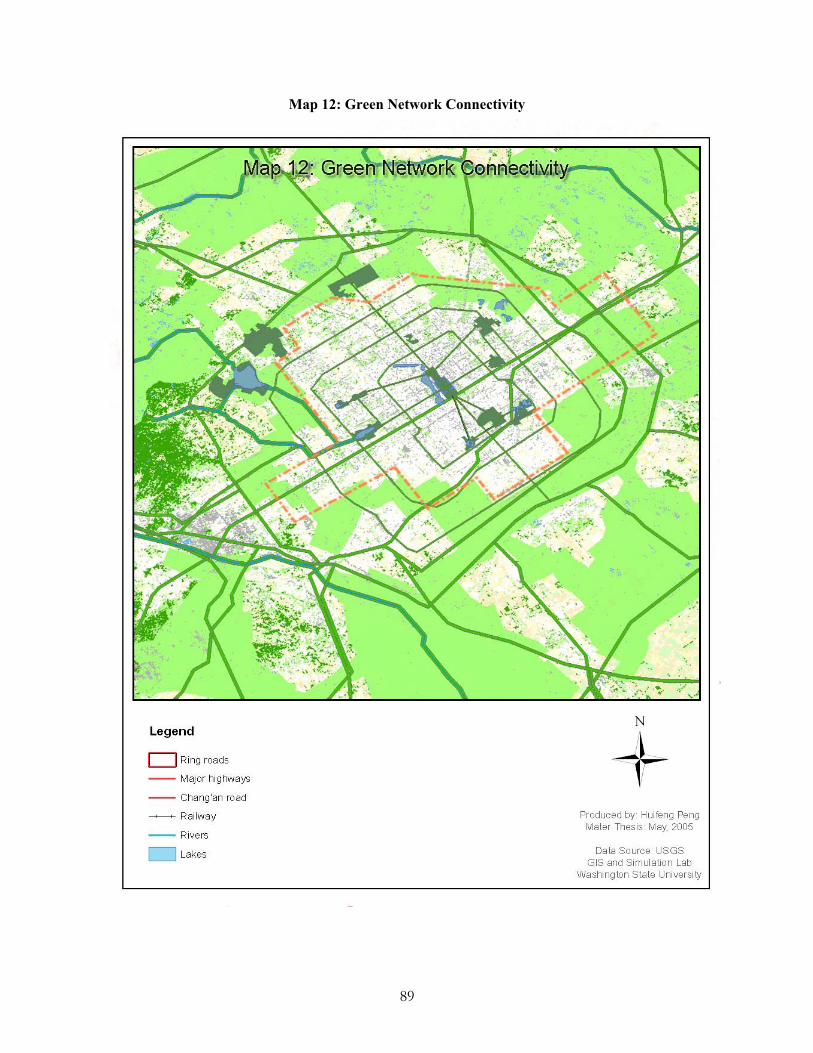
Map 12: Green Network Connectivity
89
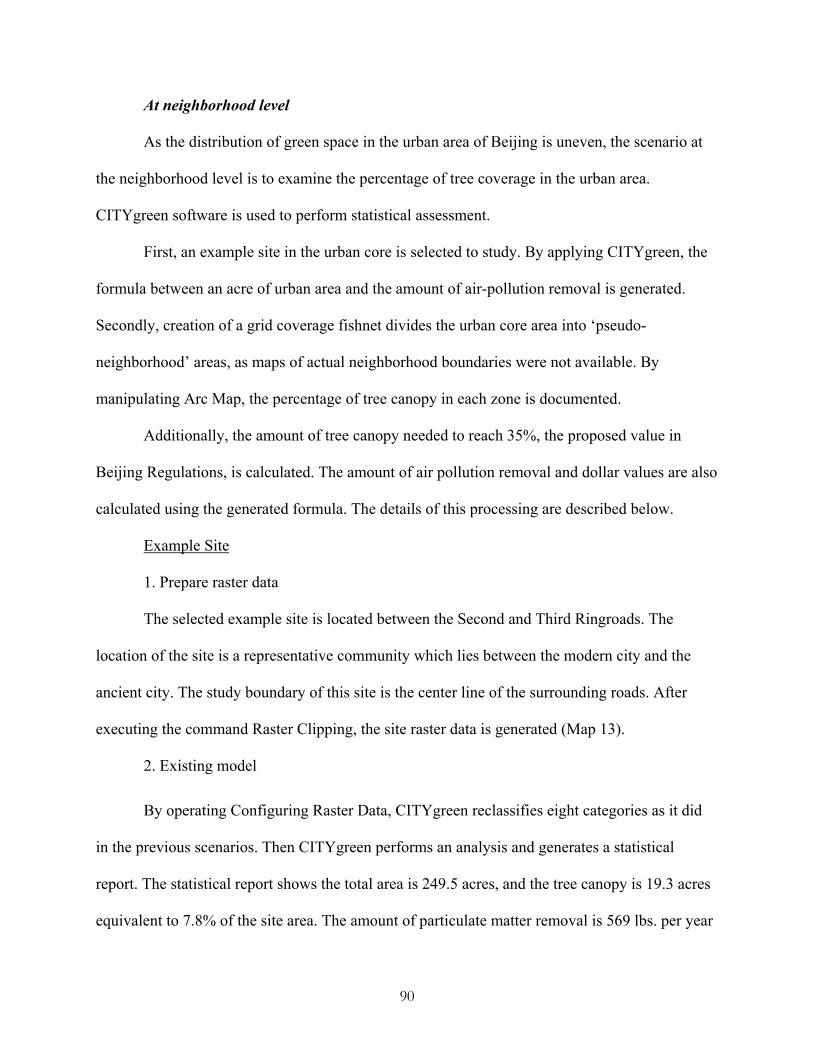
At neighborhood level
As the distribution of green space in the urban area of Beijing is uneven, the scenario at
the neighborhood level is to examine the percentage of tree coverage in the urban area.
CITYgreen software is used to perform statistical assessment.
First, an example site in the urban core is selected to study. By applying CITYgreen, the
formula between an acre of urban area and the amount of air-pollution removal is generated.
Secondly, creation of a grid coverage fishnet divides the urban core area into ‘pseudo-
neighborhood’ areas, as maps of actual neighborhood boundaries were not available. By
manipulating Arc Map, the percentage of tree canopy in each zone is documented.
Additionally, the amount of tree canopy needed to reach 35%, the proposed value in
Beijing Regulations, is calculated. The amount of air pollution removal and dollar values are also
calculated using the generated formula. The details of this processing are described below.
Example Site
1. Prepare raster data
The selected example site is located between the Second and Third Ringroads. The
location of the site is a representative community which lies between the modern city and the
ancient city. The study boundary of this site is the center line of the surrounding roads. After
executing the command Raster Clipping, the site raster data is generated (Map 13).
2. Existing model
By operating Configuring Raster Data, CITYgreen reclassifies eight categories as it did
in the previous scenarios. Then CITYgreen performs an analysis and generates a statistical
report. The statistical report shows the total area is 249.5 acres, and the tree canopy is 19.3 acres
equivalent to 7.8% of the site area. The amount of particulate matter removal is 569 lbs. per year
90
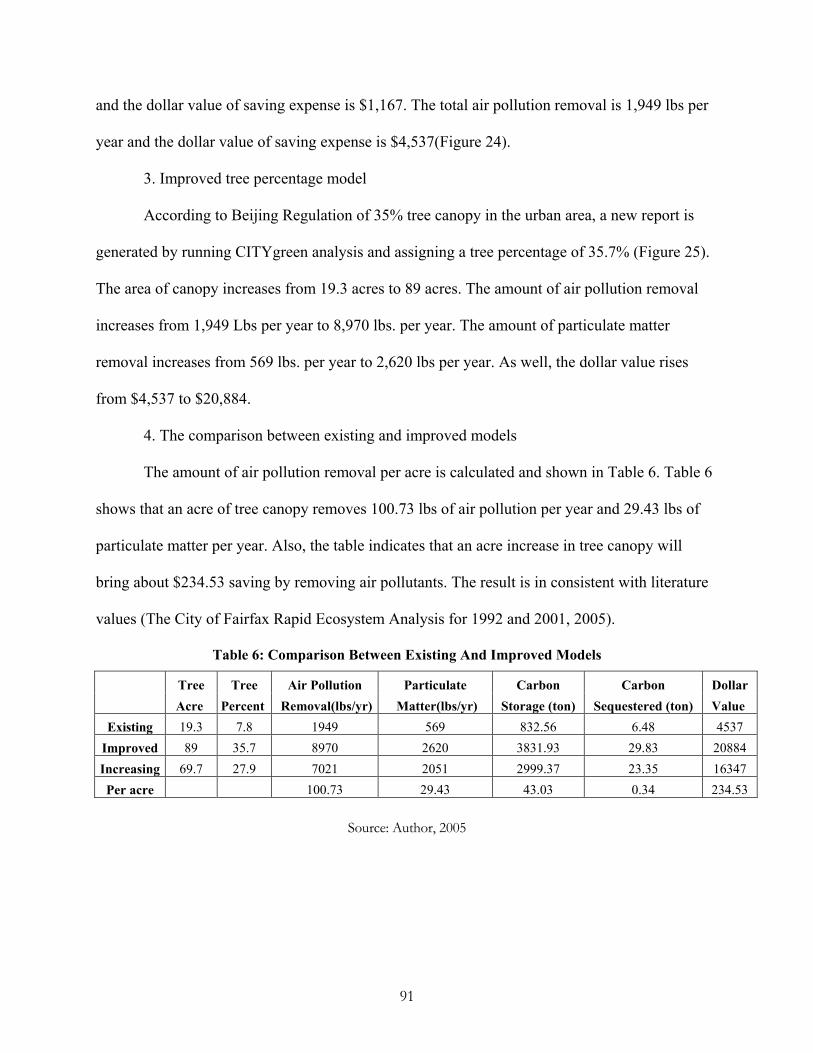
and the dollar value of saving expense is $1,167. The total air pollution removal is 1,949 lbs per
year and the dollar value of saving expense is $4,537(Figure 24).
3. Improved tree percentage model
According to Beijing Regulation of 35% tree canopy in the urban area, a new report is
generated by running CITYgreen analysis and assigning a tree percentage of 35.7% (Figure 25).
The area of canopy increases from 19.3 acres to 89 acres. The amount of air pollution removal
increases from 1,949 Lbs per year to 8,970 lbs. per year. The amount of particulate matter
removal increases from 569 lbs. per year to 2,620 lbs per year. As well, the dollar value rises
from $4,537 to $20,884.
4. The comparison between existing and improved models
The amount of air pollution removal per acre is calculated and shown in Table 6. Table 6
shows that an acre of tree canopy removes 100.73 lbs of air pollution per year and 29.43 lbs of
particulate matter per year. Also, the table indicates that an acre increase in tree canopy will
bring about $234.53 saving by removing air pollutants. The result is in consistent with literature
values (The City of Fairfax Rapid Ecosystem Analysis for 1992 and 2001, 2005).
Table 6: Comparison Between Existing And Improved Models
Tree Tree Air Pollution Particulate Carbon Carbon Dollar Acre Percent Removal(lbs/yr) Matter(lbs/yr) Storage (ton) Sequestered (ton) Value
Existing 19.3 7.8 1949 569 832.56 6.48 4537 Improved 89 35.7 8970 2620 3831.93 29.83 20884 Increasing 69.7 27.9 7021 2051 2999.37 23.35 16347 Per acre 100.73 29.43 43.03 0.34 234.53
Source: Author, 2005
91
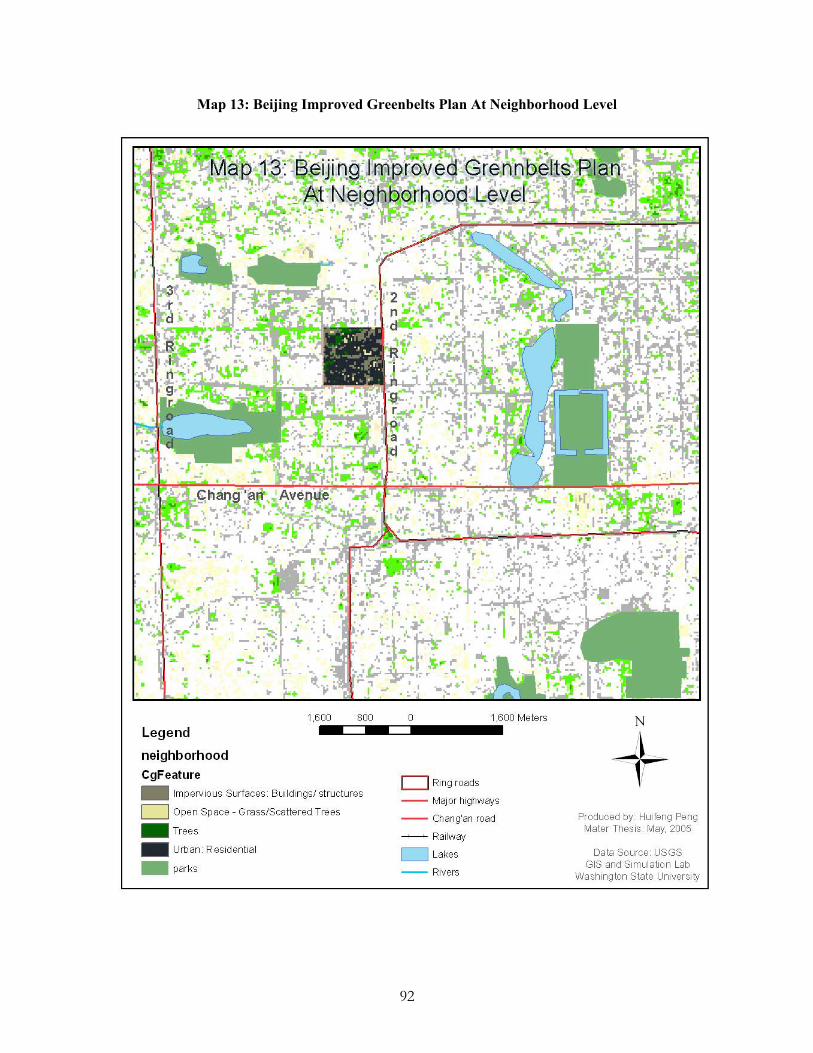
Map 13: Beijing Improved Greenbelts Plan At Neighborhood Level
92
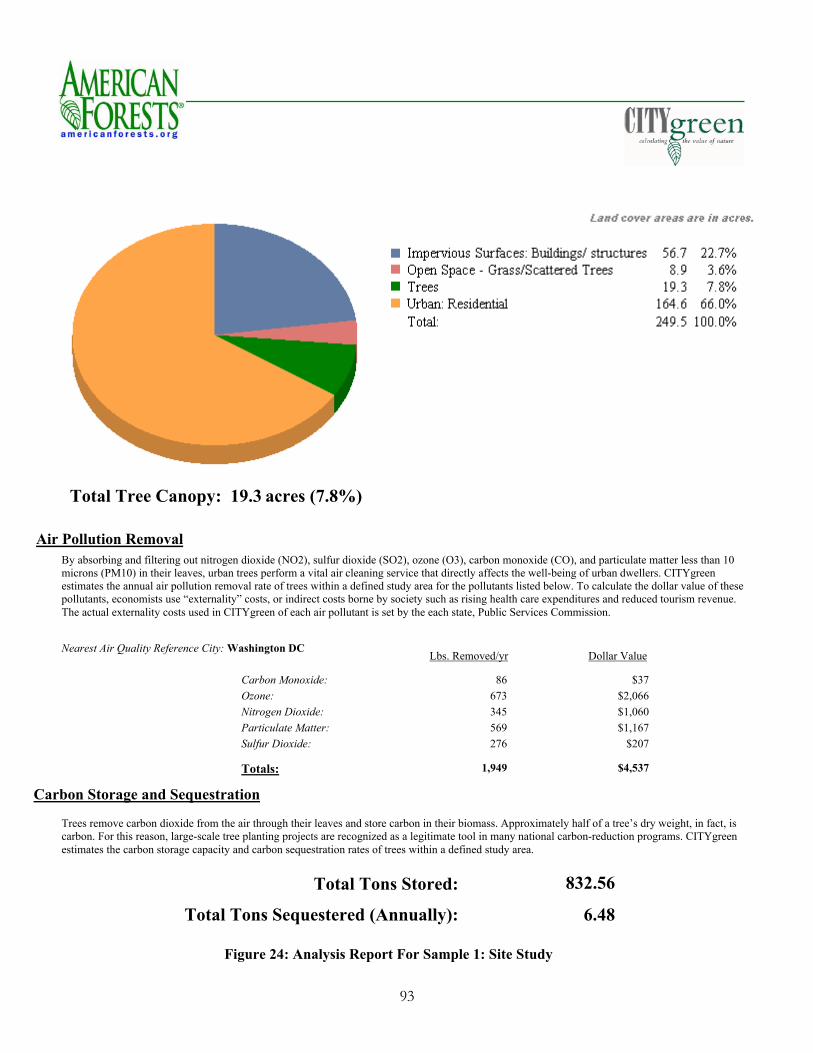
Total Tree Canopy: 19.3 acres (7.8%)
Air Pollution Removal By absorbing and filtering out nitrogen dioxide (NO2), sulfur dioxide (SO2), ozone (O3), carbon monoxide (CO), and particulate matter less than 10 microns (PM10) in their leaves, urban trees perform a vital air cleaning service that directly affects the well-being of urban dwellers. CITYgreen estimates the annual air pollution removal rate of trees within a defined study area for the pollutants listed below. To calculate the dollar value of these pollutants, economists use “externality” costs, or indirect costs borne by society such as rising health care expenditures and reduced tourism revenue. The actual externality costs used in CITYgreen of each air pollutant is set by the each state, Public Services Commission.
Nearest Air Quality Reference City: Washington DC Dollar ValueLbs. Removed/yr
Sulfur Dioxide: Particulate Matter:Nitrogen Dioxide: Ozone: Carbon Monoxide: 86 $37
$2,066 673$1,060 345$1,167 569
$207 276
Totals: 1,949 $4,537
Carbon Storage and Sequestration
Trees remove carbon dioxide from the air through their leaves and store carbon in their biomass. Approximately half of a tree’s dry weight, in fact, is carbon. For this reason, large-scale tree planting projects are recognized as a legitimate tool in many national carbon-reduction programs. CITYgreen estimates the carbon storage capacity and carbon sequestration rates of trees within a defined study area.
832.56Total Tons Stored:
6.48Total Tons Sequestered (Annually):
Figure 24: Analysis Report For Sample 1: Site Study
93
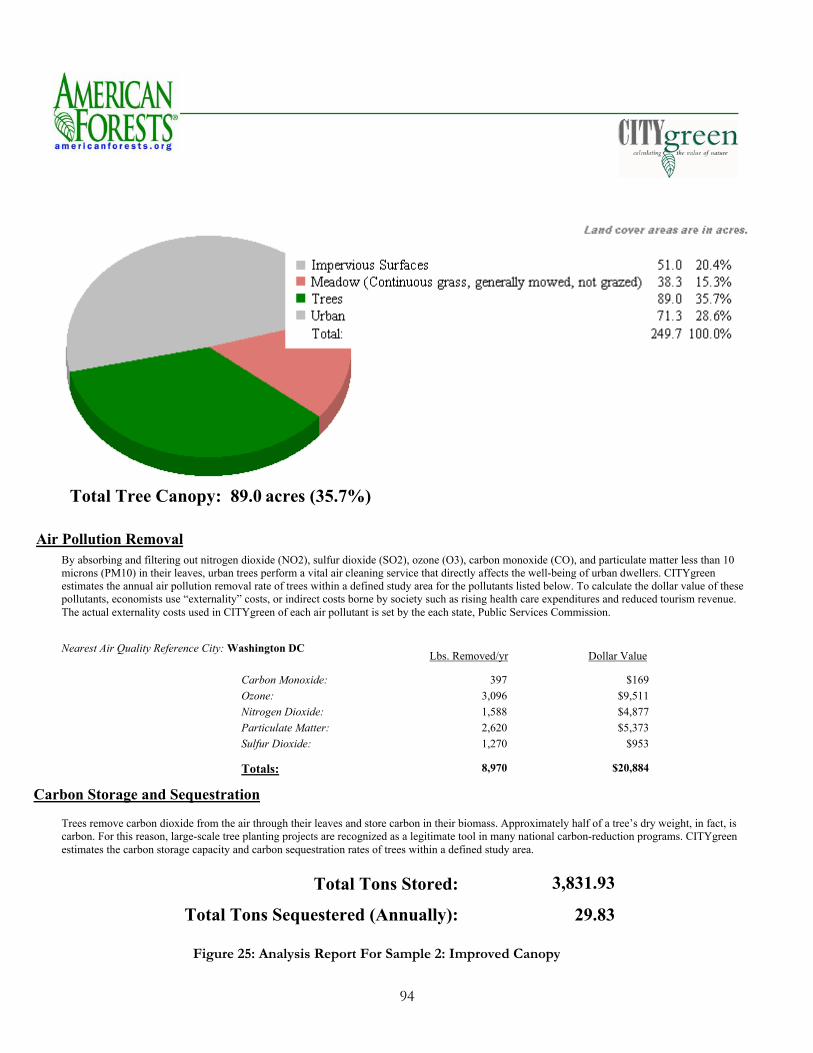
Total Tree Canopy: 89.0 acres (35.7%)
Air Pollution Removal By absorbing and filtering out nitrogen dioxide (NO2), sulfur dioxide (SO2), ozone (O3), carbon monoxide (CO), and particulate matter less than 10 microns (PM10) in their leaves, urban trees perform a vital air cleaning service that directly affects the well-being of urban dwellers. CITYgreen estimates the annual air pollution removal rate of trees within a defined study area for the pollutants listed below. To calculate the dollar value of these pollutants, economists use “externality” costs, or indirect costs borne by society such as rising health care expenditures and reduced tourism revenue. The actual externality costs used in CITYgreen of each air pollutant is set by the each state, Public Services Commission.
Nearest Air Quality Reference City: Washington DC Dollar ValueLbs. Removed/yr
Sulfur Dioxide: Particulate Matter:Nitrogen Dioxide: Ozone: Carbon Monoxide: 397 $169
$9,511 3,096$4,877 1,588$5,373 2,620
$953 1,270
Totals: 8,970 $20,884
Carbon Storage and Sequestration
Trees remove carbon dioxide from the air through their leaves and store carbon in their biomass. Approximately half of a tree’s dry weight, in fact, is carbon. For this reason, large-scale tree planting projects are recognized as a legitimate tool in many national carbon-reduction programs. CITYgreen estimates the carbon storage capacity and carbon sequestration rates of trees within a defined study area.
3,831.93Total Tons Stored:
29.83Total Tons Sequestered (Annually):
Figure 25: Analysis Report For Sample 2: Improved Canopy
94

Urban Core
1. Fishnet coverage
To create a fishnet coverage, the command GENERATE is used in Arc Info Workstation.
Cell size is 1500 m×1500 m. The number of rows and columns are selected as 17 and 20 to
define the size of the fishnet (Arc Info Workstation Help, 2004). After running the command
“BUILD,” the fishnet coverage of Beijing was built up (Map 14).
2. Canopy percentage in the urban core
To study the canopy percentage in the urban core, a new fishnet coverage was created by
the urban core boundary resulting in a subset of the original fishnet grid that represents the urban
core. In Spatial Analyst Tools, the tool “Zonal Statistics as Table” was used to summarize the
amount of tree canopy area within each cell. To calculate tree canopy in each cell, two attributes
tables were joined. Then, the percentage of tree canopy in each cell was calculated by running
the command of CALCULATE VALUE as “Tree Area/Zone Area.” Map 15 represents the
quantitative value of existing tree canopy in each cell in graduated colors. The dark green color
shows areas that contain higher amounts of tree canopy, while the red color represents areas with
lower amounts of tree canopy.
95
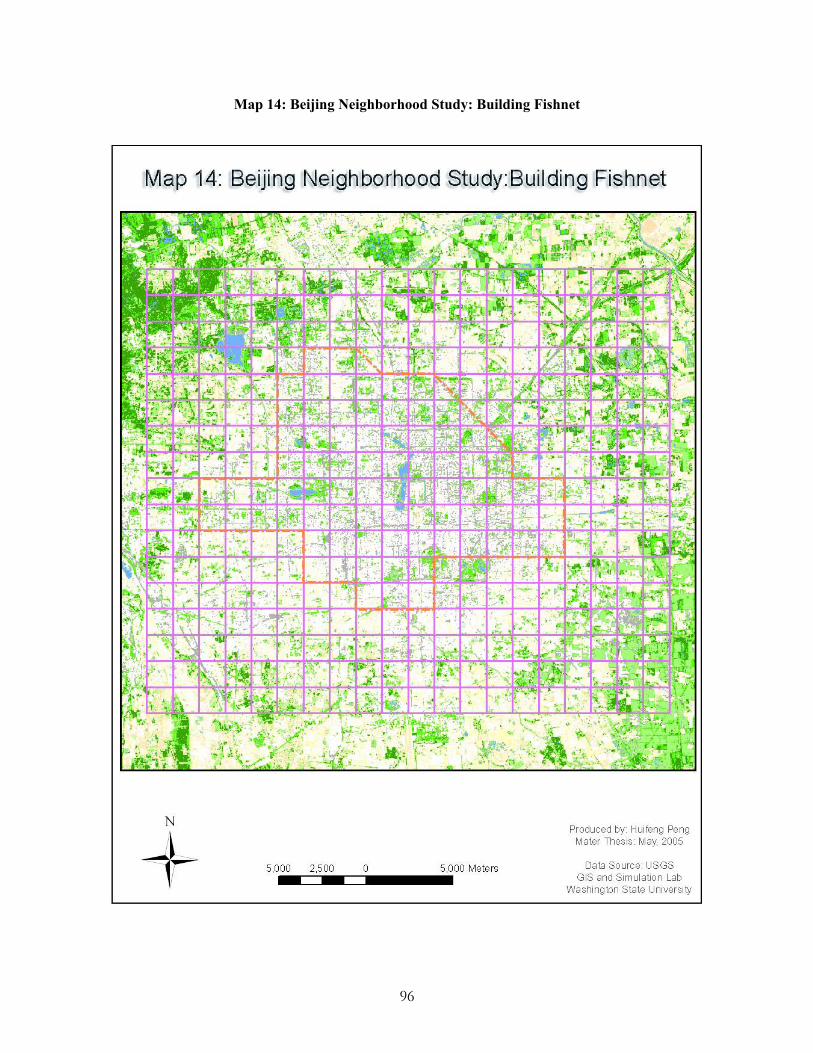
Map 14: Beijing Neighborhood Study: Building Fishnet
96
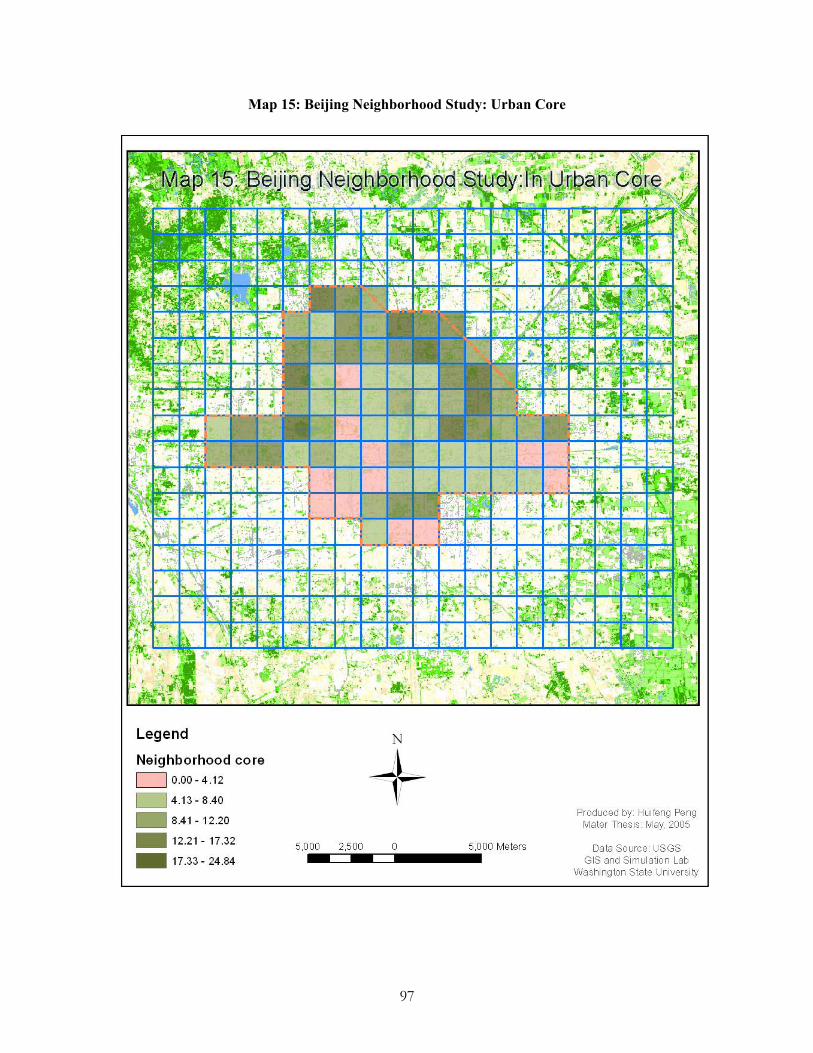
Map 15: Beijing Neighborhood Study: Urban Core
97
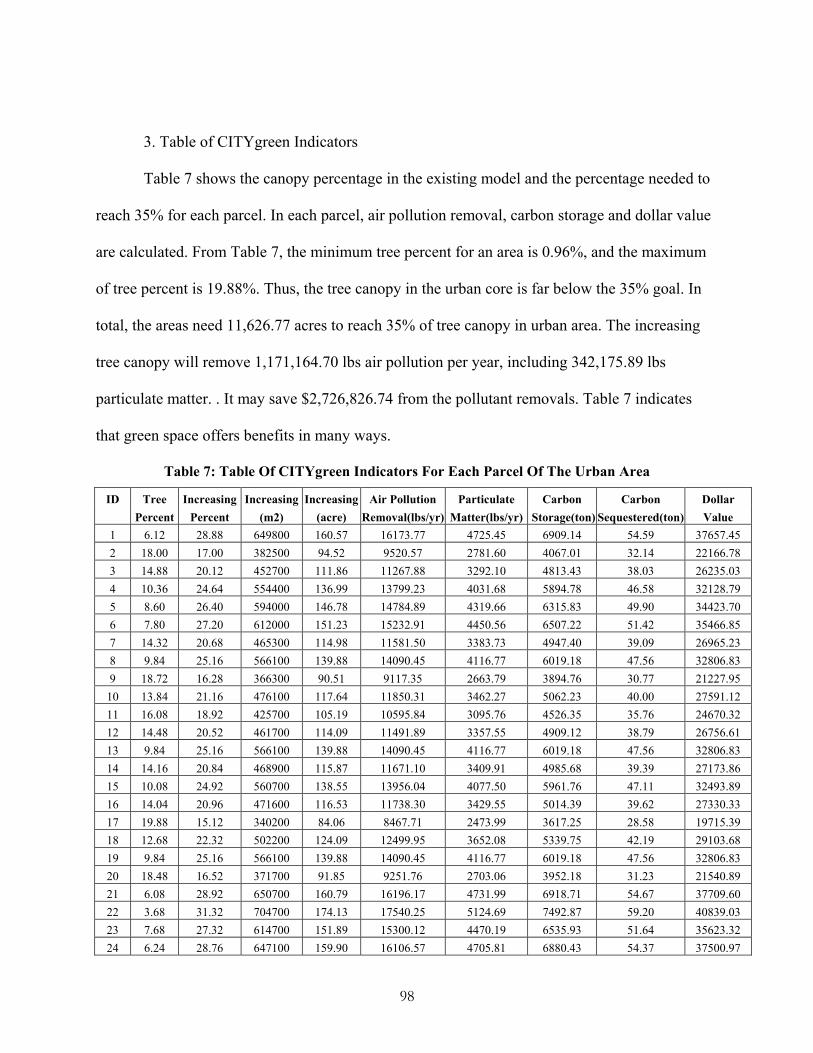
3. Table of CITYgreen Indicators
Table 7 shows the canopy percentage in the existing model and the percentage needed to
reach 35% for each parcel. In each parcel, air pollution removal, carbon storage and dollar value
are calculated. From Table 7, the minimum tree percent for an area is 0.96%, and the maximum
of tree percent is 19.88%. Thus, the tree canopy in the urban core is far below the 35% goal. In
total, the areas need 11,626.77 acres to reach 35% of tree canopy in urban area. The increasing
tree canopy will remove 1,171,164.70 lbs air pollution per year, including 342,175.89 lbs
particulate matter. . It may save $2,726,826.74 from the pollutant removals. Table 7 indicates
that green space offers benefits in many ways.
Table 7: Table Of CITYgreen Indicators For Each Parcel Of The Urban Area
ID Tree Increasing Increasing Increasing Air Pollution Particulate Carbon Carbon Dollar Percent Percent (m2) (acre) Removal(lbs/yr) Matter(lbs/yr) Storage(ton) Sequestered(ton) Value 1 6.12 28.88 649800 160.57 16173.77 4725.45 6909.14 54.59 37657.45 2 18.00 17.00 382500 94.52 9520.57 2781.60 4067.01 32.14 22166.78 3 14.88 20.12 452700 111.86 11267.88 3292.10 4813.43 38.03 26235.03 4 10.36 24.64 554400 136.99 13799.23 4031.68 5894.78 46.58 32128.79 5 8.60 26.40 594000 146.78 14784.89 4319.66 6315.83 49.90 34423.70 6 7.80 27.20 612000 151.23 15232.91 4450.56 6507.22 51.42 35466.85 7 14.32 20.68 465300 114.98 11581.50 3383.73 4947.40 39.09 26965.23 8 9.84 25.16 566100 139.88 14090.45 4116.77 6019.18 47.56 32806.83 9 18.72 16.28 366300 90.51 9117.35 2663.79 3894.76 30.77 21227.95
10 13.84 21.16 476100 117.64 11850.31 3462.27 5062.23 40.00 27591.12 11 16.08 18.92 425700 105.19 10595.84 3095.76 4526.35 35.76 24670.32 12 14.48 20.52 461700 114.09 11491.89 3357.55 4909.12 38.79 26756.61 13 9.84 25.16 566100 139.88 14090.45 4116.77 6019.18 47.56 32806.83 14 14.16 20.84 468900 115.87 11671.10 3409.91 4985.68 39.39 27173.86 15 10.08 24.92 560700 138.55 13956.04 4077.50 5961.76 47.11 32493.89 16 14.04 20.96 471600 116.53 11738.30 3429.55 5014.39 39.62 27330.33 17 19.88 15.12 340200 84.06 8467.71 2473.99 3617.25 28.58 19715.39 18 12.68 22.32 502200 124.09 12499.95 3652.08 5339.75 42.19 29103.68 19 9.84 25.16 566100 139.88 14090.45 4116.77 6019.18 47.56 32806.83 20 18.48 16.52 371700 91.85 9251.76 2703.06 3952.18 31.23 21540.89 21 6.08 28.92 650700 160.79 16196.17 4731.99 6918.71 54.67 37709.60 22 3.68 31.32 704700 174.13 17540.25 5124.69 7492.87 59.20 40839.03 23 7.68 27.32 614700 151.89 15300.12 4470.19 6535.93 51.64 35623.32 24 6.24 28.76 647100 159.90 16106.57 4705.81 6880.43 54.37 37500.97
98
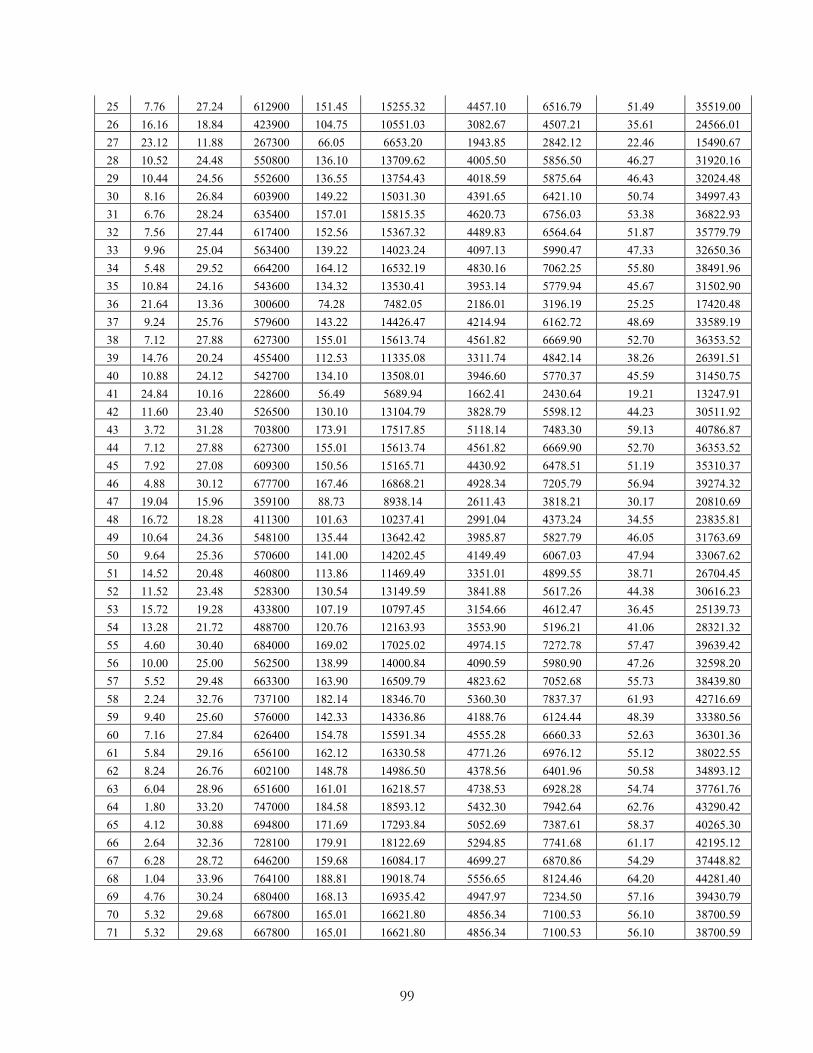
25 7.76 27.24 612900 151.45 15255.32 4457.10 6516.79 51.49 35519.00 26 16.16 18.84 423900 104.75 10551.03 3082.67 4507.21 35.61 24566.01 27 23.12 11.88 267300 66.05 6653.20 1943.85 2842.12 22.46 15490.67 28 10.52 24.48 550800 136.10 13709.62 4005.50 5856.50 46.27 31920.16 29 10.44 24.56 552600 136.55 13754.43 4018.59 5875.64 46.43 32024.48 30 8.16 26.84 603900 149.22 15031.30 4391.65 6421.10 50.74 34997.43 31 6.76 28.24 635400 157.01 15815.35 4620.73 6756.03 53.38 36822.93 32 7.56 27.44 617400 152.56 15367.32 4489.83 6564.64 51.87 35779.79 33 9.96 25.04 563400 139.22 14023.24 4097.13 5990.47 47.33 32650.36 34 5.48 29.52 664200 164.12 16532.19 4830.16 7062.25 55.80 38491.96 35 10.84 24.16 543600 134.32 13530.41 3953.14 5779.94 45.67 31502.90 36 21.64 13.36 300600 74.28 7482.05 2186.01 3196.19 25.25 17420.48 37 9.24 25.76 579600 143.22 14426.47 4214.94 6162.72 48.69 33589.19 38 7.12 27.88 627300 155.01 15613.74 4561.82 6669.90 52.70 36353.52 39 14.76 20.24 455400 112.53 11335.08 3311.74 4842.14 38.26 26391.51 40 10.88 24.12 542700 134.10 13508.01 3946.60 5770.37 45.59 31450.75 41 24.84 10.16 228600 56.49 5689.94 1662.41 2430.64 19.21 13247.91 42 11.60 23.40 526500 130.10 13104.79 3828.79 5598.12 44.23 30511.92 43 3.72 31.28 703800 173.91 17517.85 5118.14 7483.30 59.13 40786.87 44 7.12 27.88 627300 155.01 15613.74 4561.82 6669.90 52.70 36353.52 45 7.92 27.08 609300 150.56 15165.71 4430.92 6478.51 51.19 35310.37 46 4.88 30.12 677700 167.46 16868.21 4928.34 7205.79 56.94 39274.32 47 19.04 15.96 359100 88.73 8938.14 2611.43 3818.21 30.17 20810.69 48 16.72 18.28 411300 101.63 10237.41 2991.04 4373.24 34.55 23835.81 49 10.64 24.36 548100 135.44 13642.42 3985.87 5827.79 46.05 31763.69 50 9.64 25.36 570600 141.00 14202.45 4149.49 6067.03 47.94 33067.62 51 14.52 20.48 460800 113.86 11469.49 3351.01 4899.55 38.71 26704.45 52 11.52 23.48 528300 130.54 13149.59 3841.88 5617.26 44.38 30616.23 53 15.72 19.28 433800 107.19 10797.45 3154.66 4612.47 36.45 25139.73 54 13.28 21.72 488700 120.76 12163.93 3553.90 5196.21 41.06 28321.32 55 4.60 30.40 684000 169.02 17025.02 4974.15 7272.78 57.47 39639.42 56 10.00 25.00 562500 138.99 14000.84 4090.59 5980.90 47.26 32598.20 57 5.52 29.48 663300 163.90 16509.79 4823.62 7052.68 55.73 38439.80 58 2.24 32.76 737100 182.14 18346.70 5360.30 7837.37 61.93 42716.69 59 9.40 25.60 576000 142.33 14336.86 4188.76 6124.44 48.39 33380.56 60 7.16 27.84 626400 154.78 15591.34 4555.28 6660.33 52.63 36301.36 61 5.84 29.16 656100 162.12 16330.58 4771.26 6976.12 55.12 38022.55 62 8.24 26.76 602100 148.78 14986.50 4378.56 6401.96 50.58 34893.12 63 6.04 28.96 651600 161.01 16218.57 4738.53 6928.28 54.74 37761.76 64 1.80 33.20 747000 184.58 18593.12 5432.30 7942.64 62.76 43290.42 65 4.12 30.88 694800 171.69 17293.84 5052.69 7387.61 58.37 40265.30 66 2.64 32.36 728100 179.91 18122.69 5294.85 7741.68 61.17 42195.12 67 6.28 28.72 646200 159.68 16084.17 4699.27 6870.86 54.29 37448.82 68 1.04 33.96 764100 188.81 19018.74 5556.65 8124.46 64.20 44281.40 69 4.76 30.24 680400 168.13 16935.42 4947.97 7234.50 57.16 39430.79 70 5.32 29.68 667800 165.01 16621.80 4856.34 7100.53 56.10 38700.59 71 5.32 29.68 667800 165.01 16621.80 4856.34 7100.53 56.10 38700.59
99
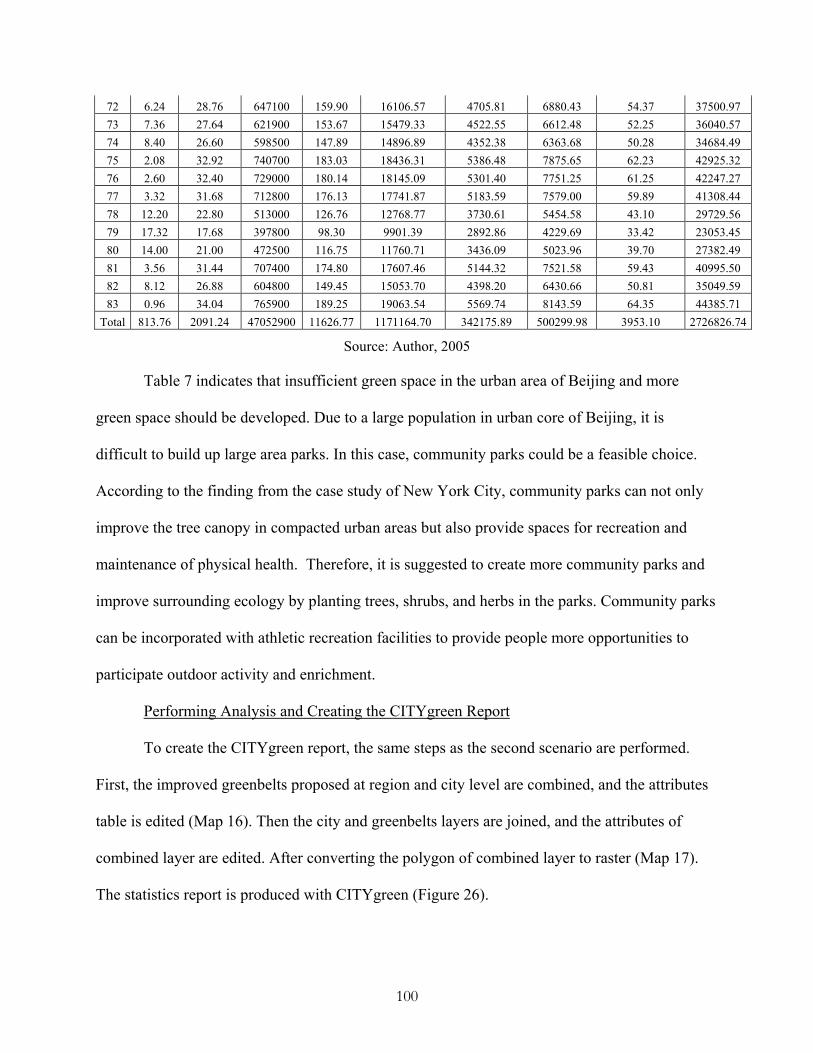
72 6.24 28.76 647100 159.90 16106.57 4705.81 6880.43 54.37 37500.97 73 7.36 27.64 621900 153.67 15479.33 4522.55 6612.48 52.25 36040.57 74 8.40 26.60 598500 147.89 14896.89 4352.38 6363.68 50.28 34684.49 75 2.08 32.92 740700 183.03 18436.31 5386.48 7875.65 62.23 42925.32 76 2.60 32.40 729000 180.14 18145.09 5301.40 7751.25 61.25 42247.27 77 3.32 31.68 712800 176.13 17741.87 5183.59 7579.00 59.89 41308.44 78 12.20 22.80 513000 126.76 12768.77 3730.61 5454.58 43.10 29729.56 79 17.32 17.68 397800 98.30 9901.39 2892.86 4229.69 33.42 23053.45 80 14.00 21.00 472500 116.75 11760.71 3436.09 5023.96 39.70 27382.49 81 3.56 31.44 707400 174.80 17607.46 5144.32 7521.58 59.43 40995.50 82 8.12 26.88 604800 149.45 15053.70 4398.20 6430.66 50.81 35049.59 83 0.96 34.04 765900 189.25 19063.54 5569.74 8143.59 64.35 44385.71
Total 813.76 2091.24 47052900 11626.77 1171164.70 342175.89 500299.98 3953.10 2726826.74
Source: Author, 2005
Table 7 indicates that insufficient green space in the urban area of Beijing and more
green space should be developed. Due to a large population in urban core of Beijing, it is
difficult to build up large area parks. In this case, community parks could be a feasible choice.
According to the finding from the case study of New York City, community parks can not only
improve the tree canopy in compacted urban areas but also provide spaces for recreation and
maintenance of physical health. Therefore, it is suggested to create more community parks and
improve surrounding ecology by planting trees, shrubs, and herbs in the parks. Community parks
can be incorporated with athletic recreation facilities to provide people more opportunities to
participate outdoor activity and enrichment.
Performing Analysis and Creating the CITYgreen Report
To create the CITYgreen report, the same steps as the second scenario are performed.
First, the improved greenbelts proposed at region and city level are combined, and the attributes
table is edited (Map 16). Then the city and greenbelts layers are joined, and the attributes of
combined layer are edited. After converting the polygon of combined layer to raster (Map 17).
The statistics report is produced with CITYgreen (Figure 26).
100
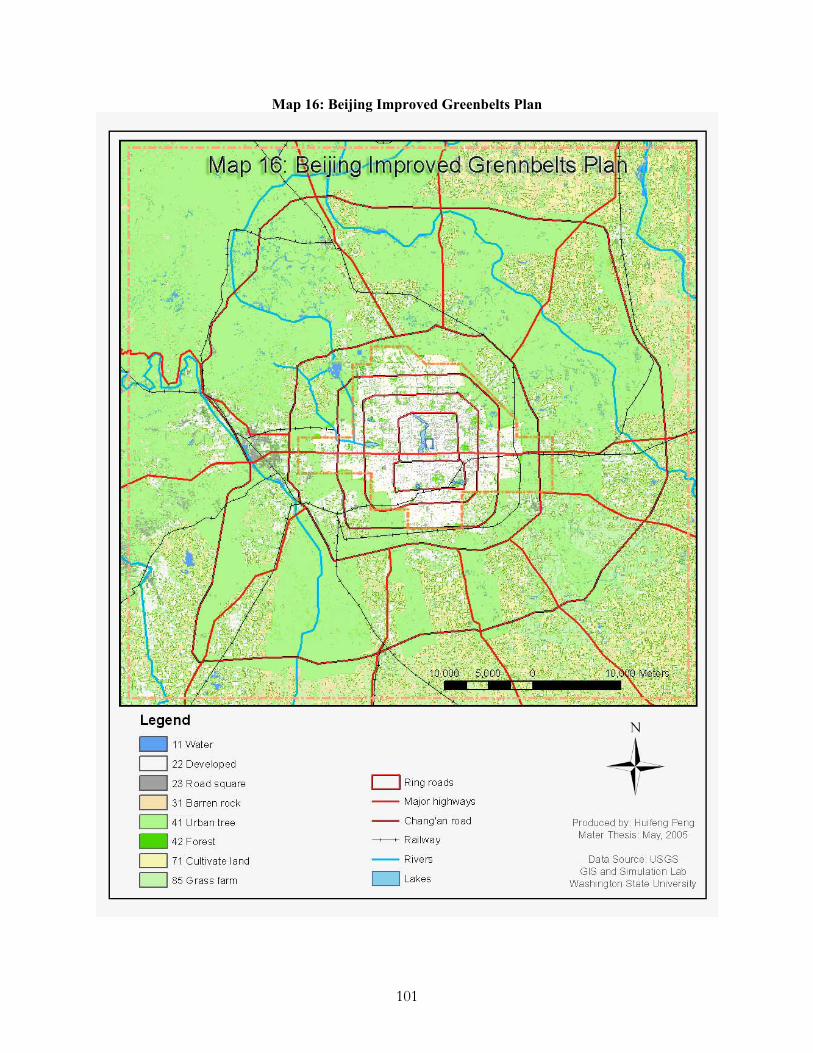
Map 16: Beijing Improved Greenbelts Plan
101
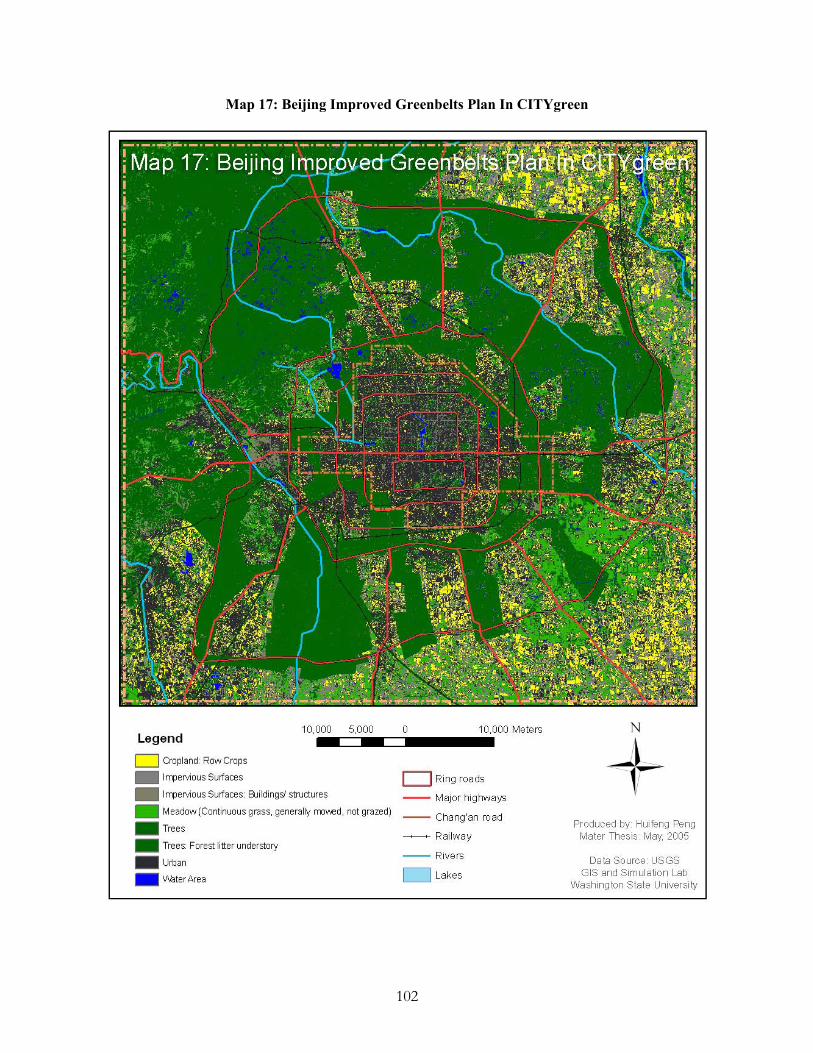
Map 17: Beijing Improved Greenbelts Plan In CITYgreen
102
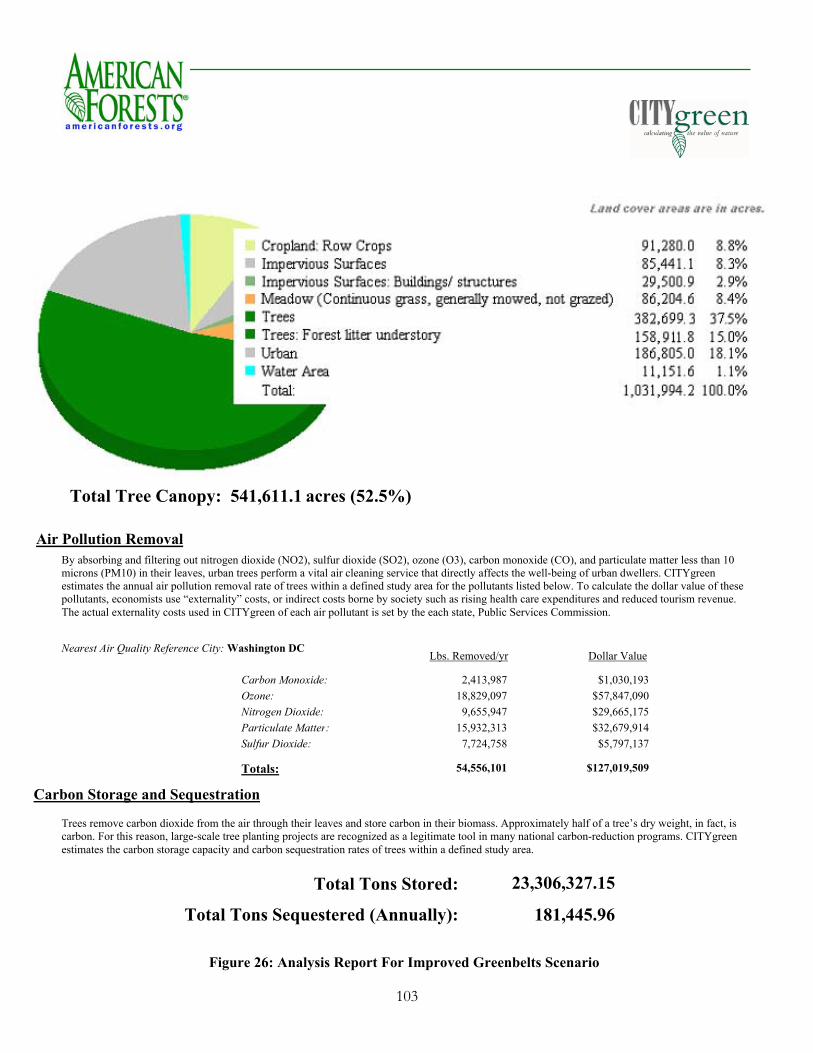
Total Tree Canopy: 541,611.1 acres (52.5%)
Air Pollution Removal By absorbing and filtering out nitrogen dioxide (NO2), sulfur dioxide (SO2), ozone (O3), carbon monoxide (CO), and particulate matter less than 10 microns (PM10) in their leaves, urban trees perform a vital air cleaning service that directly affects the well-being of urban dwellers. CITYgreen estimates the annual air pollution removal rate of trees within a defined study area for the pollutants listed below. To calculate the dollar value of these pollutants, economists use “externality” costs, or indirect costs borne by society such as rising health care expenditures and reduced tourism revenue. The actual externality costs used in CITYgreen of each air pollutant is set by the each state, Public Services Commission.
Nearest Air Quality Reference City: Washington DC Dollar ValueLbs. Removed/yr
Sulfur Dioxide: Particulate Matter:Nitrogen Dioxide: Ozone: Carbon Monoxide: 2,413,987 $1,030,193
$57,847,090 18,829,097$29,665,175 9,655,947$32,679,914 15,932,313
$5,797,137 7,724,758
Totals: 54,556,101 $127,019,509
Carbon Storage and Sequestration
Trees remove carbon dioxide from the air through their leaves and store carbon in their biomass. Approximately half of a tree’s dry weight, in fact, is carbon. For this reason, large-scale tree planting projects are recognized as a legitimate tool in many national carbon-reduction programs. CITYgreen estimates the carbon storage capacity and carbon sequestration rates of trees within a defined study area.
23,306,327.15Total Tons Stored:
181,445.96Total Tons Sequestered (Annually):
Figure 26: Analysis Report For Improved Greenbelts Scenario
103
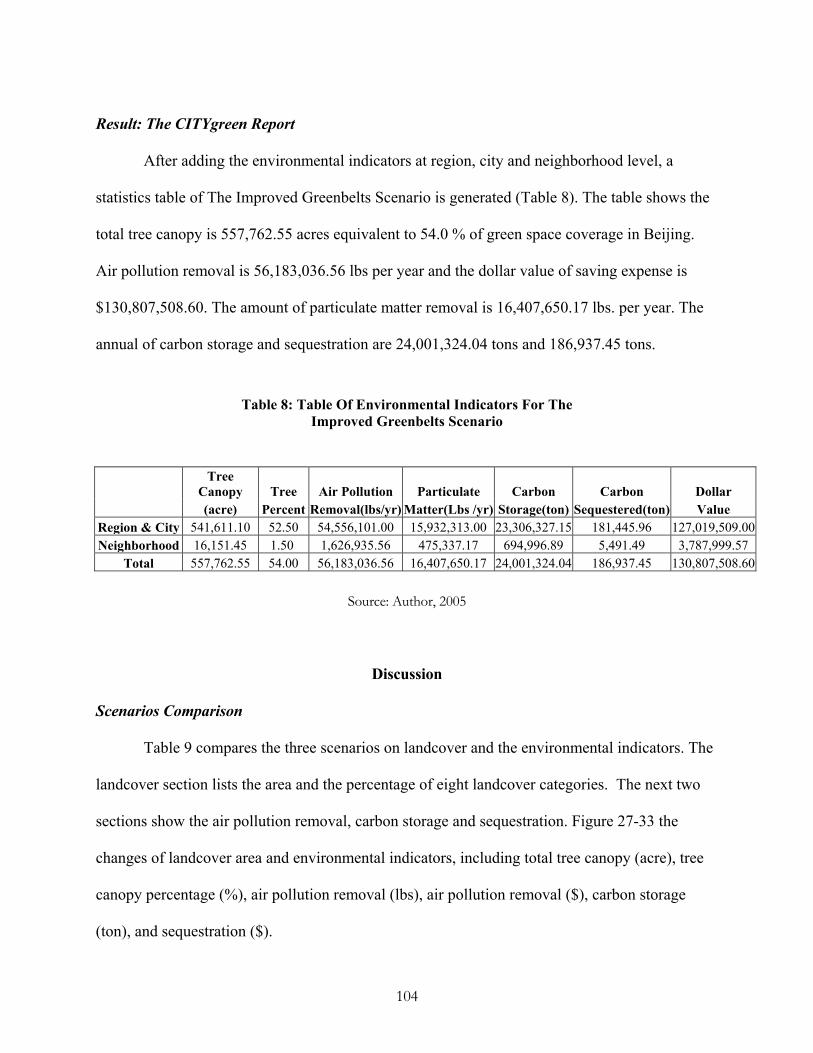
Result: The CITYgreen Report
After adding the environmental indicators at region, city and neighborhood level, a
statistics table of The Improved Greenbelts Scenario is generated (Table 8). The table shows the
total tree canopy is 557,762.55 acres equivalent to 54.0 % of green space coverage in Beijing.
Air pollution removal is 56,183,036.56 lbs per year and the dollar value of saving expense is
$130,807,508.60. The amount of particulate matter removal is 16,407,650.17 lbs. per year. The
annual of carbon storage and sequestration are 24,001,324.04 tons and 186,937.45 tons.
Table 8: Table Of Environmental Indicators For The Improved Greenbelts Scenario
Tree
Canopy Tree Air Pollution Particulate Carbon Carbon Dollar (acre) Percent Removal(lbs/yr) Matter(Lbs /yr) Storage(ton) Sequestered(ton) Value
Region & City 541,611.10 52.50 54,556,101.00 15,932,313.00 23,306,327.15 181,445.96 127,019,509.00Neighborhood 16,151.45 1.50 1,626,935.56 475,337.17 694,996.89 5,491.49 3,787,999.57
Total 557,762.55 54.00 56,183,036.56 16,407,650.17 24,001,324.04 186,937.45 130,807,508.60
Source: Author, 2005
Discussion
Scenarios Comparison
Table 9 compares the three scenarios on landcover and the environmental indicators. The
landcover section lists the area and the percentage of eight landcover categories. The next two
sections show the air pollution removal, carbon storage and sequestration. Figure 27-33 the
changes of landcover area and environmental indicators, including total tree canopy (acre), tree
canopy percentage (%), air pollution removal (lbs), air pollution removal ($), carbon storage
(ton), and sequestration ($).
104
It can be seen in Figure 27 that the tree canopy increases from 228,609 acres in the first
scenario to 557,763 acres in the third scenario, corresponding to a tree canopy percentage
increasing from 22.20% to 54.0% (Figure 28). The increasing tree canopy leads to enhance the
amounts of air pollution removal and carbon storage. The total air pollution removal increases
from 23,027,608 lbs per year to 56,183,037 lbs, corresponding to a dollar value increasing from
$53,613,718 for the first scenario to $130,807,509 for the third scenario (Figure 29-30). The
particulate matter (PM) removal increases by approximately 10,000,000 lbs per year (from
6,724,877 lbs to 16,407,605 lbs per year) (Figure 31). Carbon storage increases from 9,837,378
tons to 24,001,324 tons, and the carbon sequestration from $76,587 to $186,938 (Figure 32-33).
105
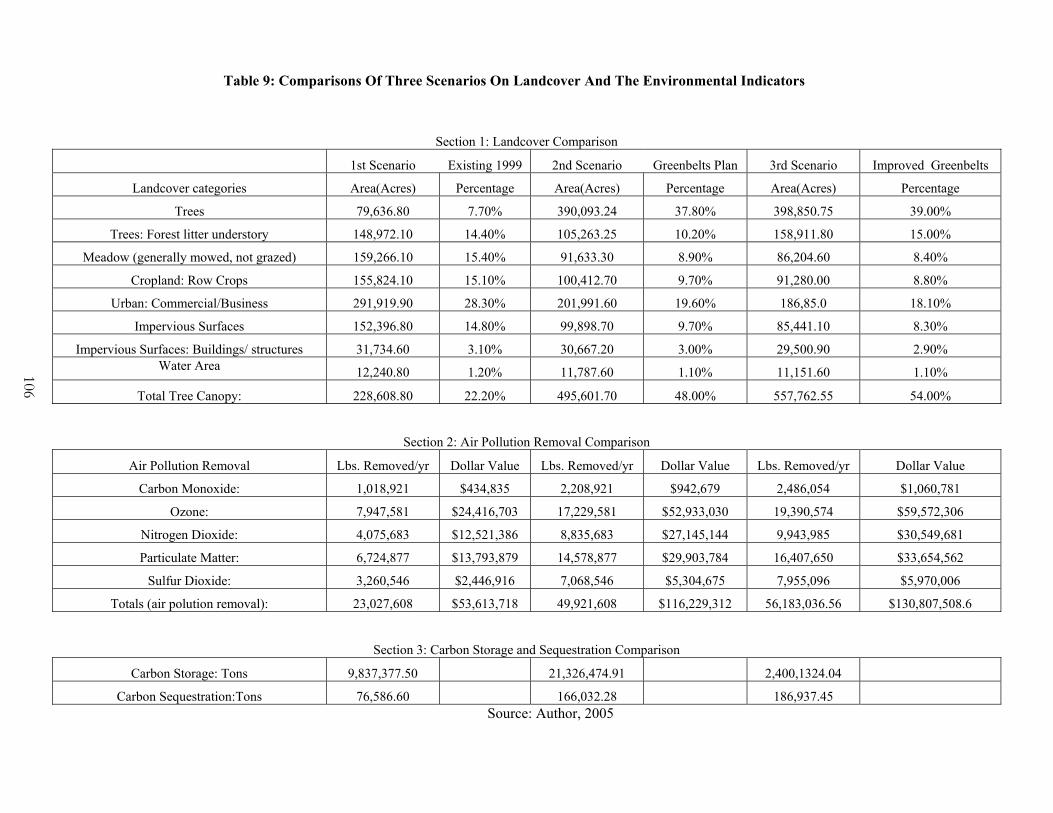
Table 9: Comparisons Of Three Scenarios On Landcover And The Environmental Indicators
Section 1: Landcover Comparison
1st Scenario Existing 1999 2nd Scenario Greenbelts Plan 3rd Scenario Improved Greenbelts
Landcover categories Area(Acres) Percentage Area(Acres) Percentage Area(Acres) Percentage
Trees 79,636.80 7.70% 390,093.24 37.80% 398,850.75 39.00%
Trees: Forest litter understory 148,972.10 14.40% 105,263.25 10.20% 158,911.80
Meadow (generally mowed, not grazed) 159,266.10 15.40% 91,633.30 8.90% 86,204.60 8.40%
Cropland: Row Crops 155,824.10 15.10% 100,412.70 9.70% 91,280.00 8.80%
Urban: Commercial/Business 291,919.90 28.30% 201,991.60 19.60% 186,85.0 18.10%
Impervious Surfaces 152,396.80 14.80% 99,898.70 9.70% 85,441.10 8.30%
Impervious Surfaces: Buildings/ structures 31,734.60 3.10% 30,667.20 3.00% 29,500.90 2.90%Water Area 12,240.80 1.20% 11,787.60 1.10% 11,151.60 1.10%
Total Tree Canopy: 228,608.80 22.20% 495,601.70 48.00% 557,762.55 54.00%
Section 2: Air Pollution Removal Comparison
Air Pollution Removal Lbs. Removed/yr Dollar Value Lbs. Removed/yr Dollar Value Lbs. Removed/yr Dollar Value
Carbon Monoxide: 1,018,921 $434,835 2,208,921 $942,679 2,486,054 $1,060,781
Ozone: 7,947,581 $24,416,703 17,229,581 $52,933,030 19,390,574 $59,572,306
Nitrogen Dioxide: 4,075,683 $12,521,386 8,835,683 $27,145,144 9,943,985 $30,549,681
Particulate Matter: 6,724,877 $13,793,879 14,578,877 $29,903,784 16,407,650 $33,654,562
Sulfur Dioxide: 3,260,546 $2,446,916 7,068,546 $5,304,675 7,955,096 $5,970,006
Totals (air polution removal): 23,027,608 $53,613,718 49,921,608 $116,229,312 56,183,036.56 $130,807,508.6
Section 3: Carbon Storage and Sequestration Comparison
Carbon Storage: Tons 9,837,377.50 21,326,474.91 2,400,1324.04
Carbon Sequestration:Tons 76,586.60 166,032.28 186,937.45
15.00%
106
Source: Author, 2005
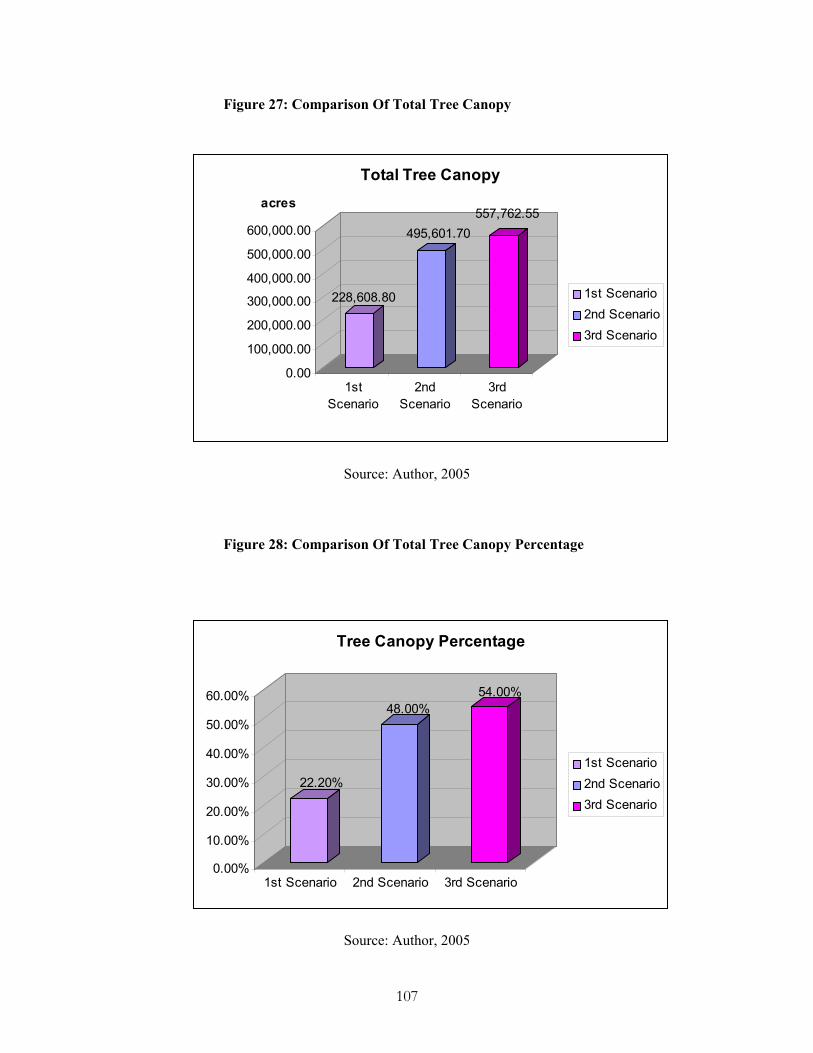
Figure 27: Comparison Of Total Tree Canopy
228,608.80
495,601.70557,762.55
0.00
100,000.00
200,000.00
300,000.00
400,000.00
500,000.00
600,000.00
acres
1stScenario
2ndScenario
3rdScenario
Total Tree Canopy
1st Scenario2nd Scenario3rd Scenario
Source: Author, 2005
Figure 28: Comparison Of Total Tree Canopy Percentage
22.20%
48.00%54.00%
0.00%
10.00%
20.00%
30.00%
40.00%
50.00%
60.00%
1st Scenario 2nd Scenario 3rd Scenario
Tree Canopy Percentage
1st Scenario2nd Scenario3rd Scenario
Source: Author, 2005
107
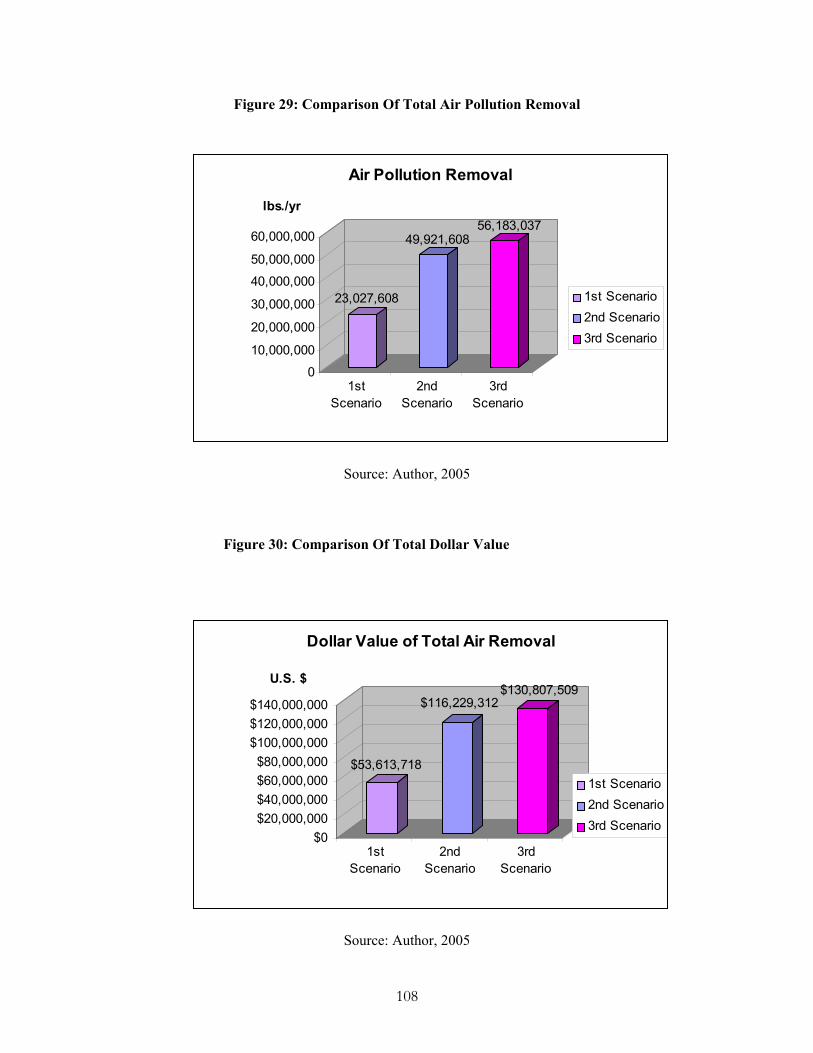
Figure 29: Comparison Of Total Air Pollution Removal
23,027,608
49,921,60856,183,037
0
10,000,000
20,000,000
30,000,000
40,000,000
50,000,000
60,000,000
lbs./yr
1stScenario
2ndScenario
3rdScenario
Air Pollution Removal
1st Scenario2nd Scenario3rd Scenario
Source: Author, 2005
Figure 30: Comparison Of Total Dollar Value
$53,613,718
$116,229,312$130,807,509
$0$20,000,000$40,000,000$60,000,000$80,000,000
$100,000,000$120,000,000$140,000,000
U.S. $
1stScenario
2ndScenario
3rdScenario
Dollar Value of Total Air Removal
1st Scenario2nd Scenario3rd Scenario
Source: Author, 2005
108
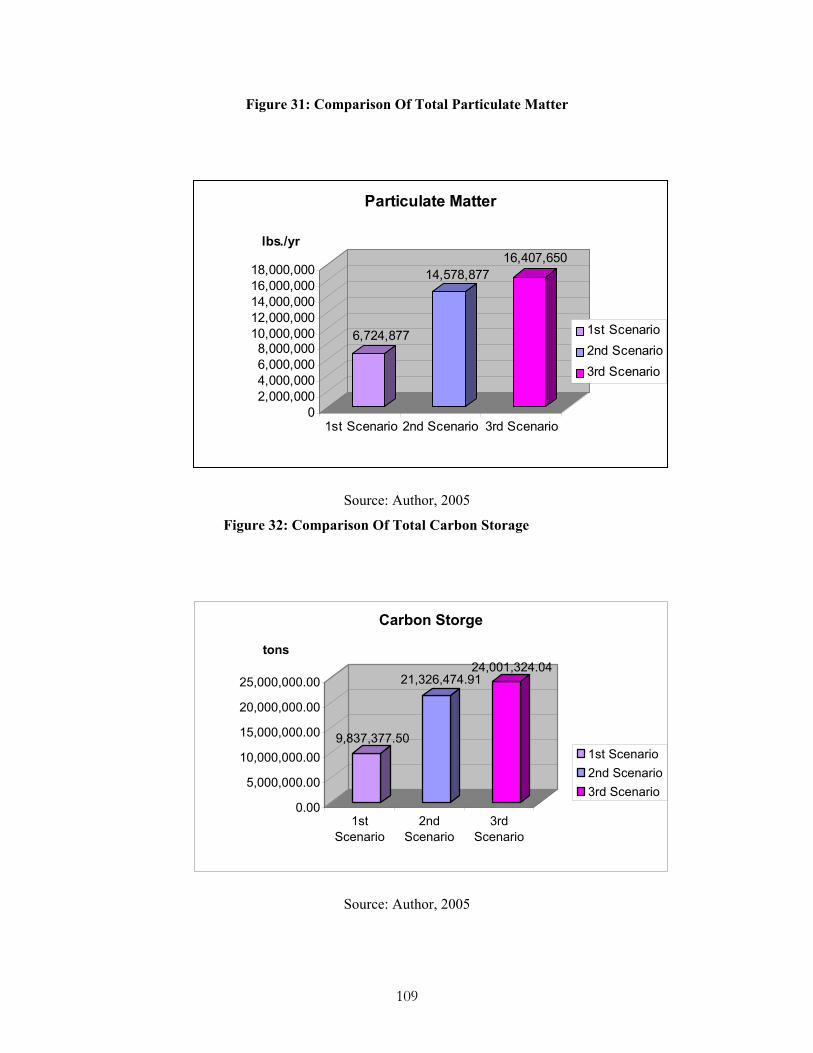
Figure 31: Comparison Of Total Particulate Matter
6,724,877
14,578,87716,407,650
02,000,0004,000,0006,000,0008,000,000
10,000,00012,000,00014,000,00016,000,00018,000,000
lbs./yr
1st Scenario 2nd Scenario 3rd Scenario
Particulate Matter
1st Scenario2nd Scenario3rd Scenario
Source: Author, 2005
Figure 32: Comparison Of Total Carbon Storage
9,837,377.50
21,326,474.9124,001,324.04
0.00
5,000,000.00
10,000,000.00
15,000,000.00
20,000,000.00
25,000,000.00
tons
1stScenario
2ndScenario
3rdScenario
Carbon Storge
1st Scenario2nd Scenario3rd Scenario
Source: Author, 2005
109
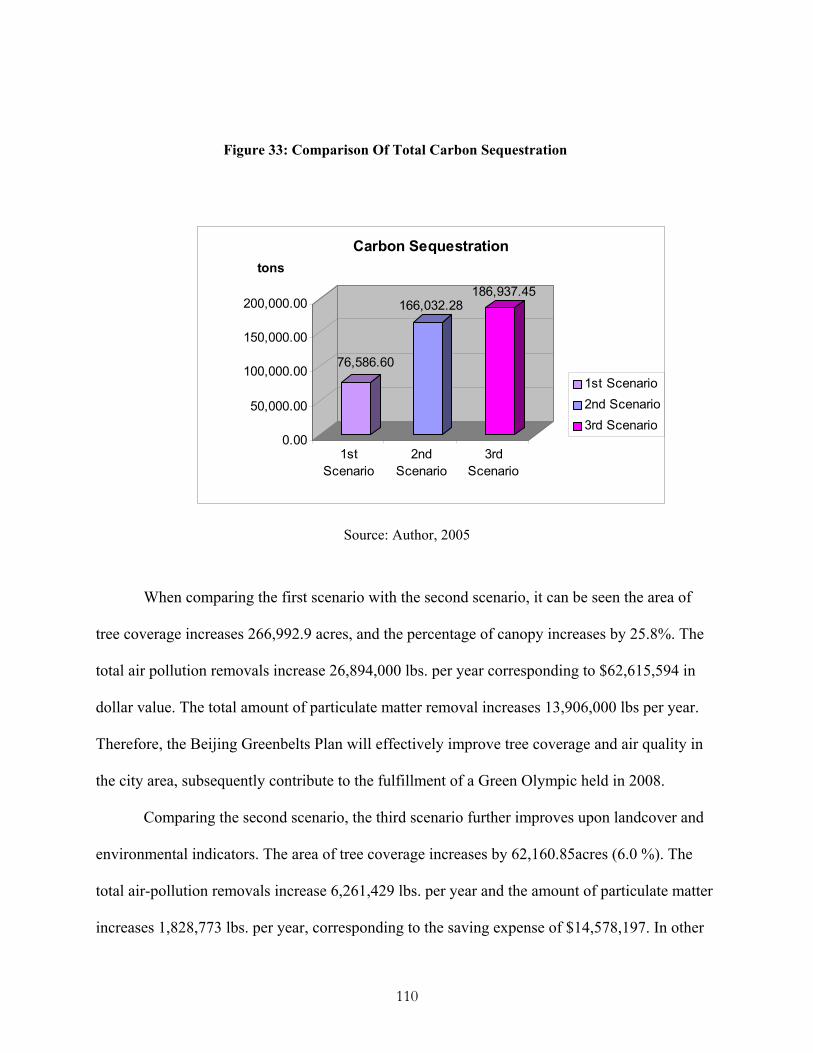
Figure 33: Comparison Of Total Carbon Sequestration
76,586.60
166,032.28186,937.45
0.00
50,000.00
100,000.00
150,000.00
200,000.00
tons
1stScenario
2ndScenario
3rdScenario
Carbon Sequestration
1st Scenario2nd Scenario3rd Scenario
Source: Author, 2005
When comparing the first scenario with the second scenario, it can be seen the area of
tree coverage increases 266,992.9 acres, and the percentage of canopy increases by 25.8%. The
total air pollution removals increase 26,894,000 lbs. per year corresponding to $62,615,594 in
dollar value. The total amount of particulate matter removal increases 13,906,000 lbs per year.
Therefore, the Beijing Greenbelts Plan will effectively improve tree coverage and air quality in
the city area, subsequently contribute to the fulfillment of a Green Olympic held in 2008.
Comparing the second scenario, the third scenario further improves upon landcover and
environmental indicators. The area of tree coverage increases by 62,160.85acres (6.0 %). The
total air-pollution removals increase 6,261,429 lbs. per year and the amount of particulate matter
increases 1,828,773 lbs. per year, corresponding to the saving expense of $14,578,197. In other
110
words, by increasing the tree canopy by 6.0% will remove 6,261,429 lbs. of air pollutants a year
and save expenses of $14,578,197.
Compared to the large improvement brought about by conducting the second scenario,
the change in environmental indicators caused by the third scenario seems not to be significant.
However, rather than simply increasing tree coverage, the third scenario improves the
distribution of Beijing’s greenbelts by using different approaches at different levels. This is
accomplished by enhancing the northwest of greenbelts to hamper sandstorms, reducing the
southeastern greenbelts to increase moisture, creating connectivity between parks, and buffering
along roads and rivers to make Beijing’s green space as an organic, integrated and
interconnected system.
Moreover, rather than only considering green area as a whole as did the second scenario,
the third scenario makes an in depth analysis that calculated tree canopy for neighborhood-size
areas and suggested concrete amounts of tree area needed for each cell to realize 35% tree
canopy. Thus, the modifications in the third scenario could benefit Beijing’s ecosystem from the
regional level down to the neighborhood level. Its application is expected to achieve significant
improvement for Beijing’s environment system not only from macro perspective but also from
micro perspective.
Other Considerations
As a historic city with high population density, Beijing’s greenbelts construction
experiences more difficulty than newly developed cities. It is necessary to comprehensively
consider every aspect and take them into account. In this section, other considerations are
discussed based on landscape ecology principles and case studies represented in Literature Review.
111
Multi-functions of Greenbelt
Greenbelts could be a pleasant space where the citizens can escape the tarmac and
concrete world, and get in touch with nature, breathe fresh air, and smell the earth, trees and
flowers. This function is extremely useful in Beijing’s case because of the lack of public green
space and physical exercise fields. According to the Beijing Greenbelts Plan, the second
greenbelt will be built at the edge of the city. The greenbelt could be a transition between the
concrete urban area and the natural forest for recreation. Yet, the plan does not fully consider the
function. It is better to build up more free access to public parks and children’s playgrounds.
Furthermore, the greenbelt in the northwest of Beijing is adjacent to the mountain area. A part of
the greenbelt could be an ecological park for public education. In this way, the greenbelt will
contribute to the improvement for the life quality of Beijing residents.
Plants species selection and arrangement
According to the results from the case study of Canadian greenbelts, plant species
selection and arrangement play an important role in terms of achieving the best ecological effect,
such as hampering sandstorms. It is suggested that “a five-row conifers with an outside row of
shrubs on two sides greenbelts, a double row of deciduous trees and a double inner row of
conifers with staggered spaces is the ideal design for protection from both sandstorms and
blowing snow” (Agriculture and Agri-Food Canada, 2003, np). This method is also suitable for
Beijing which suffers strong sandstorms in spring and intensive snow in winter. Moreover,
conifers are one of the popular tree species in Beijing. Therefore, Beijing could select specific
conifers as a major species and develop properly arrangement for the greenbelt in the mountain
area.
112
In addition, the greenbelt can produce large economic benefits if proper plant species are
selected. This is particularly important because the local residents, many being peasants, will
probably lose their income source when the farmland is changed to a forest planting area. Fruit
trees, such as apple trees could planted as they can provide not only the ecological but economic
benefits.
Vertical greening for high-density area
The compact urban core of Beijing features high-density settlement and crowded
communities with inadequate green space, which make it difficult to implement green space
plan. Turner proposed that vertical greening is an effective way to increase green space in highly
developed areas. The approach is suitable for Beijing’s current situation. Vertical greening can
increase tree canopy and provide vertical richness. Beijing may reinforce vertical greening
projects by developing roof gardens, wall greening, balcony greening, and windowsill greening.
Historic resource preservation
As a capital city with a long history, Beijing has a variety of historic and cultural
resources, including historic districts, archaeological sites, and natural heritage areas, such as
imperial parks and ancient temples. Visiting historic sites is an enjoyable recreational activity
that provides people an opportunity to learn about the culture and history of an area. In fact,
historic sites are the major pillars supporting Beijing’s tourism and travel industry.
Unfortunately, many historic sites and areas face demolition and deterioration during the urban
development as well as in the course of green space construction. Therefore, the approach
should enhance historic preservation during a process of developing greenbelts. Historic sites
should be registered officially, and proper legislation should be established to protect historic
properties and scenic views.
113
Policy and management
With the coming event of the 2008 Olympic Games, Beijing is facing a great opportunity
as well as big challenge. The present study shows the Beijing Greenbelts Plan could almost reach
its goal. However, doing this is much harder than planning. It will be a tough job to put this plan
into implementation. During implementation of the greenbelts plan, special attentions should be
paid to two questions. The first question is how to protect farmers’ economic benefits when their
farmlands are occupied for growing trees. As the Beijing greenbelts occupy a large amount of
agricultural lands from which local farmers make their livings. The economic issue is always a
key point in the process of implementing greenbelts plan, considering that China is still a
developing country. To establish successful and sustainable greenbelts, it is worth doing in-depth
research and in keeping a good balance between ecological and economic benefits.
The second question is about management. The previous greenbelts plans failed due to
rapid real estate development. In order to guarantee the normal operation of the greenbelt project,
it is necessary to adopt appropriate policies which provide restrictions to developers and protect
greenbelts from tampering. Management is one of the important factors on green space in
Beijing, which makes a difference in providing successful and sustainable outcomes. Studies
should be carried out to explore effective management systems in order to provide a context for
the restoration and conservation of greenbelts in urban areas. There is a lot of work to do to
implement the greenbelts plan successfully and subsequently realize the proposed “Green
Olympic” in 2008.
Summary
In this chapter, the analyses of the three scenarios were conducted and the results were
discussed. The areas for different landcover categories and environmental indicators were
114
calculated by CITYgreen software. The result shows the Beijing Greenbelts Plan will almost
realize its goal of 50% tree canopy in the city area, if the greenbelts are developed successfully
as the Beijing Greenbelts Plan proposed. The tree canopy will increase from 22.20% in 1999 to
54.0% in the Improved Greenbelts Scenario, corresponding to the total of air pollution removal
increasing from 23,027,608 lbs. per year to 54,556,101 lbs. per year. The particulate matter (PM)
removal will increase by approximately 10,000,000 lbs. per year.
The third scenario (Improved Greenbelts Scenario) was conducted to make improvement
from the Beijing Greenbelts Plan. Aiming to make an integrated ecological network for urban
sustainable development of Beijing, modifications were suggested based on landscape ecology
principles combining Beijing’s specific situation. The modifications were demonstrated at three
different levels: the region, the city, and the neighborhood. The strategies used in the third
scenario are to widen edges on the sides facing the predominant wind direction and open the
south side of the greenbelts at region level, to enhance connectivity of green network and build
up buffer zones along roads and rivers at city level, and to create community parks at neighbor
level.
The analysis shows the implementation of the Greenbelts Plan may significantly inhibit
the severity of sandstorms by reducing 10% wind speed subsequently decreasing sand volume
transported into Beijing city. However, the construction of the studied greenbelts by themselves
will not make Beijing air quality meet the National Grade II Standard. The third greenbelt as
well as other measures will be needed to work together to realize the goal.
In addition, recreational and educational functions of the greenbelts are suggested to be
strengthened; conifers and trees with economical values are recommended to be selected in
Beijing; vertical greening could be considered as a good strategy which is particularly suitable
115

for Beijing’s high density urban area. It also suggests that measures should be taken to preserve
historic resources during the construction of greenbelts.
116
Chapter Six: Conclusion and Recommendations
Conclusion
In this thesis, the Beijing Greenbelts Plan was described and examined from both
ecological and scientific perspectives. Landscape ecological principles provide conceptual and
qualitative explanations on examining Beijing greenbelts, while two software packages,
ARCGIS and CITYgreen, offer quantitative evaluation on the greenbelts plan. Three scenarios
correspond to existing green space in 1999, the Beijing Greenbelts Plan and the improved
greenbelts plan were created, analyzed and compared.
The analysis for the first and second scenario indicates the Beijing Greenbelts Plan can
almost realize its goal (50% tree canopy in city area). The tree canopy will increase from 22.20%
in 1999 to 48.0%, corresponding to a total removal of air pollution increasing from 23,027,608
lbs. per year to 49,921,608 lbs. per year. The third scenario (Improved Greenbelts) can further
increase tree canopy to 54.0%, corresponding to air pollution removal of 56,183,036.56 lbs. per
year. The statistics report shows that the third scenario brings about 10,000,000 lbs. particulate
matter (PM) than the first scenario.
The implementation of the Beijing Greenbelts Plan may decrease sand volume
transported into the city by reducing wind speed. However, the construction of the studied
greenbelts by themselves will not make Beijing air quality meet the National Grade II Standard.
The third greenbelt as well as other measures will be needed to work together to realize the goal.
117
Recommendations
One of the major purposes for the study is to examine the Beijing Greenbelts Plan and
suggest the improvements. Based on the analysis conducted and combined with Beijing’s
specific situation, recommendations are given below as an attempt to improve the Beijing
Greenbelts Plan as well as green space construction:
1. At the region level, widen edges on the sides face the predominant wind direction
and leave the south sides open to hamper sandstorm and receive more precipitation.
2. At the city level, create green network and build up buffer zone along roads and
rivers to make Beijing green space an interconnected system and an organic whole.
3. At the neighborhood level, community parks could be a good way to increase green
space and provide recreation sites for local residents.
4. Conifers could be selected as a major plant species for the greenbelts, and fruit trees
might be planted to achieve economic benefits.
5. Vertical greening could be an efficient way to improve tree canopy in a high-density
area.
6. More attention should be paid to make use of multi-functions of the greenbelts, such
as recreational and educational functions.
7. Care should be taken to preserve historic resources during greenbelt construction.
8. Special attentions should be paid to policies and management to keep a good balance
between ecological and economic benefits.
Beijing is facing big challenges like the transformation of industrial economy with a
rapid growth of population; more practice and time are needed to implement the Beijing
118
Greenbelts Plan successfully. It is believed that Beijing will develop an integrated network of
urban green space and have a better environment for “Green Olympic City 2008” after three
greenbelts are accomplished.
Limitations and Future Research
The study analyzes the Beijing Greenbelts Plan based on landscape ecology principles
and the application of CITYgreen from both qualitative and quantitative perspectives. However,
there are still some limitations in the study.
In this study, ARCGIS and CITYgreen software were used to make quantitative
evaluation and statistical assessment for the Beijing Greenbelts Plan. Approaches were proposed
to improve the greenbelts plan based on landscape ecological principles as well as Beijing’s
specific situation. Due to limitations in the study, there will be a lot of work to do in the future.
Limitation on Data Collection
This study was carried out in the USA. The information on Beijing greenbelts was mostly
collected from open websites or provided by friends in China. Therefore, the information may be
incomplete. Field study is needed in the future research to collect first-hand information, which
will keep the study up-to-date and more accurate to reflect actual situation.
Influence of Periphery Region
This study investigated the greenbelts plan in a confined Beijing area. However, the
ecosystem is an integrated organic system, with various elements interconnected and interacted.
To make a more reasonable plan, the greenbelts plan should go beyond the city to take into
account the regional environment. In the future study, it is necessary to consider the greenbelts
119
plan in a larger ecosystem, including interactions between different ecological elements such as
water, air, soil and connectivity with other areas around Beijing.
Limitations of CITYgreen Software
The calculation of dollar values used Washington, D.C. for reference. As the health care
and medical systems are different from China and America, the dollar values may not be
appropriate to reflect the situation in Beijing. It would be better if the software could develop dollar
value modeling for different Chinese cities.
The indicator of air pollution removal on a site does not reflect varieties of types of green
space. Nor does it represent the quality of green space. In other words, the indicator of air
pollution removal per square meter of tree canopy is the same, regardless whether a site is well
tree covered or poorly vegetated. An effective method to assess air pollution removal is needed.
It is well known that the size and age of trees make a significant difference in air
pollution removal and carbon storage. However, the calculation of tree canopy in CITYgreen
does not include the difference of the size of trees. In other words, the software does not change
the indicator no matter whether the tree is big or small. To provide an accurate method to assess
the quality of air and pollution removal, the ecological indicator of tree canopy needs to consider
growing state of the trees to fulfill requirements of future research.
120
BIBLIOGRAPHY
Agriculture and Agri-Food Canada. (2003). Shelterbelts help cut heating costs. Retrieved January 15, 2005, from http://www.agr.gc.ca/pfra/shelterbelt/shbpub25.htm
American Forests. (2003). CITYgreen: measuring urban ecosystem value. Retrieved February 12,
2005, from www.americanforests.org/productsandpubs/CITYgreen/ Anderson, L. (2002). Conservationist, Planner, and Creator of the Appalachian Trail. (pp. 33).
Baltimore: Johns Hopkins University Press. Asian Development Bank. (2003). Urban Air Quality Management and Practice in Asia Cities.
Retrieved in February 1, 2005, from http://www.asiairnet.org/publications/Report_contents.pdf
Baschak, L.A. & Brown, R.D. (1995). An ecological framework for the planning, design and
management of urban river greenways. Landscape and Urban Planning 33, 211–225. Beijing Academy of Environmental Sciences. (1998). Research report: compounding
environmental protection policy study for developing gas fuel in Beijing. Beijing EPB, Beijing.
Beijing Annals Editorial Board. (2000). Landscape plants. In Beijing Annals (Vol.16, pp. 337–
384). Beijing Forestry Bureau. (2003). Beijing's flower markets blossom. Retrieved January 25, 2005,
from http://www.beijingportal.com.cn/7838/2005/01/11/[email protected] Beijing Qianlong Website, 2005, http://www.qianlong.com/ Beijing Youth. (2004). What changes to be come after greenbelt construction in Beijing
appearance? Retrieved February 25, 2005, from http://show.ynet.com/view.jsp?oid=2587452
Beijing Municipal Statistical Bureau. (2002). Beijing Statistical Yearbook 2001. Beijing: China
Statistics Press. Bolund, P. & Hunhammar, S. (1999). Ecosystem services in urban areas. Ecological Economy 29,
293–301. Brooks, K.R., Aken, D. J. & Lucas, M.T. (1999). Project Report: Using CITYgreen to Develop
Municipal Forest-Friendly Planning Goals and Development Regulations.
121
Burch, W. R. & Grove, J. M. (1993). People, trees and participation in the urban frontier. Unasylva, 19-27.
Campbell, J. B. (1987). Introduction to Remote Sensing. London: The Guilford Press. Cernet, D.S. (1997). Beijing – the Capital of China. Retrieved February 2, 2005, from
www.edu.cn/beijing. Chen, Z.L., Zhou, Y.H. & Li, J.L. (1983). Investigation of the suitability of tree species used in
Beijing landscape planting. In: Z.X. Chen and Y. Wang (Eds.), Research on Urban Landscape and Gardening (3rd ed., 168-174).
Chen, Z.X., Su, X.H., Liu, S.Z. & Gu, R.S. (1998). Research of the ecological benefits of green
space in Beijing city. China Landscape and Gardening, 14, 57–60. China National Bureau. (2003). Combat Desertification Ministry of Forestry. Retrieved February
11, 2005, from http://www.din.net.cn/dt/NEWSLETTER1.htm Chinese Academy of Sciences. (1990). Atlas of the Ecological Environment in the Beijing-Tianjin
area. Beijing: Science Press. Chinese Academy of Forestry. (1996). Information published on the worldwide web,
www.forestry.ac.cn. CITYgreen Manual. (2004). American Forests, v5.0. Clarke, K. C. & Gaydos, L. J. (1998). Loose-coupling a cellular automaton model and GIS: long-
term urban growth prediction for San Francisco and Washington/Baltimore. Int J Geogr Inform Sci, 12 (7), 699–714.
Cook, E., & Lier, H.V. (1994). Landscape Planning and Ecological Network (pp. 1-4).
Amsterdam: Elsevier. Costanza, R. d’Arge, de Groot, R., Farber, S., Grasso, M., Daniel, B., Smith, S. & Hellmund, P. C.
(1993). Ecology of Greenways. Minnesota: University of Minnesota Press. Davey Resource Group. (1993). Consolidating and Communicating Urban Forest Benefits. Savoy:
ISA Research Trust. Dramstad, W. E., Plson, J. D. and Forman, R. T. T. (1996). Landscape ecological principles in
landscape architecture and land-use planning (pp.18-22). Island Press. Energy Information Administration. (2003). China: Environmental Issues. Retrieved February 18,
2005, from http://www.eia.doe.gov/emeu/cabs/chinaenv.html ESRI. (2004). ESRI Virtual Campus. Retrieved May 18, 2004, http://campus.esri.com/
122
ESRI. (2004a). ArcGis Version 9.1 (software). Redlands: Environmental System Research Institute Fabos, J.G. (1973). Part I of the Metropolitan Landscape Planning Model. In Model for landscape
resource assessment (pp. 299). Amhearst: University of Massachusetts. Fan, X., Xie, Y. & Li, L. (2003). Effects Of Duststorms On The Air Pollution In Beijing. Water,
Air and Soil Pollution: Focus, 3, 93-101 Flores, A., Pickett, S.T.A., Zipperer, W.C., Pouyat, R.V. & Pirani, R. (1998). Adopting a modern
ecological view of the metropolitan landscape: the case of a green space system for the New York City region. Landscape Urban Plann, 39, 295–308.
Forman, R. T. T. & Godron, M. (1986). Landscape Ecology. New York: Wiley. Forman, R. T. T. (1995). Land Mosaics: The Ecology of Landscapes and Regions. Cambridge:
Cambridge University Press, Francis, M., Cashdan, L. & Paxson, L. (1984). Community Open Spaces: Greening Neighborhoods
through Community Action and Land Conservation. Washington, DC: Island Press. Guo, Y. & Teng, S. (2003). Study on Beijing air pollutant emission control and the mechanics of
pollutant degradation. Retrieved in February 10, 2005, from http://www.efchina.org/chinese/resources.cfm
Hanna, K. C. (1999). GIS for Landscape Architects. ESRI Press. Hannon, R. L, Sutton, P. & Belt, M. The value of the world’s ecosystem services and natural
capital. Nature, 387(15), 253–260. He, S. (1992). Flora of Beijin. In Chinese. Beijing: Beijing Press. He, Y. (2003). Research on spatial development ecological strategy for Beijing. Beijing City
Planning & Construction Review, 6, 33-39. He, Y. (2003). Ecological water problems and urban planning in Beijing. Proceedings of the
internet conference on Eco-city development, Beijing, China. Howard, E. (1898). Tomorrow: A Peaceful Path to Real Reform. London: Sonnenschein. Huang, Z.Y. (2001). A Comparative Research into the Theories of Future City. Urban Planning
Forum, 131(1), 1-6. Jo, H.K. (2002). Impacts of urban green space on offsetting carbon emissions for middle Korea,
Environment Manage, 64, 115–126.
123
Kulshreshtha, S. & Knopf, E. (2003). Benefits from Agriculture and Agri-Food Canada’s shelterbelt program: Economic valuation of public and private goods. Agriculture and Agri-Food Canada’s Agroforestry Division.
Kühn, M. (2003). Greenbelt and green heart: separating and integrating landscapes in European
city regions. Landscape and Urban Planning, 64, 19–27. Lavely, W. (1989). The Spatial Approach to Chinese History: Illustrations from North China and
the Upper Yangzi. Journal of Asian Studies, 48(1), 100–113. Lawrence, R.J. (1999). Urban health an ecological perspective. Reviews on Environmental Health,
14(1), 1–10. Leitão, A.B. & Ahern, J. (2002). Applying landscape ecological concepts and metrics in
sustainable landscape planning. Landscape and Urban Planning, 59, 65–93. Li, F., Wang, R., Paulussen J. and Liu, X. (2004). Comprehensive concept planning of urban
greening based on ecological principles: A case study in Beijing, China. Landscape and Urban Planning, 4, 22-27.
Li, M. (2002). Modern CITYgreen Space System Planning. In Beijing environmental quality
report (1990-2000). Beijing Environmental Protection Bureau, Beijing. Little, C. E. (1990). Greenways for American. Baltimore: John Hopkins Press. Liu, G.L. (2001). How to Establish Urban Ecology Plan. Planners, 17(6),18-22. Luck, M., Jenerette, G. D., Wu, J. & Grimm, N. (2001). The urban funnel model and spatially
heterogeneous ecological footprint. Ecosystems, 4,782–796. Lütz, M. & Bastian, O. Implementation of landscape planning and nature conservation in the
agricultural landscape—A case study from Saxony. Agriculture Ecosystem Environment, 92, 159–170.
Lynch, K. (1960). Image of the City. New York: Plenum Press. Ma, S.J. & Wang, R.S. (1984). Social–economic–natural complex ecosystem. Acta Ecology, 4 (1), 1–9. Mao, L.S., Gao Y. and Sun, W.Q. (1993). Influences of street tree systems on summer micro-
climate and noise attenuation in Nanjing city, China. Arboriculture Journal, 17, 239–251. Man, Y., Li, H.X., Dong, J., Tang, W.Q. & Guo, H.B. (2003). Changes in Beijing professional
populations during 1981–2001. Asian Studies,17, 435–438.
124
Mangimeli, J. (1981). Geology of Sand Dunes. Retrieved in March 12, 2005, from http://www.nps.gov/whsa/Sand%20Dune%20Geology.htm
Mann, S. (1984). Urbanization and Historical Change in China. Modern China, 10 (1), 79–113. Moore, M., Gould, P., & Keary, B.S. (2003). Global urbanization and impact on health.
International Journal of Hygiene and Environmental Health, 206(4–5), 269–278. National Bureau of Statistic of China. (2001). Statistics Year Book of China. Beijing. Neteler, M. & Mitasova, H. (2002). Open source of GIS. Retrieved August 22, 2004, from
http://openosx.com/grassbook/toc.html Nickum, J. E. (1994). Beijing’s Maturing Socialist Water Economy. In J. E. Nickum & K. W.
Easter (Eds.), Metropolitan Water Use Conflicts in Asia and the Pacific. Boulder, CO: Westview Press.
Nijwening, S. 1997. Environmental sustainability of cities: management issues and experiences in
developing countries. Retrieved on February 20, 2005, from http://www.ruaf.org/bibliography/annotated/004.pdf
Peccol, E. (1994). A GIS based dataset to assess the influence of countryside planning policies on
landscape change in Bedfordshire. Silsoe College, Cranfield University, Bedfordshire. Population division of United Nations. (1995). Retrieved March 11, 2004, from
www.hsd.ait.ac.th/ihsa/si/a13lc/beijing/sd.html#POPULATION Quam, V., Gardner, J. Brandle J.R. & Boes, T. K. (2005). Windbreaks in Sustainable
Agricultural Systems. Retrieved in February 11, 2005, from http://www.ianr.unl.edu/pubs/forestry/ec1772.htm.
Roseland, M. (1997). Eco-City Dimensions: Healthy Communities, Healthy Planet. British
Columbia: New Society Publishers. Schrijnen, P.M. (2000). Infrastructure networks and red-green patterns in city regions. Landscape and Urban Planning, 48, 191–204. Shafer, C. (1999). US National park buffer zones: historical, scientific, social, and legal aspects,
Environment Manage 23 (1), 49–73. Smith, D.S. & Hellmund, P.C. (1993). Ecology of greenways: Design and function of linear
conservation areas. (pp.8) Minneapolis: University of Minnesota Press. Sousa, C.A.D. (2003). Turning brownfields into green space in the city of Toronto. Landscape and
Urban Planning, 62, 181–198.
125
Teal, M., Huang, C.S. & Rodiek, J. (1998). Open space planning for Travis Country, Austin,
Texas: a collaborative design. Landscape and Urban Planning, 42, 259–268. The City of Fairfax Rapid Ecosystem Analysis for 1992 and 2001. Retrieved in March 14, 2005,
from www.virginiaplaces.org/ vagupnova/fairfax_va_1992_2001.pdf Thompson, C.W. (2002). Urban open space in the 21st century. Landscape Urban Plan, 60, 59–72. Tran, C. & Pyrke, A. (1999). Wind Speed Reduction Factors in a Heathy Woodland. Conference
Proceedings, Australian Bushfire Conference, Albury, July 1999. Turner, T. (1995). Greenways, blueways, skyways and other ways to a better London. Landscape
and Urban Planning, 33, 269-282. Tyrväinen, L. (2001). Economic valuation of urban forest benefits in Finland, Environment
Manage, 62, 75–92. Ulrich, R.S. (1984). View through a window may influence recovery from surgery. Science, 224,
420-421 USGS. (2005). U.S. Geological Survey. Retrieved February 18, 2005,
http://www.epa.gov/owowwtr1/watershed/landcover/lulcusa.html UNCCD (China National Report To Implement The United Nation’s Convention To Combat
Desertification, 2002). Retrieved in April 14, 2005, from www.unccd.int/cop/reports/ asia/national/2002/china-eng.pdf
Verbyla, D. L. (1995). Satellite Remote Sensing of Natural Resource (pp36-45). Boca Raton,
Lewis Publishers. Wang, R.S., Chi, J. and Ouyang, Z.Y. (2001). Eco–Integration for Sustainable Development of
Middle and Small Sized Towns. Beijing: Meteorologic Press. Wang, H. (2001). Digital City and Urban Sustainable Development. China Population Resources
and Environment, 11(2), 114-118. Wikipedia. (2004). The free encyclopedia. Retrieved in January 12, 2005, from
http://en.wikipedia.org/wiki/Main_Page Wilson, W.H.(1989). The City Beautiful Movement. Baltimore: Johns Hopkins University Press. Xiao, J.T. (1997). International natural gas consumption situation and development prospective.
Petroleum and Natural Gas Chemical Industry Journal, 26, 94.
126
127
Zhang, Z.M. (2001). Problems of species diversity in Beijing landscape trees and solutions. Journal of Beijing Forestry University, 23, 50–52.
Zhao, Z. (2003). Suggestions on the Greenbelt Construction. Beijing City Planning & Construction
Review, Supplement edition. Zhu, Z.Y. & Wu, S.Q. (1995). Investigation of roadside green space in Beijing. China Landscape
and Gardening, 1, 37–44 (In Chinese). Zhou, Y. & Meng, Y. (2000). Study on Suburbanization in Beijing. Beijing: The Science Press.