Embed Size (px)
Citation preview
Analysis of the
Economic Benefits of the Maryland Shellfish Aquaculture Industry
Jonathan van Senten, Carole Engle, Matthew Parker, and Donald Webster
F I N A L P R O J E C T R E P O R T
December 31, 2019

ANALYSIS OF THE ECONOMIC BENEFITS OF THE MARYLAND SHELLFISH AQUACULTURE INDUSTRY
F I N A L P R O J E C T R E P O R T | P A G E 2
Contents Overview ....................................................................................................................................5
Characterization of the Maryland Shellfish Aquaculture Industry ................................................7
Identification of Required Data and Gaps .................................................................................. 12
Supply chain data. ................................................................................................................. 12
Data for direct effects. ........................................................................................................... 12
Expenditure data. ................................................................................................................... 13
Adequate data by shellfish production gear type. ................................................................... 13
Survey Design and Data Collection ........................................................................................... 14
Scope of data collection ......................................................................................................... 14
Survey activities .................................................................................................................... 14
Response rates ....................................................................................................................... 15
Economic Impact Modelling ..................................................................................................... 17
Theory of input-output modelling .......................................................................................... 17
Definitions ............................................................................................................................. 18
Study Area Characteristics ..................................................................................................... 18
Data ....................................................................................................................................... 21
Accounting for Non-Responses ............................................................................................. 21
Analysis by parts ................................................................................................................... 22
Results ................................................................................................................................... 22
Discussion ............................................................................................................................. 25
Conclusion ................................................................................................................................ 27
Acknowledgment ...................................................................................................................... 27
References ................................................................................................................................ 28
Appendix .................................................................................................................................. 29

ANALYSIS OF THE ECONOMIC BENEFITS OF THE MARYLAND SHELLFISH AQUACULTURE INDUSTRY
F I N A L P R O J E C T R E P O R T | P A G E 3
Figures and Tables Figure 1. Quarterly Maryland bottom culture leases and acreage, 2010 to 2017. ..........................7 Figure 2. Maryland water column culture leases and acreage, 2010 to 2017.................................8 Figure 3. Total bushels of Maryland aquaculture oysters harvested from 2012 to 2018. ...............9 Figure 4. Maryland oyster aquaculture harvests 2012 to 2018. ................................................... 10 Figure 5. Bottom culture aquaculture harvest by month, 2012 to 2018. ...................................... 11 Figure 6. Water column culture aquaculture harvest by month, 2012 to 2018. ........................... 11 Table 1. List frame development, Maryland economic impact survey, 2018 and 2019. .............. 15 Table 2. Coverage and response rates, Maryland economic impact survey, 2018 and 2019. ....... 15 Table 3. Maryland 2018 state metrics. ....................................................................................... 18 Table 4. Economic base of Maryland sorted by Output. ............................................................. 19 Table 5. Economic base of Maryland sorted by Employment..................................................... 20 Table 6. Economic impact of Maryland shellfish industry in 2018. ........................................... 22 Table 7. Economic impact of Maryland shellfish industry on employment in 2018. ................... 23 Table 8. Economic impact of Maryland shellfish industry on economic output in 2018. ............ 24 Table 9. Economic impact of Maryland shellfish industry on economic value-added in 2018. ... 24 Table 10. Economic impact of Maryland shellfish industry on labor income in 2018. ................ 25 Table 11. Economic impact of Maryland shellfish industry 2017. .............................................. 26 Table 12. Supply chain levels for Maryland shellfish aquaculture to be included in the economic impact analysis. ......................................................................................................................... 29 Table 13. Employment (number of positions, employee compensation, and proprietor income for the IMPLAN Labor Income component) data needs. ................................................................. 29 Table 14. GROWOUT FARM: Specific types of employment data to be collected from growout farms. ........................................................................................................................................ 30 Table 15. GROWOUT FARM: Long-term facility investment expenditures (buildings, shop, shore facilities, docks, etc.) on shellfish growout farms, by line-item category. ......................... 30 Table 16. GROWOUT FARM: Equipment expenditures on shellfish growout farms, by line-item category. ................................................................................................................................... 31 Table 17. GROWOUT FARM: Annual operating cost items on shellfish farms. ........................ 33 Table 18. GROWOUT FARM: Marketing costs on shellfish growout farms. ............................ 36 Table 19. HATCHERY PRODUCTION: Specific types of employment data to be collected from hatchery. ................................................................................................................................... 37 Table 20. HATCHERY PRODUCTION: Long-term facility investment expenditures (buildings, shop, shore facilities, docks, etc.) on shellfish growout farms, by line-item category. ................ 37 Table 21. HATCHERY PRODUCTION: Equipment expenditures on shellfish hatcheries, by line-item category. .................................................................................................................... 38 Table 22. HATCHERY PRODUCTION: Annual operating cost items on shellfish hatcheries. .. 40 Table 23. HATCHERY PRODUCTION: Marketing costs on shellfish hatcheries. .................... 42 Table 24. PACKING/SHUCKING/PROCESSING PLANT: Specific types of employment data to be collected from packing/shucking/processing plants. .......................................................... 43

ANALYSIS OF THE ECONOMIC BENEFITS OF THE MARYLAND SHELLFISH AQUACULTURE INDUSTRY
F I N A L P R O J E C T R E P O R T | P A G E 4
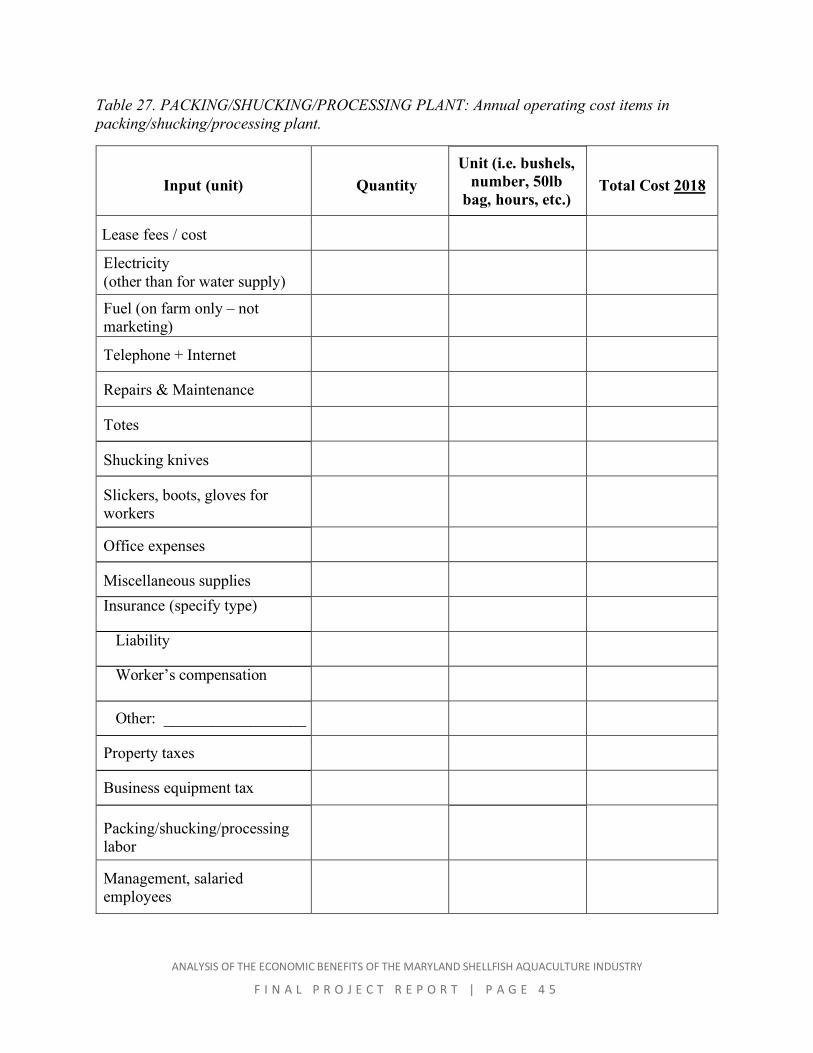
Table 25. PACKING/SHUCKING/PROCESSING PLANT: Long-term facility investment expenditures (buildings, shop, shore facilities, docks, etc.) in packing/shucking/processing plants, by line-item category...................................................................................................... 43 Table 26. PACKING/SHUCKING/PROCESSING PLANT: Equipment expenditures in packing/shucking/processing plant, by line-item category. ........................................................ 44 Table 27. PACKING/SHUCKING/PROCESSING PLANT: Annual operating cost items in packing/shucking/processing plant. ........................................................................................... 45 Table 28. PACKING/SHUCKING/PROCESSING: Marketing costs in packing/shucking/ processing plant. ....................................................................................................................... 47 Table 29. WHOLESALER/DISTRIBUTORS: Specific types of employment data to be collected from wholesaler/distributors. ..................................................................................................... 48 Table 30. WHOLESALER/DISTRIBUTORS: Long-term facility investment expenditures (buildings, cold storage) for wholesaler/distributors. ................................................................. 48 Table 31. WHOLESALER/DISTRIBUTORS: Equipment expenditures by wholesaler/distributors. ............................................................................................................. 49 Table 32. WHOLESALER/DISTRIBUTORS: Annual operating cost items of wholesaler/distributors. ............................................................................................................. 50 Table 33. WHOLESALER/DISTRIBUTORS: Marketing costs of wholesaler/distributors. ....... 51
The Chesapeake Bay Foundation gratefully acknowledges the generous support of Devils Backbone Brewing Company, the Atlantic States Marine Fisheries Commission, and the National Oceanic and Atmospheric Administration for the development of this report. This report was prepared by the Chesapeake Bay Foundation under award number NA14NMF4740362 from the National Oceanic and Atmospheric Administration, U.S. Department of Commerce. The statements, findings, conclusions, and recommendations are those of the authors and do not necessarily reflect the views of the National Oceanic and Atmospheric Administration or the Department of Commerce. Cover Photo: Tal Petty

ANALYSIS OF THE ECONOMIC BENEFITS OF THE MARYLAND SHELLFISH AQUACULTURE INDUSTRY
F I N A L P R O J E C T R E P O R T | P A G E 5
Overview This project was executed in four phases. Phase 1 consisted of gathering secondary data from various sources, including the Maryland Department of Natural Resources (MDDNR) and the University of Maryland Extension Service. Phase 2 of the project was to outline the specific data required to do a comprehensive economic impact analysis of shellfish aquaculture in Maryland. Existing data from MDDNR, the 2018 survey of Maryland oyster growers (Engle and van Senten 2018), and from the University of Maryland Extension Service were evaluated to determine what data gaps existed. Phase 3 consisted of field surveys to obtain additional data needed for the economic impact analysis. Phase 4 was the development and execution of the economic impact model using IMPLAN software and an analysis by parts approach. For the completion of Phase 4, the state package IMPLAN dataset was purchased from The IMPLAN Group (MIG, Inc., North Carolina) for Maryland for the most recent year available (2017). The IMPLAN datasets are matrices of all economic sectors and include coefficients of the interactions among those sectors. However, the IMPLAN dataset does not disaggregate an aquaculture or a shellfish sector; rather aquaculture is grouped with other forms of animal production under “Animal production, except cattle and poultry and eggs”. Therefore, the “Analysis-by-Parts” (ABP) methodology was used to create a customized shellfish sector for Maryland. A separate industry spending model was specified for water column and bottom culture oyster production; since these farming methods have different cost structures. The ABP approach is the recommended approach for modeling an industry that is a subset, with its economic relationships embedded within aggregated IMPLAN sectors that obscure the economic impacts that are specific to shellfish. This is the case for the Maryland shellfish aquaculture industry. Customized expenditure patterns were created in Microsoft Excel, from which standardized enterprise budgets were developed for bottom culture and water column Maryland shellfish production. The expenditures of these activities were converted into spending coefficients and coded by the appropriate North American Industry Classification System (NAICS) sector codes. The coded expenditure patterns were then imported into IMPLAN Pro, relevant models created, and those models run and analyzed. The results include quantitative estimates of the economic contributions of shellfish aquaculture to Maryland’s economy in terms of the direct, indirect, and induced effects on economic output, total value added, labor income, employment, and tax revenue. The sectors identified as supported by the Maryland shellfish aquaculture industry were ranked to determine which sectors benefited the most from Maryland shellfish aquaculture activity. Separate industry spending patterns and labor income changes were developed based on the enterprise budgets developed for water column and bottom culture Maryland shellfish aquaculture. Expenditures are incurred at each step of the supply chain as products move through the marketing channel. All expenditures throughout the supply chain contribute to overall economic

ANALYSIS OF THE ECONOMIC BENEFITS OF THE MARYLAND SHELLFISH AQUACULTURE INDUSTRY
F I N A L P R O J E C T R E P O R T | P A G E 6
activity and sustain demand for a wide variety of goods and services elsewhere in the Maryland economy. The economic linkages of the Maryland shellfish industry were quantified by constructing input-output economic models that incorporate expenditures from the primary (also termed “basic”) sector that is composed of shellfish farms, hatcheries, and packing/shucking/ processing plants as well as those of upstream (gear manufacturers) and downstream sectors (such as wholesaler/distributors, businesses that principally buy and sell shellfish often to retail or restaurant customers).
ANALYSIS OF THE ECONOMIC BENEFITS OF THE MARYLAND SHELLFISH AQUACULTURE INDUSTRY
F I N A L P R O J E C T R E P O R T | P A G E 7
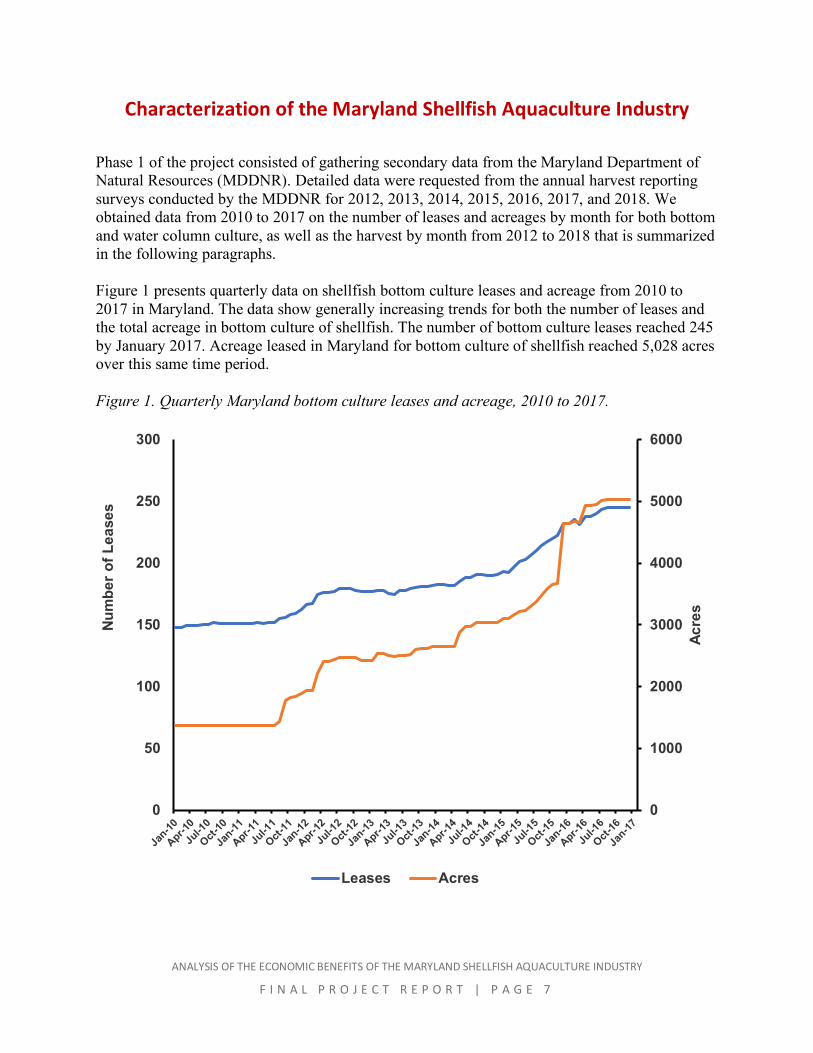
Characterization of the Maryland Shellfish Aquaculture Industry Phase 1 of the project consisted of gathering secondary data from the Maryland Department of Natural Resources (MDDNR). Detailed data were requested from the annual harvest reporting surveys conducted by the MDDNR for 2012, 2013, 2014, 2015, 2016, 2017, and 2018. We obtained data from 2010 to 2017 on the number of leases and acreages by month for both bottom and water column culture, as well as the harvest by month from 2012 to 2018 that is summarized in the following paragraphs. Figure 1 presents quarterly data on shellfish bottom culture leases and acreage from 2010 to 2017 in Maryland. The data show generally increasing trends for both the number of leases and the total acreage in bottom culture of shellfish. The number of bottom culture leases reached 245 by January 2017. Acreage leased in Maryland for bottom culture of shellfish reached 5,028 acres over this same time period. Figure 1. Quarterly Maryland bottom culture leases and acreage, 2010 to 2017.
0
1000
2000
3000
4000
5000
6000
0
50
100
150
200
250
300
Acre
s
Num
ber o
f Lea
ses
Leases Acres

ANALYSIS OF THE ECONOMIC BENEFITS OF THE MARYLAND SHELLFISH AQUACULTURE INDUSTRY
F I N A L P R O J E C T R E P O R T | P A G E 8
Figure 2 presents similar data for shellfish water column leases and acreage from 2010 to 2017 in Maryland. Water column lease data also show a generally increasing trend over this time period with the number of water column leases reaching 64 and the total number of acres leased for water column culture reaching 290 acres by January 2017. Figure 2. Maryland water column culture leases and acreage, 2010 to 2017.
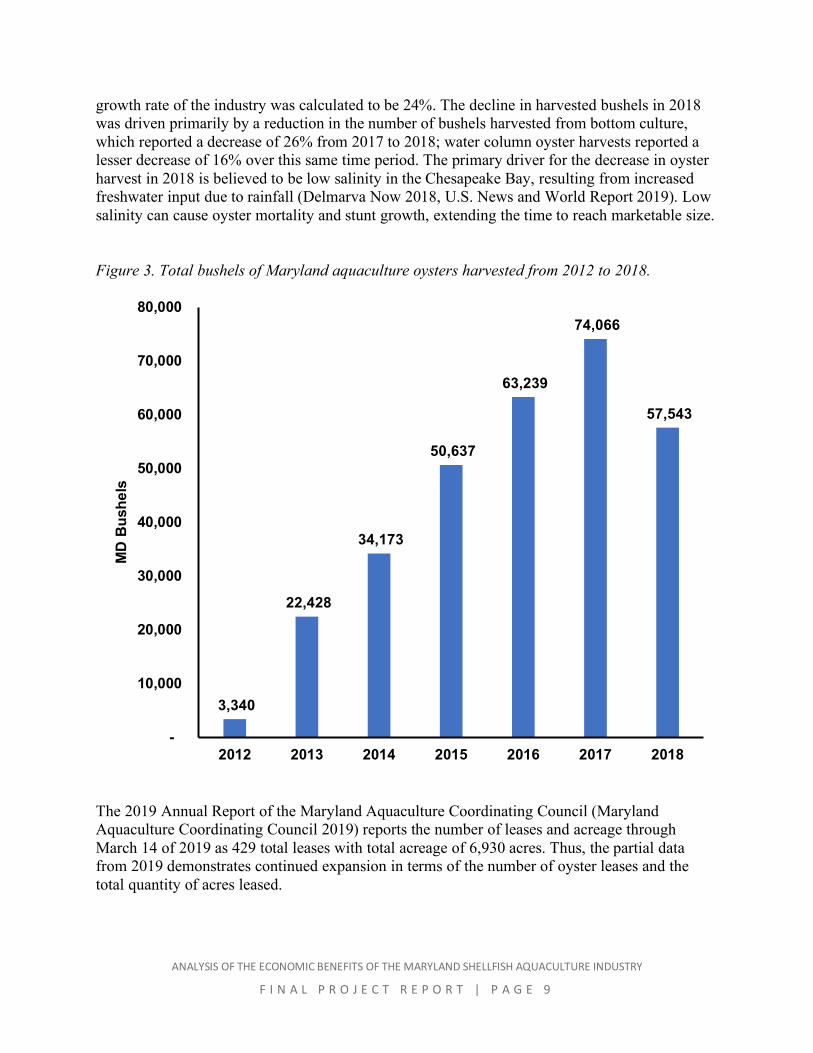
As a result of the increasing numbers of leases and of acreage for shellfish production, for both bottom culture and water column culture, the total volume of oysters harvested in Maryland from aquaculture has increased from 2012 to 2018 (Figure 3). It should be noted that data from 2012 only represent the period from June to December. MDDNR was not able to share data for the complete year due to confidentiality concerns with data prior to June 2012. Overall, substantial increases were observed from 2012 to 2013 and again from 2014 to 2015. Overall average annual growth in shellfish harvests was 115% for the six years from 2012 to 2018, but the average annual growth over the four-year period from 2013 to 2017 was 36%. The annual growth rate of oysters harvested in Maryland continued to be quite strong between 2016 to 2017, with an overall increase of 17% in the total number of bushels harvested. However, the industry reported a decrease in in the number of bushels harvested in 2018; resulting in a negative growth rate of -22% between 2017 and 2018. Over the five-year period from 2013 to 2018 the average
0
50
100
150
200
250
300
350
0
10
20
30
40
50
60
70
Jan-
10A
pr-1
0Ju
l-10
Oct
-10
Jan-
11A
pr-1
1Ju
l-11
Oct
-11
Jan-
12A
pr-1
2Ju
l-12
Oct
-12
Jan-
13A
pr-1
3Ju
l-13
Oct
-13
Jan-
14A
pr-1
4Ju
l-14
Oct
-14
Jan-
15A
pr-1
5Ju
l-15
Oct
-15
Jan-
16A
pr-1
6Ju
l-16
Oct
-16
Jan-
17
Acre
s
Num
ber o
f Lea
ses
Leases Acres
ANALYSIS OF THE ECONOMIC BENEFITS OF THE MARYLAND SHELLFISH AQUACULTURE INDUSTRY
F I N A L P R O J E C T R E P O R T | P A G E 9
growth rate of the industry was calculated to be 24%. The decline in harvested bushels in 2018 was driven primarily by a reduction in the number of bushels harvested from bottom culture, which reported a decrease of 26% from 2017 to 2018; water column oyster harvests reported a lesser decrease of 16% over this same time period. The primary driver for the decrease in oyster harvest in 2018 is believed to be low salinity in the Chesapeake Bay, resulting from increased freshwater input due to rainfall (Delmarva Now 2018, U.S. News and World Report 2019). Low salinity can cause oyster mortality and stunt growth, extending the time to reach marketable size. Figure 3. Total bushels of Maryland aquaculture oysters harvested from 2012 to 2018.
The 2019 Annual Report of the Maryland Aquaculture Coordinating Council (Maryland Aquaculture Coordinating Council 2019) reports the number of leases and acreage through March 14 of 2019 as 429 total leases with total acreage of 6,930 acres. Thus, the partial data from 2019 demonstrates continued expansion in terms of the number of oyster leases and the total quantity of acres leased.
3,340
22,428
34,173
50,637
63,239
74,066
57,543
-
10,000
20,000
30,000
40,000
50,000
60,000
70,000
80,000
2012 2013 2014 2015 2016 2017 2018
MD
Bus
hels

ANALYSIS OF THE ECONOMIC BENEFITS OF THE MARYLAND SHELLFISH AQUACULTURE INDUSTRY
F I N A L P R O J E C T R E P O R T | P A G E 1 0
Figure 4 divides the total harvest per year of farmed Maryland oysters into those produced from bottom culture and those produced from water column culture. While the total number of water column leases was substantially less than the number of bottom culture leases (25% of the number of total leases), the volume of bushels harvested from water column culture was 57% of the total volume of bushels harvested in 2018. These data suggest that the number of bushels harvested per acre of water column culture is greater than the number of bushels harvested per acre of bottom culture; reflecting the greater intensity of production in container culture methods as compared to bottom culture methods. Figure 4. Maryland oyster aquaculture harvests 2012 to 2018.
Figures 5 and 6 show the seasonality of harvest (and, hence supply) of oysters harvested from bottom culture and water column leases, respectively. For bottom culture production, the peak harvest season is April and May. For water column production, on the other hand, the volumes harvested are relatively similar from about April through about November. The public oyster fishery in Maryland is open from October 1st through March 31st, and many aquaculture producers are also practicing commercial fishermen. This partially explains the pattern of harvests between bottom culture and water column oysters. Water column oyster harvest is more consistent throughout the year, aside from reduced harvest from January to March.
1,922
7,293
16,724
20,229 23,251
29,261
24,475
1,417
15,134
17,448
30,408
39,987
44,805
33,067
-
5,000
10,000
15,000
20,000
25,000
30,000
35,000
40,000
45,000
50,000
2012 2013 2014 2015 2016 2017 2018
MD
Bus
hels
Water Column Bottom Culture

ANALYSIS OF THE ECONOMIC BENEFITS OF THE MARYLAND SHELLFISH AQUACULTURE INDUSTRY
F I N A L P R O J E C T R E P O R T | P A G E 1 1
Figure 5. Bottom culture aquaculture harvest by month, 2012 to 2018.
Figure 6. Water column culture aquaculture harvest by month, 2012 to 2018.
0
2000
4000
6000
8000
10000
12000M
D B
ushe
ls
2012 2013 2014 2015 2016 2017 2018
0
500
1000
1500
2000
2500
3000
3500
MD
Bus
hels
2012 2013 2014 2015 2016 2017 2018

ANALYSIS OF THE ECONOMIC BENEFITS OF THE MARYLAND SHELLFISH AQUACULTURE INDUSTRY
F I N A L P R O J E C T R E P O R T | P A G E 1 2
Identification of Required Data and Gaps To complete a comprehensive economic impact analysis of shellfish aquaculture in Maryland, we first identified the specific data required and outlined areas where data were deficient. This phase of the project was accomplished by examining previous economic impact studies, particularly those that involved several different levels of the associated aquaculture supply chains, existing cost data from the 2018 survey of Maryland oyster growers (Engle and van Senten 2018), MDDNR, and the University of Maryland Extension Service. This phase of the project resulted in identification of the gaps in the data needed to be able to produce a comprehensive economic impact analysis of the Maryland shellfish industry. Supply chain data The shellfish industry in Maryland has developed a supply chain that includes the following levels: hatcheries, production farms, packing/processing plants, and wholesaler/distributors. Each level of the supply chain provides essential marketing functions that are necessary for the shellfish sold to satisfy end consumers who purchase shellfish. Given the different functions performed at each level of the supply chain, the labor, sales, and expenditure patterns differ across the various levels. The project team had access to a number of observations of Maryland shellfish farm data from a 2018 survey (Engle and van Senten 2018). The 2018 survey also provided some data on remote setting and nurseries for shellfish, but no data were available on shellfish hatcheries. In addition, there were no data available from the supply chain levels of packing/shucking/ processing plants or from wholesaler/distributors. Data for direct effects In economic impact analysis, direct economic effects primarily include the total economic output from the primary industries. In the case of the Maryland shellfish industry, the direct effects include sales from farms, hatcheries, and packing/shucking/processing plants (see Table 12 below). Thus, additional data are needed for the economic impact analysis from other levels of the supply chain as well as from other geographic areas in Maryland for the end impact values to be as comprehensive and insightful as possible. Direct effects also require data on labor income that includes income to both proprietors and employees. The data required include the number of proprietors and employees as well as their income (See Tables 13, 14, 19, 24, and 29 in the Appendix for a more complete listing). Data from the 2018 study conducted of the economics of Maryland oyster farms (Engle and van Senten 2018) include information on the numbers of employees, proprietors, wages, and proprietor income for a certain number of farms. Obtaining data from additional farms, particularly those located in different locations using different gear types are needed for the end impact values to be as comprehensive and insightful as possible. No data are currently available

ANALYSIS OF THE ECONOMIC BENEFITS OF THE MARYLAND SHELLFISH AQUACULTURE INDUSTRY
F I N A L P R O J E C T R E P O R T | P A G E 1 3
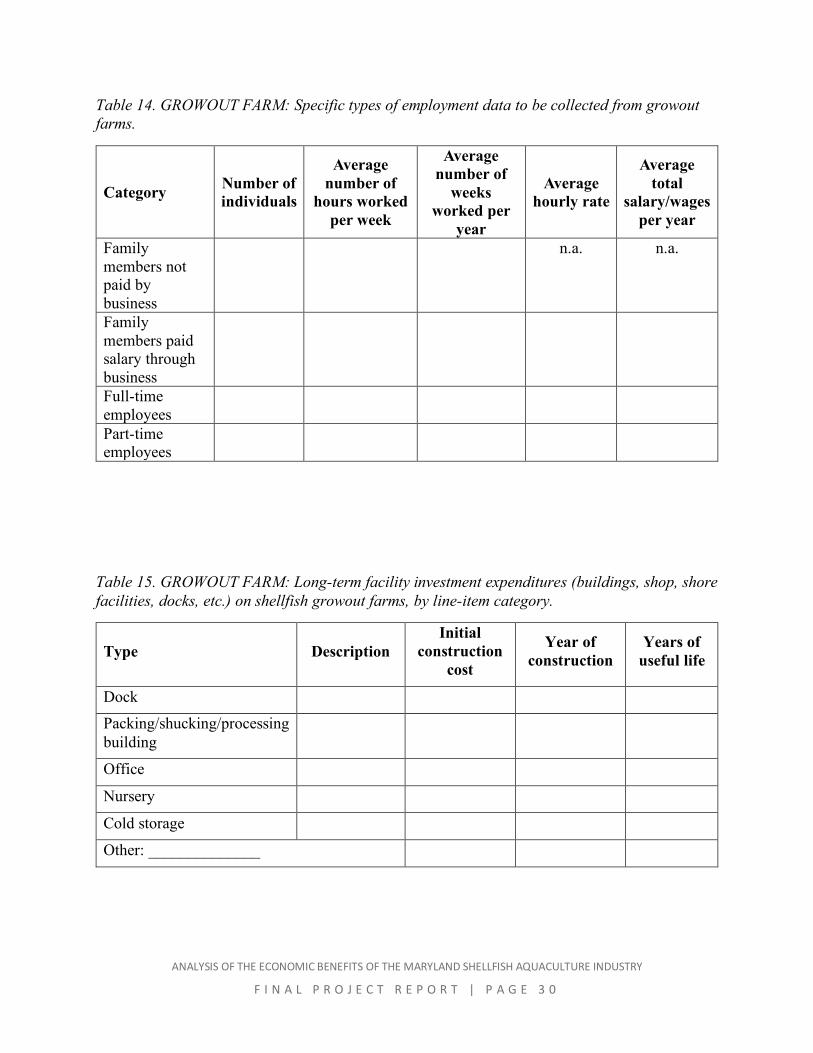
on employment, wages, and earnings for hatcheries, packing/shucking/processing plants, or wholesaler/distributors. Expenditure data Expenditure data were needed for each of the four levels of the supply chain. There also are various levels of expenditure data. Capital investment expenditure data were needed on the types, size, and total initial purchase/construction cost of waterfront and shoreline facilities, and structures such as docks and upwellers on the water. Table 15 of the Appendix lists the typical types of long-term investment costs for a shellfish farm, the initial purchase/construction cost and columns to record the average useful life of each type of building or dock, and the annual depreciation value for each. Equipment data needs included the initial purchase price, and the years of useful life. Table 16 of the Appendix lists typical types of equipment for a shellfish farm. Table 16 also includes columns for the initial purchase price, years of useful life, and annual depreciation. In addition to the capital investment expenditures, there are annual operating cost expenditures that include the costs of seed or larvae, fuel, electricity, and all the other costs associated with running each business at each supply chain level. Table 17 itemizes the various types of inputs and costs often incurred on shellfish farms that will be needed for the economic impact analysis. Table 18 itemizes marketing costs for a shellfish farm. Tables 19 through 33 list the types of expenditure data needed for the other phases of the supply chain. Some expenditure data from Maryland oyster farms were available from the 2018 oyster farm survey (Engle and van Senten 2018), but no expenditure data were available for hatcheries, packing/shucking/processing plants, or for wholesaler/distributors.
Adequate data by shellfish production gear type Traditional bottom culture of oysters tends to be generally less intensive than container culture. Container culture methods tend to be more intensive and also entail expenditures for the various types of containers and associated gear required. While the data show growth in oyster production for both sectors, the growth rate for water column culture, in terms of total production of oysters, has been faster than has that of traditional bottom culture. Given the differences in expenditure patterns for container culture, it is important to have adequate data on both culture methods for the economic impact measurements to be comprehensive and accurate. The 2018 survey by Engle and van Senten (2018) provides some data on both culture methods, but the data on water column culture was especially limited. Thus, more data from farms using water column culture methods was needed.

ANALYSIS OF THE ECONOMIC BENEFITS OF THE MARYLAND SHELLFISH AQUACULTURE INDUSTRY
F I N A L P R O J E C T R E P O R T | P A G E 1 4
Survey Design and Data Collection To generate the comprehensive estimates of the economic impact of the Maryland shellfish aquaculture industry, it was necessary to gather data from each level of the supply chain. Thus, separate surveys were developed for: 1) shellfish hatcheries; 2) additional shellfish farms to ensure that there was adequate data to compare revenue and expenditure patterns between bottom and water column culture; 3) packing/shucking/processing plants; and 4) wholesaler/distributors.
Scope of data collection The design of the four surveys (hatcheries, additional farms, packing/shucking/processing plants, and wholesaler/distributors) took into consideration the following: 1) adequate and statewide representativeness of the business entities for which data were collected to ensure that statewide economic impacts calculated are as comprehensive and accurate as possible; and 2) ensuring that there were adequate numbers of observations for both bottom and water column culture oysters in the overall dataset, due to the differences in expenditure and revenue patterns.
The appendix, Tables 12 through 33, provide templates for the types of data requested for each business interviewed. Respondent data were summed across individual businesses for each line item in each table to obtain the values that were converted into the form necessary for building the economic impact models in IMPLAN. Survey activities Contact lists were developed with the aid of industry lists, University of Maryland Extension, the Chesapeake Bay Foundation, and web searches. Additional web searches were performed to try and identify additional information (such as contact information, location, etc.). The target populations were notified about the study and its intended goals in advance of initiating any survey activities. These communications took place in an organized and planned effort. Telephone contact was attempted with every entity on the contact list to inform them of the study, confidentiality of their participation and data, and to request their participation. Those entities that agreed to participate in the study were then interviewed in person by project personnel at a time and location of their choosing. Survey responses were recorded and coded, to protect respondents and to preserve confidentiality. Survey activities continued for a period of four months over the summer of 2019, with repeated attempts to contact members of the target populations. Upon conclusion of survey activities, data were entered into Microsoft Excel templates for data cleaning and further analysis.

ANALYSIS OF THE ECONOMIC BENEFITS OF THE MARYLAND SHELLFISH AQUACULTURE INDUSTRY
F I N A L P R O J E C T R E P O R T | P A G E 1 5
Response rates Table 1 summarizes the development of the list frame for the survey activities. Table 1. List frame development, Maryland economic impact survey, 2018 and 2019.
Supply chain level Initial contact list
(no.)
Out of business
Not a shellfish producer
(no.)
List frame (no.)
Hatcheries 3 0 0 3 Farms 79 3 0 76 Wholesale / Distributors 76 0 0 76
Table 2 summarizes the survey response rates and coverage. The response rate was calculated by dividing the number of respondents from the 2018 and 2019 surveys by the number of total entities in the list frame. The coverage rate was calculated by aggregating the number of bushels harvested by respondents from the 2018 and 2019 survey and dividing by the total number of bushels harvested according to MDDNR reports. The coverage rate was calculated for both water column culture and bottom culture separately. The coverage rate for water column oysters was 72%, and for bottom culture was 37% (Table 2). Table 2. Coverage and response rates, Maryland economic impact survey, 2018 and 2019.
Supply chain level
List frame (no.)
Refusal/unable (no.)
No response
(no.)
Completed (no.)
Response rate (%)
Hatcheries 3 0 2 1 33% Farms 76 15 36 25 33% Wholesale / Distributors
76 1 71 4 5%
*Coverage rate water column culture: by number of bushels harvested 72%. *Coverage rate bottom culture: by number of bushels harvested 37%. The response rate for farms in this study is comparable to that of other studies regarding shellfish aquaculture in the United States. A recent study on the costs of regulatory compliance for the Pacific Shellfish industry (van Senten et al. in review) obtained a 27% response rate by the number of farms; with a coverage rate of 74% in the Pacific region. Another Pacific coast shellfish study performed by Northern Economics (2013), conducting an economic impact assessment, reported a 13% response rate by the number of farms and a 76% coverage rate. A third study, performed by the Northeast Regional Aquaculture Center, targeted at mostly shellfish producers, reported a similar response rate of 28% (Fairchild et al. 2017). While survey activities were successful in capturing additional data from water column and bottom culture shellfish farms in Maryland, as was outlined under data gaps in Phase 2, the number of respondents from the targeted counties (Dorchester, St. Mary’s, and Talbot) were

ANALYSIS OF THE ECONOMIC BENEFITS OF THE MARYLAND SHELLFISH AQUACULTURE INDUSTRY
F I N A L P R O J E C T R E P O R T | P A G E 1 6
insufficient in quantity to evaluate those counties individually. In order to preserve confidentiality of respondents, all study results were reported as aggregates of each respective activity (i.e. “bottom culture farming” or “water column farming”) and not revealed by county. Data from the 2018 survey of Maryland oyster farms (Engle and van Senten 2018) were included in the dataset to inform the development of cost structures for water column culture and bottom culture farms; from which IMPLAN sector coefficients were derived.

ANALYSIS OF THE ECONOMIC BENEFITS OF THE MARYLAND SHELLFISH AQUACULTURE INDUSTRY
F I N A L P R O J E C T R E P O R T | P A G E 1 7
Economic Impact Modelling Theory of input-output modelling In order for an economy to grow and develop, it is necessary for money to enter that economy (Blair 1995). This is best achieved through the export of goods and services (Blair 1995); which is also referred to as the export-base theory (Kaliba and Engle, 2004). An economy can be divided into two parts, a set of basic and non-basic (service sector) activities (Kaliba and Engle, 2004). The basic sector of the economy results in an influx of money through trade, while the non-basic activities develop within that economy as income generated in the basic sector is spent on local goods and services (Kaliba and Engle, 2004). The Maryland shellfish industry is a basic sector of the economy, producing a product in Maryland that is consumed locally and exported to other areas. Input-output analysis assumes that a linear relationship exists between inputs and the level of output for each sector of an economy (Kaliba and Engle, 2004). The input-output model also assumes that basic sectors of the economy can produce excess goods for export, while still meeting demand of their local economy without an increase in prices (Kaliba and Engle, 2004). The input-output relationship can be expressed as:
𝑞𝑞𝑖𝑖 = 𝑧𝑧𝑖𝑖𝑖𝑖 + 𝑧𝑧𝑖𝑖𝑖𝑖 + ⋯+ 𝑧𝑧𝑖𝑖𝑖𝑖 + 𝑓𝑓𝑖𝑖 (1)
𝑖𝑖 = 1,2, … ,𝑁𝑁 𝑗𝑗 = 1,2, … ,𝑁𝑁
Where i denotes the sector, qi the output, zij represents transfers to other sectors, and fi is the final demand sector (Kaliba and Engle, 2004). The variable zij is a unique linear function of output qj; which when divided by qj results in a matrix of the technical coefficients of the input-output model (Kaliba and Engle, 2004). Inversion of the matrix allows for the representation of the input-output model (Kaliba and Engle, 2004):
𝑞𝑞 = [𝐼𝐼 − 𝐴𝐴]−1 ∗ 𝐹𝐹 = �𝑚𝑚𝑖𝑖𝑖𝑖 ⋯ 𝑚𝑚𝑖𝑖𝑖𝑖⋮ ⋱ ⋮𝑚𝑚𝑖𝑖𝑖𝑖 ⋯ 𝑚𝑚𝑖𝑖𝑖𝑖
� ∗ 𝐹𝐹 = 𝑀𝑀 ∗ 𝐹𝐹 (2)
𝑖𝑖 = 1,2, … ,𝑁𝑁 𝑗𝑗 = 1,2, … ,𝑁𝑁
I is an identity matrix, A is the matrix obtained by dividing zij by qj, and mij are the inter-dependence coefficients in the matrix M (Kaliba and Engle, 2004). The output multiplier for each sector j, can be obtained by the ∑ 𝑚𝑚𝑖𝑖𝑖𝑖𝑖𝑖 divided by i (Kaliba and Engle, 2004). These multipliers are important analytical tools, because they capture the economic effects resulting from changes in economic output or within the local economy (Kaliba and Engle, 2004). It is these multipliers that allow for the estimation of the direct, indirect, and induced effects of the activity in question within the economy (Kaliba and Engle, 2004). The input-output model is further expanded upon through the addition of a SAM (social accounting matrix), which allows for a better description of economic activities within the

ANALYSIS OF THE ECONOMIC BENEFITS OF THE MARYLAND SHELLFISH AQUACULTURE INDUSTRY
F I N A L P R O J E C T R E P O R T | P A G E 1 8
defined study area (Kaliba and Engle, 2004). The SAM incorporates the transactions between all the different participants within an economy, allowing for a more complete understanding of the mechanisms behind the generation of household income (Kaliba and Engle, 2004). Utilization of the IMPLAN Pro software allows for the combination of the input-output model and social accounting matrix in a user friendly and highly adaptable manner, producing estimates of the direct, indirect, and induced economic impacts for the Maryland shellfish industry. Definitions (Kaliba and Engle, 2004)
• Direct effects: effects which are accumulated within the particular industry being investigated. For example, the direct employment or sales by shellfish farms.
• Indirect effects: effects that are experienced by related industries through linked sectors. For example, purchases of fuel by shellfish farms that affect the bigger petroleum refining and production industry.
• Induced effects: the changes in household expenditures from income changes in the related sectors. For example, salaries paid that lead to additional economic activity through the purchase of homes, utilities, groceries, etc.
Study Area Characteristics Maryland is a “Mid-Atlantic” state, bordered by Delaware, the District of Columbia, Pennsylvania, Virginia, and West Virginia. The state of Maryland is home to more than six million residents and the state had a gross regional product in 2017 of $408 billion. Table 3 summarizes relevant socio-economic facts and metrics regarding the state of Maryland. Maryland is home to the Horn Point Oyster Hatchery, which produced in excess of 1.7 billion oyster spat in 2017. The state has implemented several programs to support shellfish aquaculture development, such as the MARBIDCO Aquaculture Loan Fund. Between the period from 2013 to 2018, the shellfish industry in Maryland has grown at an average annual growth rate of 24%. Tables 4 and 5 present a truncated summary of the economic base of Maryland’s economy sorted by greatest to least output and employment, respectively. Table 3. Maryland 2018 state metrics.
Category Measure/Quantity Land area (square miles) 1 9,775 (2017) Population 6,042,718 Total employment 1 3,703,941 (2017) Gross Regional Product ($) 1 $408,670,149,785 (2017) Per Capita Income ($) $39,070 Percent poverty 9% Number of industries 1 473 (2017) (United States Census Bureau, 2019)
1 (MIG, 2019)

ANALYSIS OF THE ECONOMIC BENEFITS OF THE MARYLAND SHELLFISH AQUACULTURE INDUSTRY
F I N A L P R O J E C T R E P O R T | P A G E 1 9
Table 4. Economic base of Maryland sorted by Output.
Description / Industry Employment (no.)
Employment (%)
Output ($ Million)
Output (%)
Total 3,703,941 100.00% $629,696 100.00% Real estate 167,285 4.52% $40,781 6.48% Owner-occupied dwellings 0 a 0.00% $38,721 6.15% Employment and payroll of federal government, non-military 154,033 4.16% $35,932 5.71% Wholesale trade 102,842 2.78% $24,556 3.90% Employment and payroll of federal government, military 54,396 1.47% $19,156 3.04% Hospitals 108,260 2.92% $17,885 2.84% Scientific research and development services 60,645 1.64% $17,686 2.81% Employment and payroll of local government, education 157,111 4.24% $14,837 2.36% Wireless telecommunications carriers (except satellite) 4,202 0.11% $11,260 1.79% Insurance carriers 15,689 0.42% $9,449 1.50% Other financial investment activities 46,576 1.26% $9,416 1.50% Limited-service restaurants 99,119 2.68% $9,179 1.46% Offices of physicians 60,986 1.65% $8,922 1.42% Electric power transmission and distribution 5,652 0.15% $8,345 1.33% Architectural, engineering, and related services 47,501 1.28% $8,196 1.30% Custom computer programming services 35,096 0.95% $7,549 1.20% Construction of other new residential structures 22,514 0.61% $7,380 1.17% Management consulting services 59,352 1.60% $7,171 1.14% Management of companies and enterprises 28,564 0.77% $7,165 1.14% Employment and payroll of local government, non-education 72,933 1.97% $6,469 1.03% Computer systems design services 42,582 1.15% $6,328 1.00% Monetary authorities and depository credit intermediation 24,144 0.65% $6,304 1.00% Insurance agencies, brokerages, and related activities 27,923 0.75% $6,134 0.97%
(MIG, 2019) a Owner occupied dwellings are fixed assets that provide housing services for owners. There are no employees of owner-occupied dwellings.

ANALYSIS OF THE ECONOMIC BENEFITS OF THE MARYLAND SHELLFISH AQUACULTURE INDUSTRY
F I N A L P R O J E C T R E P O R T | P A G E 2 0
Table 5. Economic base of Maryland sorted by Employment.
Description / Industry Employment (no.)
Employment (%)
Output ($ Million)
Output (%)
Total 3,703,941 100.00% $629,696 100.00% Real estate 167,285 4.52% $40,781 6.48% Employment and payroll of local government, education 157,111 4.24% $14,837 2.36% Employment and payroll of federal government, non-military 154,033 4.16% $35,932 5.71% Hospitals 108,260 2.92% $17,885 2.84% Wholesale trade 102,842 2.78% $24,556 3.90% Limited-service restaurants 99,119 2.68% $9,179 1.46% Full-service restaurants 96,604 2.61% $5,159 0.82% Employment and payroll of local government, non-education 72,933 1.97% $6,469 1.03% Retail - Food and beverage stores 62,735 1.69% $4,981 0.79% Offices of physicians 60,986 1.65% $8,922 1.42% Scientific research and development services 60,645 1.64% $17,686 2.81% Management consulting services 59,352 1.60% $7,171 1.14% Services to buildings 57,264 1.55% $2,762 0.44% Nursing and community care facilities 56,652 1.53% $4,190 0.67% Employment services 54,608 1.47% $5,264 0.84% Employment and payroll of federal government, military 54,396 1.47% $19,156 3.04% Employment and payroll of state government, non-education 51,383 1.39% $5,547 0.88% All other food and drinking places 50,755 1.37% $2,296 0.36% Retail - General merchandise stores 49,867 1.35% $3,765 0.60% Architectural, engineering, and related services 47,501 1.28% $8,196 1.30% Other financial investment activities 46,576 1.26% $9,416 1.50% Personal care services 44,960 1.21% $1,543 0.24%
(MIG, 2019)

ANALYSIS OF THE ECONOMIC BENEFITS OF THE MARYLAND SHELLFISH AQUACULTURE INDUSTRY
F I N A L P R O J E C T R E P O R T | P A G E 2 1
Data Data on the expenditures of Maryland shellfish producers were obtained from a survey completed over the summer of 2019. Participation in the study was confidential, as are all individual respondent data. For additional details on the survey activities that gathered these data, please see the section titled “Data Collection” of this report. Water column culture and bottom culture of oysters have different expenditure patterns, as was observed in the respondent data. Therefore, one set of spreadsheets and models was developed for each of the two categories of oyster farming, water column culture of oysters and bottom culture of oysters. Respondent data were aggregated to develop a standardized enterprise budget for each activity. Although some data was collected from processors and wholesalers/distributors (see Table 2), it was not included in the estimation of economic impacts. The respondent data that was gathered had omitted data and non-response to key questions of the survey; which meant these observations were lacking vital information for the estimation of impacts. Therefore, processor and wholesaler/distributor data were excluded from estimation and the economic impact values reported in this report are an underestimation of total supply chain impacts. Accounting for Non-Responses Data from a 2018 survey of Maryland shellfish aquaculture participants (Engle and van Senten 2018) were used to assist in defining relative percentages of expenditures for shellfish farming activities per bushel. Using per-bushel estimates of expenditures, values for non-respondents were estimated by adjusting for the total number of bushels harvested in 2018 according to MDDNR. Non-response values were also estimated based on the relative expenditures per dollar of sales. These values were compared to those estimated using the number of bushels; and were found to be within 5% of each other. However, because total sales for 2018 were calculated using an average price per bushel ($55), provided by MDDNR, it was deemed best to utilize the number of bushels harvested as the more reliable figure for adjusting for non-responses. The MDDNR records of reported bushels harvested for water column and bottom culture would allow for a more accurate estimation of the total sales by non-respondents. Therefore, all non-response estimates utilized in the economic impact model were calculated using the total number of bushels harvested in 2018. Enterprise budgets, adjusted for non-response, were utilized to calculate the coefficients of the different expenditures resulting from shellfish farming activities. These coefficients were used to develop the IMPLAN industry spending pattern for water column culture and bottom culture of oysters in Maryland. Beyond oyster farming activities, the survey respondents also reported expenditures for nursery, hatchery, and equipment manufacturing activities. Separate industry spending patterns were developed for each of these three activities in IMPLAN, because the cost structures of these activities differed from shellfish farming activities. The direct effects of these activities were adjusted for the percentage of sales that remained in the state of Maryland, as reported by respondents. Results from these three activities, while included in the overall estimate of economic contributions from the Maryland shellfish industry will not be presented or discussed individually, in order to protect the confidentiality of respondents.

ANALYSIS OF THE ECONOMIC BENEFITS OF THE MARYLAND SHELLFISH AQUACULTURE INDUSTRY
F I N A L P R O J E C T R E P O R T | P A G E 2 2
Analysis by parts IMPLAN does not contain a dedicated sector for aquaculture; instead aquaculture is grouped with other forms of animal production (excluding cattle, poultry, and eggs). Therefore, to more accurately estimate the impacts of the Maryland shellfish aquaculture industry, an analysis by parts (ABP) approach was used. The ABP approach allows for dividing the effects from an industry into its individual components, budget expenditures, and income. This allows for greater flexibility and customization of the model. ABP allows for specification of commodity inputs, specification of proportion of local labor income, specification of local purchases, and the use of IMPLAN’s special spending patterns. In order to successfully employ this model, the direct effects of the shellfish industry needed to be determined first. These direct effects were obtained from the respondent data and adjusted for non-response, as described previously. To calculate the indirect effects, an industry spending pattern was created to reflect farming activity expenditures. The coefficients calculated from the standardized enterprise budget were then assigned to the respective NAICS sector codes. One industry spending pattern was created for each activity; namely water column culture, bottom culture, equipment manufacturing, and nursery and hatchery production. In order to estimate the induced effect of the shellfish aquaculture industry in Maryland, a labor income change was added to the model to account for employee compensation. Again, one labor income change was specific for each activity (water column culture, bottom culture, equipment manufacturing, nursery and hatchery production). The scenarios for the economic impact model having been developed, the model was run without any scale modification. Results Results from the economic impact model estimated a total output effect of $8,141,589 for 2018. This was comprised of a direct effect of $3.6 million, an indirect effect of $1.6 million, and an induced effect of $2.8 million. The total employment effect of the Maryland shellfish industry was estimated at 133 people; with a direct effect of 103 jobs, indirect effect of 12 jobs, and induced effect of 18 jobs. The total labor income was estimated to be $4.4 million and total value added estimated to be $3.5 million. Table 6 presents the summary of economic impact results by impact type.
Table 6. Economic impact of Maryland shellfish industry in 2018.
Impact Type Employment Labor Income Total Value Added Output Direct Effect 103 $2,867,579 $812,435 $3,632,564
Indirect Effect 12 $644,664 $1,036,130 $1,681,742 Induced Effect 18 $960,075 $1,745,341 $2,827,283
Total Effect 133 $4,472,318 $3,593,906 $8,141,589

ANALYSIS OF THE ECONOMIC BENEFITS OF THE MARYLAND SHELLFISH AQUACULTURE INDUSTRY
F I N A L P R O J E C T R E P O R T | P A G E 2 3
The ten sectors most affected by the Maryland shellfish industry varied based on employment (Table 7), economic output (Table 9), labor income (Table 10), and economic value added (Table 11). All values on these tables were rounded to the nearest whole number. Retail was the most affected sector based on employment, with an estimated 4 jobs affected. This was followed by commercial and industrial machinery and equipment repair and maintenance. Owner-occupied dwellings and real estate were the two sectors most affected by total economic output. These same two sectors were the most affected for total value added as well. Labor income saw the most affected sectors change yet again, with commercial and industrial machinery and equipment repair and maintenance climbing to the top; followed by miscellaneous retail and hospitals.
Table 7. Economic impact of Maryland shellfish industry on employment in 2018.
Description Total Employment
Total Labor Income
Total Value Added
Total Output
Retail - Miscellaneous store retailers 4 $96,869 $116,287 $176,909
Commercial and industrial machinery and equipment repair and maintenance
2 $123,305 $184,871 $249,221
Real estate 1 $49,443 $241,524 $310,800 Retail - Building material and garden equipment and supplies stores
1 $51,897 $81,337 $128,669
Hospitals 1 $77,281 $90,666 $165,273 Limited-service restaurants 1 $21,092 $51,600 $86,169 Full-service restaurants 1 $22,731 $26,250 $47,019 Wholesale trade 1 $65,785 $124,910 $181,959 Animal production, except cattle and poultry and eggs 1 $7,010 $21,614 $33,820
Offices of physicians 1 $59,568 $58,584 $87,728

ANALYSIS OF THE ECONOMIC BENEFITS OF THE MARYLAND SHELLFISH AQUACULTURE INDUSTRY
F I N A L P R O J E C T R E P O R T | P A G E 2 4
Table 8. Economic impact of Maryland shellfish industry on economic output in 2018.
Description Total Employment
Total Labor Income
Total Value Added
Total Output
Owner-occupied dwellings 0 $0 $274,414 $419,523 Real estate 1 $49,443 $241,524 $310,800 Commercial and industrial machinery and equipment repair and maintenance
2 $123,305 $184,871 $249,221
Insurance carriers 0 $38,583 $131,870 $194,192 Wholesale trade 1 $65,785 $124,910 $181,959 Retail - Miscellaneous store retailers 4 $96,869 $116,287 $176,909
Hospitals 1 $77,281 $90,666 $165,273 Retail - Building material and garden equipment and supplies stores
1 $51,897 $81,337 $128,669
Wireless telecommunications carriers (except satellite) 0 $2,580 $35,750 $95,904
Wired telecommunications carriers 0 $18,864 $44,689 $95,421
Table 9. Economic impact of Maryland shellfish industry on economic value-added in 2018.
Description Total Employment
Total Labor Income
Total Value Added
Total Output
Owner-occupied dwellings 0 $0 $274,414 $419,523 Real estate 1 $49,443 $241,524 $310,800 Commercial and industrial machinery and equipment repair and maintenance
2 $123,305 $184,871 $249,221
Insurance carriers 0 $38,583 $131,870 $194,192 Wholesale trade 1 $65,785 $124,910 $181,959 Retail - Miscellaneous store retailers 4 $96,869 $116,287 $176,909
Hospitals 1 $77,281 $90,666 $165,273 Retail - Building material and garden equipment and supplies stores
1 $51,897 $81,337 $128,669
Radio and television broadcasting 0 $66,792 $65,392 $75,288
Offices of physicians 1 $59,568 $58,584 $87,728

ANALYSIS OF THE ECONOMIC BENEFITS OF THE MARYLAND SHELLFISH AQUACULTURE INDUSTRY
F I N A L P R O J E C T R E P O R T | P A G E 2 5
Table 10. Economic impact of Maryland shellfish industry on labor income in 2018.
Description Total Employment
Total Labor Income
Total Value Added
Total Output
Commercial and industrial machinery and equipment repair and maintenance
2 $123,305 $184,871 $249,221
Retail - Miscellaneous store retailers 4 $96,869 $116,287 $176,909
Hospitals 1 $77,281 $90,666 $165,273 Radio and television broadcasting 0 $66,792 $65,392 $75,288
Wholesale trade 1 $65,785 $124,910 $181,959 Offices of physicians 1 $59,568 $58,584 $87,728 Retail - Building material and garden equipment and supplies stores
1 $51,897 $81,337 $128,669
Real estate 1 $49,443 $241,524 $310,800 Insurance carriers 0 $38,583 $131,870 $194,192 Truck transportation 1 $33,346 $40,777 $89,525
Discussion It should be noted that there were some limitations to this analysis, and as a result the estimates presented are likely underestimating the impacts of the Maryland shellfish industry in 2018. The response rate is the primary limitation to this analysis, and a potential cause of under-estimated activity expenditures. Despite repeated efforts to contact entities on the list frame, it was very difficult to increase participation in the 2019 survey. It is possible that the time period over which survey activities were conducted was not ideal for producers, leading to reduced participation; as evidenced by 15 refusals to participate. The historical data on harvests presented in Figures 5 and 6 lend some credence to this idea; the period from April through September shows increased oyster harvests, especially for bottom culture. Previously collected farm data (Engle and van Senten 2018) were utilized to assist in the development of relative expenditures per bushel. Using these older survey data allowed for an increase in the total number of observations, from which to derive average expenditures per bushel and calculate the non-response to this study. It should also be noted that processors, and wholesalers/distributors are not accounted for in the data that were utilized for impact estimation. There were four surveys completed for processing and wholesaling/distribution activities (Table 2), but there were challenges with omitted data and non-responses to key questions within the completed surveys. As a result, the processor and wholesaler/distributor information were excluded from the economic impact analysis and are therefore not represented in the final impact estimates. Therefore, the results of this study are an estimate of the economic impact for farming activities (water column and bottom culture), equipment, and hatchery/nursery sales only.

ANALYSIS OF THE ECONOMIC BENEFITS OF THE MARYLAND SHELLFISH AQUACULTURE INDUSTRY
F I N A L P R O J E C T R E P O R T | P A G E 2 6
The economic impact estimated in this study was confined to activities and expenditures within the state of Maryland. That is to say, expenditures and activities that happened outside of the state are not captured in the final economic impact estimates. For example, the respective portion of equipment that was produced or purchased outside of Maryland, would not have contributed to the economic impact in Maryland. There was also record of equipment and hatchery/nursery sales that extended beyond the study area of Maryland. These activities have economic impacts outside of Maryland, and are also not accounted for in the estimate of the economic impact within Maryland. In economic impact analysis this concept is referred to as “leakage”. Leakage of impacts is always present given that goods and services are not always fully contained within the relevant study area. Any portion of a good or service that is manufactured, purchased, or sold elsewhere contributes to the leakage of impacts from the study area. Furthermore, it should be noted that harvests of oysters were lower in 2018 than in 2017, likely caused by an influx of fresh water to the Bay; discussed previously in the section of this report titled “Characterization of the Maryland Shellfish Aquaculture Industry”. This would also have affected farm sales values for 2018, and may have had an effect on farm expenditures. For example, less oysters to harvest could mean that producers hired less part time labor to assist with harvesting activities. Another consequence could have been that farms purchased less seed in 2018 due to increased risk of mortality in small oysters. Lower sales and expenditures at the farm level would affect the overall economic impact values. In order to compare the effect of this unprecedented weather in 2018, an economic impact analysis was also performed for 2017 using the expenditures captured from the 2018 survey (Engle and van Senten). These data, based on 2017 production expenditures and sales, coincided with the highest recorded harvest of oysters (74,066 bushels) in Maryland since 2012 (Figure 3). The same methodology as described previously in this report was used to estimate non-response for the 2018 survey data. Likewise, the same farm expenditure patterns were utilized for water column and bottom culture oyster farming activities. These respondent data from the 2018 survey did not include any processor and wholesaler/distributor expenditures or sales as was noted in the “Identification of Required Data and Gaps” section of this report. The IMPLAN model was corrected for the year in which activity expenditures took place (2017), and direct impact values were adjusted for inflation (2.38%). The results of that additional analysis demonstrate that the 2017 economic impact of Maryland shellfish industry (excluding processing and wholesaling/distributing) was a total output effect of $9.7 million (Table 11). The total effect for employment was 167, the total labor income was estimated at $4.9 million, and the total value added estimated at $5.5 million. These estimated values for 2017 impacts are greater than the estimates for the 2018 impact of the Maryland shellfish industry (Table 6); reflective of the lower total harvest in 2018. Table 11. Economic impact of Maryland shellfish industry 2017.
Impact Type Employment Labor Income Total Value Added Output
Direct Effect 130 $3,000,523 $2,139,072 $4,225,250 Indirect Effect 13 $693,691 $1,113,944 $1,803,304 Induced Effect 24 $1,255,933 $2,283,150 $3,698,561 Total Effect 167 $4,950,147 $5,536,166 $9,727,115

ANALYSIS OF THE ECONOMIC BENEFITS OF THE MARYLAND SHELLFISH AQUACULTURE INDUSTRY
F I N A L P R O J E C T R E P O R T | P A G E 2 7
Direct employment in the Maryland shellfish aquaculture industry is likely underestimated in this study. According to data from Maryland DNR, 489 discrete individuals held permits in 2018 to participate in oyster aquaculture; however, further information on the employment status (full-time versus part-time) and employee wages was not available from Maryland DNR. Thus, direct employment was estimated from survey responses including accounting for non-response. Using the data that was provided by respondents, we estimated a direct employment effect of 103 employees. As such, it is likely that the estimated 103 direct employment effect in this study is an underestimate. It is also likely that the processor and wholesaler/distributor levels of the supply chain would have more employees involved than the farm level.
Conclusion The oyster industry in Maryland has grown rapidly in recent years, notwithstanding the 2017-2018 decrease. Oyster farming in Maryland provides valuable employment opportunities for watermen and others in coastal areas. The total economic output effect of the Maryland shellfish industry was estimated at $8,1 million in 2018. The total employment effect of the Maryland shellfish industry was estimated at 107 people; with a direct effect of 77 jobs, indirect effect of 12 jobs, and induced effect of 18 jobs. The greater harvests and sales of oysters in 2017 were estimated to have a greater total economic output of $9.7 million, with a total employment effect of supporting 135 jobs. The greater estimated impacts for 2017 reflect the greater oyster harvest in 2017 as compared to 2018. Finally, the Maryland oyster industry supports a wide variety of other economic sectors, from real estate and wholesale trade through direct expenditures by oyster farms to medical services and food and beverage sectors as wages and salaries paid to employees throughout the oyster supply chain multiply in Maryland’s economy.
Acknowledgment
We would like to acknowledge the participants of this study and thank them for their support and trusting us to maintain the confidentiality of their data. A thank you also to the Maryland Department of Natural Resources for providing data on shellfish leases and harvest values. We would also like to thank Charles Clark for assisting with survey activities and interviews for this project. Last, but not least, we would like to recognize the project sponsor, Chesapeake Bay Foundation, Inc. This project was made possible through Award No. 443615 from Chesapeake Bay Foundation, Inc. Any opinions, findings, conclusions, or recommendations expressed in this publication are those of the authors and do not necessarily reflect the view of the Chesapeake Bay Foundation, Inc.

ANALYSIS OF THE ECONOMIC BENEFITS OF THE MARYLAND SHELLFISH AQUACULTURE INDUSTRY
F I N A L P R O J E C T R E P O R T | P A G E 2 8
References Blair, J.P. 1995. Local Economic Development: Analysis and Practice. Sage Publication, Inc.
Thousand Oaks, London, England. Delmarva now. 2018. Oysters: Summer rain puts damper on harvest. Online. Accessed
December 10, 2019. https://www.delmarvanow.com/story/news/local/maryland/2018/11/13/year-rain-across-maryland-could-hurt-oyster-harvest/1976198002/
Engle, C. and J. van Senten. 2018. Economic Analysis of Oyster Production in Maryland. Report submitted to Maryland Sea Grant, Maryland.
Fairchild, E.A., K. Cullen, C. Grimm, T. Keirns, and A. Smith. 2017. Evaluation of Northeast Regional Aquaculture Center (NRAC) Funding. Final Report. Northeast Regional Aquaculture Center. Available at: www.agresearch.umd.edu/nrac.
Kaliba, A.R., and C.R. Engle. 2004. The Economic Impact of the Catfish, Ictalurus punctatus, Industry on Chicot County, Arkansas. Journal of Applied Aquaculture. 15(1/2): 29-59.
Maryland Aquaculture Coordinating Council. 2018. Annual Report 2018. Presented to the Governor of Maryland, Chair of the Senate Education, Health, and Environmental Affairs Committee and Chair of the House Environment and Transportation Committee.
MIG (Minnesota Implan Group, Inc.) 2013. IMPLAN Professional for Windows. Version 3.1.1001.12 Stillwater, Minnesota.
Northern Economics. (2013). The economic impact of shellfish aquaculture in Washington,
Oregon, and California. Pacific Shellfish Institute, Seattle, Washington.
U.S. News & World Report. 2019. Maryland Oysters Are Having a Bad Year, and Here’s Why. Online. Accessed December 10, 2019. https://www.usnews.com/news/best-states/maryland/articles/2019-08-18/maryland-oysters-are-having-a-bad-year-and-heres-why
United States Census Bureau. 2018. Washington: GPO, 2018. QuickFacts: Maryland. https://www.census.gov/quickfacts/MD
van Senten, J., Engle, C., Hudson, B., Conte, F. In Review. Regulatory Costs on Pacific Coast Shellfish Farms.

ANALYSIS OF THE ECONOMIC BENEFITS OF THE MARYLAND SHELLFISH AQUACULTURE INDUSTRY
F I N A L P R O J E C T R E P O R T | P A G E 2 9
Appendix Table 12. Supply chain levels for Maryland shellfish aquaculture to be included in the economic impact analysis.
Farm sales data (referred to as “output” in IMPLAN) are necessary to calculate direct economic effects. Note: given that there are varying degrees of integration of production and marketing functions in Maryland shellfish aquaculture, some businesses include multiple levels of the supply chain in the same business.
Activity a (supply chain level) Farm output b ($ sales)
Hatcheries
Farms
Packing/shucking/processing plants
Wholesaler/distributors aIMPLAN term. bMeasured by sales, in IMPLAN.
Table 13. Employment (number of positions, employee compensation, and proprietor income for the IMPLAN Labor Income component) data needs.
Supply chain level Employment (number of jobs)
Labor income ($)b
Employees Proprietors Employees Proprietors
Hatcheries
Farms
Packing/shucking/processing plants
Wholesaler/distributors
bIMPLAN terms that is the sum of wages and salaries for each category.
ANALYSIS OF THE ECONOMIC BENEFITS OF THE MARYLAND SHELLFISH AQUACULTURE INDUSTRY
F I N A L P R O J E C T R E P O R T | P A G E 3 0
Table 14. GROWOUT FARM: Specific types of employment data to be collected from growout farms.
Category Number of individuals
Average number of
hours worked per week
Average number of
weeks worked per
year
Average hourly rate
Average total
salary/wages per year
Family members not paid by business
n.a. n.a.
Family members paid salary through business
Full-time employees
Part-time employees
Table 15. GROWOUT FARM: Long-term facility investment expenditures (buildings, shop, shore facilities, docks, etc.) on shellfish growout farms, by line-item category.
Type Description Initial
construction cost
Year of construction
Years of useful life
Dock
Packing/shucking/processing building
Office
Nursery
Cold storage
Other: ______________

ANALYSIS OF THE ECONOMIC BENEFITS OF THE MARYLAND SHELLFISH AQUACULTURE INDUSTRY
F I N A L P R O J E C T R E P O R T | P A G E 3 1
Table 16. GROWOUT FARM: Equipment expenditures on shellfish growout farms, by line-item category.
Type of equipment Number on farm
Original purchase price
Year Purchased
Useful life (years)
Trucks (list different sizes/types on different rows)
1.
2.
3.
Refrigerator unit-truck Trailers (list different sizes/types on different rows)
-Refrigerated
-Grain trailer
-Dump trailer
-Other:________________
Forklift Boats (list different sizes/types on different rows)
1.
2.
3. Motors (list different sizes/types on different rows)
1.
2.
3
Barge
Racks
Bags to raise shellfish
Longlines
Cages

ANALYSIS OF THE ECONOMIC BENEFITS OF THE MARYLAND SHELLFISH AQUACULTURE INDUSTRY
F I N A L P R O J E C T R E P O R T | P A G E 3 2
Lantern nets
Rafts
Anti-predation materials (i.e., duck nets, etc.)
Dredge
Drag
Tongs
Rakes
Winch
Jib Hoist
Upweller
Floating
Land-based
Hopper
Oysterwasher
Conveyer
Shaker table
Sorter/cleaner
De-clumper
De-bysser
Walk-in cold room
Ice machine
Other: ____________________
Other: ____________________

ANALYSIS OF THE ECONOMIC BENEFITS OF THE MARYLAND SHELLFISH AQUACULTURE INDUSTRY
F I N A L P R O J E C T R E P O R T | P A G E 3 3
Table 17. GROWOUT FARM: Annual operating cost items on shellfish farms.
Input (unit) Quantity Unit (i.e. bushels,
number, 50lb bag, hours, etc.)
Total Cost 2018
Larvae
Cultchless Seed
Diploid
Diploid disease-resistant
Triploid
Triploid disease resistant
Broodstock – purchased
Broodstock – cost to collect from wild
Lease fees / cost
Mooring fees
Registrations for boats/vehicles
Costs of pumping for upweller
Costs of pumping for setting tanks
Electricity (other than for water supply)
Fuel (on farm only – not marketing)
Predator control supplies:
describe:
Telephone + Internet
Repairs & Maintenance
Office expenses

ANALYSIS OF THE ECONOMIC BENEFITS OF THE MARYLAND SHELLFISH AQUACULTURE INDUSTRY
F I N A L P R O J E C T R E P O R T | P A G E 3 4
Miscellaneous supplies
Insurance (specify type)
Liability
Worker’s compensation
Whole farm
Jone’s Act
Other: __________________
Property taxes
Business equipment tax
Farm Labor
Nursery
Planting
Building gear
Cage handling/monitoring
Harvesting
Packing
Other: __________________
Management, salaried employees
Operating Loans (interest)
Equipment Loans (interest)
Real Estate Loans (interest)
Legal

ANALYSIS OF THE ECONOMIC BENEFITS OF THE MARYLAND SHELLFISH AQUACULTURE INDUSTRY
F I N A L P R O J E C T R E P O R T | P A G E 3 5
Accounting
Cost of Diagnostic services - Veterinarian/diagnostician
fees...
- Laboratory testing……………...
Shipping……………………
…………………
……………..........
................................
…………………
……………..........
...............................
…………………
…………….........
.............................
Other: (Please Describe) ____________________
Other: (Please Describe) ____________________
Other: (Please Describe)
____________________

ANALYSIS OF THE ECONOMIC BENEFITS OF THE MARYLAND SHELLFISH AQUACULTURE INDUSTRY
F I N A L P R O J E C T R E P O R T | P A G E 3 6
Table 18. GROWOUT FARM: Marketing costs on shellfish growout farms.
Marketing
Total Cost 2018 Input Unit (ton,
mile, etc.) Quantity Unit Cost
Ice
Freight
Land
Air
Fed Ex / Parcel service
Containers & packaging
Rent on buildings
Warehouse cold storage
Miscellaneous supplies Total
Fuel (marketing + deliveries)
Advertising & marketing
Broker fees
Insurance for trucking and transport
Trucks Annual Mileage
Cost / Loaded mile
Pickup
Straight-line truck
18-wheeler
Other: _______________
Driver / Delivery labor
Other costs associated with transport & marketing shellfish/seaweed (please list): ______________________________________________________
……… ………
……… ………
……………… ………………

ANALYSIS OF THE ECONOMIC BENEFITS OF THE MARYLAND SHELLFISH AQUACULTURE INDUSTRY
F I N A L P R O J E C T R E P O R T | P A G E 3 7
Table 19. HATCHERY PRODUCTION: Specific types of employment data to be collected from hatchery.
Category Number of individuals
Average number of
hours worked per week
Average number of
weeks worked per year
Average hourly rate
Average total
salary/wages per year
Family members not paid by business
n.a. n.a.
Family members paid salary through business
Full-time employees
Part-time employees
Table 20. HATCHERY PRODUCTION: Long-term facility investment expenditures (buildings, shop, shore facilities, docks, etc.) on shellfish growout farms, by line-item category.
Type Description Initial construction cost
Year of construction
Years of useful life
Hatchery building
Office
Dock
Other: ________
Other: ________
Other: ________

ANALYSIS OF THE ECONOMIC BENEFITS OF THE MARYLAND SHELLFISH AQUACULTURE INDUSTRY
F I N A L P R O J E C T R E P O R T | P A G E 3 8
Table 21. HATCHERY PRODUCTION: Equipment expenditures on shellfish hatcheries, by line-item category.
Type of equipment Number on farm
Original purchase price
Year Purchased
Useful life (years)
Trucks (list different sizes/types on different rows)
1.
2.
3.
Refrigerator unit-truck Trailers (list different sizes/types on different rows)
-Refrigerated
-Grain trailer
-Dump trailer
-Other:________________
Forklift Boats (list different sizes/types on different rows)
1.
2.
3. Motors (list different sizes/types on different rows)
1.
2.
3
Barge
Racks
Bags to raise shellfish
Longlines
Cages

ANALYSIS OF THE ECONOMIC BENEFITS OF THE MARYLAND SHELLFISH AQUACULTURE INDUSTRY
F I N A L P R O J E C T R E P O R T | P A G E 3 9
Lantern nets
Rafts Anti-predation materials (i.e., duck nets, etc.)
Dredge
Drag
Tongs
Rakes
Winch
Jib Hoist
Upweller
Floating
Land-based
Other: ____________________
Other: ____________________

ANALYSIS OF THE ECONOMIC BENEFITS OF THE MARYLAND SHELLFISH AQUACULTURE INDUSTRY
F I N A L P R O J E C T R E P O R T | P A G E 4 0
Table 22. HATCHERY PRODUCTION: Annual operating cost items on shellfish hatcheries.
Input (unit) Quantity Unit (i.e. bushels,
number, 50lb bag, hours, etc.)
Total Cost 2018
Broodstock – purchased
Broodstock – cost to collect from wild
Lease fees / cost
Mooring fees
Registrations for boats/vehicles
Costs of pumping for upweller
Costs of pumping for setting tanks
Electricity (other than for water supply)
Fuel (on farm only – not marketing)
Predator control supplies:
describe:
Telephone + Internet
Repairs & Maintenance
Office expenses
Miscellaneous supplies
Insurance (specify type)
Liability
Worker’s compensation
Whole farm
Jone’s Act

ANALYSIS OF THE ECONOMIC BENEFITS OF THE MARYLAND SHELLFISH AQUACULTURE INDUSTRY
F I N A L P R O J E C T R E P O R T | P A G E 4 1
Other: __________________
Property taxes
Business equipment tax
Hatchery Labor
Management, salaried employees
Operating Loans (interest)
Equipment Loans (i )
Real Estate Loans (interest)
Legal
Accounting
Cost of Diagnostic services - Veterinarian/diagnostician
fees...
- Laboratory testing
……………………
…………….............
……………………
…………….............
……………………
……………...........
Other: (Please Describe) ____________________
Other: (Please Describe) ____________________
Other: (Please Describe)
____________________

ANALYSIS OF THE ECONOMIC BENEFITS OF THE MARYLAND SHELLFISH AQUACULTURE INDUSTRY
F I N A L P R O J E C T R E P O R T | P A G E 4 2
Table 23. HATCHERY PRODUCTION: Marketing costs on shellfish hatcheries.
Marketing
Total Cost 2018 Input Unit (ton,
mile, etc.) Quantity Unit Cost
Freight
Land
Air
FedEx/Parcel
Containers & k i
Rent on buildings
Miscellaneous
Total
Fuel (marketing +
Advertising &
Insurance for trucking
Trucks Annual Mileage
Cost / Loaded
mile
Pickup
Straight-line truck
18-wheeler
Other:
Driver / Delivery labor
Other mktg. & delivery costs): _______________
_______________
………………
………………
……………
……………
…………………
…………………

ANALYSIS OF THE ECONOMIC BENEFITS OF THE MARYLAND SHELLFISH AQUACULTURE INDUSTRY
F I N A L P R O J E C T R E P O R T | P A G E 4 3
Table 24. PACKING/SHUCKING/PROCESSING PLANT: Specific types of employment data to be collected from packing/shucking/processing plants.
Category Number of individuals
Average number of
hours worked per week
Average number of
weeks worked per
year
Average hourly rate
Average total
salary/wages per year
Family members not paid by business
n.a. n.a.
Family members paid salary through business
Full-time employees
Part-time employees
Table 25. PACKING/SHUCKING/PROCESSING PLANT: Long-term facility investment expenditures (buildings, shop, shore facilities, docks, etc.) in packing/shucking/processing plants, by line-item category.
Type Description Initial
construction cost
Year of construction
Years of useful life
Packing/shucking/processing building
Walk-in cold room
Office
Dock
Other: ________
Other: ________
Other: ________

ANALYSIS OF THE ECONOMIC BENEFITS OF THE MARYLAND SHELLFISH AQUACULTURE INDUSTRY
F I N A L P R O J E C T R E P O R T | P A G E 4 4
Table 26. PACKING/SHUCKING/PROCESSING PLANT: Equipment expenditures in packing/shucking/processing plant, by line-item category.
Type of equipment Number on farm
Original purchase price
Year Purchased
Useful life (years)
Trucks (list different sizes/types on different rows)
1.
2.
3.
Refrigerator unit-truck Trailers (list different sizes/types on different rows)
-Refrigerated
-Grain trailer
-Dump trailer
-Other:________________
Forklift
Conveyor
Scrubbing machine
Other: ____________________
Other: ____________________
ANALYSIS OF THE ECONOMIC BENEFITS OF THE MARYLAND SHELLFISH AQUACULTURE INDUSTRY
F I N A L P R O J E C T R E P O R T | P A G E 4 5
Table 27. PACKING/SHUCKING/PROCESSING PLANT: Annual operating cost items in packing/shucking/processing plant.
Input (unit) Quantity Unit (i.e. bushels,
number, 50lb bag, hours, etc.)
Total Cost 2018
Lease fees / cost Electricity (other than for water supply)
Fuel (on farm only – not marketing)
Telephone + Internet
Repairs & Maintenance
Totes
Shucking knives
Slickers, boots, gloves for workers
Office expenses
Miscellaneous supplies
Insurance (specify type)
Liability
Worker’s compensation
Other: __________________
Property taxes
Business equipment tax
Packing/shucking/processing labor
Management, salaried employees

ANALYSIS OF THE ECONOMIC BENEFITS OF THE MARYLAND SHELLFISH AQUACULTURE INDUSTRY
F I N A L P R O J E C T R E P O R T | P A G E 4 6
Operating Loans (interest)
Equipment Loans (interest)
Real Estate Loans (interest)
Legal
Accounting
Other: (Please Describe) ____________________
Other: (Please Describe) ____________________
Other: (Please Describe)
____________________

ANALYSIS OF THE ECONOMIC BENEFITS OF THE MARYLAND SHELLFISH AQUACULTURE INDUSTRY
F I N A L P R O J E C T R E P O R T | P A G E 4 7
Table 28. PACKING/SHUCKING/PROCESSING: Marketing costs in packing/shucking/ processing plant.
Marketing
Input Unit (ton, mile, etc.) Quantity Unit Cost Total Cost (2018)
Freight
Land
Air
FedEx/Parcel
Containers & packaging
Rent on buildings
Miscellaneous
Total
Fuel (marketing +
Advertising &
Insurance for trucking
Trucks Annual Mileage
Cost / Loaded
mile
Pickup
Straight-line truck
18-wheeler
Other:
Driver / Delivery labor
Other mktg. & delivery costs): _______________
……… ………
……… ………
……… ………

ANALYSIS OF THE ECONOMIC BENEFITS OF THE MARYLAND SHELLFISH AQUACULTURE INDUSTRY
F I N A L P R O J E C T R E P O R T | P A G E 4 8
Table 29. WHOLESALER/DISTRIBUTORS: Specific types of employment data to be collected from wholesaler/distributors.
Category Number of individuals
Average number of
hours worked per week
Average number of
weeks worked per
year
Average hourly rate
Average total
salary/wages per year
Family members not paid by business
n.a. n.a.
Family members paid salary through business
Full-time employees
Part-time employees
Table 30. WHOLESALER/DISTRIBUTORS: Long-term facility investment expenditures (buildings, cold storage) for wholesaler/distributors.
Type Description Initial
construction cost
Year of construction
Years of useful life
Cold storage
Office
Dock
Other: ________
Other: ________
Other: ________
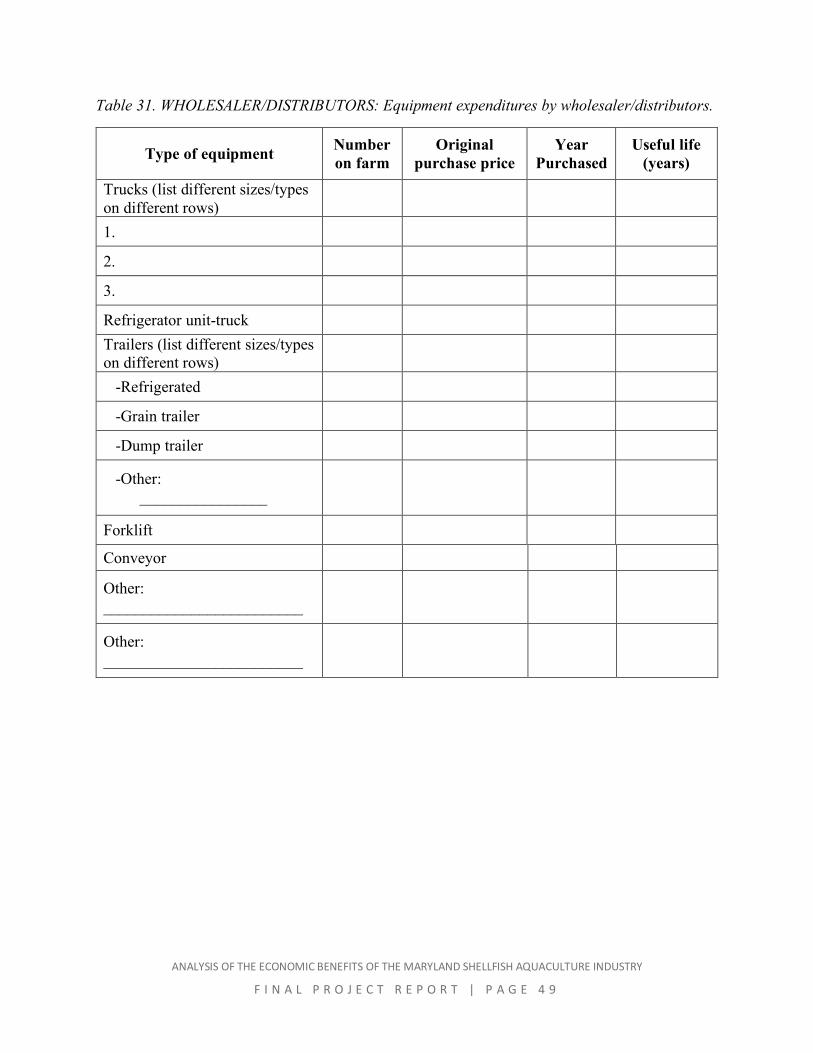
ANALYSIS OF THE ECONOMIC BENEFITS OF THE MARYLAND SHELLFISH AQUACULTURE INDUSTRY
F I N A L P R O J E C T R E P O R T | P A G E 4 9
Table 31. WHOLESALER/DISTRIBUTORS: Equipment expenditures by wholesaler/distributors.
Type of equipment Number on farm
Original purchase price
Year Purchased
Useful life (years)
Trucks (list different sizes/types on different rows)
1.
2.
3.
Refrigerator unit-truck Trailers (list different sizes/types on different rows)
-Refrigerated
-Grain trailer
-Dump trailer
-Other: ________________
Forklift
Conveyor
Other: _________________________
Other: _________________________

ANALYSIS OF THE ECONOMIC BENEFITS OF THE MARYLAND SHELLFISH AQUACULTURE INDUSTRY
F I N A L P R O J E C T R E P O R T | P A G E 5 0
Table 32. WHOLESALER/DISTRIBUTORS: Annual operating cost items of wholesaler/distributors.
Input (unit) Quantity Unit (i.e. bushels, number, 50lb
bag, hours, etc.) Total Cost
2018
Lease fees / cost Electricity (other than for water supply)
Fuel (on farm only – not marketing)
Telephone + Internet
Repairs & Maintenance
Office expenses
Miscellaneous supplies
Insurance (specify type)
Liability Worker’s compensation Other:
Property taxes Business equipment tax
Labor
Management, salaried employees
Operating Loans (interest)
Equipment Loans (interest)
Real Estate Loans (interest)
Legal
Accounting
Other: (Please Describe)

ANALYSIS OF THE ECONOMIC BENEFITS OF THE MARYLAND SHELLFISH AQUACULTURE INDUSTRY
F I N A L P R O J E C T R E P O R T | P A G E 5 1
Table 33. WHOLESALER/DISTRIBUTORS: Marketing costs of wholesaler/distributors.
Marketing
Input Unit (ton, mile, etc.) Quantity Unit Cost Total Cost (2018)
Freight
Land
Air
FedEx/Parcel
Containers & packaging
Rent on buildings
Miscellaneous
Total
Fuel (marketing +
Advertising &
Insurance for trucking
Trucks Annual Mileage
Cost / Loaded
mile
Pickup
Straight-line truck
18-wheeler
Other:
Driver / Delivery labor
Other mktg. & delivery costs: _______________
……… ………
……… ………
……… ………