Embed Size (px)
Citation preview

Digital Agenda for Europe
Analysis of the impact of robotic systems on
employment in the European Union
FINAL REPORT A study prepared for the European Commission DG Communications Networks, Content & Technology by:

This study was carried out for the European Commission by
Fraunhofer Institute for Systems and Innovation Research ISI, Karlsruhe
• Angela Jäger • Cornelius Moll • Dr. Oliver Som • Dr. Christoph Zanker
and as subcontractor
Karlsruhe University of Applied Sciences
• Prof. Dr. Steffen Kinkel • Ralph Lichtner
Internal identification
Contract number: 30-CE-0604632/00-36
SMART number: SMART 2013/003
DISCLAIMER By the European Commission, Directorate-General of Communications Networks, Content & Technology.
The information and views set out in this publication are those of the authors and do not necessarily reflect the official opinion of the Commission. The Commission does not guarantee the accuracy of the data included in this study. Neither the Commission nor any person acting on the Commission’s behalf may be held responsible for the use which may be made of the information contained therein.
ISBN: 978-92-79-48086-7 DOI: 10.2759/516348 © European Union, 2015. All rights reserved. Certain parts are licensed under conditions to the EU.

European Commission Analysis of the impact of robotic systems on employment in the European Union Luxembourg, Publications Office of the European Union 2015 – 93 pages ISBN: 978-92-79-48086-7 DOI: 10.2759/516348

Analysis of the impact of robotic systems on employment in the European Union
September 2014 iii
Abstract Industrial robots and robot applications are a key enabling technology to improve the competitiveness of the European manufacturing industry and the overall welfare of society. This study provides novel empirical evidence that the positive stimulation provided by the further development and diffusion of industrial robot systems is a key enabler for exploiting the competitiveness and growth potentials of the European manufacturing industry.
Based on extensive firm-level analyses of data from the European Manufacturing Survey 2009, it is shown that the use of industrial robots does not have any – neither negative nor positive – direct effect on firm-level employment. Hence, the often referred to picture of industrial robots as “job killers” in the public discussion cannot be approved on behalf of this study. Instead, companies using industrial robots obtain significantly higher levels of productivity in their manufacturing processes. Likewise, firms with a higher vertical range of manufacturing, which can also be realised by using industrial robots, also show a better productivity performance. The potential of industrial robots to maintain industrial production in the EU is also reflected in the finding, that companies using industrial robots in their manufacturing and production are less likely to relocate production outside Europe.
The study concludes by identifying key aspects that should be taken into account when designing and implementing ongoing and future EU policies in the field of industrial robots. These mainly concern the barrier of investment costs, especially for small and medium-sized firms (SMEs) and the specific challenges faced by SMEs when trying to exploit the benefits of industrial robots in manufacturing and assembly.
Résumé Les robots industriels et les applications de robots sont une technologie essentielle pour améliorer la compétitivité de l'industrie manufacturière européenne et le bien-être général de la société. Cette étude fournit de nouvelles preuves empiriques indiquant que la stimulation positive apportée par le développement et la diffusion des systèmes robotisés industriels est un élément-clé permettant d'exploiter la compétitivité et les potentiels de croissance de l'industrie manufacturière européenne.
Les analyses détaillées des données obtenues à partir de le European Manufacturing Survey (Enquête sur les fabricants européens) 2009 au niveau de l'entreprise révèlent que l'utilisation de robots industriels n'a pas d'incidence directe – négative, ni positive – sur l'emploi au niveau de l'entreprise. Par conséquent, l'image souvent renvoyée des robots industriels à l'origine des pertes d'emploi dans la discussion publique ne peut être approuvé pour le compte de cette étude. Les entreprises utilisant des robots industriels parviennent, en revanche, à des niveaux de productivité bien plus élevés dans leurs processus de fabrication. De la même manière, les entreprises ayant une autonomie plus élevée de la production, pouvant également être obtenue au moyen de robots industriels, révèlent une meilleure performance en termes de productivité. Le potentiel de robots industriels permettant de maintenir la production industrielle au sein de l'UE se reflète également dans la conclusion que les entreprises utilisant des robots industriels dans leur fabrication et production sont moins susceptibles de délocaliser la production en dehors de l'Europe.
L'étude se conclut en identifiant les principaux aspects qui doivent être pris en compte lors de la conception et la mise en œuvre des politiques européennes déjà existantes ou à venir dans le domaine des robots industriels. Ceux-ci portent essentiellement sur la barrière du montant des investissements, en particulier pour les PME, ainsi que sur les défis spécifiques auxquels sont confrontées les PME lorsqu'elles essaient d'exploiter les avantages des robots industriels dans la fabrication et l'assemblage.

Analysis of the impact of robotic systems on employment in the European Union
September 2014 iv

Analysis of the impact of robotic systems on employment in the European Union
September 2014 v
Table of Contents DISCLAIMER.................................................................................................... ii Abstract ......................................................................................................... iii Résumé ......................................................................................................... iii Table of Contents ............................................................................................. v Executive summary .......................................................................................... 1 Résumé analytique ........................................................................................... 7 1 Introduction....................................................................................... 15
1.1 Context and background....................................................................... 15 1.2 Scope and objectives ........................................................................... 16 1.3 Approach and methodology................................................................... 17
1.3.1 Database and key variables ............................................................. 17 1.3.2 Methodological background ............................................................. 22
2 Current state of knowledge .................................................................. 25 2.1 Definition of automation, robots and robotic systems................................ 25
2.1.1 Automation ................................................................................... 25 2.1.2 Robots and robotic systems............................................................. 25 2.1.3 Automation and robotic systems ...................................................... 26
2.2 Dissemination of robots........................................................................ 26 2.3 Impact of automation and robotics on economic growth, competiveness
and employment ................................................................................ 29 2.3.1 Impact of automation on productivity and employment ....................... 29 2.3.2 Quantitative effects of robot utilisation.............................................. 30 2.3.3 Qualitative effects of robot utilisation ................................................ 31 2.3.4 Relocation of manufacturing activities ............................................... 32 2.3.5 Shortcomings of current research studies .......................................... 33
3 Analysis of robot utilisation .................................................................. 33 3.1 Descriptive analysis of robot utilisation ................................................... 33
3.1.1 Robot utilisation by firm size............................................................ 34 3.1.2 Robot utilisation by industry ............................................................ 34 3.1.3 Robot utilisation by country ............................................................. 36 3.1.4 Intra-firm degree of robot utilisation................................................. 38
3.2 Descriptive analysis of relocation of manufacturing activities to countries outside Europe ................................................................................... 40
3.2.1 Relocation of manufacturing activities by firm size .............................. 40 3.2.2 Relocation of manufacturing activities by industry............................... 41 3.2.3 Relocation of manufacturing activities by country ............................... 42
3.3 Determinants of robot utilisation in manufacturing companies.................... 44 3.4 Effect of robot utilisation on manufacturing relocation activities.................. 46
4 Analysing the effects of using robots ..................................................... 51 4.1 Effects of robot utilisation on productivity ............................................... 51 4.2 Effects of robot utilisation on employment............................................... 55
5 Conclusions and recommendations ........................................................ 58 5.1 Summary of the main results ................................................................ 58
5.1.1 Factors explaining the use of industrial robots .................................... 59 5.1.2 Factors explaining the relocation of manufacturing activities outside
Europe ........................................................................................ 59 5.1.3 Effects of robot use on labour productivity and total factor productivity
(TFP) .......................................................................................... 60 5.1.4 Effects on employment of using robots.............................................. 62
5.2 Conclusions and policy recommendations................................................ 62 Bibliography .................................................................................................. 67 Annex........................................................................................................... 74

Analysis of the impact of robotic systems on employment in the European Union
September 2014 vi

Analysis of the impact of robotic systems on employment in the European Union
September 2014 1
Executive summary Background Industrial robots and robot applications are a key enabling technology to improve the competitiveness of the European manufacturing industry and the overall welfare of society. Due to technological progress, the domains in which robots or robot-based systems can be applied are ever increasing and will continue to do so, as are the actual numbers of robots put to use in practice. In particular, it is of the utmost importance for policy makers to further foster and develop Europe’s capabilities in robotics to maintain and increase technological leadership, productivity, and value-added of the European manufacturing industry both as developers and users of robotic technology. Although the potential benefits of robot utilisation are numerous – such as being able to deliver superior quality or productivity or being able to work in hazardous environments – and can be even considered as generally accepted by society – there are also increasing fears by the public on whether the potential benefits may be offset by yet not fully known and potentially negative impacts. Most prominently, industrial robots still hold the image of being a “job killer” as they were mainly deployed to rationalise simple and repetitive tasks in the past. In order to develop and improve industrial and technological policies on the development of robots and robot-based systems it is important for policy makers to deepen their understanding on how they impact on each domain of our society and how these effects interrelate with each other. This first and foremost concern is their economic impact in terms of their ability to improve the competitiveness of manufacturing companies and how this relates to their potential of creating or destroying jobs. Although these questions have already been discussed for a long time, they have not yet been answered sufficiently. On the one hand, the economic rationale suggests that the introduction of robot systems into industrial processes aims at optimising total factor productivity by substituting human activities to improve the productivity, reliability and quality. As a consequence and given that the potential cost savings are not offset by the necessary capital expenditures, the introduction of robot systems would trigger profitability by minimizing labour-intensive activities, and thus, lead to the elimination of the respective jobs and industrial workplaces. On the other hand, arguments from a competitive perspective lead into the opposite direction, since robots may solve the “labour cost issue” for many industries in high wage countries within the European Union. Following the basic logic of competition, industrial companies need to have at least the same or a superior level of total factor productivity as their competitors to be sustainably successful in their markets – given that their products and services yield the same customer utility. Therefore, companies that are able to achieve a higher level of total factor productivity by the intelligent use of robot systems could gain higher market shares than competitors with lower productivity levels. Furthermore, as higher capital intensity usually implies sunk costs robot using companies might also perceive higher barriers to offshore and outsource production activities and jobs from higher-wage European countries to lower-wage regions in other parts of the world, particularly to Asia.

Analysis of the impact of robotic systems on employment in the European Union
September 2014 2
Research questions Given this backdrop, this study aims at providing novel empirical evidence to the European Commission on whether and how the use of industrial robots in manufacturing companies impacts on their competitiveness in general and on employment in particular. In detail, it addresses the following specific research questions: What is the current utilisation of industrial robots in manufacturing companies in selected European countries according to major structural properties such as sector affiliation and firm size?
What are the determinants of industrial robot utilisation in European manufacturing companies?
Which share of companies, differentiated along structural characteristics, of the European manufacturing industry has relocated manufacturing activities to other countries outside the European Union?
Does robot utilization of European manufacturing firms increase or decrease the probability of relocation activities inside and outside the European Union? How strong is this effect in relation to other factors determining relocation activities?
How and to what extent does the use of industrial robots affect competitiveness and employment in European manufacturing companies?
Key findings Based on firm-level data of the European Manufacturing Survey, the study presents novel empirical insights into the diffusion and use of industrial robot technologies among European manufacturing companies as well as its effects on productivity and employment. In summary, the major findings of this study are: The use of industrial robots does not have significantly negative effects on employment. The relationship between robot utilisation and employment among the analysed firms in the data sample appears to be rather neutral. Thus, the findings of this study provide evidence that European manufacturing companies do not generally substitute human workforce capital by capital investments in robot technology. On the contrary, it seems that the robots’ positive effects on productivity and total sales are a leverage to stimulate employment growth.
Companies using industrial robots obtain superior efficiency in their manufacturing processes compared to non-users. Industrial robots are a technological key enabler when it comes to maintaining and increasing labour productivity of European manufacturing companies and thus to strengthening their international competitiveness. Nevertheless, due to the still high investment costs for this advanced manufacturing technology, the positive productivity effect of robot utilisation is not persistent in terms of total factor productivity (taking into account capital investments).
Companies with a higher vertical range of manufacturing – performing a higher number of value creating processes in-house – show superior efficiency in terms of both labour productivity and total factor productivity. This finding is contrary to the still prevailing management paradigm of “core competences” which means that companies should focus on their core competences by outsourcing all other rather peripheral steps of value creation and supportive tasks to external suppliers to get “lean” and increase their productivity. As the empirical analysis presented in this study documents, companies that have higher

Analysis of the impact of robotic systems on employment in the European Union
September 2014 3
in-house control over their processes of value creation and production obtain higher levels of efficiency.
Companies that deploy industrials robots in their manufacturing and production processes are less likely to relocate or offshore their production outside Europe. This means that further strengthening and supporting robot technologies does not negatively interfere with the Commission’s overall policy goal of maintaining and increasing industrial production and value creation in the European Union.
In more detail, the key findings corresponding to the research questions mentioned above can be summarised as follows: Determinants of robot utilisation The probability of industrial robot utilisation strongly increases with the size of the company: Their utilisation rate increases almost linearly with the size group of the surveyed companies: 36% of the companies with 50 to 249 employees are users of industrial robots, compared to 56% of the companies with 250 to 999 employees and 74% of the companies with 1000 and more employees. This finding is mainly due to the fact that larger companies have higher financial resources, are more experienced with the introduction of advanced production technologies (i.e. embedding them into the existing work flow and organisational layout), and have more possibilities and higher economies of scale to make efficient use of industrial robot systems.
Almost half of all European manufacturers of rubber and plastic products and manufacturers of transport equipment make use of industrial robots in their production processes: This is basically due to the large volumes and batch sizes these sectors are able to run in their production processes and in particular in their assembly processes, which allow for intensive investments in advanced automation technologies. On the lower end of the deployment level, robots are only used by one out of ten companies in the paper and printing industry, which might be due to the extensive automatisation in terms of dedicated machineries as well as their lack of packaging goods processes. In contrast, textile and leather companies are still in need of a huge amount of remaining manual activities that can either not be further automated or investment costs are too high. Generally, the findings show that the diffusion of industrial robots highly varies between different manufacturing industries in Europe and their production characteristics in terms of batch size. Thereby it is revealed that the usage of industrial robots is still driven by rationalisation efforts of large batch size manufacturing. This means in turn that robot solutions for handling small or even single batch sizes have not yet made their way into industrial practice.
Spain and Denmark show the highest numbers of robot using companies in Europe: 48% of Spanish firms and 44% of Danish firms used at least one industrial robot in their factories in 2009 followed by France (35%) and Switzerland (34%). This can be interpreted in terms of a higher diffusion rate of robot technology in the economy in these countries. Surprisingly, despite its high specialisation in the transport industry, the share of companies using robots in Germany only accounts for 29%. While the installed base of industrial robots in Germany is very high in a few number of large automotive manufacturers (e.g. VW, Daimler, Audi, BMW), the country is characterised by a comparably low diffusion in the broader economy. The lowest rate of industrial robot deployment is reported in the Netherlands (23%).
Firms’ individual decision to make use of industrial robots strongly depends on their production characteristics and export orientation: Due to economies

Analysis of the impact of robotic systems on employment in the European Union
September 2014 4
of scale, companies running large batch sizes or even medium to small batches display a significantly higher propensity to use industrial robots than companies that perform single unit production activities. Furthermore, firms manufacturing products of higher complexity (like components, machinery or automation systems) show higher utilization rates as the higher complexity and greater number of parts allows for more handling and assembly tasks to be automated. Finally, firms that are active in the export business show a higher probability of deploying industrial robots in order to meet higher international market requirements in terms of productivity or quality.
Effects of robot utilisation on production relocation activities (Intensive) users of industrial robots have a much lesser propensity to relocate their production to foreign countries because of working costs: Particularly those companies that make intensive use of industrial robots in their production processes less frequently relocate parts of their manufacturing activities outside the borders of the EU than companies that do not make use of industrial robots. This finding especially accounts for the group of larger firms which generally have a higher probability of offshoring per se. So by using industrial robots firms are more frequently able to realize higher levels of productivity enabling them to perform highly productive and profitable manufacturing even in European high wage countries.
Large firms with 1000 and more employees show the highest level of production relocation activities to foreign countries: Every second company of that size category (51%) has moved (parts of) their production to foreign countries – 17% of them even to countries outside the European Union. Companies with 250 to 999 employees also relocate production activities abroad more frequently than the overall average (29%) or even relocate outside Europe (10%). But generally, production offshoring activities strongly decrease with smaller firm sizes. Only between 9 and 15% of the SMEs state that they have performed offshore activities abroad. The share of SMEs which relocate production to countries outside Europe is even considerably smaller (between 2 and 4%). Besides cost-driven relocation activities this finding is also due to more frequent market-driven relocations of large, internationally operating companies.
Effects of robot utilisation on productivity and employment Companies with intensive utilisation of industrial robots show significantly higher levels of efficiency by means of labour productivity: The deployment of industrial robot applications in production enables firms to better realize efficient production processes in terms of shorter processing times, higher process quality and competitive economies of scale. Thus, the comparative location advantages of high-wage countries in the EU strongly rely on advanced capital-intensive production technologies such as industrial robots. But it has to be mentioned that, if capital investment on the input side is taken into account (analysing total factor productivity) the positive effect of robot utilisation on productivity is not persistent anymore. In consequence, industrial robots definitely have the potential to safeguard and increase the efficiency and competitiveness of industrial production within the European manufacturing industry, but this positive effect is – at least among the firms in the analysed sample – likely to be cannibalized to some extent as soon as the still high investment costs are taken into consideration.
Despite its positive effect on productivity the use of industrial robots does not show a negative effect on employment growth: This finding adds pioneering insights into the intra-firm relationship between technical process

Analysis of the impact of robotic systems on employment in the European Union
September 2014 5
innovation (on behalf of industrial robots) and its impact on employment. It indicates that the improvements in efficiency and competiveness obtained by the deployment of industrial robots stimulates further employment growth in the companies instead of replacing human workforce capital by investments in automation technology. The implementation of industrial robots thus does not necessarily mean following the “low road” of rationalisation by job cuts. In contrast, based on the analysed European firms in the study’s sample, the results even show a slightly positive effect of robot utilisation on employment. However, this relationship is not statistically significant which means that the effects of robot utilisation on employment growth should be regarded as “neutral”, in the best possible meaning of this term.
Policy recommendation The results provided by the study are of paramount importance for the European industry and technology policy. They provide novel empirical evidence that the affirmative stimulation of the further development and diffusion of industrial robot systems represent one key measure among others to exploit competitiveness and growth potentials of the European manufacturing industry. Based on this study, the following key aspects with regard to further policy action can be summarised: Reduction of investment costs: As the findings show, the positive effects on firms’ productivity might be considerably offset by the high investment costs. Hence, one starting point could be to promote the development of cost-friendly robot solutions. This could include both the development of demand-side-oriented, modular and scalable robot solutions that can be individually configured and customized to the diverse needs of different applications as well as new business models on the side of equipment suppliers that reduce the cost-related entry barriers, particularly for smaller and medium-sized enterprises (SMEs). This would help to enhance the positive productivity effects of industrial robots in terms of total factor productivity, too. There have been already some initiatives taken in the past1 which could serve as starting points for future initiatives aiming at similar objectives and stimulating the diffusion of such demand- or application-oriented solutions.
Increase the ability of small and medium-sized manufacturing firms (SMEs) to realize the benefits of industrial robots in manufacturing and assembly: As this study reveals, small and medium-sized companies use robots significantly less frequently than larger firms. This is mainly due to large firms having better economies of scale and resources, not only with regard to finances but also regarding a highly skilled and experienced production workforce. Such workers are able to implement, configure and modify robot solutions to match their company’s needs and better exploit the potentials of industrial robots. As many SMEs position themselves as process specialists in their industrial value chains by showing superior performance in flexibility, quality or efficiency (Som 2012), it can be expected that support on both the supply side through adequate technological solutions (see the point before), and the side of end-users will help to unlock large potentials for improving the competitiveness and growth of SMEs in the European manufacturing industry.
1 See for example the research project SMErobot™ - The European Robot Initiative for Strengthening the Competitiveness of SMEs in Manufacturing – which was funded under the European Union’s Sixth Framework Programme (FP6) (http://www.smerobot.org/)

Analysis of the impact of robotic systems on employment in the European Union
September 2014 6
Provide incentives for firms to (re-)establish a higher vertical range of manufacturing via the implementation or increased use of industrial robots: The findings in this study highlight that firms with a higher vertical manufacturing range – meaning that they perform a larger share of production operations and steps in-house – have higher productivity. In many cases, manufacturing firms have reduced their vertical range of manufacturing due to an increased focus on their core competences by outsourcing periphery and/or cost-intensive production steps to specialised suppliers. But given the current level of technological progress in the field of industrial robots, the implementation and use of robot systems could be a strong argument in favour of re-introducing these production steps in order to further increase productivity through new, in-house possibilities of monitoring and optimisation without simultaneously increasing labour costs.
Evaluation of the productivity impact of industrial robot technologies compared to wage-saving strategies by relocating production /offshoring activities to low-wage countries: This study showed that firms using industrial robots are much less likely to relocate production abroad. The implication for European industrial and competition policy is that the wider diffusion of industrial robots among European manufacturing firms could be key, not only to maintaining the current level of industrial production in the EU, but also to bringing back production and manufacturing activities that were shifted to low-wage countries in Asia, India or Eastern Europe over the past decades. As other studies have shown, these cost-driven relocation activities are often associated with problems concerning quality and flexibility (Kinkel and Maloca, 2009). In this sense, industrial robots could play an important role within the EC’s re-industrialization strategy for the European Union. However, the design and implementation of future policy support requires further insights on the industry level, whether and to what extent the positive productivity effects of industrial robots are superior to those gained by relocating activities to low-wage countries. To increase the validity and robustness of the results, such an analysis should also consider different scenarios of robot technology development in the future.
As can be seen, the above points are closely interrelated. It therefore makes sense to integrate them in an overall EU policy initiative targeted at the future technological development of industrial robotics in the European Union.

Analysis of the impact of robotic systems on employment in the European Union
September 2014 7
Résumé analytique Contexte Les robots industriels et les applications de robots sont une technologie essentielle pour améliorer la compétitivité de l'industrie manufacturière européenne et le bien-être général de la société. Compte tenu des progrès technologiques, les domaines dans lesquels les robots ou les systèmes robotisés peuvent être utilisés gagnent actuellement de plus en plus de terrain et continueront à s'étendre, étant donné que les nombres réels de robots sont mis en œuvre dans la pratique. En particulier, il est extrêmement important que les décideurs développent et favorisent davantage les capacités de l'Europe en matière de robotique afin de maintenir et d'accroître le leadership technologique, la productivité et la valeur ajoutée de l'industrie manufacturière européenne, à la fois en tant que développeurs et utilisateurs de la robotique. Même si les avantages potentiels de l'utilisation des robots sont nombreux – comme la capacité à offrir une qualité ou productivité supérieure ou à travailler dans des environnements dangereux – et peuvent être même considérés comme étant généralement acceptés par la société – on assiste également à de plus en plus de réticence de la part du public quant au fait que les avantages potentiels peuvent être contrebalancés par des impacts potentiellement négatifs et n'étant pas encore entièrement connus. Les robots industriels gardent surtout encore l'image d'être à l'origine des pertes d'emploi, étant donné qu'ils étaient, par le passé, principalement déployés pour rationnaliser des tâches simples et répétitives. Afin de développer et d'améliorer les politiques industrielles et technologiques concernant le développement des robots et des systèmes robotisés, il est important que les décideurs approfondissent leur compréhension sur la manière dont ils influent sur chaque domaine de notre société et sur la corrélation de ces effets. Cette principale préoccupation est leur impact économique en termes de capacité à améliorer la compétitivité des entreprises manufacturières et la manière dont cela est lié à leur potentiel de création ou de destruction des emplois. Bien que ces questions fassent déjà l'objet de discussions depuis longtemps, des réponses suffisantes n'ont pas encore été apportées. D'une part, la logique économique tend à penser que l'introduction de systèmes robotisés dans les processus industriels vise à optimiser la productivité globale des facteurs en substituant les activités humaines afin d'améliorer la productivité, la fiabilité et la qualité. En conséquence et étant donné que les économies potentielles en termes de coûts ne sont pas compensées par les dépenses en capital nécessaires, l'introduction des systèmes robotisés déclencherait une rentabilité en minimisant les activités exigeant beaucoup de main d'œuvre et entraînerait donc la suppression des emplois respectifs et des lieux de travail industriels. D'autre part, les arguments d'un point de vue compétitif mènent dans la direction opposée, étant donné que les robots peuvent résoudre la « question du coût lié à la main d'œuvre » pour de nombreux secteurs dans des pays à niveau salarial élevé au sein de l'Union Européenne. Si l'on suit la logique de base de la concurrence, les entreprises industrielles doivent avoir au minimum un niveau de productivité globale des facteurs, identique, voire supérieur à leurs concurrents pour se démarquer durablement avec succès sur leurs marchés – étant donné que leurs produits et services donnent le même profit pour la clientèle. Par conséquent, les entreprises qui sont en mesure de parvenir à un niveau plus élevé de productivité globale des facteurs

Analysis of the impact of robotic systems on employment in the European Union
September 2014 8
grâce à l'utilisation intelligente des systèmes robotisés pourraient bien gagner des parts de marché plus élevées que les concurrents ayant des niveaux de productivité plus bas. De plus, étant donné qu'une intensité en capital plus élevée implique des coûts irrécupérables, les entreprises utilisant des robots sont également susceptibles de percevoir des barrières plus importantes pour délocaliser et externaliser les activités et les emplois dans la production des pays européens à niveau salarial élevé vers d'autres régions du monde aux salaires inférieurs, en particulier vers l'Asie. Questions de recherche Compte tenu de ce contexte, cette étude vise à fournir de nouvelles preuves empiriques à la Commission Européenne indiquant si et comment l'utilisation de robots industriels dans les entreprises manufacturières influent sur leur compétitivité en général et sur l'emploi en particulier. En détail, elle aborde les questions de recherche spécifiques suivantes : Quelle est l'utilisation actuelle des robots industriels au sein des entreprises manufacturières dans certains pays européens en fonction des propriétés structurelles majeures telles que l'affiliation des secteurs et la taille d'entreprise ?
Quels sont les éléments déterminants de l'utilisation des robots industriels dans les entreprises de fabrication européennes ?
Quelle part d'entreprises, différenciées selon les caractéristiques structurelles, de l'industrie manufacturière européenne a délocalisé les activités de production vers d'autres pays situés en dehors de l'Union Européenne ?
L'utilisation des robots des entreprises manufacturières européennes accroît-elle ou réduit-elle la probabilité des activités de délocalisation à l'intérieur et à l'extérieur de l'Union Européenne ? Quelle est l'ampleur de cette incidence en association avec d'autres facteurs déterminant les activités de délocalisation ?
Comment et dans quelle mesure l'utilisation des robots industriels influe sur la concurrence et l'emploi dans les entreprises manufacturières européennes ?
Conclusions principales Basée sur les données de l'Étude sur les fabricants européens au niveau de l'entreprise, l'étude présente de nouvelles perspectives empiriques sur la diffusion et l'utilisation de technologies de robots industriels parmi les entreprises manufacturières européennes ainsi que leur incidence sur la productivité et l'emploi. En bref, les principales conclusions de cette étude sont les suivantes : L'utilisation de robots industriels n'a pas d'incidence négative importante sur l'emploi. La relation entre l'utilisation des robots et l'emploi parmi les entreprises analysées dans l'échantillon de données s'avère être plutôt neutre. Ainsi, les conclusions de cette étude apportent des preuves selon lesquelles les entreprises manufacturières européennes ne remplacent généralement pas le capital de main d'œuvre humaine par des investissements en capital dans la robotique. Au contraire, il semble que l'incidence positive des robots sur la productivité et les ventes totales sont un levier pour stimuler la croissance de l'emploi.
Les entreprises utilisant des robots industriels parviennent à une efficacité supérieure dans leurs processus de fabrication, comparativement aux non-utilisateurs. Les robots industriels sont un élément-clé technologique lorsqu'il s'agit de maintenir et accroître la productivité du travail des entreprises manufacturières européennes et donc de renforcer leur compétitivité internationale. Néanmoins, en raison d'un montant des investissements encore élevé pour cette
Analysis of the impact of robotic systems on employment in the European Union
September 2014 9
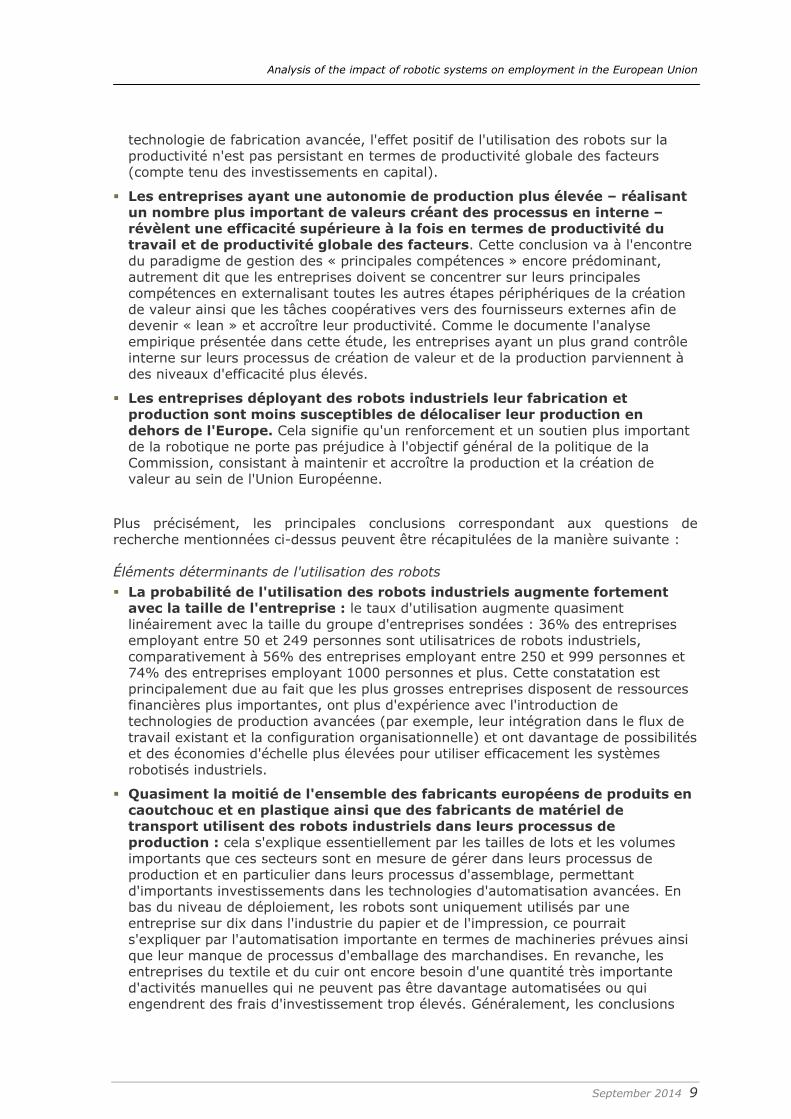
technologie de fabrication avancée, l'effet positif de l'utilisation des robots sur la productivité n'est pas persistant en termes de productivité globale des facteurs (compte tenu des investissements en capital).
Les entreprises ayant une autonomie de production plus élevée – réalisant un nombre plus important de valeurs créant des processus en interne – révèlent une efficacité supérieure à la fois en termes de productivité du travail et de productivité globale des facteurs. Cette conclusion va à l'encontre du paradigme de gestion des « principales compétences » encore prédominant, autrement dit que les entreprises doivent se concentrer sur leurs principales compétences en externalisant toutes les autres étapes périphériques de la création de valeur ainsi que les tâches coopératives vers des fournisseurs externes afin de devenir « lean » et accroître leur productivité. Comme le documente l'analyse empirique présentée dans cette étude, les entreprises ayant un plus grand contrôle interne sur leurs processus de création de valeur et de la production parviennent à des niveaux d'efficacité plus élevés.
Les entreprises déployant des robots industriels leur fabrication et production sont moins susceptibles de délocaliser leur production en dehors de l'Europe. Cela signifie qu'un renforcement et un soutien plus important de la robotique ne porte pas préjudice à l'objectif général de la politique de la Commission, consistant à maintenir et accroître la production et la création de valeur au sein de l'Union Européenne.
Plus précisément, les principales conclusions correspondant aux questions de recherche mentionnées ci-dessus peuvent être récapitulées de la manière suivante : Éléments déterminants de l'utilisation des robots La probabilité de l'utilisation des robots industriels augmente fortement avec la taille de l'entreprise : le taux d'utilisation augmente quasiment linéairement avec la taille du groupe d'entreprises sondées : 36% des entreprises employant entre 50 et 249 personnes sont utilisatrices de robots industriels, comparativement à 56% des entreprises employant entre 250 et 999 personnes et 74% des entreprises employant 1000 personnes et plus. Cette constatation est principalement due au fait que les plus grosses entreprises disposent de ressources financières plus importantes, ont plus d'expérience avec l'introduction de technologies de production avancées (par exemple, leur intégration dans le flux de travail existant et la configuration organisationnelle) et ont davantage de possibilités et des économies d'échelle plus élevées pour utiliser efficacement les systèmes robotisés industriels.
Quasiment la moitié de l'ensemble des fabricants européens de produits en caoutchouc et en plastique ainsi que des fabricants de matériel de transport utilisent des robots industriels dans leurs processus de production : cela s'explique essentiellement par les tailles de lots et les volumes importants que ces secteurs sont en mesure de gérer dans leurs processus de production et en particulier dans leurs processus d'assemblage, permettant d'importants investissements dans les technologies d'automatisation avancées. En bas du niveau de déploiement, les robots sont uniquement utilisés par une entreprise sur dix dans l'industrie du papier et de l'impression, ce pourrait s'expliquer par l'automatisation importante en termes de machineries prévues ainsi que leur manque de processus d'emballage des marchandises. En revanche, les entreprises du textile et du cuir ont encore besoin d'une quantité très importante d'activités manuelles qui ne peuvent pas être davantage automatisées ou qui engendrent des frais d'investissement trop élevés. Généralement, les conclusions

Analysis of the impact of robotic systems on employment in the European Union
September 2014 10
révèlent que la diffusion des robots industriels varie fortement entre les différentes industries manufacturières en Europe et leurs caractéristiques de production en termes de taille de lots. Par conséquent, il s'avère que l'utilisation de robots industriels est encore commandée par des efforts de rationalisation de la fabrication par taille de lots importants. Cela signifie en conséquence que les solutions en matière de robots destinés à traiter des tailles de lots petits, voire uniques n'ont pas encore trouvé leur voie dans la pratique industrielle.
L'Espagne et le Danemark présentent les nombres les plus élevés d'entreprises utilisant des robots en Europe : 48% des entreprises espagnoles et 44% des entreprises danoises utilisaient au moins un robot industriel dans leurs usines en 2009, suivies de la France (35%) et de la Suisse (34%). Cela peut être interprété en termes de taux de diffusion plus élevée de la robotique dans l'économie de ces pays. De façon surprenante, malgré sa haute spécialisation dans le secteur du transport, la part des entreprises utilisant des robots en Allemagne représente seulement 29%. Si la base installée des robots industriels en Allemagne est très élevée chez quelques constructeurs automobiles importants (par exemple, VW, Daimler, Audi, BMW), le pays est caractérisé par une diffusion comparativement faible sur l'économie au sens large. Le taux le plus bas de déploiement de robots industriels est enregistré aux Pays-Bas (23%).
La décision individuelle des entreprises d'utiliser des robots industriels dépend fortement de leurs caractéristiques de production et de l'orientation d'exportation : en raison des économies d'échelle, les entreprises gérant des tailles de lots importants ou même des lots moyens à petits affichent une prédisposition bien plus élevée à utiliser des robots industriels que les entreprises qui réalisent des activités de fabrication à la pièce. De plus, les entreprises fabriquant des produits de plus haute complexité (tels que les composants, la machinerie ou les systèmes d'automatisation) affichent des taux d'utilisation plus élevés, étant donné que la plus haute complexité et le nombre de pièces plus important permettent l'automatisation de davantage de tâches de manutention et d'assemblage. Finalement, les entreprises intervenant dans les activités d'exportation révèlent une probabilité plus élevée de déploiement des robots industriels afin de répondre aux exigences plus élevées des marchés internationaux en termes de productivité ou de qualité.
Effets de l'utilisation des robots sur les activités de délocalisation de la production Les utilisateurs (intensifs) de robots industriels ont une prédisposition bien moindre à délocaliser leur production vers des pays étrangers en raison du coût du travail : en particulier ces entreprises qui utilisent largement les robots industriels dans leurs processus de production délocalisent moins fréquemment des parties de leurs activités de fabrication en dehors des frontières de l'UE que les entreprises qui n'utilisent pas de robots industriels. Cette constatation concerne en particulier le groupe des plus grosses entreprises, lesquelles présentent généralement une probabilité plus élevée de délocalisation par secteur. Par conséquent, en utilisant des robots industriels, les entreprises sont plus fréquemment en mesure de parvenir à des niveaux de productivité plus élevés, leur permettant de réaliser une fabrication hautement productive et rentable, même dans les pays européens à haut niveau salarial.
Les grosses entreprises employant 1000 personnes et plus affichent le niveau le plus élevé des activités de délocalisation de production vers les pays étrangers : une entreprise sur deux entrant dans cette catégorie de taille (51%) a transféré (des parties de) sa production vers des pays étrangers – 17% d'entre elles vers des pays situés en dehors de l'Union Européenne. Les entreprises

Analysis of the impact of robotic systems on employment in the European Union
September 2014 11
employant entre 250 et 999 personnes délocalisent les activités de production à l'étranger plus fréquemment que la moyenne générale (29%) ou même délocalisent en dehors de l'Europe (10%). Mais, de façon générale, les activités de délocalisation de la production diminuent fortement avec les plus petites entreprises. Seulement entre 9 et 15% des PME déclarent avoir réalisé des activités de délocalisation à l'étranger. La part des PME qui délocalisent la production vers des pays en dehors de l'Europe est même bien plus faible (entre 2 et 4%). Outre les activités de délocalisation guidées par les coûts, cette constatation s'explique également par des délocalisations plus fréquentes, axées sur le marché, de grosses entreprises intervenant à l'échelle internationale.
Effets de l'utilisation des robots sur la productivité et l'emploi Les entreprises utilisant largement les robots industriels affichent des niveaux d'efficacité bien plus élevés au moyen de la productivité du travail : le déploiement des applications de robots industriels dans la production permet aux entreprises de mieux réaliser des processus de production efficaces en termes de temps de traitement réduits, de qualité de processus plus élevée et d'économies d'échelle compétitives. Ainsi, les avantages comparatifs de l'emplacement des pays à haut niveau salarial au sein de l'UE s'appuient largement sur des technologies de production avancées à forte intensité de capital tels que les robots industriels. Néanmoins, il convient de mentionner le fait que, si la productivité globale des facteurs est analysée (compte tenu de l'investissement en capital du côté de l'entrée), l'effet positif de l'utilisation des robots sur la productivité globale des facteurs ne tien plus debout. Par conséquent, les robots industriels présentent clairement le potentiel pour préserver et accroître l'efficacité et la compétitivité de la production industrielle au sein de l'industrie manufacturière européenne, mais cet effet positif est – du moins parmi les entreprises situées dans l'échantillon analysé – susceptible d'être cannibalisé dans une certaine mesure dès que les frais d'investissement encore élevés sont pris en considération.
Malgré son incidence positive sur la productivité, l'utilisation de robots industriels ne révèle pas d'effet négatif sur la croissance de l'emploi : cette constatation permet d'appréhender différemment la relation intra-entreprise entre l'innovation des processus techniques (pour les robots industriels) et son impact sur l'emploi. Elle indique que les améliorations en termes d'efficacité et de compétitivité, obtenues par le déploiement des robots industriels, favorisent davantage la croissance de l'emploi dans les entreprises au lieu de remplacer le capital de la main d'œuvre humaine par des investissements dans la technologie d'automatisation. La mise en œuvre des robots industriels n'implique ainsi pas nécessairement de suivre la « voie peu honorable » de la rationalisation par les pertes d'emplois. En revanche, si l'on s'appuie sur les entreprises européennes analysées dans l'échantillon de l'étude, les résultats révèlent même un effet légèrement positif de l'utilisation des robots sur l'emploi. Cependant, cette relation n'est pas statistiquement significative, ce qui signifie que les effets de l'utilisation des robots sur la croissance de l'emploi doivent être considérés comme « neutres », au meilleur sens de ce terme.
Recommandation politique Les résultats fournis par l'étude sont d'une importance capitale pour l'industrie européenne et la politique technologique. Ils apportent de nouvelles preuves empiriques indiquant que la stimulation positive du développement et de la diffusion des systèmes robotisés industriels représente une mesure-clé permettant d'exploiter la compétitivité et les potentiels de croissance de l'industrie manufacturière européenne.

Analysis of the impact of robotic systems on employment in the European Union
September 2014 12
À partir de cette étude, les principaux aspects suivants à l'égard de plus d'intervention peuvent être récapitulés : Réduction des frais d'investissement : comme le montrent les constatations, les effets positifs sur la productivité des entreprises pourraient être largement compensés les frais d'investissement élevés. Par conséquent, un point de départ pourrait consister à promouvoir le développement des solutions peu onéreuses en matière de robots. Ceci pourrait comprendre à la fois le développement des solutions axées sur la demande, modulaires et évolutives, pouvant être individuellement configurées et personnalisées selon les différents besoins des différentes applications ainsi que des nouveaux modèles d'activité du côté des fournisseurs d'équipement qui réduisent les obstacles à l'entrée, liés aux coûts, en particulier pour les PME. Ceci aiderait également à l'amélioration des effets positifs des robots industriels sur la productivité en termes de productivité globale des facteurs. Par le passé, certaines initiatives2 pouvant servir de points de départ pour des futures initiatives visant à des objectifs similaires et stimulant la diffusion de telles solutions axées sur la demande ou les applications ont déjà été prises.
Accroître la capacité des petites et moyennes entreprises manufacturières pour parvenir aux avantages des robots industriels dans la fabrication et l'assemblage : comme le révèle cette étude, les PME utilisent des robots bien moins fréquemment que les entreprises de taille plus importante. Cela s'explique principalement par le fait que les grosses entreprises ont de meilleures économies d'échelle et de ressources, pas uniquement à l'égard des finances, mais également concernant une main d'œuvre de production hautement qualifiée et expérimentée. De tels travailleurs sont en mesure de mettre en œuvre, de configurer et de modifier les solutions en matière de robots afin de répondre aux besoins de leur entreprise et de mieux exploiter les potentiels des robots industriels. Étant donné que de nombreuses PME se positionnent comme des spécialistes de processus dans leurs chaînes de valeurs industrielles en offrant une performance supérieure en termes de flexibilité, de qualité ou d'efficacité (Som 2012), on peut prévoir que le soutien à la fois du côté approvisionnement par le biais de solutions technologiques adaptées (voir point mentionné précédemment) et du côté utilisateur final aidera à libérer d'importants potentiels en vue d'améliorer la compétitivité et la croissance des PME dans l'industrie manufacturière européenne.
Fournir des mesures incitatives aux entreprises pour (re)créer une plus grande autonomie de production par la mise en œuvre ou l'utilisation accrue des robots industriels : les conclusions tirées dans cette étude soulignent le fait que les entreprises ayant une plus grande autonomie de production – impliquant qu'elles réalisent une part plus importante des opérations de production et des étapes en interne – ont une productivité accrue. Dans bon nombre de cas, les entreprises manufacturières ont réduit leur autonomie de production en raison d'une concentration accrue sur leurs compétences-clés en externalisant la périphérie et/ou des étapes de production coûteuses vers des fournisseurs spécialisés. Mais compte tenu du niveau actuel de progrès technologiques dans le domaine des robots industriels, la mise en œuvre et l'utilisation de systèmes robotisés pourraient être un argument important en faveur de la réintroduction de ces étapes de production afin d'accroître davantage la productivité par de nouvelles possibilités internes de surveillance et d'optimisation sans pour autant augmenter les coûts salariaux.
2 Voir, par exemple, le projet de recherche SMErobot™ - L'Initiative Européenne des Robots permettant de renforcer la compétitivité des PME dans la production – qui a été fondée au titre du sixième programme-cadre de l'Union Européenne (FP6) (http://www.smerobot.org/)

Analysis of the impact of robotic systems on employment in the European Union
September 2014 13
Évaluation de l'impact de la robotique industrielle sur la productivité, comparée aux stratégies d'économie des salaires en délocalisant la production /transférant les activités vers des pays pratiquant les bas salaires : cette étude a révélé le fait que les entreprises utilisant les robots industriels sont bien moins susceptibles de délocaliser la production à l'étranger. La politique industrielle et concurrentielle européenne a pour conséquence le fait que la plus large diffusion des robots industriels parmi les entreprises manufacturières européennes pourrait s'avérer essentielle, non seulement pour maintenir le niveau actuel de la production industrielle au sein de l'UE, mais également pour rapatrier les activités de production et de fabrication qui ont été transférées vers des pays à bas salaires en Asie, en Inde ou dans l'Europe de l'est au cours des dernières décennies. Comme l'ont montré d'autres études, ces activités de délocalisation guidées par les coûts impliquent souvent des problèmes à l'égard de la qualité et de la flexibilité (Kinkel and Maloca, 2009). En ce sens, les robots industriels pourraient jouer un rôle important à l'intérieur de la stratégie de réindustrialisation CE pour l'Union Européenne. Cependant, la conception et la mise en œuvre du soutien de la politique future nécessitent davantage de connaissances au niveau de l'industrie afin de déterminer si et dans quelle mesure les effets positifs des robots industriels sur la productivité sont supérieurs à ceux obtenus par les activités de délocalisation vers des pays pratiquant des salaires bas. Pour accroître la validité et la solidité des résultats, une telle analyse devra également considérer différents scénarios du développement de la robotique à l'avenir.
Comme on peut le voir, les points susmentionnés sont en étroite corrélation. Par conséquent, il est judicieux de les intégrer dans une initiative de politique européenne globale, visant au futur développement technologique de la robotique industrielle au sein de l'Union Européenne.

Analysis of the impact of robotic systems on employment in the European Union
September 2014 14

Analysis of the impact of robotic systems on employment in the European Union
September 2014 15
1 Introduction
1.1 Context and background Due to technological progress, the domains in which robots or robot-based systems can be applied are ever increasing, as are the actual numbers of robots put to use in practice. Actually, given the figures on robot utilisation available today (e.g. IFR 2013a, b, c), nowadays robots and robot-based systems must be considered as an integral part of our society. Although the potential benefits of robot utilisation are numerous – such as being able to deliver superior quality or productivity or being able to work in hazardous environments (e.g. Kleine et al., 2011) – and can be even considered as generally accepted by society. As latest studies show (e.g. TNS Opinion & Social, 2012), there are also increasing fears by the public whether the potential benefits may be offset by yet not fully known and potentially negative impacts (e.g. AAAI, 2006). Thus, it is important to understand how they impact on each domain of our society and how these effects interrelate with each other – in particular for policy makers. The first and foremost concern is their economic impact in terms of their ability to improve the competitiveness of manufacturing companies and how this relates to their potential of creating or destroying jobs (e.g. Tobe, 2013). However, although this has already been discussed for a long time, these questions have not yet been answered. On the one hand, the economic rationale would suggest that the introduction of robot systems to industrial processes aims at optimising total factor productivity by substituting human activities to improve productivity, reliability and quality of these processes. As a consequence of this logic and given that the potential cost savings are not offset by the necessary capital expenditures, the introduction of robot systems would trigger profitability by minimizing labour-intensive activities (e.g. Schmidt and Rohde, 2010), and thus, leading to the elimination of the respective jobs and industrial workplaces (e.g. Tobe, 2013). On the other hand, arguments from a competitive perspective could lead into the opposite direction, since robots may solve the “labour cost issue” for many industries in high wage countries (e.g. Widmann, 2007). Following basic competition logic, industrial companies need to have at least the same or a superior level of total factor productivity as their competitors to be sustainably successful in their markets – given that their products and services yield the same customer utility. Therefore, companies that are able to achieve a higher level of total factor productivity by the intelligent use of robot systems, might be able to win market shares from their competitors with a lower total factor productivity level (e.g. N.U., 2009). Further, in addition to improving their competitive situation cost-wise, the use of robots may also improve customer utility in terms of quality and product performance. Both would, at least in the long term, lead to a higher level of sales, value-added, and thus would, as a direct effect, also pre-serve or even increase the employment level in these companies. Further, as a higher capital intensity usually also implies sunk costs for these companies, they might also perceive a higher barrier to offshoring and outsourcing production activities and jobs from higher-wage European countries to lower-wage regions in other parts of the world, particularly to Asia. If these companies perform offshoring or outsourcing of production activities to low-wage countries at all, they will have a tendency to focus on out-sourcing standardized production processes of mature products (e.g. Kleine and Kinkel, 2013; Kinkel, 2012; Kinkel and Maloca, 2009). The innovative and high skilled production and auxiliary value added activities would remain in their European locations at large, resulting in a higher level of innovativeness and high-quality jobs at the European home base (e.g. Dachs et al., 2012). And finally, it has also to be recognised that today even low-cost countries such as China perceive an increasing
Analysis of the impact of robotic systems on employment in the European Union
September 2014 16
need to shift their industries to a higher level of automation – not only because of increasing labour costs but also as a precondition to be internationally competitive in terms of product performance and quality (Mentgen, 2011). However, the empirical evidence of these effects is still scarce at best and usually suffers from methodological shortcomings (e.g. Tobe, 2013). For instance, they are mostly based on statistical material that does not provide means to directly link the effects on competitiveness and/or employment to the utilisation of robots in industry (e.g. Gorle and Clive, 2011). Further, even if they are based on studies directly investigating the use of robots in industry and their impact on competitiveness, they have either not yet thoroughly investigated the mentioned relationships and/or investigated them on a European basis (e.g. Armbruster et al., 2006; Kinkel and Weißfloch, 2009; Kleine et al., 2008). To summarise, as a key enabling technology to improve the competitiveness of the European manufacturing industry and the overall welfare of society, industrial robots and robot applications receive a lot of attention in research and policy. In particular for policy makers, it is of the utmost importance to further foster and develop Europe’s capabilities in robotics – meaning that the scarce financial resources must be spent so that they yield the best return of investments for society. However, in order to do so, further research is necessary on how robotics impact on economy and employment, and to understand the underlying cause and effect relationships. This study “Analysis of the impact of robotic systems on employment in the European Union” aims at improving this knowledge.
1.2 Scope and objectives Against this backdrop, this study aims at providing empirical evidence to the European Commission on whether and how the use of robots in industrial companies impacts on their competitiveness in general and on employment in particular. Its specific objectives are as follows: 1. A descriptive analysis of
a. the current utilisation of robots in industrial companies in seven selected European countries, by major structural properties such as company size, industry and country, and
b. the share of companies which have relocated manufacturing activities to other countries outside Europe, differentiated by the same categories.
2. A model based analysis
a. to identify determinants of robot utilisation in European industrial companies in the seven selected European countries,
b. to identify the effect of robot utilisation on manufacturing relocation activities in these countries,
c. to identify and quantify the effects of robot utilisation on the development of the competitive and employment situation in industrial companies in the seven selected European countries.
The general approach will be based on data generated by the European Manufacturing Survey (EMS), coordinated by the Fraunhofer ISI (Jäger and Maloca, 2009). This database does not only provide a unique and “not-yet-peered” insight into the

Analysis of the impact of robotic systems on employment in the European Union
September 2014 17
manufacturing and competitive strategies of major Europe industries (e.g. Kinkel, 2012; Kinkel and Maloca, 2009), but has already also been applied in the context of investigating the utilisation of robots in the manufacturing industry (Armbruster et al., 2006; Kinkel and Weißfloch, 2009; Kleine et al., 2008). Further, statistical material from World Robotics 2013, provided by the International Federation of Robotics (IFR) (2013d), on the use and dissemination of robots worldwide will be applied, as well as data on the structures of the countries’ industries considering sector and firm size classes, provided by the National Statistical Offices of the seven countries considered. Moreover, Eurostat data reporting on labour productivity of the EU 28 and some additional countries were used (European Union, 2014a).
1.3 Approach and methodology Given the scope and objectives explained above, the general approach of this study has been structured as in Figure 1-1. Based on this figure, the following will first describe the empirical database for this study in more detail and will in particular explain which key variables were utilized in order to operationalize the research objectives. Afterwards, the methodology to analyse this data and to answer the research objectives will be outlined according to the defined phases.
overall objective:provision of empirical evidence
on the impact of industrial robot usageon employment in Europe
Phase IAnalysis of robot usage
Phase IIAnalyses of the effects
of robot usage
Methodological basis:European Manufacturing Survey (EMS)
(N = 3,228 manufacturing firms, 7 European countries, 2009)
ConclusionsPolicy recommendation
Figure 1-1: General approach of study
1.3.1 Database and key variables This study is based on a subsample of the European Manufacturing Survey (EMS) 2009. The major properties of EMS in general as well as the data sample and key variables used for this study in particular are described in the following sections. European Manufacturing Survey EMS has been organised by a consortium of research institutes and universities from and across Europe since 2001. The EMS surveys the utilisation of techno-organisational innovations in manufacturing at the level of individual

Analysis of the impact of robotic systems on employment in the European Union
September 2014 18
manufacturing sites (of each company) and the thereby achievable performance increases in the manufacturing sector. In addition to the EMS, several other surveys try to monitor innovation activities of the economy, to identify backlogs of particular sectors, countries or regions. These surveys mainly focus on indicators which measure product innovation. Process innovations are hardly taken into account or, if at all, then on a very highly aggregated level. The Fraunhofer Institute for Systems and Innovation Research (ISI) developed the German Manufacturing Survey in 1993 to close this gap and to complement existing surveys on a national level in Germany. In 2001, this survey became international and developed into the European Manufacturing Survey (EMS). The EMS is managed by a consortium of research institutes and universities from countries in and across Europe. The Fraunhofer Institute for Systems and Innovation Research (ISI) coordinates the consortium. The EMS is carried out as a written or online survey by each partner in his country and at the level of individual manufacturing sites (of a specific company). The survey comprises a random sample of companies with at least 20 employees (at manufacturing site level) of the whole manufacturing sector in each country. Manufacturing or plant managers are invited to complete the questionnaire. The EMS covers a core of indicators on the innovation fields "technical modernisation of value adding processes", "introduction of innovative organisational concepts and processes" and "new business models for complementing the product portfolio with innovative services". The questions on these indicators have been agreed upon in the EMS consortium and are surveyed in all the participating countries. Additionally, some countries ask questions on specific topics. The data collection process follows a clear firm centered approach. All country samples where gathered addressing a random sampling of manufacturing firms. As address sources for contact data, the best available data bases in each country are used. A follow-up procedure assures a consistent approach on the data gathering process. A minimum of reminding procedures were applied in each country. The table shows the firm sample distribution across the European countries. The fixed set of core questionnaire is translated into the respective language of the country and tested in each country. In order to prepare multinational analyses the national datasets undergo a joint validation and harmonisation procedure. Thus, data allows for cross-country analyses based on comparable indicators. The underlying idea of the questionnaire design is to have a constant common pool of questions over several survey rounds, to modify other common questions in the respective survey round corresponding to current problems and topics from the area of innovations in production and to thirdly leave room for some country or project specific topics. As yet, data from four survey rounds 2001/02, 2003/04, 2006/07, 2009/10, and finally 2012/2013 is available. For a comprehensive analysis of the whole population of manufacturing industries in the European Union, the EMS data was related to other statistical data sources and, as far as available, analyses of other data sources were included in the report: World Robotics data (IFR 2013d) on the operational stock of industrial robots was employed to allow for a better interpretation of the results. Finally Eurostat data, providing statistics on labour productivity of the EU 28 and some other countries (European Union, 2014a) as well as on employement growth (European Union, 2014b), was employed for the validation and interpretation of the retrieved results. However,

Analysis of the impact of robotic systems on employment in the European Union
September 2014 19
regarding the objectives of this study we firmly believe that the above-mentioned advantages of the chosen EMS database outweigh its limitations by far.
Data sample and country coverage As pointed out before, this study employed data from the EMS round in 2009. EMS 2009 was carried out in 10 countries. It contains information on the utilisation of innovative organisational and technological concepts in the generation of products and services as well as performance indicators such as productivity, flexibility and quality of around 3,700 companies of the European manufacturing. With regard to industrial robots, EMS provides the actual number of firms using robots as well as the intensity of their robot usage related to the economically rational maximum in the own firm. By using this variable, EMS differs from other data sources as for example World Robotics (IFR 2013d) which measures the total amount of robots in use per country. While the latter refers to the installed based within a certain country, the EMS variable is targeted towards the broader economic diffusion of robots in terms of using firms. Given the aim of this study, the EMS perspective is more appropriate as it allows to examine the employement effects on a higher number of single firm observations instead of cumulative effects within a large enterprise with a high installed robot base. Given that, the statistical analyses were based on a subset sample of the EMS 2009 survey covering the data of more than 3,200 manufacturing companies from Germany, Austria, France, Spain, Denmark, the Netherlands, and Switzerland (compare Table 1-1). Obviously, Switzerland will act as the non-Community member benchmark country. The selected country samples account for a total sample of 3,228 enterprises with at least 20 employees across European manufacturing industry. This large firm-level data set allows in-depth analyses on the utilization of robots in seven different national industries.
Table 1-1: EMS data sample
EMS country EMS 2009- sample size Density of industrial robots
(# of cases) (# per 10,000 employees)
Austria 302 110
Denmark 315 156
France 158 124
Germany 1,444 273
Spain 114 138
Switzerland 661 75
The Netherlands 234 84 Total sample of EMS data used in this study 3,228
Source: EMS 2009; IFR, 2013a The analytical unit of EMS data are manufacturing sites with at least 20 employees. Compared to company data, analysing firm level data allow a more direct link between the production performance or employment trend and the application of industrial robots at this specific production site in Europe. Analyses of these firm level data are used for conclusions at company level in an analytical approximation, considering the major industry structure in manufacturing as rather small and medium sized companies. The industry structure is included by indicators based on the

Analysis of the impact of robotic systems on employment in the European Union
September 2014 20
"Nomenclature statistique des activités économiques dans la Communauté européenne" (NACE REV. 2) of firms with more than 20 employees. The data cover the whole manufacturing sector including sectors 10 to 33 (NACE Rev. 2). As can be seen in the attachment (TableAnnex 2 and TableAnnex 3), EMS data can be regarded as being representative for the selected countries both in terms of firm size and industry structure. Even if relying on non-weighted data, EMS shows no significant differences to the distribution reported by EUROSTAT. Although EMS contains a very high share of SMEs (~85%), firms with less than 50 employees are still underrepresented to a small degree. However, this can be expected for any kind of industry survey as such small firms are less likely to participate in large-scale surveys in general. Nevertheless, to ensure for a maximum of result validity, all calculations were additionally run for weighted EMS data that were adjusted for observed differences in the industry structure. For this purpose, National Statistics data of each country on manufacturing sites were used to weight the EMS survey sample according to the size (taking into account 3 or 4 firm size classes) and industry structures in the manufacturing industry (taking into account 9 to 14 industry groups, Nace Rev. 1.1, Division 15-37) in the respective country.3 Thus, weighting factors were employed on the EMS data sample, to align it with the actual firm sizes and industry structures in the respective countries. A summary of the weighting factors is displayed in the appendix (TableAnnex 1). The national statistics were provided by: Spain : Extract upon request. EMPRESAS EN LOS GRUPOS DE LAS DIVISIONES 15
A 37 POR GRUPO Y ESTRATO DE ASALARIADOS 20 Y MAS, 2009. Instituto Nacional de Estadística.
France : Dénombrement des entreprises et des établissements 2008. INSEÉ, institut national de statistique et des études économiques. http://www.insee.fr/fr/themes/detail.asp?ref_id=fd-sidenomb08&page=fichiers_detail/sidenomb08/telechargement.htm
Germany : Statistisches Bundesamt (2009a): Fachserie 4: Produzierendes Gewerbe, Reihe 4.1.2: Betriebe, Beschäftigte und Umsatz des Verarbeitenden Gewerbes sowie des Bergbaus und der Gewinnung von Steinen und Erden nach Beschäftigtengrößenklassen, Ausgabe 2008. Wiesbaden.
Austria : Leistungs- und Strukturstatistik, Betriebsdaten. 2007. STATISTIK AUSTRIA. Denmark : Statistics on production sites, work places in Denmark. 2008. Statistics
Denmark. The Netherlands : Cross-table vestiging, filiaal or dependence in the Netherlands.
2007. Statistics Netherlands. Switzerland : Auszug aus dem Betriebs- und Unternehmensregister (BUR). Größen ab
20 Beschäftigten. Bundesamt für Statistik. 5. März 2009.
3 Eurostat data could not be used for this purpose as it does not contain such data at the level of the manufacturing site. Besides, the number of strata for calculating the weighting factors depended on the size of the data set, trying to be as precise in grouping as possible as well as avoiding zero cells or cells below five cases.

Analysis of the impact of robotic systems on employment in the European Union
September 2014 21
Key variables In order to answer the research objectives given above, the following key variables and indicators were operationalised based on the available EMS data4: As the main indicator to measure robot utilisation we used answers to the EMS question “Does your company use industrial robots in production and/or assembly processes (y/n)?”. In descriptive analyses we displayed the share of companies in the relevant country/sector which uses industrial robots as a percentage of all companies in the relevant country/sector. In model-based analyses we used the dummy variable “robot use y/n” on the company level as the dependent variable. In addition to the utilisation of industrial robots, we employed the “extent of actually utilized potential” of industrial robots with ratings from “low” for an initial attempt to utilize over “medium” for partly utilized to “high” for extensive utilisation. The operationalisation aimed for capturing to which extent the technology is actually used “compared to the economically most reasonable potential utilization in the factory” offering the three answer categories as decribed. In model-based analyses we used the dummy variable “intensive robot use” on the firm level as the dependent variable. As the main indicator for measuring relocation of manufacturing activities outside Europe we used answers to the EMS question “Did your company relocate parts of their manufacturing activities to foreign countries (y/n)?”, covering a timeframe of these activities from 2007 to mid 2009. We then selected such companies which stated in an additional question on the target countries of their relocation activities that some of their manufacturing activities relocated to countries outside the European Union and outside Switzerland. In descriptive analyses we displayed the share of companies in the relevant country/sector which relocated parts of their manufacturing activities to foreign countries outside Europe as a percentage of all companies in the relevant country/sector. The model-based analyses used the dummy variable “relocated activities y/n” on the company level as the dependent variable. As the main indicator for measuring the development of the competitive and employment situation in the respective companies we used answers to the EMS questions on the (a) “annual turnover 2008” vs. “annual turnover 2006”, (b) “procured services and materials 2008” vs. “procured services and materials 2008” and (c) “Number of employees of your company in 2008” vs. “Number of employees of your company in 2006”. We used these measures in the descriptive as well as model-based analysis. While the answers to the employment situation are directly linked to the research objectives, the answers to the annual turnover and procured services and materials provided an indirect indication of the added value created on a company level, which also provided insights into the ability of robot utilisation impacting on the overall welfare of society. Additionally, considering also (d) the labour cost measured as a share of total turn-over and (e) the depreciation of machinery and equipment (euros) a further indicator of productivity is analyzed, total factor productivity (TFP). It takes into account value added (total turnover minus inputs) divided by the sum of labour cost and depreciation of machinery and equipment.
4 The original questions from EMS which were employed for the operationalization of the key variables can be found in the annex in TableAnnex 4.

Analysis of the impact of robotic systems on employment in the European Union
September 2014 22
1.3.2 Methodological background This section gives an overview of the statistical methods applied to answering the research questions stated above.
Phase I: Analysis of robot utilisation Chapter 3 first displays a general statistical description of the EMS samples used in this study as well as descriptive analyses of the distribution of robot utilisation in industrial companies (Chapter 3.1, 3.2). For the descriptive analysis of the current utilisation of robots in industrial companies (objective 1a) and the share of companies which have relocated manufacturing activities to other countries outside Europe (objective 1b) we analyzed the respective variables “robot utilisation“ and “relocation” by company sizes (four company size classes < 50 employees, 50-249 employees, 250-999 employees, 1,000 and more employees), sectors and countries. Any descriptive analyses are based on weighted data adjusting to the respective industry structure in each country. By comparing the descriptive analyses based on weighted as well as unweighted data the quality of the data and the reliability of the results are assessed. To identify the main determinants of robot utilisation in industrial companies (objective 2a) of the seven selected European companies, a logistic estimation for the dummy variable of robot utilisation (y/n) as the dependent variable has been employed (Chapter 3.3). As independent variables, which might be relevant factors for explaining robot utilisation on the company level, we used the following: The seven selected countries as dummy variables, as we assume that in some countries with an innovative and international competitive manufacturing sector in their long manufacturing history the utilisation of industrial robots might be higher than in countries with different sector specializations. Country differences in manufacturing traditions and business cycles might also explain the relocation behaviour and employment strategies in industrial companies.
Size of the company, measured as the logarithm of the number of employees, as we assume that larger companies have more experience with the introduction of advanced production technologies and more possibilities and higher economies of scale to make efficient use of industrial robot systems. The argument of higher economies of scale within the boundaries of large companies rather than small firms, given their reduced and sometimes sub-critical mass in certain production and auxiliary functions (Klette, 1999; Söderbom and Teal, 2001), persists also for a higher probability of manufacturing relocations and employee changes in large companies.
Industrial sectors as dummy variables, as we assume that in sectors with high production volumes and mass or serial production processes industrial robots are used to a significantly higher percentage than in sectors with lower or single unit production processes. Sector differences in production processes and business cycles might also to a large extent explain the relocation behaviour and employment strategies in industrial companies.
Batch size of production, as we assume that companies with production processes in large batch sizes are more suitable for using industrial robots than companies with smaller batches or single unit production processes. Economies of scale are easier to realize under the frame conditions of large batch size production, enabling productivity growth through rationalising repetitive tasks (Söderbom and Teal, 2001; Broedner et al., 2009). Existing economies of scale are also major prerequisites for relocating parts of manufacturing activities to foreign countries

Analysis of the impact of robotic systems on employment in the European Union
September 2014 23
(Kinkel and Maloca, 2009; Kinkel, 2012) or employee layoffs as practicable productivity improvement measures.
Product complexity, as we assume that companies which produce simple products in large volumes as well as companies which assemble complex products in large volumes have a higher need and more potential for automating their production processes than companies producing medium-complex products. Vice versa, such processes bear a lower risk of being relocated to foreign countries, as industrial companies will firstly exploit their automation and productivity potentials at home before shifting them to foreign locations (Kinkel and Maloca, 2009;Kinkel, 2012). This might also affect the employment situation in the respective companies.
Mode of production (to make-to-order compared to make-to-stock or to assemble according to customer orders), as we assume that productivity gains are more important and delivery on time is less important for companies producing on stock, leading to a higher need to use industrial robot systems. Companies producing on stock might also feel a higher necessity to improve their productivity levels further by relocating manufacturing activities abroad or reducing their personnel cost burden.
Export behaviour, measured as the logarithm of the share of turnover in foreign markets, as we assume that companies which are facing international competition in foreign markets are under more pressure to improve the productivity of their production processes via industrial robot systems than companies which are solely serving their home markets. The same argument of a superior need of exporting companies to further exploit efficiency and productivity potentials (Bernard and Jensen, 2004; Broedner et al., 2009; Wagner, 2002) holds also true for explaining relocation decisions or employee layoffs in these companies.
R&D orientation of the company is measured as a binary variable indicating that the share of R&D personnel is higher than the share of personnel working in production. Additionally, it is controlled for the share of unskilled or semiskilled personnel of the total number of employees. We assume that R&D intensive companies have a higher absorption capacity for advanced production technologies like industrial robot systems than companies with a low R&D intensity (Som, 2012). Moreover, we assume that the absorption capacity increases with a decreasing share of semi- or unskilled workers. Furthermore, companies with a high R&D orientation respective a higher R&D intensity might show higher labour productivity, as a clear focus on R&D and innovation might enable manufacturing companies to escape the low-cost race and enhance the possibility to achieve sufficient prices and thus superior productivity (Clark and Griliches, 1982). As a result, such companies might show lower propensity to relocate manufacturing activities abroad and to use employee layoffs as productivity enhancement measures.
Depth of value-added/vertical integration, measured as the share of value-added (total turnover minus total inputs) on total turnover, as we assume that companies with a higher vertical integration possess a higher share of the total value chain which might give them more possibilities to exploit economies of scale and productivity gains using industrial robot technologies. Research has also shown that companies with a higher level of vertical integration – which is also one of the characteristics of the so-called hidden champions (Simon, 2012) – have higher productivity than companies with a lower vertical integration level (Broedner et al., 2009). Thus, they may also be more reluctant to move manufacturing relocations abroad and layoff employees as pure cost-oriented management measures.
Export orientation is measured as logarithm of the share of products sold abroad. Additionally, a binary variable indentifies non-exporting firms for separating the effect of the amount of export from the effect of the mere fact selling abroad.

Analysis of the impact of robotic systems on employment in the European Union
September 2014 24
Particularly with regard to SMEs the latter indicator might be relevant because it accounts for the basic openness towards international markets instead of solely focussing on the financial export performance.
Due to item non-response – a usual characteristic of survey data in contrast to statistical data – the numbers of observations have been reduced for the multiple regression models. For detecting systematic biases, the reduced data set used in the models is compared to the full set data included; relevant limitations of the models will be reported.
Phase II: Analysis of the effects of robot utilisation To assess the effect of robot utilisation on relocation activities, a logistic model analyzing the main determinants of manufacturing relocation activities (objective 2b) in industrial companies in the seven selected European countries is used. The methodological approach is basically the same as above explained for robot utilisation. Considering the aim of this study, the interpretation lies on the impact of robot use (Chapter 3.4). The identification and quantification of the effects of robot use on the development of the competitive and employment situation (objective 2c) in industrial companies in the selected European countries is again based on model based statistical analyses. In these models, the dependent variables will be the key figures of value-added per employee as a widely used measure for the labour productivity of manufacturing companies, the total factor productivity as an additional and more integrated productivity measure and the development of the number of employees between 2006 and 2008 as an integrated measure of the competitive situation of the company and its ability to grow and provide manufacturing jobs in its European locations. The dummy variables “robot use" and “intensive use of industrial robots” as defined above will be used as the key independent variable to explain the competitive and employment effects. Other independent variables, which might be relevant factors to explain competitive positions and employment developments on the company level, basically correspond to the set of independent variables already used to explain the utilisation of robots and the relocation of manufacturing activities as described in the sections above. To identify the main determinants of labour productivity in manufacturing companies, a multivariate regression model is employed. The firm's labour productivity is measured as the logarithm of value added (total turnover minus inputs) per employee and serves as the dependent variable of the model. In order to account for overall productivity effects, a second multivariate regression model with the total factor productivity (TFP), measured as the logarithm of value added (total turnover minus inputs) divided by the sum of labour cost and depreciation of machinery and equipment, as the dependent variable of the model, is utilized. For the identification of the main explaining factors for employment growth in manufacturing companies, another multivariate regression model is used. The dependent variable of employment growth is measured as the logarithm of the difference of its number of employees in 2008 compared to 2006, calculated as the percentage of change compared to 2006. For methodological reasons the dependent variable was splitted into an indicator of the degree of positive employment growth and one of the degree of negative employment growth.
Analysis of the impact of robotic systems on employment in the European Union
September 2014 25
2 Current state of knowledge The following chapter provides an overview of the current state of knowledge concerning the use and impact of robotic systems and manufacturing relocation activities. In order to create a common understanding of robotic systems in the context of this study automation, robots and robotic systems will be defined. Subsequently, the dissemination of robotic systems, and therefore the relevance of an analysis of their impact, will be outlined. This is followed by an overview of the most important available qualitative and quantitative studies investigating the effects of robot utilisation and automation. Conclusively, literature on relocation of manufacturing activities is reviewed.
2.1 Definition of automation, robots and robotic systems Robotics represent a substantial subset of automation (Nof, 2009). This implies that robots can be part of automated systems. Nevertheless, the latter comprise more elements than just robots and thus, they show enhanced characteristics and abilities. Consequently, in a first step the term automation will be outlined before robots and robotic systems are defined. Finally a differentiation between automation and robotics will be made.
2.1.1 Automation The term automation can be specified in many different ways: from representing only the process of automating production (The Automation Federation, 2014) through to describing a predetermined sequence of operations and actions that is performed independently with little or no human intervention (e.g. Gupta and Arora, 2007; Mittal and Nagrath, 2003). A brief definition that outlines automation in an industrial context, suitable for the present study, is given by the International Organization for Standardization (ISO). It defines automation as “[t]he implementation of processes by automatic means” (ISO/TR 11065:1992). In that context automation comprises four basic elements: 1. platforms (usually machines, tools, devices, installations and systems)
2. autonomy (which is defined through organization, process control, automatic control, intelligence and collaboration)
3. processes (e.g. actions, operations, functions)
4. power sources The design and development of all these components is conducted by humans. However, the processes and chains of activities are executed without human involvement (Nof, 2009).
2.1.2 Robots and robotic systems According to the scope and objectives of this study we only consider industrial robots as distinct from service robots.5 According to Stauffer (1979) an industrial robot in general is a mechatronic device designed to automatically manipulate or transport
5 It has to be noted, that the classification of a robot into one of the two categories is done based on its intended field of application (IFR 2013c). Therefore, we consider only robots that are used in an industrial context. IFR 2013c keeps information on service robotics available.

Analysis of the impact of robotic systems on employment in the European Union
September 2014 26
parts or tools or, more precisely, according to the ISO definition also used by the International Federation of Robotics (IFR) “[a]n automatically controlled, reprogrammable, multipurpose manipulator programmable in three or more axes, which can be either fixed in place or mobile for use in industrial automation applications” (ISO 8373:2012; IFR 2013a). Consequently, an industrial robot: 1. executes its tasks without any external commands during the process
(“automatically controlled”),
2. can have its motions changed without someone changing its hardware (“reprogrammable”)
3. can be adapted to different operational domains with physical alterations (e.g. changing tools or graspers – “multipurpose”).
In summary, a high degree of flexibility and variability in its motions and activities can be considered the unique features of an industrial robot (Hunt 1983; IFR 2013a). Since an industrial robot consists of several components such as a mechanical structure, sensors, a computing and a control unit (Ceccarelli, 2004; Nof, 2009) it is often referred to as a robotic system (e.g. Jacak, 1999; Liu et al., 2009; Shah et al., 2013; Tzafestas, 1992).
2.1.3 Automation and robotic systems As already mentioned above, automation is considered a superset of robotics, meaning that beyond similarities they both share (like automatic control) automation goes further. In contrast to robotic systems automation is not centred on single tasks or activities, but comprises whole sequences of operations. Furthermore, automation has a more global view on the production system, as it for example also integrates decision-making, planning and optimization activities and collaboration as well as enterprise resource planning automation. In addition to robotic systems, automation according to Nof (2009) usually includes: 1. non-robot devices (e.g. timers, valves, sensors)
2. automated machines (e.g. drills, presses, vehicles)
3. automatic inspection machines or measurement workstations
4. inter-linkage installations (for example elevators, conveyors and railways)
5. control systems (e.g. decision making systems, production planning systems, enterprise resource planning systems)
Nevertheless, robotic systems may be part of an automated system, but their explicit focus is on the automation of motion and mobility.
2.2 Dissemination of robots In this section the dissemination of robots worldwide, in Europe and in the countries that are analyzed in this study will be outlined in order to demonstrate the relevance of industrial robots in general and to underline the importance of an analysis of its impact in particular. The IFR 2013d data shows that in a global perspective there has been a continuous rise of the stock of operational industrial robots between 2004 and 2012, except for a decline in 2009 due to the global economic crisis (cf. Figure 2-1). On average, the

Analysis of the impact of robotic systems on employment in the European Union
September 2014 27
annual growth rate amounts to 5%. A total increase of 45% from 849,603 robots in 2004 to 1,235,389 in 2012 proves the growing importance of industrial robots. It has to be noted, however, that the share of Europe in the global stock of industrial robots, fluctuating between 31% and 34% within the time period from 2004 to 2012, has been slightly decreasing since 2009.
33%
2006
949,823
33%
2005
922,838
32%
2004
849,603
33% 33%
2007
1,659,500
+45%
+5%
2016*
26%
2013*
1,373,000
28%
2012
1,235,389
31%
2011
1,153,097
32%
2010
1,059,162
33%
2009
1,020,731
34%
2008
1,035,301994,264
* forecast
EuropeGlobal
Source: data from World robotics 2013. IFR 2013d.
Figure 2-1: Global operational stock of industrial robots from 2004 to 2012 including a forecast for 2013 and 2016.
A more detailed overview of the stock of operational industrial robots for selected countries is given in Figure 2-2; the countries with the highest values are displayed as well as the countries analysed in this study. Except for Japan all countries increased their amount of installed robots between 2007 and 2012. However, Japan still accounts by far for the highest number of robots compared to the countries considered. Large increases in the stock of robots within the five-year period can be recorded in the Republic of South Korea (93%) and China (305%). When the smaller countries in this study are analyzed, the Netherlands, Austria, Switzerland and Denmark have high growth rates of around 20% and higher, whereas the bigger countries, France, Spain and Germany lag behind these figures. In Figure 2-3 the number of industrial robots per 10,000 employees in the manufacturing industry can be seen for 2007 and 2012. This ratio can be regarded as an indicator of the degree of automation.6 The Republic of Korea, Japan and Germany are the leading nations – the other countries follow with a certain gap. A big variety of the degree of automation can be registered among the countries relevant to this study. It has to be noted, that except for Japan, all nations increased their number of industrial robots per 10,000 employees between 2007 and 2012.
6 The countries that have been considered for EU- and World-values are listed in TableAnnex 5.

Analysis of the impact of robotic systems on employment in the European Union
September 2014 28
100,000 400,000350,000300,000250,000200,000150,00050,0000
+5%
+19%
+31%
+55%
+305%
+16%
+39%
0%
+93%
+23%
-13%
Denmark
Switzerland
Austria
Netherlands
Spain
France
China
Rep. of Korea
Germany
USA
Japan
20122007
Source: data from World robotics 2013. IFR 2013d.
Number of robots
Figure 2-2: Stock of operational industrial robots in 2007 and 2012 for selected countries.
050
100150200250300350400
Japa
n
Ge
rman
y
Ital
y
Den
mar
k
Rep
. of K
orea
Rus
sian
Fed
erat
ion
Bra
zil
Pola
nd
Chi
na
Wor
ld
Cze
ch R
epub
lic
Uni
ted
Kin
gdom
Sw
itze
rlan
d
Euro
pe
Net
her
lan
ds
Au
stri
a
Spa
in
Fran
ce
USA
20122007
Source: data from World robotics 2013. IFR 2013d.
Num
berof
robo
tspe
r em
ploy
ee
Figure 2-3: Number of industrial robots per 10,000 employees in manufacturing in selelcted countries in 2007 and 2012 (ISI rev. 4:C).
In Europe, manufacturing accounts for 288,805 out of 325,859 industrial robots in 2007, representing a share of 89%. In 2012 this figure decreased by a little to 86% (328,921 out of 380,546 installed robots). The automotive sector is by far the largest

Analysis of the impact of robotic systems on employment in the European Union
September 2014 29
operator of industrial robots in Europe and even increased its stock of robots by 10% between 2007 and 2012 (Figure 2-4). Metals and metal products are the second most important industry concerning robot utilisation, also showing a steep rise in the analyzed time period. It is followed by plastics and chemical products, whose robot utilisation is quite stable. After the food and beverages industry the electrical and electronics industry accounts for a significant share of operated industrial robots. Other industries, such as glass, ceramics, stone and minerals products, wood and furniture, paper and paper products, as well as textiles and leathers can be neglected.
200,0000 50,000 100,000 150,000
Metal
Automotive
Plastic and chemical products -1%
+41%
+10%
Textiles and leather
Paper and paper products
Other vehicles
+6%
+14%
-38%
+13%
+9%
+81%Food and beverages
Electrical/electronics
All other manufacturing branches
Glass, ceramics, stone, mineral products
Wood and furniture
-8%
-23%
20122007
Source: data from World robotics 2013. IFR 2013d.
Number of robots
Figure 2-4: Operational stock of industrial robots in Europe by main branches of the manufacturing industry in 2007 and 2012.
2.3 Impact of automation and robotics on economic growth, competiveness and employment
This section covers the various effects automation and robotics exhibited for the socio economic field by a structured literature review. Robotics as a “key transformative technology” (Robotics VO, 2013, p. 7) and automated manufacturing quintessentially impacts on various arrays connected to economic growth and competiveness in manufacturing. Quantitative as well as qualitative effects are reviewed, concluding with shortcomings of previous studies in this field.
2.3.1 Impact of automation on productivity and employment From a data-driven, statistical perspective, labour productivity captures the dynamics of economic growth and competitiveness – among various additional indicators (Freeman, 2008). On a country aggregation level for the EU27, a recent World Bank study, based on the Amadeus firm-level database, reveals that the average labour productivity has risen in all countries except Italy, Spain and Greece (Dall'Olio et al., 2013) in the years 2002-2008 when large structural changes happened. Economists refer to various causes for these productivity changes, in particular government regulations, trade changes, and industry technology-driven changes (Dall'Olio et al., 2013).

Analysis of the impact of robotic systems on employment in the European Union
September 2014 30
According to Miller and Atkinson (2013) automation and robotics are core drivers of the technology-driven changes that increase productivity as key enablers for human progress. In that context, research analyzes automation associated with productivity and employment on different levels of aggregation: firm, industry, region, country and on different time scales: short term, medium term and long term (Miller and Atkinson, 2013). Miller and Atkinson state that most research studies look at the long term correlation of productivity and employment over the last 60 years, arguing about the “causal link” between the growth of total employment and productivity. On the one hand, the frequently cited authors Brynjolfsson and McAfee even look further into the history in order to understand employment impacts of automation from a historic point of view of the 19th and 20th century. Successive waves eliminated jobs, but entrepreneurs seized new opportunities for job creation (Brynjolfsson and McAfee, 2011). For the current digital age, the authors Brynjolfsson and McAfee (2011) ultimately believe that productivity gains remain, but meanwhile former typical types of jobs are likely to be replaced by more flexible and cheaper routines of installed machines (Rotman, 2013). As a solution they discuss counteracting the accelerated speed of continuous improvements of automation through investments in the complementary human capital, particularly education and skills. On the other hand Miller and Atkinson (2013) summarize several IMF economists’ papers stating various effects, that especially in the short term, cyclical factors like recessions sparking declines in employment, finding at the same time that the long-term technology changes are not responsible for it. Stochastic models like the one introduced by Kromann et al. (2011), using cross-country and cross-industry data (with industrial robots as a measure for automation; stock of industrial robots based on IFR and EU-KLEMS data: nine countries, eleven industries for the period 2004-2007) estimate, based on time scale effects, the impact of labour productivity on employment. The researchers discover that automation “…has a significant positive impact on productivity in the short run (three years) as well as in the long run. Moreover, automation tends to reduce employment in the short run. In the long run, however, employment increases.” Kromann et al. (2011, p.15) remark explicitly that in some countries, within an industry, specialization implies more difficulties in the automation process, leading to a lasting effect on employment growth.
2.3.2 Quantitative effects of robot utilisation This chapter reflects core considerations in studies which are directly based on IFR dissemination data of robots, also in the context of previously launched studies of the EC on robotics (Joint Research Centre - Institute for Prospective Technological Studies), specifically aiming at how to support competitiveness of the EU robotics industry (Forge and Blackman, 2010). Robotics technology advanced sufficiently, now able to transform the work place in cooperative working environments (Robotics VO, 2013, p. 2). Quantitative studies on employment effects do not track explicitly these cooperative work units, however, they do track overall industrial robot counts and employment dynamics in different countries based on firm sizes. The most discussed published series by Metra Martech, the latest release authored by Gorle and Clive (2013), analyzes the impacts of the use of robots on the industrial production of goods by combining the robot use data provided by the IFR with economic data on six selected countries. The study covers the years 2000 up to 2016 for an outlook. The conclusions were reviewed and discussed by IFR members.

Analysis of the impact of robotic systems on employment in the European Union
September 2014 31
Gorle and Clive (2013, p.1) argue that the statistics reflect (mostly) small reductions in employment numbers in manufacturing in developed countries. At the same time output increases and additionally an increase in robotics use can be stated, in addition to the case of Japan. Contrary to the developed countries, the industrialising countries unfold a marked increase in manufacturing employment and output. The study estimates the total job creation due to robotics for up to and including the year 2008 at 8 to 10 million; for 2008 to 2011 at 500,000 to 750,000; for the period from 2012 to 2016 at 900,000 to 1.5 million; for 2017 to 2020 at 1 to 2 million. Additionally, the robot industry generates 170,000 to 190,000 jobs in the world, as stated by Gorle and Clive (2011, p. 5). Tobe (2013) takes a critical view of the mere numbers of the Metra Martech Report 2011 amended by expert interviews (predecessor of the Metra Martech 2013 report) and reviewed it. Tobe assessed the overall potential for job generation, for both industry and service robotics. Especially jobs in SMEs and healthcare / medical robotics are estimated to grow massively over the next few years. 21% to 24% potentially new jobs can be assigned to service robots in manufacturing and marketing. It concluded that Metra Martech research had determined a job-creation ratio of 3.6 jobs for every robot deployed and that with more robots, fewer jobs are lost.” Reviewing the Metra Martech Report, author Tobe reflects the positive value of the tool, concurrently stating that “two areas stand out as seriously unsubstantiated [...] 1. offsets of jobs displaced, 2. downstream jobs.”
2.3.3 Qualitative effects of robot utilisation In this section scientific studies identifying several qualitative effects of robot utilisation on labor debated in the research community are reviewed. The discussed effects include possible impacts on labor skills, societal changes, trust and safety concerning human-robot-interaction. The continuous rise of operational manufacturing robots will improve the quality of jobs directly (developing, producing, maintaining and training of robots) and strengthen the global competitiveness (Robotics VO, 2013). Both main concerns of human-robots interaction - safety and ergonomics - improve working conditions, reduce medical problems, and leverage the skills of robot precision and human intelligence, effectively adding to the responsiveness of systems and overall reduced lead times (Surdilovic et al., 2010; Robotics VO, 2013). Experts indicate that through adopting robots to more flexible manufacturing environments, these production systems may also be economically competitive to outsourcing to low wage countries (Robotics VO, 2013). Lin et al. (2011) speak in this context about “three Ds”, when robots are used to perform tasks. These are dull, dirty or dangerous tasks in automated manufacturing environments, which human workers do not have to execute any longer. This is a great advantage concerning safety and health from an employee’s point of view and due to euRobotics aisbl (2013) also concerning waste and resource use optimization from an ecological and economic viewpoint. On the other hand, Frey und Osborne (2013) conclude, bringing together the insights from the World Robotics Report, the McKinsey Global Institute Report on Disruptive Technologies (McKinsey Global Institute, 2013) and the Roadmap for US Robotics (Robotics VO, 2013) that job profiles change in the manufacturing industry and increasingly in a broader range of tasks, because robots have enhanced senses and increasing dexterity, which allows them to perform a broader range of manual tasks. An example for this is the increasing automation in science (King et al., 2009). Lin et al. (2011) point out that human workers, who are replaced or enhanced by robots,

Analysis of the impact of robotic systems on employment in the European Union
September 2014 32
can focus on fields of activity, where they can make a greater impact through acquiring creative and social skills, for example. But on the other hand a societal change may take place if technology “dependency” through automation and robots increases, because a gradual loss of certain skills may occur. Mital and Pennathur (2004) state that the automation movement has resulted in significant deskilling the American worker, because automation means little or no human intervention. Autor and Dorn (2013) and Frey and Osborne (2013) mention an effect of computerization in general, which could also be applied to the field of automation systems and robots specifically and corresponds to the previously indicated deskilling issue. They point out that by eroding wages for routine tasks, workers will reallocate to relatively low-skill service occupations. In the case that automation systems and robots enhance human workers instead of replacing them, human-robot interaction has a severe impact on the outcome of the manufacturing industry. The handling of limitations and interdependence of both, technology and human workers is a key issue. Due to Mital and Pennathur (2004) it is important to understand work-place stresses, skill-training requirements, consequences of making errors and error reduction, which is highly linked to usability and communication designs. Hancock et al. (2011) introduce the term trust as a prerequisite for human-computer or robot interaction, because it directly affects the willingness of people to accept robots’ suggestions or information. Concerning co-working robots, human safety is an issue, even more so than for automated robots, which are working separately in a cell or cage. Forge and Blackman (2010) believe that a new safety approach is necessary in order to improve the dissemination of robots in manufacturing and service environments.
2.3.4 Relocation of manufacturing activities The movement of production activities from the home base of manufacturing companies to foreign locations has been researched theoretically and empirically for some time (e.g. Dunning, 1980, 1988; Stopford and Wells, 1976; Vernon, 1966, 1979). Some more recent studies show that in particular the relevance of the vertical relocation of production activities to low-wage countries grew in the 1990s and in the first years of the 21st century (e.g. Barba Navaretti and Falzoni, 2004; Brainard and Riker, 1997; Egger and Egger, 2003; Mucchielle and Saucier, 1997; Pennings and Sleuwaegen, 2000). Whereas in the past predominantly multinational enterprises (MNEs) were active in this arena (e.g. Ayal and Zif, 1979; Buckley and Casson, 1976; Caves, 1982), today production relocation as a replacement mode of operating foreign direct investment (FDI) is becoming an increasingly interesting option for firms of all sizes (Mucchielli and Saucier, 1997; Pennings and Sleuwaegen, 2000). The fifth enlargement of the European Union in May 2004 with the joining of the ten new Eastern European Community Countries (EECC) has accelerated the dynamics of this development (Egger and Egger, 2006; Kinkel et al., 2007; UNCTAD 2005, 2007). The EMS data used for this study employs a question to the surveyed companies if they relocated parts of their manufacturing activities to foreign countries, covering a timeframe of these activities from 2007 to mid 2009. It has to be acknowledged that in the second half of this timeframe, from mid 2008 to mid 2009, large parts of the European industry were heavily hit by a sudden economic downturn as a consequence of the global economic crisis. This external shock affected the European companies’ FDI and relocation strategies significantly. The 2009 World Investment Report has conclusively shown that the global economic crisis led to a severe reduction in global FDI flows (UNCTAD, 2009). Prior studies have also conclusively shown that relocation activities of companies located in developed European countries towards the Eastern European Community

Analysis of the impact of robotic systems on employment in the European Union
September 2014 33
Countries (EECC) are primarily cost-driven (e.g. Mucchielle and Saucier, 1997; Pennings and Sleuwaegen, 2000). For relocation activities targeted at Asian countries and specifically China, the search for lower labour costs plays an important role, too, but market seeking motives are almost an equally strong driver (Kinkel and Maloca, 2009; Kinkel, 2012). As most EECC were suffering harder and longer from the consequences of the economic crisis than the emerging economies in Asia, particularly China, companies targeted their cost and market seeking relocation activities significantly more often at the further growing Asian emerging economies (Kinkel, 2012).
2.3.5 Shortcomings of current research studies Although most studies clearly define their research question as theory driven, they are often challenged with sorting out and classifying various dynamic employment effects over region, time, and on the firm level. Furthermore, the chosen deterministic (e.g. Gorle and Clive, 2013) and probabilistic models (e.g. Kornman et al., 2011) establish hypothesis structures without clearly enough defined dependant, independent variables and interdependent effects. The definition and operationalization of the theoretical constructs is of imminent importance, being able to clearly distinguish related theoretical concepts. As most quantitative research studies depend on IFR data, the data seems to lack the much needed robot use statistics on the firm level. Raw use or not-use data seems to be not sufficient and unable to capture the use of the potential of robots interacting with humans. Ultimately, based only on the utilisation data, additional difficulties have to be considered, as Rotman (2013) states: "One reason […] to pinpoint the net impact on jobs is that automation is often used to make human workers more efficient, not necessarily to replace them.” It is assumed that most studies would have benefited largely to incorporate various scenarios, comparing them, and being able to discuss and possibly falsify them. The qualitative research studies depend principally on expert interviews, or multiple, large organized workshops bringing together experts of adjacent research and practitioner fields. As such these are adequate approaches to analysing a transformative technology like robotics in the context of employments effects. Qualitative employment studies may capture new causal effects, especially for the research of robotics as a transformative technology, where scientists from various research areas are involved. But essentially they do lack the ability to interpret and analyse economic key numbers like long-term industry changes, and internationalisation effects. The EU countries reflect strong networks with constant changes which can be tracked much better by longitudinal studies, and which are able to precisely compare different employment effects over a timeframe.
3 Analysis of robot utilisation This chapter includes a profound descriptive analysis of the employment of robots in the seven selected countries and a descriptive analysis of the relocation of manufacturing activities to countries outside of Europe. Thus, an overview of the characteristics of robot users is provided and the basis for further analyses is established. Subsequently, model-based analyses are conducted to try to determine first the factors which explain robot use and second, the effect of robot use on relocation activities taking into account other explanatory factors.
3.1 Descriptive analysis of robot utilisation As a fundamental first step an extensive descriptive analysis of robot utilisation by firm size, industry and country will be delivered in this section.

Analysis of the impact of robotic systems on employment in the European Union
September 2014 34
3.1.1 Robot utilisation by firm size As expected, larger firms use industrial robots much more frequently in their production processes than smaller firms. According to the weighted data (i.e. data of the survey sample was weighted according to the size and industry structures in manufacturing in the respective country as presented on page 27) 24% of all firms in the selected countries with 20 to 49 employees are making use of industrial robots in their factories. The use rate increases almost linearly with the size group of the surveyed companies: 36% of the companies with 50 to 249 employees are users of industrial robots, compared to 56% of the companies with 250 to 999 employees and 74% of the companies with 1,000 and more employees. Thus, the size of the company, measured as the number of employees, is a clear predictor for the frequency of robot use in industrial companies. This is due to the fact that larger companies have more experiences with the introduction of advanced production technologies and more possibilities and higher economies of scale to make efficient use of industrial robot systems. The very small differences between the weighted values and the unweighted values are a strong indication that the survey sample represents the parent population of manufacturing companies in the selected countries very well and is only to a very small degree biased towards larger firms.
24%
38%
58%
77%
24%
36%
56%
74%
0% 100%
20 to 49 employees
50 to 249 employees
250 to 999 employees
1000 and more employees
Share of f irms
Source: European Manufacturing Survey 2009, 7 countries. Fraunhofer ISI
unweighted data weighted data
Figure 3-1: Shares of firms using industrial robots, by company size.
3.1.2 Robot utilisation by industry The results obtained when differentiating robot utilisation by industrial sectors are highly predictable. According to the weighted values, manufacturers of rubber and plastic products and manufacturers of transport equipment have the highest share of companies using industrial robots in their production processes, with 46% and 45% respectively. This may be basically caused by the large volumes and batch sizes these sectors are able to run in their production processes and in particular in their assembly processes, which allows for intensive investments in advanced automation technologies. Ranks three and four are closely grouped with the electrical industry and manufacturers of metals or metal products with a level of 38 and 37% of robot use in their companies. Here, the production and assembly processes are performed with slightly smaller volumes and batch sizes, due to a higher degree of customized processes (electrical industry) or a higher share of rather small firms (manufacturers of metals or metal products).

Analysis of the impact of robotic systems on employment in the European Union
September 2014 35
49%
50%
44%
39%
38%
34%
34%
32%
29%
21%
16%
46%
45%
38%
37%
35%
31%
29%
28%
25%
20%
12%
0% 100%
Rubber / plastic products (25)
Transport equipment (34 35)
Electrical industry (30-32)
Metal products (27 28)
Other products n.e.c.
Chemical products (24)
Optical etc. (33)
Food / beverages (15 16)
Machinery (29)
Paper/publishing etc. (21 22)
Textile etc. (17 18 19 )
Share of f irms
Source: European Manufacturing Survey 2009, 7 countries. Fraunhofer ISI
unweighted data weighted data
* Note: sector classif icat ion based on NACE Rev. 1.1
Figure 3-2: Shares of firms using industrial robots, by industries.
The chemical industry, manufacturers of optical and precision instruments and the food industry show comparable rates of companies which use robots ranging from 28 to 31%. Here, the chemical and food industries use more process engineering technologies than other industries for large parts of their bulk goods, and robot-based automation technologies come only into play for their piece goods processes, if any. This might be a reason for the moderate use rates of industrial robots in these two industries, despite of their capital-intensive production processes. In the case of optical and precision instruments the higher amount of customized processes and labour-based assembly tasks, the moderate level of robot diffusion seems plausible considering the small and medium-sized batch sizes and company sizes. A similar explanation, customized processes needing highly qualified labour for the assembly of the high-tech equipment, holds true for the even lower rate of 25% of companies in the machinery sector which use robots. The paper and printing industry often lacks potentials of utilizing robots due to their lack of packaging good processes, whereas the textile and leather industry uses different production technologies and is still in need of a high amount of manual activities, making automation too expensive and paving the way for very extensive off-shoring activities towards low-cost countries in these sectors.

Analysis of the impact of robotic systems on employment in the European Union
September 2014 36
Table 3-1: Operational stocks of industrial robots by manufacturing sectors in the seven selected countries in 2009.
Total no. of industrial robot applications 2009 Industry (NACE Rev. 2)
AT DK F D NL E CH Countries'
total % of
total D
Food and beverages (10-12) 53 444 1,984 5,083 328 1,765 271 9,928 4.8%
Textiles (13-15) 1 97 58 169 0 112 8 445 0.2%
Wood and furniture (16) 30 341 123 2,662 9 411 32 3,608 1.7%
Paper (17-18) 8 34 206 663 13 41 9 974 0.5%
Chemical products (19-21) 68 308 1,972 8,229 29 1,198 97 11,901 5.8%
Rubber and plastic products (22) 775 257 2,026 8,495 466 1,484 432 13,935 6.8%
Glass, ceramics, etc. (23) 23 102 634 2,691 61 599 8 4,118 2.0%
Metal industries (24 25 28) 907 1,652 3,814 17,308 963 3,689 774 29,107 14.1%
Electrical/electronics (26-27) 150 388 868 7,618 126 440 155 9,745 4.7%
Automotive (29) 1,073 108 20,335 76,970 338 16,882 264 115,970 56.2%
Other vehicles (30) 26 9 375 522 46 236 9 1,223 0.6%
Other manuf. sectors (31-33) 68 67 360 3,969 17 659 99 5,239 2.5%
D – Manufacturing 3,182 3,807 32,755 134,379 2,396 27,516 2,158 206,193 100.0%Source: Data based on WORLD ROBOTICS 2012 - 06th August 2014 (IFR 2013d). Own calculations The IFR 2013d data on operational stocks of industrial robots in the seven selected countries in 2009 show a much larger concentration of robot installations in specific manufacturing industries (Table 3-1). According to that data, the lion’s share of industrial robots was installed by the automotive industry, which accounts for 56% of all industrial robot stocks in the manufacturing industry alone. This dominant position is plausible considering the fact that the large players in this sector are able to run very large volumes and batch sizes in their efficiency-driven and highly automated production processes. We can conclude: There might be “only” 45% of robot users (i.e. firms using at least one robot) in automotive industry. However, in particular the large multinational OEMs and first-tier suppliers in this sector have a large installed base of industrial robots within their factories. A clear second rank in industrial robot installations goes to the metal and metal parts industry which accounts for 14% of operational stocks in the manufacturing industry. Ranks three and four and go to the manufacturers of rubber and plastics products with 7% and the chemical industry with 6% of industrial robot stocks in total manufacturing. These positions fit nicely with the above average user rates of companies using industrial robots reported above, complemented with the fact that the chemical industry is also characterized by large multinational players which account for a decent amount of the reported robot installations. Food and beverages and electrical and electronics industry follow on ranks five and six with 5% each of all industrial robot stocks in manufacturing industry. The rank of the electrical and electronics industry could be explained by the high rate of companies using industrial robots in the sector reported above, for the food and beverages industry the argument of some large global players holds again. All other industries show rather negligible shares of industrial robot stocks in total manufacturing.
3.1.3 Robot utilisation by country The analysis of robot utilisation in the seven selected countries (Figure 3-3) shows that industrial companies in Spain and Denmark most frequently use industrial robots

Analysis of the impact of robotic systems on employment in the European Union
September 2014 37
and their production processes. According to the weighted value 48% of the Spanish firms and 44% of the Danish firms used robots in their factories in 2009. France and Switzerland followed in third and fourth place of robot utilisation with almost equal levels of 35% and 34% respectively. Rank five and six were reported by Germany and Austria with 29% and 27% of firms using industrial robots in their countries. The seventh and last place of our ranking was held by the Netherlands, which reported 23% of domestic firms using industrial robots. Again, the comparison of the results based on weighted as well as unweighted data shows no major differences. As can be seen, the differences between the first and the last countries in the robot utilisation are quite remarkable. The quota of firms using robots in Spain is more than double of the subsequent value in the Netherlands. These differences cannot be simply linked to the wage levels in the different countries as a factor of pressure to substitute labour by capital. Countries with a comparatively low wage level like Spain show a significantly higher quota of firms using robots than countries with a relatively high wage level like Switzerland, Germany or the Netherlands.
55%
46%
41%
39%
32%
31%
23%
48%
44%
35%
34%
29%
27%
23%
0% 100%
Spain
Denmark
France
Switzerland
Germany
Austria
Netherlands
Share of f irms
Source: European Manufacturing Survey 2009, 7 countries. Fraunhofer ISI
unweighted data weighted data
Figure 3-3: Shares of firms using industrial robots, by countries.
These differences can not be sufficiently explained by differences in the size structure of the companies in the different countries: Spain in comparison to the other countries has the highest share of small firms with less than 50 employees and the lowest share of large firms with 250 and more employees. Taking into account the clear pattern of higher user rates of industrial robots in larger firms as reported, the share of firms with a high propensity of using robot technology are relatively low in Spain. Vice versa, according to size structures, Germany with the lowest share of small companies and the largest share of medium sized firms has the highest number of firms with a high propensity of using robots. Neither can the sectoral differences in the selected countries fully explain the different robot utilisation levels in the selected countries. There are some significant patterns like the higher shares of machinery or electrical and electronic companies and a relatively low share of food and beverage producers in Germany compared to highest

Analysis of the impact of robotic systems on employment in the European Union
September 2014 38
share of consumer products and the lowest share of machinery companies in Spain. However, these sector patterns are not sufficient to understand the clearly different robot use rates in the selected countries when having the average user rates by industries in mind. Thus, at a first glance, the finding of a high share of robot users among manufacturing companies in Spain contradicts existing statistics on industrial robot utilisation which see Germany among the top level group ranked right after Japan and the U.S. However, it has to be carefully taken into account that the question deployed in the EMS survey does not target the number of robots used inside the firm (i.e. installed base), but the number of firms that make use of – at least one – industrial robot (i.e. industry diffusion). Hence, the findings reveal that industrial robot usage in Spain spreads among a comparably high number of firms, while in Germany robots are utilized by a comparably lower number of companies. Thus, in Spain the number of firms using industrial robots measured against the total number of firms located in Spain is higher than in Germany whereas the total number of robots used as well as the average number of robots used per firm is a much higher in Germany. As a result in Germany the percentage of firms using industrial robots is quite low but those who utilize robots utilize them in high quantities.7
3.1.4 Intra-firm degree of robot utilisation Overall, there seem to be some country-specific factors which account for a decent part of the different shares of companies using industrial robots. These might lead to different company behaviour, e.g. that in some countries companies are eager to try out industrial robots even restricted to pilot areas, whereas in other countries a clear economic rational dominates the decision to invest in industrial robots for a broader potential of use. One indicator that can help to uncover such behaviour is the “extent of actual utilized potential” of industrial robots in the respective factory, rated as “low” for an initial attempt to utilize, “medium” for partly utilized and “high” for extensive utilisation. The resulting picture of the shares of companies with intensive use of industrial robots by the selected countries (Figure 3-4) shows relatively slight differences compared to the results of overall robot using companies in the respective countries. When taking into account the extent of actual utilized potential Spain still holds rank number one with a share of 26% of firms using industrial robots intensively in their factories. The gap to the second position has become even larger, as Spain also shows the highest ratio of intensive users of industrial robots compared to all robot users with 54%. France and Denmark again follow on ranks two and three with 15% intensive robot users each. France caught up with Denmark in this ranking showing 15 % firms intensively using robots due to its higher ratio of intensive robot users compared to overall robot users (43% to 33%). Switzerland holds rank four as it did in the overall robot utilisation ranking. Austria gained one position and overtook Germany thanks to its high rate of intensive robot users compared to overall robot users of 47%. Germany and the Netherlands show the lowest rate of companies using industrial robots intensively in their factories with 9% each, whereby Germany shows one of the lowest share of firms intensively using robots.
7 A table on the distribution of industrial robots on firms in Spain and Germany is displayed in the appendix, TableAnnex 6.

Analysis of the impact of robotic systems on employment in the European Union
September 2014 39
26%
15%
15%
14%
9%
13%
9%
54%
35%
45%
41%
33%
48%
42%
0% 100%
Spain
Denmark
France
Switzerland
Germany
Austria
Netherlands
Share of firms
Source: European Manufacturing Survey 2009, 7 countries. Fraunhofer ISI. Weighted.
Intensive users in % of all companiesIntensive users in % of all robot users
Figure 3-4: Shares of firms with intensive use of industrial robots, by countries, weighted data.
Overall, by taking into account the extent of the utilized potential of using industrial robots in the surveyed companies, the gaps in robot utilisation rates between the selected countries even widened, with Spain showing a weighted value that is three times as high (26 %) as the comparable values of Germany and the Netherlands (9 %). Therefore, national or cultural factors leading to differences in the willingness to try out robots only in pilot areas or to invest in particular when potentials can be utilized rather broadly or to perceive unused potential, did not narrow or significantly change positions in the above reported country differences in robot use per company. However, the dissemination of industrial robot use will be viewed quite differently depending on discussing the question whether (at least one) robot is used in production or when discussing whether the full potential of robot applications is used. In comparison to the preceding analyses of robot use which refers to the number of firms who apply robots, data of World Robotics allow a view of the total amount of robots used within a country without referring to the number of companies. IFR 2013d reports the operational stocks of industrial robots (Table 3-2). In operational stocks Germany shows by far the highest value of industrial robots installed in manufacturing sectors until 2009 with more than 134,000 units, more than four times the value of France following in second place with almost 33,000 units. Spain ranks third with almost 28,000 units installed, more than seven times the value of Denmark following in fourth place with 3,800 operational robot stocks. Taking the number of manufacturing sites into account, the picture remains quite the same. Germany still shows the highest average number of 2.93 installed robots per company. France, Denmark and Spain follow with average values of 1.2 to 1.4 operational robot stocks per firm, whereas Austria, the Netherlands and Switzerland here show values less than 1.0. The prominent result of Germany might be explained by the dominance of the large German automotive OEMs and first tier suppliers in the

Analysis of the impact of robotic systems on employment in the European Union
September 2014 40
surveyed subject, which still account for the lion’s share of operational stocks of industrial robots.
Table 3-2: Operational stocks of industrial robots in manufacturing and number of production sites in the seven selected countries in 2009; data and own calculations based on IFR 2013d and Eurostat data.
Country # firms
in 2007/2008 (1)
# of robot installations in
manufacturing in 2009 (2)
Robots per company (3)
Austria 4,548 3,182 0.70
Denmark 3,222 3,807 1.18
France 22,506 32,755 1.46
Germany 45,863 134,379 2.93
The Netherlands 6,010 2,396 0.40
Spain 22,276 27,516 1.24
Switzerland 5,270 2,158 0.41 Note: (1) Number of manufacturing sites: AT NL in 2007, DK, F, D, E, CH in 2008 according to national statistics. (2) based on IRF data. (3) own calculation.
3.2 Descriptive analysis of relocation of manufacturing activities to countries outside Europe
In the following, the share of companies that relocated parts of their manufacturing activities outside their home country, and in particular outside European borders, will be analyzed by the size of the firms, the industrial sectors and the seven selected countries of this study. As there are huge differences in the frequency of relocation considering offshoring abroad in general and offshoring outside the EU or Switzerland, both shares are considered in these descriptive analyses.
3.2.1 Relocation of manufacturing activities by firm size As expected and well known from literature, the size of the company is positively related to the probability of production relocation to foreign countries and outside Europe. Large companies are significantly more often multinational companies, have more plants and more often have already gathered experiences with cross border production and relocation activities (e.g. Dunning, 1980, 1988; Pennings and Sleuwaegen, 2000; Rugman and Hodgetts, 2000). They have also better financial and personnel capacities to plan, finance and absorb the costs of the relocation investment (Caves, 1982; Fillis, 2001; Pennings and Sleuwaegen, 2000). According to the weighted values displayed in Figure 3-5, the analyses show that large firms with 1000 and more employees are clearly the most active in production relocation activities to foreign countries (51% of all companies of that size class) as well as to countries outside Europe (17%). Companies with 250 to 999 employees are also relocating production activities more frequently than the overall average abroad (29%) or outside Europe (10%). Companies with 50 to 249 employees represent with their share of firms offshoring production abroad or outside Europe (15% resp. 4%) very well the overall average of firms active in these offshoring activities (13% resp. 4%). Small companies with between 20 and 49 employees show relocation quotas which are further below these average values with 9% and 2%, respectively.
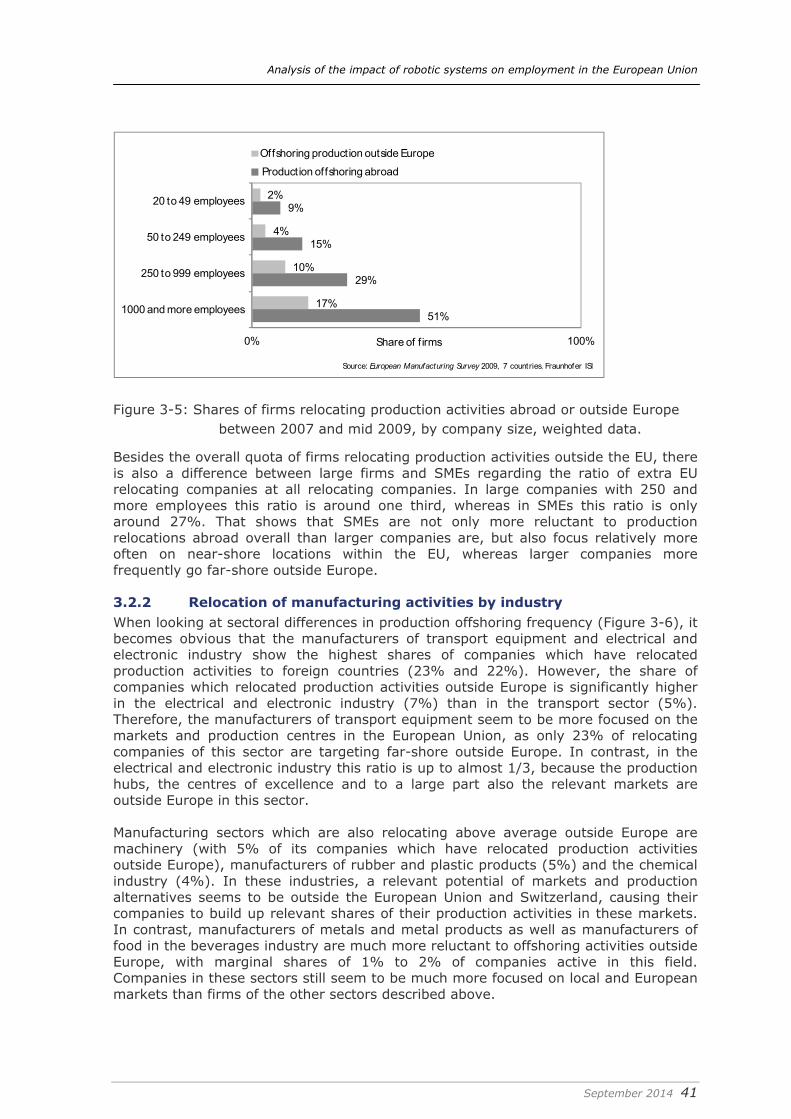
Analysis of the impact of robotic systems on employment in the European Union
September 2014 41
2%
4%
10%
17%
9%
15%
29%
51%
0% 100%
20 to 49 employees
50 to 249 employees
250 to 999 employees
1000 and more employees
Share of f irms
Source: European Manufacturing Survey 2009, 7 countries. Fraunhofer ISI
Offshoring production outside Europe
Production offshoring abroad
Figure 3-5: Shares of firms relocating production activities abroad or outside Europe between 2007 and mid 2009, by company size, weighted data.
Besides the overall quota of firms relocating production activities outside the EU, there is also a difference between large firms and SMEs regarding the ratio of extra EU relocating companies at all relocating companies. In large companies with 250 and more employees this ratio is around one third, whereas in SMEs this ratio is only around 27%. That shows that SMEs are not only more reluctant to production relocations abroad overall than larger companies are, but also focus relatively more often on near-shore locations within the EU, whereas larger companies more frequently go far-shore outside Europe.
3.2.2 Relocation of manufacturing activities by industry When looking at sectoral differences in production offshoring frequency (Figure 3-6), it becomes obvious that the manufacturers of transport equipment and electrical and electronic industry show the highest shares of companies which have relocated production activities to foreign countries (23% and 22%). However, the share of companies which relocated production activities outside Europe is significantly higher in the electrical and electronic industry (7%) than in the transport sector (5%). Therefore, the manufacturers of transport equipment seem to be more focused on the markets and production centres in the European Union, as only 23% of relocating companies of this sector are targeting far-shore outside Europe. In contrast, in the electrical and electronic industry this ratio is up to almost 1/3, because the production hubs, the centres of excellence and to a large part also the relevant markets are outside Europe in this sector. Manufacturing sectors which are also relocating above average outside Europe are machinery (with 5% of its companies which have relocated production activities outside Europe), manufacturers of rubber and plastic products (5%) and the chemical industry (4%). In these industries, a relevant potential of markets and production alternatives seems to be outside the European Union and Switzerland, causing their companies to build up relevant shares of their production activities in these markets. In contrast, manufacturers of metals and metal products as well as manufacturers of food in the beverages industry are much more reluctant to offshoring activities outside Europe, with marginal shares of 1% to 2% of companies active in this field. Companies in these sectors still seem to be much more focused on local and European markets than firms of the other sectors described above.

Analysis of the impact of robotic systems on employment in the European Union
September 2014 42
7%
5%
5%
5%
4%
4%
2%
1%
22%
16%
23%
17%
16%
11%
10%
6%
0% 100%
Electrical / electronic etc. (30-33)
Machinery (29)
Transport equipment (34 35)
Rubber/plastic products (25)
Chemical products (24)
Other products n.e.c.
Metal products (27 28)
Food / beverages (15 16)
Share of f irms
Source: European Manufacturing Survey 2009, 7 countries. Fraunhofer ISI
Offshoring production outside Europe
Production offshoring abroad
Figure 3-6: Shares of firms relocating production activities abroad or outside Europe, by manufacturing industries, weighted data.
3.2.3 Relocation of manufacturing activities by country When looking at different countries8, it becomes obvious that countries do not only differ in the amount of offshoring firms but differ also considerably in the destination regions of relocation activities. According to the results displayed in Figure 3-7, Spain has at 10% the highest share of companies which have relocated production activities to countries outside Europe. Compared to the overall 17% of Spanish firms that have relocated production activities to foreign countries, this corresponds to a remarkable ratio of almost 60%. In all other countries this ratio is significantly lower, with Denmark following in second place at 38%, relating the 9% of companies that have offshored production activities outside Europe to the 24% of companies that have overall offshored abroad. The Netherlands follow in third place with 5% of companies that have relocated production activities to countries outside Europe, followed by Switzerland and Germany with 3% each. One difference between these countries is that German companies relocate significantly less frequently production abroad overall (9%), resulting in a higher ratio of 30% extra EU relocating companies to all relocating companies, which is clearly lower in the Netherlands and Switzerland (23% and 20%). Austria shows by far the lowest level of firms offshoring production activities to countries outside Europe (1.5%) as well as in relation to all offshoring companies of the country (13%). Overall, firms from Spain and Denmark are by far the most active in relocating production outside Europe, targeting the production and market potentials of these far-shore locations more intensively than the other countries during
8 France is not part of the analysis of relocation activities to foreign countries, as the corresponding questions where not implemented and surveyed by the French EMS partner.

Analysis of the impact of robotic systems on employment in the European Union
September 2014 43
the observed period. German companies are clearly more reluctant to offshoring activities overall – but if they become active, then they are targeting their activities more frequently to markets outside Europe. Austrian companies seem to be the most reluctant regarding relocation of production outside Europe, as they seem to be culturally and historically more closely bound to countries within the EU, in particular to the new Eastern and Central European member states.
10%
9%
5%
3%
3%
2%
17%
24%
22%
14%
9%
13%
0% 100%
Spain
Denmark
Netherlands
Switzerland
Germany
Austria
Share of f irms
Source: European Manufacturing Survey 2009, 7 countries. Fraunhofer ISI
Offshoring production outside Europe
Production offshoring abroad
Figure 3-7: Shares of firms relocating production activities abroad or outside Europe, by manufacturing industries.
To fully understand the different relocation patterns in the selected countries, country differences in manufacturing traditions and internationalization business cycles need also to be taken into account. For example, Spanish firms were very active in relocating manufacturing activities outside Europe in the years from 2007 to mid 2009, as wages in Spain gradually increased in the years before due to the dynamic economic development. As a result, they are in a later relocation cycle than German firms, which were much more active in globalizating and relocating manufacturing activities in earlier times. A long-term analysis shows interesting patterns in the development of relocation activities in the German manufacturing industry (Figure 3-8). At the end of the 90s, more than one quarter of German manufacturing companies were active – also in a two year timeframe – in relocating production activities abroad. In the years 2002 to 2003, when the German manufacturing industry clearly saw the EU Eastern enlargement, this level was almost reached again before the rapid decline to the low level in mid-2009 started to emerge. Additionally, the high level of manufacturing relocation activities in Denmark might be explained by a different culture and tradition of the domestic manufacturing industry, compared e.g. to Germany. In Denmark – as well as partly in the Netherlands – a stronger focus was put on the development of the service sector and on the concentration on high-value added activities in the manufacturing sectors, leading to a higher amount of “de-industrialization” of traditional manufacturing activities in industries than in Germany. Here, the manufacturing sector and the strong

Analysis of the impact of robotic systems on employment in the European Union
September 2014 44
manufacturing tradition are much more important for the overall competitiveness of the country.
17%
26%
27%
19%
25%
19%12%
11%
4%6% 6%
4% 3%3%
2%
15%
9% 8%
2% 3% 2%
Shar
e of
com
pani
es (%
)
Source: European Manufacturing Survey 2012, Fraunhofer ISI
Verlagerung in den zweiJahren vor .... realisiert
Rückverlagerung in den zwei Jahren vor .... realisiert
Metal and electrical industry
VG
Backshoring in the two years before ...
Whole manufacturing industry
30%
20%
10%
0%
Relocation in the two years before ...
1995 1997 1999 2001 2003 2006 2009 2012(n= 1.035) (n= 1.329) (n=1.442) (n=1.258) (n=1.134) (n=1.011, (n=817, (n=820,
n=1.663) n=1.484) n=1.594)
Figure 3-8: Relocation and backshoring activities of the German manufacturing industry over time
3.3 Determinants of robot utilisation in manufacturing companies
To conclusively explain the use of robots in industrial application, a descriptive analysis is not enough. It is evident that not all companies possess the preconditions that a large amount of their production processes can be reasonably improved by the introduction of industrial robot systems. So far, robot systems might be mostly used by large companies with high-volume and large batch production processes, innovative production technologies, strong international competition and sufficiently qualified workers which are able to run and maintain advanced robot systems (Armbruster et al., 2006). Therefore it is necessary to check for these and other possible factors explaining the use of robots and industrial companies, as a comparison of the utilisation of robot systems and their effects on employment over different sectors and countries would lead to misleading results if these enabling factors were neglected. Within this section, potential factors explaining the use of robot systems will be identified with the use of logistic regression model. Table 3-3 displays the summary results of regression estimation displaying the improvement of the model fit for each construct included in the model. The change in the log-likelihood indicator as well the significance level is reported. In the appendix in TableAnnex 7, the regression coefficient and the corresponding significance levels are given in detail. The model is

Analysis of the impact of robotic systems on employment in the European Union
September 2014 45
statistically significant (-2LL = 2463.4) and shows a Cox & Snell R2 of 0.160 resp. a Nagelkerkes R2 of 0.218, which is quite satisfactory.
Table 3-3: Model summary of the logistic regression of firm-level determinants of the probability to use industrial robots
Construct Δ 2log-
likelihood Sig. Country -46.172 ***
Firm size -145.847 ***
Sector -42.331 ***
Batch size -56.645 ***
Complexity -7.035 **
Type of production -1.847 n.s.
Strategy -0.028 n.s
Export -4.628 *
Skill level -2.696 n.s.
Model fit
-2 Log-Likelihood / Significance 2463.41 ***
Number of cases in model 2,160 Logistic regression. Estimated change in model fit for each explanatory construct. Significance level: *** p< 0.001, ** p< 0.05, * p<0.1, n.s. p> 0.1 According to the test of the explanatory power of the main determinants, firm size and production characteristics as sectors, batch size and product complexity are relevant for determining the probability of the use of industrial robots in a firm. Besides, significant differences between countries remain. In more detail, the following independent factors seem to be relevant factors for explaining robot utilisation on the firm level in the selected countries: The country dummies for Spain, Denmark and Switzerland are highly significant and relevant factors to explain the share of companies using industrial robots in the selected sample of the European manufacturing industry. This underlines the results of the descriptive analysis, where these three countries showed above average user rates of industrial robots in manufacturing9. The size of the company, measured as the logarithm of the number of employees, is a strong predictor for the probability of the company using industrial robots in manufacturing. Larger companies have more experience with the introduction of advanced production technologies and more possibilities and higher economies of scale to make efficient use of industrial robot systems. Industrial sectors as dummy variables are also a relevant factor to explain the use of industrial robots in the manufacturing industry. When controlling for company size, batch size and product complexity in parallel, in particular the manufacturers of rubber and plastic products and manufacturers of metals and metal products 9 France also displayed an above-average user rate of industrial robots in their manufacturing industry, but French data is not part of this logistic analysis, as some key variables have not been asked in the French EMS survey.
Analysis of the impact of robotic systems on employment in the European Union
September 2014 46
show a significantly higher probability of making use of industrial robots than other manufacturing industries. This underlines the empirical findings, where these two sectors were number one and four in robot utilisation, whereas the relevance of the sectors in position two and three, manufacturers of transport equipment and the electrical industry, seems to be mitigated by company size and other specific characteristics of their production processes controlled for in this logistic analysis. Batch size of production is another important factor for explaining the use of industrial robots in the manufacturing industry. Companies running large batch sizes or even medium to small batches display a significantly higher propensity to use industrial robots than companies that perform single unit production activities. Economies of scale are easier to realize under the frame conditions of large batch size production, enabling productivity growth through rationalising repetitive tasks (Broedner et al., 2009; Klette, 1999). Product complexity also serves as a significant explanatory factor for the use of industrial robots in manufacturing. Companies producing medium-complex products have a higher need and more potential for automating their production processes than companies producing simple products, as the higher complexity and amount of parts allows for more handling and assembly tasks to be automated. In the case of complex products, the prefix is also positive, but not statistically significant. Two variables to control for the export behaviour of the company have been included in the logistic model. It appears that companies which are active in the export business show a higher probability of using industrial robots in manufacturing than companies that do not export at all. This might be due to the fact that companies which are facing international competition in foreign markets are under higher pressure to improve the productivity of their production processes via industrial robot systems than companies which are solely supplying their home markets. The magnitude of the export quota itself, measured as the share of turnover in foreign markets, does not display a significant correlation to the probability of robot use. International competition seems to come into play if a company is exporting, regardless of its actual export intensity.
3.4 Effect of robot utilisation on manufacturing relocation activities
In this section the impact of robot utilisation on production relocation activities is analyzed while taking other major influencing factors into account because other confounding factors have to be controlled for to determine the proper impact and the explanatory power of robot utilisation. Thus, the probability of a firm to relocate production activities outside Europe has been modelled using a logistic regression. Among other explaining constructs the impact of robot use was tested. On the one hand, an indicator of robot use (compared to no use of industrial robots) has been included. On the other hand, an indicator of intensive robot utilisation (compared to no or only partial use of industrial robots) is used. Table 3-4 displays the summary results of both logistic regression estimations displaying the improvement in the model fit for each construct included in the model. The change of the log-likelihood indicator as well the significance level is reported. The regression coefficients and the corresponding significance levels are given in detail in the appendix (TableAnnex 8). Both models are statistically significant (-2LL = 619.1 and 608.1) and show a Cox & Snell R2 of 0.070 and 0.072 and a Nagelkerkes R2 of 0.218 and 0.224, which is quite satisfactory.

Analysis of the impact of robotic systems on employment in the European Union
September 2014 47
According to the test of the explanatory power, relocation of manufacturing activites outside of Europe is mainly determined by firm size, country, export orientation and sector. Additionally, batch size and robot use play a relevant role in the model. The country dummies for Spain and Denmark are highly significant and relevant factors in the selected sample of the European manufacturing industry10 to explain the share of companies relocating manufacturing activities outside Europe. This underlines the results of the descriptive analysis, where these two countries have clearly shown the highest share of firms which have relocated manufacturing activities outside the borders of the EU. Here, the country differences in manufacturing traditions and internationalization business cycles as described in the descriptive section above might play an important role.
Table 3-4: Model summaries of the logistic regressions of firm-level determinants of the relocation of manufacturing activities outside Europe.
Model: Robot use Model: Iintensive use
Construct Δ 2log-
likelihood Sig. Δ 2log-
likelihood Sig. Country -30.989 *** -31.135 ***
Firm size -36.990 *** -34.973 ***
Sector -15,835 ** -17.344 **
Batch size -8.141 ** -7.917 **
Complexity -1.526 n.s. -1.764 n.s.
Type of production -1.046 n.s. -0.976 n.s.
Strategy -0.760 n.s. -0.835 n.s.
Export -17.530 *** -18.835 ***
Skill level -1.212 n.s. -0.842 n.s.
R&D -0.650 n.s. -1.55 n.s.
Vertical range of manufacturing -0.242 n.s. -0.114 n.s.
Robot use -5.787 **
Intensive robto use -8.113 **
Model fit
-2 Log-Likelihood / Significance 619.1 *** 608.1 ***
Number of cases in model 1,972 1,949 Logistic regression. Estimated change in model fit for each explanatory construct. Significance level: *** p< 0.001, ** p< 0.05, * p<0.1, n.s. p> 0.1. The size of the company is again proxied by using the logarithm of the number of employees and is a strong predictor for the propensity of a company to relocate manufacturing activities outside Europe. Large companies are significantly more often multinational companies, have more plants and have more often already gathered experiences with cross-border production and relocation activities (e.g. Dunning, 1980, 1988; Pennings and Sleuwaegen, 2000; Rugman and Hodgetts, 2000). They have also better financial and personnel capacities to plan, finance and absorb the costs of the relocation investment (Caves, 1982; Fillis, 2001; Pennings and
10 French data is not part of this logistic analysis, as the French EMS survey has not asked the relocation of manufacturing activities to foreign countries.

Analysis of the impact of robotic systems on employment in the European Union
September 2014 48
Sleuwaegen, 2000). Another argument for a higher probability of manufacturing relocations are the higher economies of scale within the boundaries of large companies compared to small firms, given the reduced and sometimes sub-critical mass of the latter in certain production and auxiliary functions (Klette, 1999; Soederbom and Teal, 2001). The manufacturers of metals and metal products show a significantly higher chance to relocate manufacturing activities outside Europe, when controlling in parallel for company size, batch size and product complexity. This underlines the empirical findings, where this sector was the second least active in extra EU offshoring activities, and this position could not be explained by other significant factors in the logistic model, in particular batch size of production and export behaviour – in contrast to the food and beverages industry, which showed the lowest offshoring intensity and displays a negative prefix in the logistic model, but is not statistically significant. Batch size of production is significantly and negatively correlated to the propensity of a firm to relocate manufacturing activities outside Europe. If manufacturing companies are able to implement and run large batch sizes in their domestic production processes, they are more frequently able to implement advanced automation technologies in their production processes (see the logistic model on the use of industrial robots above). As a consequence, they are able to realize competitive economies of scale, which enable them to perform highly productive and profitable production processes even in high wage countries (e.g. Broedner et al., 2009; Klette, 1999). The logistic analyses also test for the export quota of the manufacturing companies, assuming and showing that export-intensive companies are more active in production relocation activities outside the borders of Europe. This is in line with theoretical expectations of experience- or learning-based stage models of international production (e.g. Camuffo et al., 2007; Johanson and Vahlne, 1977). It is predicted that companies internationalise like “rings in water” (O’Grady and Lane, 1996; Nordström and Vahlne, 1994; Johanson and Vahlne, 1990). They start with export activities in culturally and physically “close” countries whose traditions and history appear known, before serving and later investing in more “distant” markets. Additionally, companies which are facing international competition in foreign markets have a superior need to exploit further efficiency and productivity potentials (Bernard, 2004; Broedner et al., 2009; Sourafel et al., 2004; Wagner, 2002), leading to more frequent relocation decisions in these companies. Finally, the use of industrial robots in manufacturing operations and the intensity of robot utilisation in manufacturing firms is a statistically highly significant and relevant predictor for the propensity of firms to relocate manufacturing activities to countries outside of Europe. The prefix of both dummy variables is negative, meaning that companies that use or intensively use industrial robots in their production processes relocate parts of their manufacturing activities less frequently outside the borders of the EU and Switzerland than companies that do not make use of industrial robots in manufacturing. It seems that users of industrial robots are more frequently able to realize higher economies of scale than non-users of robots, which enable the former to perform highly productive and profitable production processes even in high wage countries (e.g. Broedner et al., 2009; Klette, 1999). While both variables show a clear statistical significance level below 5%, the odds ratio of 0.312 for the “intensive use of industrial robots within a company” is almost double as high as for the mere “use of industrial robots within a company” with 0.542. However, taking into account the simultaneous positive effect of large batch sizes, the negative impact of robot use on firms’ propensity to relocate is likely to hold only for cost-driven relocation. In this

Analysis of the impact of robotic systems on employment in the European Union
September 2014 49
case, robot usage seems to be an advantageous strategy compared to cost-driven relocation for companies (see below). In case of market-driven relocation, that means that firms want to be close to their (future) markets abroad to adapt and develop new products for these markets, robot usage should not be expected to have any impact, as the relocation is not driven by cost-reducing or efficiency-increasing goals, but by geographical proximity to the new market. Moreover, the usage of robots could also be a way for firms to deepen their vertical range of manufacturing, which itself also shows a negative (but not significant) effect on the relocation propensity, by insourcing labor cost intensive or hazardous tasks that have been previously outsourced to external partners.
0,0%
20,0%
20 to 49 employees
50 to 99 employees
100 to 249 employees
250 to 499 employees
500 to 999 employees
1000 and more
employees
Estim
ated
pro
babi
lity
for r
eloc
atin
g pr
oduc
tion
Source: European Manufacturing Survey 2009, 7 countries. Fraunhofer ISI
Model 2: No or no intensive use of robots
Model 2: Intensive use of robots
0,0%
20,0%
Estim
ated
pro
babi
lity
for r
eloc
atin
g pr
oduc
tion
Model 1: No robot useModel 1: Robot use in general
Figure 3-9: Adjusted predictions of the probability to relocate outside Europe by “typical” firms of different sizes and degrees of robot use
As an illustration of the regression results the adjusted predictions of the probability to relocate outside Europe were calculated for a “typical” firm (cf. TableAnnex 9), situated in Germany, active in machinery, producing at medium batch size and medium product complexity, made to order and acting at an average level in export (Figure 3-9). Both models (see above) were used to estimate the predictions for six different firm size groups, holding any other factor on their typical or mean values. Looking at the figure, it first becomes obvious that firms which use robots intensively
Probability drops by 1% points
Probability drops by 9% points
Probability drops by 7% points
Probability drops by 1% points

Analysis of the impact of robotic systems on employment in the European Union
September 2014 50
have a drastically smaller probability to relocate outside Europe than firms using no robots or using them less intensely. Second, the figure highlights that the effect of robot use resp. intensive robot use differs greatly by firm size. The probability to relocate for small firms almost equals zero. With an increasing number of employees the adjusted prediction of relocation rises increasingly steeper. Interpreted strictly, the model predicts a reduction of the probability to relocate production outside Europe when using robots intensively by 9% points for large firms with more than 1,000 employees or when using robots instead of not using them by 7% points. The marginal effect for small firms is around 1% and for medium sized around 2%. Accordingly, the effect of robot use respective intensive robot use on relocation for different countries can be calculated, setting the variables on values for “typical” firms of each country and applying country specific mean values (median) of share of employees, unskilled workforce, vertical range of manufacturing and export quota. Thus, the predicted probability to relocate outside Europe for Spanish firms which do not use industrial robots is on average around 16% compared to 9% for those which use robots and to 4.7% for those which use robots intensively. In contrast, the predicted probability to relocate when not using robots lies for a typical Austrian firm at 1.7% whereas this probability drops to 0.5% when using robots intensively (cf. TableAnnex 10). Even if these predicted probabilities are quite different, the relative change for each country is nearly the same. E.g., the change of the predicted probability of relocating manufacturing drops by 41% for Spanish firms when introducing the utilisation of industrial robots, and by 45% for Austrian firms. Based on the presented results, it is possible to extrapolate the total number of manufacturing companies with 20 and more employees in the selected EU countries as well as in all 27 EU member states that show the potential to avoid cost-driven extra-EU relocations through robot use. Using the predicted relative change in the probability to relocate as presented above, we can estimate the number of firms which would not relocate if they changed their utilisation of industrial robots: If a company introduces industrial robots into manufacturing, it is 43% less likely to relocate manufacturing activities than a company not using robots. If a company already uses industrial robots and starts using them intensively in its manufacturing processes – then its relocation probability decreases by (further) 33%. If we assume further that all companies have the same country specific probabilities to use industrial robots or make intensive use of them in their manufacturing operations and that the share of these selected EU countries can be taken as the average share of EU27, then the following figure results when extrapolating these correlations to the total number of manufacturing companies with 20 and more employees in the selected EU countries and in all 27 EU member states: Taking into account the relocation quotas of the selected EU countries (AT, DK, GER, NL, ES) given in the descriptive section above, around 4,000 companies from these countries relocated parts of their manufacturing activities to other countries outside Europe between 2007 and mid-2009. Consequently, of the 4,000 relocating companies, around 1,040 have the potential to avoid cost-driven extra-EU relocation by using industrial robots in their manufacturing operations, which they have not done so far. A further 432 companies have the potential to avoid cost-driven extra-EU relocation by exploiting the full productivity potential of an intensive use of industrial robots in their manufacturing operations instead of only using robots in pilot projects or to a lesser degree.
Analysis of the impact of robotic systems on employment in the European Union
September 2014 51
Extrapolated to the total number of 234,000 manufacturing companies with 20 and more employees in the EU 27 countries, and presuming the medium share of 5.5% of extra EU relocating companies for the whole EU 2711, this sums up to a potential of around 3,277 companies avoiding extra EU relocations by making use of industrial robots and around further 1,211 companies avoiding extra EU relocations by making use of the full productivity potential of an intensive use of their industrial robots in their manufacturing operations. In relation to the overall 234,000 manufacturing companies with 20 and more employees in the EU 27 countries these are quite impressive numbers, that show the potential of an intelligent use of industrial robots to be an economically viable alternative to extra EU relocation activities for realizing in-house productivity potentials and thus to safeguard manufacturing jobs in the European Union.
4 Analysing the effects of using robots Chapter 4 outlines the effects of robot use on overall productivity and employment in the European Union.
4.1 Effects of robot utilisation on productivity This section presents the results of regression models used to identify the main factors determining productivity in manufacturing companies. To monitor productivity, indicators of labour productivity and total factor productivity are used. Table 4-1 reports the results for the regression model (OLS) on companies’ labour productivity measured as the logarithm of value added per employee at firm level. The model is statistically significant and shows a corrected R2 of 0.198, which is quite satisfactory. The model explains almost 20% of the variance in companies' labour productivity. Besides the standardized regression coefficient and related significances, the explanatory power of the constructs is illustrated by the change of R2.12 To account for overall productivity effects, a second linear regression model is run with total factor productivity (TFP) as the dependent variable, measured as the logarithm of value added divided by the sum of labour cost and depreciation of machinery and equipment. This regression model is also statistically significant and shows a corrected R2 of 0.173 (Table 4-2), which is also quite satisfactory. Due to gaps in the considered variables, the number of observations was reduced to 1,592 cases that feature all the considered variables. According to the regression analyses, the following independent variables seem to be relevant factors to explain labour productivity and/or total factor productivity (TFP) at firm level in the selected countries: As expected and already shown by many earlier studies, the regression model shows a positive correlation between labour productivity and the size of the firm: Large companies are able to realize greater economies of scale within their boundaries than small firms given the latter’s reduced and sometimes sub-critical mass in certain production and auxiliary functions (e.g. Klette, 1999; Söderbom and Teal, 2001). This 11 As EMS 2009 data with information on firms’ behavior in 2008 has been analyzed, the extrapolation were based on the total number of companies in 2007/2008. 12 The dependent productivity indicators as well as the indicator on vertical range of manufacturing rely on information on inputs which is a major source for item-nonresponse. Therefore, a control for missing information on vertical range is not useful in these productivity models.

Analysis of the impact of robotic systems on employment in the European Union
September 2014 52
positive correlation also proves significant in the regression model for total factor productivity.
Table 4-1: Linear regression model of firm-level determinants of the logarithm of labour productivity
Construct Variables Coeff. Sig. Construct (Δ in R2/sig. )
Austria -0.040 0.115 Switzerland 0.149 0.000 *** Netherlands 0.074 0.005 **
Country (1)
Spain 0.044 0.091 *
2.6% ***
Firm size Ln. of number of employees 0.115 0.000 *** 1.0% *** Food, beverages, tobacco (15 16) 0.072 0.018 ** Chemical products (24) 0.138 0.000 *** Rubber/plastic products (25) -0.020 0.504 Metal products (27 28) -0.026 0.448 Electrical/electronic etc. (30-33) -0.053 0.103 Transport equipment (34 35) 0.002 0.932
Sector (2)
Other products n.e.c. -0.007 0.857
2.8% ***
Ln. of share of export 0.202 0.000 *** Export No export 0.063 0.082 *
1.9% ***
Vertical range Vertical range of manufacture 0.266 0.000 *** 6.4% *** Major competition on price 0.028 0.326 Strategy (3) Major competition on quality -0.029 0.303
0.2% n.s.
Firm age Ln. of age of firm 0.003 0.915 0.0% n.s. Ln. of share with new products 0.055 0.240 Product
innovation No product innovation 0.001 0.991 0.2% n.s.
Single unit production 0.022 0.432 Batch size (4) Large batch size 0.078 0.005 **
0.5% **
Type of production (5) Make-to-order -0.081 0.002 ** 0.6%
** Skill level Share of semiskilled or unskilled -0.080 0.005 ** 0.5% ** Intensive robot use(6) Intensive robot use
0.078 0.002 ** 0.6% **
Constant 0.000 ***
N 1,353 Model fit corr. R² / Sig. 0.198 0.000
Note: Dependent variable: Ln. of labour productivity. Model specification: linear regression. Significance level: *** p< 0.001, ** p< 0.05, * p<0.1, n.s. p> 0.1 Reference groups: (1) Germany, (2) machinery, (3) other prior competition factor, (4) single unit production, (5) assemble to order or make-to-stock, (6) no use or used to a lesser degree.

Analysis of the impact of robotic systems on employment in the European Union
September 2014 53
Table 4-2: Linear regression model of firm-level determinants of the logarithm of total factor productivity
Construct Variables Coeff. Sig. Construct (Δ in R2/sig. )
Austria -0.041 0.080 *
Switzerland -0.101 0.000 ***
Netherlands -0.007 0.756 Country (1)
Spain 0.033 0.157
1.2% ***
Firm size Ln. of number of employees 0.081 0.001 ** 0.5% **
Food, beverages, tobacco (15 16) 0.148 0.000 ***
Chemical products (24) 0.133 0.000 ***
Rubber/plastic products (25) 0.055 0.053 *
Metal products (27 28) 0.028 0.387
Electrical/electronic etc. (30-33) -0.006 0.832
Transport equipment (34 35) 0.027 0.280
Sector (2)
Other products n.e.c. 0.037 0.282
2.9% ***
Ln. of export 0.184 0.000 *** Export
No export 0.066 0.051 * 1.6% ***
Vertical range Vertical range of manufacture 0.367 0.000 *** 12.6% ***
Simple products 0.036 0.150 Complexity (3)
Complex products -0.010 0.691 0.1% n.s.
Single unit production 0.012 0.632 Batch size (4)
Large batch size 0.040 0.119 0.1% n.s.
Type of production (5) Make-to-order -0.039 0.119 0.1% n.s.
Intensive robto use (6) Intensive robot use 0.009 0.717 0.0% n.s.
Constant 0.003 **
N 1,591 Model fit
corr. R² / Sig. 0.173 0.000 Note: Dependent variable: Ln. of total factor productivity. Model specification: linear regression. Significance level: *** p< 0.001, ** p< 0.05, * p<0.1, n.s. p> 0.1 Reference groups: (1) Germany, (2) machinery, (3) simple products, (4) single unit production, (5) assemble to order or make-to-stock, (6) no use or used to a lesser degree. The regression model also shows that companies from Switzerland and the Netherlands show a significantly positive correlation to labour productivity when controlling for the whole set of included independent variables in parallel. This is in line with Eurostat statistics which report the labour productivity per employed person of the EU 28 and some additional countries as an index compared to the average of the EU 28 (EU 28 = 100). In the year 2008, on which the productivity data of the model are based, the Netherlands and Switzerland showed a significantly higher labour productivity index with 115.4 and 115.1, respectively, than the other included countries of Denmark, Germany and Spain with have values between 104 and 108. Austria also shows a significantly above average labour productivity index of 116.5, but in the calculated model this seems to be mitigated by other structural factors of the surveyed companies. In the calculated regression model for total factor

Analysis of the impact of robotic systems on employment in the European Union
September 2014 54
productivity, the positive correlations of the Swiss and Dutch dummy variables vanish and, in the case of Switzerland, even become negative. It seems that these countries make very efficient use of their labour force with their specific manufacturing traditions and sector specializations, but that these effects are rendered irrelevant when additionally controlling for the costs and efficiency of how they use capital investments. The manufacturers of food and beverages and the chemical industry show a significantly positive correlation to the dependent variable of labour productivity. These industrial sectors have very capital-intensive production processes with a very low share of labour costs in total costs. This results in superior labour productivity compared to the other sectors included. To control for the overall productivity advantage of these industries, the model for the total factor productivity of the selected companies has to be used. The results of this TFP regression model confirm the positive correlation of these two sector dummy variables to the dependent variable and thus the overall higher productivity of these two sectors compared to the rest of the manufacturing industry in the selected countries. In line with previous empirical studies, the regression model also shows that the export quota of the surveyed companies, i.e. the percentage of turnover generated on foreign markets, is positively correlated to labour productivity (see, e.g. Bernard, 2004; Broedner et al., 2009; Sourafel et al., 2004; Wagner, 2002). Exporting companies have to develop the capabilities to achieve the specific, locally expected quality and innovation level on foreign markets and, simultaneously, offer internationally competitive prices by realising adequate productivity potentials at their production sites. They do not operate in protected national niches, but have to face global competition on foreign markets, forcing them to exploit further efficiency and productivity potentials (e.g. Bernard, 2004; Sourafel et al., 2004; Wagner, 2002). This positive correlation also holds true for the TFP regression model, which indicates that exporting companies not only need higher labour productivity but higher overall productivity in order to be able to compete successfully on international markets. In both models, the labour productivity and the TFP regression model, the vertical range of manufacturing – measured as the depth of value-added (total turnover minus total inputs) in the total turnover of the company – shows the most significant positive correlation with the respective dependent variable. It seems that companies with higher vertical integration are able to control a higher share of the total value chain, clearly giving them more possibilities to exploit economies of scale and productivity gains within their manufacturing operations (Broedner et al., 2009). Research on the so-called hidden champions (Simon, 2012) has also shown that a higher level of vertical integration is one of the main characteristics of these companies, enabling them to operate with higher productivity than companies with a lower vertical integration level and a higher level of outsourcing. Overall, the strategic risks of competence and capability drains and increased transaction costs seem to outweigh the anticipated direct cost and efficiency potentials of outsourcing initiatives in the medium and long term (Broedner et al., 2009). The batch size of the companies’ production processes is also positively correlated to the labour productivity of the surveyed firms. Economies of scale are easier to realise under the frame conditions of large batch size production than in small and medium sized batches, enabling productivity growth by rationalising repetitive tasks (e.g. Klette, 1999; Söderbom and Teal, 2001). A similar argument can be used to explain why companies producing in a make-to-order and not make-to-stock mode show significantly below average labour productivity. These companies need to react flexibly to customer demands and thus are not as easily able to organize their manufacturing

Analysis of the impact of robotic systems on employment in the European Union
September 2014 55
processes along efficiency lines as stock producers can. Both significant correlations - batch size and make-to-order mode - vanish if the TFP regression model is taken into account. Large batches and stock production seem to be levers for optimizing the productivity of the workforce, but may also require additional capital investments which seem to compensate for these effects. The share of unskilled and semi-skilled workers shows a significantly negative correlation to labour productivity in the respective regression model. Despite its statistical significance, the effect is not really relevant as shown by the very low coefficient value of the factor. Neither focussing on highly qualified and skilled workers to improve the innovative capabilities of a firm, nor attempting to exploit cost advantages by employing unskilled and semi-skilled workers in simple, repetitive manufacturing and assembly tasks seem to prove successful per se if these strategies are not coherent to the frame conditions and strategic orientations of the respective company (e.g. Hill, 1993). Finally, companies that use industrial robots intensively in their manufacturing operations show a significantly higher labour productivity than companies that do not.13 It seems that intensive users of industrial robots are better at realizing efficient production processes due to shorter processing times, higher process quality and competitive economies of scale, which enable them to perform manufacturing operations with an above average labour productivity even in high wage countries (e.g. Klette, 1999). The comparative location advantages of high-wage countries in the EU are strongly dependent on the skills of qualified personnel to efficiently use and further optimise advanced capital-intensive production technologies such as industrial robots. However, the intensive use of industrial robots is not significantly correlated to total factor productivity in the TFP regression model. The prefix is also positive, but the correlation is not statistically significant. The intensive use of industrial robots seems to have the potential to improve the efficiency of the labour force in European manufacturing, but does not have positive overall effects on total factor productivity at the level of the surveyed companies due to the high investments needed for this advanced automation technology. Bearing this in mind, industrial robots might have the potential to improve the efficiency of manufacturing operations in the European Union and thus also to help to safeguard manufacturing operations within the EU.
4.2 Effects of robot utilisation on employment Several regression models were run to identify the main explanatory factors for employment trend in manufacturing companies (cf. TableAnnex 12 and TableAnnex 13). The dependent variable of employment trend indicates the difference in the number of employees in 2008 compared to 2006 calculated as a percentage of the change compared to 2006.
13 Another regression model, integrating the use of industrial robots instead of the intensive use of industrial robots as independent variable, while integrating all other variables described in the regression model above, displays very similar results. The main difference is that the use of industrial robots itself does not display a positive correlation to labour productivity, as the intensive use of industrial robots does. Thus, manufacturing companies seem to need to use industrial robots intensively and not only in pilot or restricted areas to be able to perform an above average labour productivity compared to companies which do not use industrial robots at all.

Analysis of the impact of robotic systems on employment in the European Union
September 2014 56
The following paragraphs discuss the analyses of positive employment growth. The dependent variable is measured as the logarithm of positive employment growth.14 The calculated multivariate regression model is statistically significant and shows a corrected R2 of 0.223 (Table 4-3), which is quite satisfactory. This model can therefore explain around 22% of the variance in the companies' employment growth. Due to gaps in the considered variables, the number of observations was reduced to 1,261 cases that feature all the considered variables. According to the regression analysis, the following independent variables seem to be relevant factors to explain the amount of positive employment growth at firm level in the selected countries: Swiss companies show a positive correlation to employment growth in the multivariate regression model. This positive correlation matches Eurostat data on employment in the manufacturing industry, which show an index value for Switzerland of 98.6 in 2006 and 104.8 in 2008 (index = 100 in 2010), corresponding to a 3.1% CAGR (Compound Annual Growth Rate) over this period (European Union, 2014b). In the same time frame, Germany had 2.0% CAGR of employment growth in manufacturing, Austria 1.6%, the Netherlands 0.8%, Spain -0.9%, France -1.7% and the total EU 27 reached 0.04% (data for Denmark are not available before 2008). The Eurostat data confirm the above average employment growth in Switzerland indicated by the statistical regression model. Manufacturers of transport equipment also show a positive correlation to employment growth in the multivariate regression model. Passenger car production in the EU grew dynamically by 1.3% in 2006 and 5.6% in 2007, resulting in a record output of over 17 million units produced in the EU in 2007 according to ACEA data. As a result, employment among manufacturers of transport equipment (motor vehicles, trailers and semi-trailers) in the EU 27 also increased by a CAGR of 0.24% from 2006 to 2008 according to Eurostat data, which is clearly above the 0.04% CAGR of the manufacturing industry as a whole reported above. As expected, the company’s age is significantly and negatively correlated with the dependent variable of employment growth in the statistical regression model. This is due to the fact that young companies with successful business models are able to grow faster when starting out than older and larger companies. Statistics conclusively show that jobs tend to be lost faster in older companies, whereas when younger companies grow, they tend to create new jobs more swiftly. Turnover development (as an annual percentage) for the period 2006 to 2008 was also integrated into the regression model. This variable is a central indicator as recruitments and staff reductions are predominantly dependent on the company’s success in the market, measurable by developments in turnover. The main focus of this study is to analyse whether the use or intensive use of industrial robots in European manufacturing companies has a positive impact on employment growth in the respective companies or not. The results now show a positive prefix for companies that use industrial robots intensively in their 14 For methodological reasons it was no possible to estimate simultaneously positive and employment growth. The requirement of linearity was only met when splitting up between positive and negative growth. However, the main results were the same as displayed in the appendix (TableAnnex 13). Moreover, as an additional test, logistic models for estimating the determinants of a positive resp. negative development was calculated as displayed in TableAnnex 12.

Analysis of the impact of robotic systems on employment in the European Union
September 2014 57
manufacturing operations, but the effect on employment growth in the multivariate regression model is not statistically significant. The regression model that includes the use of industrial robots [use in general, not only intensive use] as an independent variable showed very similar results. These results are of paramount importance for policies affecting manufacturing companies in the EU and the EU itself; especially those aiming to stimulate the development and use of industrial robot systems as one possible way to improve competitiveness and growth.
Table 4-3: Linear regression model for the logarithm of positive employment growth
Construct Variables Coeff. Sig. Construct (Δ in R2/sig. )
Austria 0.036 0.175
Switzerland 0.056 0.041 **
Netherlands 0.049 0.067 *
France -0.008 0.756
Denmark 0.028 0.310
Country (1)
Spain 0.004 0.862
0.5% n.s.
Firm size Ln. of number of employees -0.050 0.083 * 0.1% * Food, beverages, tobacco (15 16) 0.004 0.887 Chemical products (24) -0.003 0.905 Rubber/plastic products (25) 0.014 0.629 Metal products (27 28) 0.026 0.435 Electrical/electronic etc. (30-33) 0.040 0.199 Transport equipment (34 35) 0.066 0.012 **
Sector (2)
Other products n.e.c. -0.041 0.210
0.8% *
Ln. of export 0.053 0.197 Export No export 0.064 0.093 *
0.2% n.s.
Vertical range of manufacture 0.067 0.124 Vertical range Control for missing information 0.107 0.018 **
0.4% *
Major competition on price 0.006 0.838 Strategy (3) Major competition on quality -0.021 0.448
0.1% n.s.
Firm age Ln. of age of firm -0.183 0.000 *** 2.8% ***
Share of new products 0.085 0.076 * New Products No new products 0.038 0.426
0.3% n.s.
Turnover Turnover trend between 2006-2008 0.361 0.000 *** 11.9% ***Intensive robot use (4) Intensive robot use 0.030 0.234 0.1% n.s.
Constant 0.000 *** N 1,260 Model fit
corr. R² / Sig. 0.223 0.000 Note: Dependent variable: Logarithm of amount of positive trend of turnover. Model specification: linear regression. Significance level: *** p< 0.001, ** p< 0.05, * p<0.1, n.s. p> 0.1 Reference groups: (1) Germany, (2) machinery, (3) other prior competition factor, (4) no use or used to a lesser degree.

Analysis of the impact of robotic systems on employment in the European Union
September 2014 58
As the regression models for the productivity effects described above have shown, the intensive use of industrial robots in the manufacturing companies of the selected European countries in this study seems to have a relevant potential to improve the efficiency and competitiveness of manufacturing in high wage countries in Europe. Simultaneously, despite a positive effect on labour productivity, the intensive use of industrial robots in manufacturing companies does NOT seem to have a negative effect on employment in the selected company sample, but either a neutral or even a slightly positive one. Therefore, overall, it seems safe to say that the intensive use of industrial robots in manufacturing companies in European high wage countries seems to have the potential to improve the efficiency of manufacturing operations in the European Union and, in parallel, to help safeguard manufacturing jobs within the EU.
5 Conclusions and recommendations
5.1 Summary of the main results Table 5-1 gives a brief summary of the main results of the study with respect to the main factors determining the use of industrial robots and the relocation of manufacturing activities outside the European Union and Switzerland as well as with respect to the effects of using robots in manufacturing on labour productivity, on total factor productivity (TFP) and on employment.
Table 5-1: Summary of the main results of the analyses
Use
of
ind
ust
rial
ro
bot
s
Mai
nta
inin
g
man
ufa
ctu
rin
g
insi
de
EU
(=N
O p
rodu
ctio
n
relo
catio
n o
utsi
de E
U)
Lab
ou
r
Pro
du
ctiv
ity
Tota
l Fac
tor
P
rod
uct
ivit
y
TFP
Emp
loym
ent
g
row
th
Austria Switzerland + + + + Netherlands (-) + France n.a n.a n.a. n.a. Denmark + - n.a. n.a. Spain + - Size of company + - + + Food, beverages (15 16) + + Chemical products (24) + + Rubber/plastic products (25) + Metal products (27 28) + + Electrical/electronic etc. (30-33) Transport equipment (34 35) + Other products n.e.c. Export quota - + + No export - Vertical range of manufacturing + + Age of firm - Small/medium batch +

Analysis of the impact of robotic systems on employment in the European Union
September 2014 59
Large batch + + + Medium product complexity + Complex products Make to order production - Semi- or unskilled workers (%) - Turnover growth n.a. n.a. n.a. n.a. + Use of industrial robots n.a. + n.s. n.s. n.s. Intensive use of industrial robots n.a. + + n.s. n.s.
Notes: n.a.: Not used in the model. n.s.: no impact. + : positive relation. – : negative relation. Empty cell: no impact.
5.1.1 Factors explaining the use of industrial robots Companies from Spain, Denmark and Switzerland use industrial robots significantly more often than companies from other countries in the selected sample of the European manufacturing industry. This underlines the results of the descriptive analysis, where these three countries also showed above average user rates of industrial robots in manufacturing. Larger firms use industrial robots much more frequently in their production processes than smaller firms. The use rate increases almost linearly to the size of the surveyed companies from 24% of the companies with 20 to 49 employees to 74% of the companies with 1,000 and more employees. Thus, the size of the company, measured by the number of employees, is a clear predictor for the frequency of robot use in industrial companies. Larger companies have more experience with advanced production technologies, more possibilities and higher economies of scale to make efficient use of industrial robot systems. Companies running large batch sizes – or even medium to small batches of medium-complex products – display a significantly higher propensity to use industrial robots than companies producing single units. Economies of scale are easier to realize under the frame conditions of large batch size production and medium-complex products with a high number of parts allow more handling and assembly tasks to be automated, enabling productivity growth through rationalising repetitive tasks. This also explains the above-average probability that manufacturers of rubber and plastic products and manufacturers of metals and metal products will use industrial robots in their manufacturing operations – whereas the high descriptive numbers of robot users in the transport equipment and electrical industry seem to be mitigated by the structural company characteristics described above. Companies active in exports are more likely to use industrial robots than companies that do not export at all. This can be explained by the fact that companies facing stiff international competition on foreign markets are under more pressure to improve the productivity of their production processes via industrial robot systems than companies which are solely active on domestic markets.
5.1.2 Factors explaining the relocation of manufacturing activities outside Europe
Companies from Spain and Denmark show a significantly higher probability to relocate manufacturing activities outside Europe than companies from the other selected countries. Here, country differences in manufacturing traditions and internationalization business cycles play an important role. Spain’s economic development lags behind the other selected countries with respect to globalization and relocation activities. In Denmark (and partly also in the Netherlands), there was a

Analysis of the impact of robotic systems on employment in the European Union
September 2014 60
stronger focus on developing the service sector and concentrating on the high-value added activities in manufacturing sectors. This has led to a higher level of “de-industrialization” of traditional manufacturing activities than in the other selected countries. As expected and as evidenced from the literature, the size of the company is positively correlated to the probability of manufacturing relocations outside the European borders. Large companies are significantly more often multinational concerns, have more plants and more experience with cross-border production and relocation activities. They also have better financial and personnel capacities to plan, finance and absorb the costs of the relocation investment. The batch size of production is significantly and negatively correlated to the propensity of a firm to relocate manufacturing activities outside Europe. If manufacturing companies are able to implement and run large batch sizes in their domestic production processes, they can realize competitive economies of scale which enable them to run highly automated and productive production processes even in high wage countries. The export quota of the selected manufacturing companies is positively correlated to the probability of relocating manufacturing activities outside Europe. Companies exposed to international competition on foreign markets have a greater need to exploit advanced efficiency and productivity potentials, leading to more frequent relocation decisions in these companies. Strikingly, companies that use or intensively use industrial robots in their production processes less frequently relocate parts of their manufacturing activities outside the European Union and Switzerland than companies that do not use industrial robots in manufacturing. Users of industrial robots are more frequently able to realize competitive economies of scale than non-users of robots. This enables them to perform highly productive and profitable production processes even in high wage countries. The propensity of a company to relocate manufacturing activities is around 4% lower if the company uses industrial robots in manufacturing – and around 8% lower if the company uses industrial robots intensively in its manufacturing processes. Extrapolated to the whole EU 2715, this sums up to a theoretical potential of around 3,277companies able to avoid having to relocate outside the EU by making use of industrial robots and around a further 1.211 companies avoiding this by making use of the full productivity potential of an intensive use of the industrial robots in their manufacturing operations. In relation to the total 234,000 manufacturing companies with 20 and more employees in the EU 27, this figure shows quite impressively the potential that an intelligent use of industrial robots has as an economically viable alternative to relocation for realizing in-house productivity potentials and thus a way of safeguarding manufacturing jobs in the European Union.
5.1.3 Effects of robot use on labour productivity and total factor productivity (TFP)
Companies from Switzerland and the Netherlands show a significantly positive correlation to labour productivity when controlling for the whole set of included independent variables. This is in line with the statistics of Eurostat, which report the labour productivity per person employed in the EU 28 as an index compared to the average of the EU 28.
15 Based on an analysis of 2009 EMS data.

Analysis of the impact of robotic systems on employment in the European Union
September 2014 61
As expected and already shown by many earlier studies, the regression model shows a positive correlation between the size of the firm and labour productivity as well as total factor productivity (TFP). Large companies are able to realize greater economies of scale than small firms which have reduced and sometimes sub-critical mass in certain production and auxiliary functions. The manufacturers of food and beverages and the chemical industry show a significantly positive correlation to the dependent variables of labour and total factor productivity. These industrial sectors perform very capital-intensive production processes with a very low share of labour costs in total costs, leading to superior labour productivity compared to the other sectors included. The export quota of the surveyed companies is positively correlated to labour productivity as well as total factor productivity (TFP). Exporting companies have to face global competition on foreign markets, forcing them to exploit further efficiency and productivity potentials. The vertical range of manufacturing –or depth of value-added – shows the most significant positive correlation with labour productivity as well as total factor productivity (TFP). It seems that companies with higher vertical integration have and are able to control a larger share of the total value chain, clearly giving them more possibilities to exploit economies of scale and productivity gains within their manufacturing operations. The batch size of the companies’ production processes is also positively correlated to the labour productivity (but not the TFP) of the surveyed firms. Economies of scale are easier to realise under the frame conditions of large batch size production, enabling productivity growth by rationalising repetitive tasks. In reverse, companies producing in “make-to-order” mode need to be able to react flexibly to customer demands and therefore cannot as easily organise their manufacturing processes along efficiency lines as in-stock producers can. The share of unskilled and semi-skilled workers shows a significantly negative correlation to labour productivity in the respective regression model. Despite its statistical significance, this effect is not really relevant as shown by the very low coefficient value of the factor. Neither focussing on highly qualified and well-trained skilled workers to improve the innovative capabilities of a firm, nor attempting to utilise cost advantages by employing unskilled and semi-skilled workers in simple, repetitive manufacturing and assembly tasks seem to prove successful per se if these strategies do not match the frame conditions and strategic orientations of the respective company. Strikingly, companies that use industrial robots intensively in their manufacturing operations show a significantly higher labour productivity than companies that do not. It seems that intensive users of industrial robots are better at realizing efficient production processes with shorter processing times, higher process quality and competitive economies of scale, which enables them to perform manufacturing operations with an above average labour productivity even in high wage countries. The use of industrial robots in itself [not intensive use], however, does not display a positive correlation to labour productivity. Thus, it seems necessary for manufacturing companies to use industrial robots intensively, not just in pilot or restricted areas, for them to have an above average labour productivity compared to companies which do not use industrial robots. However, the intensive use of industrial robots is not significantly correlated to the total factor productivity in the TFP

Analysis of the impact of robotic systems on employment in the European Union
September 2014 62
regression model. It seems to have the potential to improve the efficiency of the labour force in European manufacturing, but due to the high investments needed for this advanced automation technology, it does not cause positive overall effects on total factor productivity, at least on a short-term basis. It might be possible that after high investments in robot technology which decrease total factor productivity at short notice, a positive return on investment can only be observed with a certain delay. Overall, industrial robots seem to have the potential to help to improve the efficiency of manufacturing operations in the European Union and thus to safeguard manufacturing operations within the EU.
5.1.4 Effects on employment of using robots Swiss companies show a positive correlation to an increase in employment in the multivariate regression model. Eurostat data on employment in the manufacturing industry confirm the above-average growth in employment in Switzerland in the respective time frame of 2006 to 2008 that was indicated by the statistical regression model. Manufacturers of transport equipment also show a positive correlation to employment growth in the multivariate regression model. Passenger car production in the EU grew very dynamically in 2006 and 2007, and according to Eurostat data, the growth in employment in the transport equipment industry in the EU 27 was clearly above the average of the whole manufacturing industry. The age of the firm is significantly and negatively correlated with employment. This is due to the fact that young companies in their early years have a significantly higher average growth rate of employment per year if their business model is intact than older and larger companies. The turnover development (annual percentage) for the period 2006 to 2008 was also integrated into the regression model. This variable is a key indicator as both recruitment and job cuts are predominantly dependent on the company’s success in the market, measurable by developments in turnover. The use or intensive use of industrial robots in manufacturing operations correlates positively with employment growth, but the statistical effect in the multivariate regression model is not statistically significant. These results are of paramount importance for policies affecting manufacturing companies in the EU and the EU itself; especially those aiming to stimulate the development and use of industrial robot systems as one possible way to improve competitiveness and growth. The stimulation of the development and use of industrial robot systems may be one possible measure to improve competitiveness and growth potentials. Despite positive effects on labour productivity, as described above, the intensive use of industrial robots in manufacturing companies does NOT seem to have a negative effect on employment in the selected company sample, but either a neutral or even a slightly positive one. Therefore, overall, it seems safe to say that the intensive use of industrial robots in manufacturing companies in European high wage countries seems to have the potential to improve the efficiency of manufacturing operations in the European Union and, in parallel, to help safeguard manufacturing jobs within the EU.
5.2 Conclusions and policy recommendations Today, manufacturing represents more than one quarter (26.8%) of the EU’s total non-financial business economy value added, providing around 30 million jobs in a

Analysis of the impact of robotic systems on employment in the European Union
September 2014 63
total of 2.1 million enterprises, mostly SMEs (EUROSTAT 2013).16 European manufacturing also plays a leading role in international trade in industrial sectors such as automotive, machinery and agricultural engineering. While the manufacturing sector was already under threat from both lower-wage economies and other high-tech rivals, the specific situation of EU manufacturing companies was aggravated even more by the global financial and economic downturn starting in 2008. As a lesson learned from the crisis originating in the financial sector and in order to regain the strength of the European manufacturing industries, the European Commission's Communication on Industrial Policy and the subsequent Competitiveness Council in 201017 both highlighted the vital importance of a prosperous, innovative and sustainable European industry for the overall competitiveness of the EU economy. This objective was further underpinned by the 2011 Communication “Industrial Policy: Reinforcing competitiveness”.18 To sustainably restore European manufacturing industries’ growth and competitiveness, the Commission aims to make a strategic shift in Europe from cost-based competition to an approach based on the creation of high added value, for instance in terms of more customised, higher quality and greener products, resource-efficient and environmentally-friendly production processes as well as the creation of high quality jobs. These are the basic pillars of the research and innovation in production technologies already stimulated by the FP7-NMP programme and continued in the Horizon 2020 framework (FP8). In September 2009, the European Commission published its Communication "Preparing for our future: Developing a common strategy for key enabling technologies in the EU".19 This strategy clearly identifies the need for the EU to facilitate the industrial deployment of so-called Key Enabling Technologies (KETs) in order to make its industries more innovative and globally competitive. These KETs are expected to contribute to the development of solutions to the Grand Challenges in Europe and thereby to stimulate economic growth and employment in the EU’s manufacturing sector. The need to foster the industrial deployment of KETs within the EU has been identified as a priority in several other EU policy documents. For instance, in its 2012 Communication “A European strategy for Key Enabling Technologies – A bridge to growth and jobs”20, the European Commission outlines a specific strategy for KETs to allow maximum exploitation of the EU’s potential in competitive markets. This Communication underlines the high relevance of KETs for the EU’s ability to innovate and modernize its industrial base. The European Commission has identified the following technologies as KETs: nanotechnology, micro- and nanoelectronics, industrial biotechnology, photonics, advanced materials – and most importantly against the backdrop of this study - advanced manufacturing systems. Without a doubt, industrial robots have to be regarded as an integral part of the advanced manufacturing technologies and systems defined by the KET strategy. The
16 http://epp.eurostat.ec.europa.eu/statistics_explained/index.php/ Manufacturing_statistics_-_NACE_Rev._2 17 An Integrated Industrial Policy for the Globalisation Era: Putting Competitiveness and Sustainability at Centre Stage 18 http://ec.europa.eu/enterprise/policies/industrial-competitiveness/industrial- policy/files/comm_2011_0642_en.pdf 19 http://ec.europa.eu/enterprise/sectors/ict/files/ communication_key_enabling_technologies_en.pdf 20 http://eur-lex.europa.eu/legal-content/EN/ALL/?uri=CELEX:52012DC0341

Analysis of the impact of robotic systems on employment in the European Union
September 2014 64
importance of robotics lies in its wide-ranging impact on Europe's capacity to maintain and expand a competitive manufacturing sector. Moreover, the rapid recent technology progress in industrial robotics has led to an increase in the use of robots, not only in the manufacturing sector, but also in hospitals and health services as well as private homes. Today, robotics has a high potential to provide new solutions to societal challenges ranging from ageing to health, smart transport, security, energy and the environment. As a consequence, the European Commission has built up a large portfolio of research projects and coordination actions to improve knowledge-sharing and cooperation throughout the robotics community. As part of the “Digital Agenda for Europe”21, these projects research subjects ranging from autonomy, manipulation, grasping, mobility and navigation in all terrains, to human-robot interaction and cooperative robots. Very recently, these activities have been supplemented by a public-private-partnership on robotics that was inaugurated at the beginning of 2014.22 Against this background, the results of this study are of paramount importance for European technology and innovation policy. It provides novel empirical evidence that the positive stimulation provided by the further development and diffusion of industrial robot systems is a key means to exploiting the competitiveness and growth potentials of the European manufacturing industry. With regard to the numerous policy actions addressing the stimulation of technological progress in industrial robotics, this study wants to highlight the following key aspects that should be taken into account along the design and implementation of ongoing and future policy activities: Reduction of investment costs: As the findings show, the positive effects on firms’ productivity might be considerably offset by the high investment costs. Hence, one starting point could be to promote the development of cost-friendly robot solutions. This could include both the development of demand-side-oriented, modular and scalable robot solutions that can be individually configured and customized to the diverse needs of different applications as well as new business models on the side of equipment suppliers that reduce the cost-related entry barriers, particularly for smaller and medium-sized enterprises (SMEs). This would help to enhance the positive productivity effects of industrial robots in terms of total factor productivity, too. There have already been some initiatives taken in the past23 which could serve as starting points for future initiatives aiming at similar objectives and stimulating the diffusion of such demand- or application-oriented solutions.
Increase the ability of small and medium-sized manufacturing firms (SMEs) to realize the benefits of industrial robots in manufacturing and assembly: As this study reveals, small and medium-sized companies use robots significantly less frequently than larger firms. This is mainly due to large firms having better economies of scale and resources, not only with regard to finances but also
21 https://ec.europa.eu/digital-agenda/en/science-and-technology/robotics 22 http://www.sparc-robotics.net/ 23 See for example the research project SMErobot™ - The European Robot Initiative for Strengthening the Competitiveness of SMEs in Manufacturing – which was funded under the European Union’s Sixth Framework Programme (FP6) (http://www.smerobot.org/)

Analysis of the impact of robotic systems on employment in the European Union
September 2014 65
regarding a highly skilled and experienced production workforce. Such workers are able to implement, configure and modify robot solutions to match their company’s needs and better exploit the potentials of industrial robots. As many SMEs position themselves as process specialists in their industrial value chains by showing superior performance in flexibility, quality or efficiency (Som 2012), it can be expected that support on both the supply side through adequate technological solutions (see the previous point), and the side of end-users will help to unlock large potentials for improving the competitiveness and growth of SMEs in the European manufacturing industry. Such supportive actions on the user side could, for instance, include strengthening SMEs’ absorptive capacity for new technologies in general and robotics in particular, promoting robotics-related skills in the qualification and vocational training of the production workforce as well as increasing the ability to adapt and develop organisational routines and working processes in production to the requirements of using robots. Complementary, the development of adequate tools to evaluate the economic potentials of new robotic applications in interested SMEs using scenarios of life-cycle-costs and benefits could pave the way for further IR implementations in this key user group.
Provide incentives for firms to (re-)establish a higher vertical range of manufacturing via the implementation or increased use of industrial robots: The findings in this study highlight that firms with a higher vertical manufacturing range – meaning that they perform a larger share of production operations and steps in-house – have higher productivity. Accordingly Kinkel, Lay and Jäger (2009) have shown that vertical integration within manufacturing companies has a positive impact on productivity. In many cases, manufacturing firms have reduced their vertical range of manufacturing due to an increased focus on their core competences by outsourcing periphery and/or cost-intensive production steps to specialised suppliers. Hence, the strategic insourcing of certain value creation steps or manufacturing tasks represents a strong leverage for companies to increase their productivity. Industrial robots could help them in realising such a strategy. Given the technological progress in the field of industrial robots that was made in the past years, the implementation and use of robot systems could be a strong argument for re-introducing these, for instance, cost-intensive or hazardous production steps in order to further increase productivity through new, in-house possibilities of monitoring and optimisation without simultaneously increasing labour costs.
Evaluation of the productivity impact of industrial robot technologies compared to wage-saving strategies by relocating production /offshoring activities to low-wage countries: This study showed that firms using industrial robots are much less likely to relocate production abroad. The implication for European industrial and competition policy is that the wider diffusion of industrial robots among European manufacturing firms could be key, not only to maintaining the current level of industrial production in the EU, but also to bringing back production and manufacturing activities that were shifted to low-wage countries in Asia, India or Eastern Europe over the past decades. As other studies have shown, these cost-driven relocation activities are often associated with problems concerning quality and flexibility (Kinkel and Maloca, 2009). In this sense, industrial robots could play an important role within the EC’s re-industrialization strategy for the European Union. However, the design and implementation of future policy support requires further insights on the industry level, whether and to what extent the positive productivity effects of industrial robots are superior to those gained by relocating activities to low-wage countries. It would be helpful to accompany such efforts by the development of practical methods to integrate the economic

Analysis of the impact of robotic systems on employment in the European Union
September 2014 66
potentials of industrial robot use into easy-to-use calculation tools for location (offshoring) decisions of manufacturing companies to avoid further unreflected, cost-driven relocation decisions. To increase the validity and robustness of the results, such an analysis should also consider different scenarios of robot technology development in the future.
As can be seen, the above points are closely interrelated. It therefore makes sense to integrate them into an overall EU policy initiative targeted at the future technological development of industrial robotics in the European Union.

Analysis of the impact of robotic systems on employment in the European Union
September 2014 67
Bibliography AAAI (Ed.) (2006), Proceedings of the twenty-first National Conference on Artificial Intelligence (AAAI-06), AAAI Press, Menlo Park, Calif.
Armbruster, H., Kirner, E. and Kinkel, S. (2006), “Neue Nutzungspotentiale für Industrieroboter, Ergebnisse einer Betriebsbefragung” (New application potentials for industrial robots, Results of a firm-level survey), wt Werkstattstechnik online, Vol. 96 No. 9, pp. 631–636.
Autor, D. and Dorn, D. (2013), “The growth of low skill service jobs and the polarization of the US labor market”, American Economic Review, Vol. 103 No. 5, pp. 1553–1597.
Ayal, I. and Zif, J. (1979), “Market expansion strategies in multinational marketing”, Journal of Marketing, Vol. 43, pp. 84-94.
Barba Navaretti, G. and Falzoni, A.M. (2004), “Home country effects of foreign direct investment”, in Barba Navaretti, G. and Venables A.J. (Eds), Multinational Firms in the World Economy, Princeton University Press, Princeton/Oxford, pp. 217-239.
Bernard, A.B. and Jensen, J. B. (2004), “Exporting and productivity in the USA”, Oxford Review of Economic Policy, Vol. 20 No. 3, pp. 343-57.
Brainard, S.L. and Riker, D.A. (1997), “Are U.S. multinationals exporting U.S. jobs”, NBER Working Paper, No. 5958, Cambridge/Mass., available at: www.nber.org/papers/w5958.pdf (accessed 08 September 2014).
Broedner, P., Kinkel, S. and Lay, G. (2009), “Productivity effects of outsourcing. New evidence on the strategic importance of vertical integration decisions”, International Journal of Operations & Production Management, Vol. 29 No. 2, pp. 127-150.
Brynjolfsson, E. and McAfee, A. (2011), Race against the machine. How the digital revolution is accelerating innovation, driving productivity, and irreversibly transforming employment and the economy, Digital Frontier Press. Lexington, Mass.
Buckley, P.J. and Casson, M. (1976), The Future of the Multinational Enterprise, Palgrave Macmillan, London.
Camuffo, A., Furlan, A., Romano, P. and Vinelli, A. (2007), “Routes towards supplier and production network internationalisation”, International Journal of Operations & Production Management, Vol. 27 No. 4, pp. 371-387.
Caves, R.E. (1982), Multinational Enterprise and Economics, Cambridge University Press, Cambridge.
Ceccarelli, M. (2004), Fundamentals of mechanics of robotic manipulation, Kluwer Academic Publishers, Dordrecht, Boston (International series on microprocessor-based and intelligent systems engineering, Vol. 27).
Clark, K.B. and Grilliches, Z. (1982), “Productivity growth and R&D at the business level: results from the PIMS data base”, Cambridge Working Papers No 0916, National Bureau of Economic Research, Mass., USA. June 1982.

Analysis of the impact of robotic systems on employment in the European Union
September 2014 68
Dachs, B., Borowiecki, M., Kinkel, S. and Schmall, T. (2012), “The Offshoring of Production Activities in European Manufacturing: Frequency, target regions and motives”, AIT-F&PD-Report, Vienna. 6 December 2012.
Dall'Olio, A., Iootty M., Kanehira, N. and Saliola F. (2013), “Productivity Growth in Europe”, Policy Research Working Paper, 6425, The World Bank, Europe and Central Asia Region, Finance and Private Sector Development Department, April 2013.
Dunning, J. H. (1988), Explaining International Production, Harper Collins, London.
Dunning, J.H. (1980), “Towards an eclectic theory of international production: some empirical tests”, Journal of International Business Studies, Vol. 11 No.1, pp. 9-31.
Egger, H. and Egger, P. (2003), “Outsourcing and skill-specific employment in a small economy: Austria after the fall of the Iron Curtain”, Oxford Economic Papers, Vol. 55 No. 4, pp. 625-643.
Egger, H. and Egger, P. (2006), “International outsourcing and the productivity of low-skilled labour in the EU”, Economic Inquiry, Vol. 44 No. 1, pp. 198-108.
euRobotics aisbl (2013), Robotics 2020. Strategic Research Agenda for Robotics in Europe, euRobotics aisbl, Brussels.
European Union Open Data Portal (2014a), Labour productivity per person employed, Index (EU27 = 100), years 2003-2013, available at: http://epp.eurostat.ec.europa.eu/portal/page/portal/product_details/dataset?p_product_code=tec00116, (accessed 14 August 2014).
European Union Open Data Portal (2014b), Labour input in industry - annual data (2010 = 100), years 2004 to 2013, available at: http://open-data.europa.eu/en/data/dataset/v4B0bOWxp7rCfeYAFVgopw, (accessed 16 August 2014).
Fillis, I. (2001), “Small firm internationalisation: an investigative survey and future research directions”, Management Decision, Vol. 39 No. 9, pp. 767-783.
Forge, S. and Blackman, C. (2010), A Helping Hand for Europe: The Competitive Outlook for the EU Robotics Industry, European Commission, Joint Research Centre, Institute for Prospective Technological Studies, Seville, Spain.
Freeman, R. (2008), Labour Productivity Indicators. Comparison of two OECD Databases. Productivity Differentials & the Ballassa-Samuelson Effect, OECD. OECD Statistics Directorate, Division of Structural Economic Statistics, Paris.
Frey, C.B. and Osborne, M.A. (2013), “The Future of Employment: How susceptible are jobs to computerisation? Oxford Martin School”, available at: http://www.oxfordmartin.ox.ac.uk/downloads/academic/The_Future_of_Employment.pdf, (accessed 14 January 2014).
Gorle, P. and Clive, A. (2011), Positive Impact of Industrial Robots on Employment, Metra Martech Ltd., London.
Gorle, P. and Clive, A. (2013), Positive Impact of Industrial Robots on Employment, updated 2013, International federation of robotics IFR (Ed.), London.

Analysis of the impact of robotic systems on employment in the European Union
September 2014 69
Gupta, A.K. and Arora, S.K. (2007), Industrial Automation and Robotics, Laxmi Publications (P) LTD (Ed.), New Dehli.
Hancock, P.A., Billings, D.R., Schaefer, K.E., Chen J.Y.C., de Visser E.J. and Parasuraman R (2011), “A Meta-Analysis of Factors Affecting Trust in Human-Robot Interaction”, Human Factors, 53, pp. 517-527.
Hill, T.J. (1993), Manufacturing strategy: the strategic management of the manufacturing function, Macmillan, London.
Hunt, V.D. (1983), Industrial robotics handbook, N.Y: Industrial Press, New York.
International Federation of Robotics (IFR) (2011), World robotics 2011: Service robots, VDMA Verlag GmbH, Frankfurt/Main.
International Federation of Robotics (IFR) (2013a), World robotics 2013. Industrial Robots, VDMA Verlag GmbH, Frankfurt/Main.
International Federation of Robotics (IFR) (2013b), World robotics 2013: Industrial Robots and Service Robots, VDMA Verlag GmbH, Frankfurt/Main.
International Federation of Robotics (IFR) (2013c), World robotics 2013. Service Robots, VDMA Verlag GmbH, Frankfurt/Main.
International Federation of Robotics (IFR) (2013d), World robotics, Statistics, Market Analysis, Forecasts and Case Studies, VDMA Verlag GmbH, Frankfurt/Main, available at: http://www.worldrobotics.org/ (accessed 13 September 2014).
ISO 8373:2012-02: Robots and robotic devices – Vocabulary, available at: http://www.iso.org/iso/catalogue_detail.htm?csnumber=15532 (accessed 12 September 2014).
ISO/TR 11065:1992-09: Industrial automation glossary, available at: http://www.iso.org/iso/catalogue_detail.htm?csnumber=19047 (accessed 12 September 2014).
Jacak, W. (1999), Intelligent robotic systems. Design, planning, and control, Kluwer Academic; Plenum (International Federation for Systems Research international series on systems science and engineering, v. 14), New York.
Jäger, A. and Maloca, S. (2009): Dokumentation der Umfrage Modernisierung der Produktion 2009 (Documentation of the European Manufacturing Survey 2009, Germany). Fraunhofer ISI, Karlsruhe.
Johanson, J. and Vahlne, J.E. (1977), “The internationalization process of a firm: a model of knowledge development and increasing foreign market commitments”, Journal of International Business Studies, Vol. 8, Spring/Summer, pp. 23-32.
Johanson, J. and Vahlne, J.E. (1990), “The mechanism of internationalization”, International Marketing Review, Vol. 7 No. 4, pp. 11-24.
King, R.D., Rowland, J., Oliver, S.G., Young, M., Aubrey, W., Byrne, E. et al. (2009), “The Automation of Science”. Science 324 (5923), pp. 85–89.

Analysis of the impact of robotic systems on employment in the European Union
September 2014 70
Kinkel, S. (2012), “Trends in Production Relocation and Back-shoring Activities – Changing Patterns in the Course of the Global Economic Crisis”, International Journal of Operations & Production Management, Vol. 32 No. 6, pp. 696-720.
Kinkel, S. and Maloca, S. (2009), “Drivers and antecedents of manufacturing offshoring and backshoring – a German perspective”, Journal of Purchasing & Supply Management, Vol. 15 No. 3, pp. 154-165.
Kinkel, S. and Weißfloch, U. (2009), Estimation of the Future User Potential of Innovative Robot Technologies in SMEs - Promising Prospects, World Robotics 2009, Frankfurt/M.
Kinklel, S., Lay, G., Jäger, A. (2009), “Vertical integration boosts productivity”, ATZproduktion worldwide, Springer Fachmedien Wiesbaden, No. 05-06/2009, pp. 28-32.
Kinkel, S., Lay, G. and Maloca, S. (2007), “Development, motives and employment effects of manufacturing offshoring of German SMEs”, International Journal of Entrepreneurship and Small Business, Vol. 4 No. 3, pp. 256-276.
Kleine, O. and Kinkel, S. (2013), „Die neuen China-Strategien“ (New China strategies), Havard Business Manager No. 2, pp. 10–11.
Kleine, O., Hägele, M. and Blümlein, N. (2011), „Wirtschaftlichkeitsanalysen neuartiger Servicerobotik-Anwendungen und ihre Bedeutung für die Robotik-Entwicklung (EFFIROB)“ (Profitability analysis of new service robot applications and their relevance for robotics development), München, Fraunhofer.
Kleine, O., Kinkel, S. and Jäger, A. (2008), „Flexibilität durch Technologieeinsatz? Nutzung und Erfolgswirkung flexibilitätsfördernde Technologien“ (Flexibility through utilisation of technology? Utilisation and impact on profit of flexibility-driving technologies), in Nyhuis, P., Reinhart, G. and Abele, E. (Eds.), Wandlungsfähige Produktionssysteme: heute die Industrie von morgen gestalten (Flexible production systems: shaping tomorrow‘s industry today), PZH, Produktionstechn. Zentrum, Garbsen, pp. 78–92.
Klette, T.J. (1999), “Market power, scale economies and productivity: estimates from a panel of establishment data”, The Journal of Industrial Economics, Vol. 47 No. 4, pp. 451–476.
Kromann, L., Skaksen, J.R., Sørensen, A. (2011), Automation, labor productivity and employment – a cross country comparison. CEBR, Copenhagen Business School.
Lin, P., Abney, K. and Bekey, G. (2011), “Robot ethics: Mapping the issues for a mechanized world”, Special Review, Issue 175 (5–6), pp. 942–949.
Liu, D., Wang, L. and Tan, K.C. (2009), Design and control of intelligent robotic systems, Springer-Verlag (Studies in computational intelligence, v. 177), Berlin.
McKinsey Global Institute (2013), Disruptive Technologies. McKinsey & Company.
Mentgen, A. (2011), „China greift nach Robotern“, Produktion, No. 44, pp. 1.
Miller, B., Atkinson, R.D. (2013), Are Robots Taking Our Jobs, or Making Them? Information Technology and Innovation Foundation. Washington, DC.

Analysis of the impact of robotic systems on employment in the European Union
September 2014 71
Mital, A. and Pennathur, A. (2004), “Advanced technologies and humans in manufacturing workplaces: an interdependent relationship”, International Journal of Industrial Ergonomics, Volume 33, Issue 4, pp. 295–313.
Mittal, R.K. and Nagrath, I.J. (2003), Robotics and control, Tata McGraw-Hill, New Delhi.
Mucchielli, J.-L. and Saucier, P. (1997), “European industrial relocations in low-wage countries: policy and theory debates”, in Buckley, P.J. and Mucchielli, J.-L. (Eds.), Multinational Firms and International Relocation. Cheltenham, UK, pp. 5-33.
N.U. (2009), „Intelligente Roboter werden zu ‚Mit-Arbeitern‘“ (Smart robots are becoming ‚co-workers‘), Produktion, No. 47, 19.11.2009, p. 6.
Nof, S.Y. (Ed.) (2009), Springer Handbook of Automation, Springer, Berlin, Heidelberg.
Nordström, K.A. and Vahlne, J.E. (1994), “Is the globe shrinking? Psychic distance and the establishment of Swedish sales subsidiaries during the last 100 years”, in Landeck, M. (Ed.), International trade – regional and global issues, St. Martin’s Press, Basingstoke.
O’Grady, S. and Lane, H. (1996), “The psychic distance paradox”, Journal of International Business Studies, Vol. 27 No. 2, pp. 309-334.
Pennings, E. and Sleuwaegen, L. (2000), “International relocation: firm and industry determinants”, Economics Letters, Vol. 67 No. 2, pp. 179-186.
Robotics VO (Ed.) (2013), A Roadmap for U.S. Robotics From Internet to Robotics - 2013 Edition. Unter Mitarbeit von Georgia Institute of Technology, Carnegie Mellon University, Robotics Technology Consortium, University of Pennsylvania, University of Southern California, Stanford University et al.
Rotman, D. (2013), „How Technology Is Destroying Jobs“, MIT Technology Review (Ed.), available at: http://www.technologyreview.com/featuredstory/515926/how-technology-is-destroying-jobs/, (accessed 13 February 2014).
Rugman, A.M. and Hodgetts, R.M. (2000), International Business: A Strategic Management approach, Prentice Hall, Harlow.
Schade, W., Zanker, C., Kühn, A., Kinkel, S., Jäger, A., Hettesheimer, T., Schmall, T. (2012), „Zukunft der Automobilindustrie. Innovationsreport“ (The future of the automitve industry. Innovation report), Arbeitsbericht 152, Büro für Technikfolgen-Abschätzung beim Deutschen Bundestag (TAB) (Ed.). Available at: http://www.tab-beim-bundestag.de, (accessed 20 September 2014).
Schmidt, K. and Rohde, M. (2010), „Low Cost Automation in der Logistik“ (Low cost automation in logistics), ZWF – Zeitschrift für wirtschaftlichen Fabrikbetrieb, Vol. 105 1-2, pp. 91–95.
Shah, S.V., Saha, S.K. and Dutt, J. K. (2013), Dynamics of tree-type robotic systems, Springer (Intelligent Systems, Control and Automation: Science and Engineering, v. 62). Dordrecht, New York.

Analysis of the impact of robotic systems on employment in the European Union
September 2014 72
Simon, H. (2012), „Hidden Champions: Erfolgsstrategien in der globalen Wirtschaft“ (Hidden champions: Succes strategies in a global economy), Industrie Management, Vol. 28 No. 6, pp. 9–13.
Simon, H. (2012), Hidden Champions – Aufbruch nach Globalia. Die Erfolgsstrategien unbekannter Weltmarktführer (Hidden Champions – departure to Globalia. Succes strategies of unknown world market leaders), Campus, Frankfurt/M.
Soederbom, T. and Teal, F. (2001), “Firm size and human capital as determinants of productivity and earnings”, CSAE Working Paper, CSAE, Oxford.
Som, O. (2012), Innovation without R&D: Heterogeneous innovation patterns of non-R&D-performing firms in the German manufacturing industry, Springer Gabler, Wiesbaden.
Sourafel, G., Greenaway, D. and Kneller, R. (2004), „Does exporting increase productivity? A microeconometric analysis of matched firms”, Review of International Economics, Vol. 12 No. 5, pp. 855-66.
Stauffer, R.N. (1979), “Definition from Robotics Today”, Robotics Today, published by the Society of Manufacturing Engineers, Stauffer, R.N. (Ed.), Dearborn, Michigan, Fall 1979.
Stopford, J.J. and Wells, L.T. (1976), Managing the multinational enterprise: Organization of the firm and organization of the subsidiaries, Basic Books, New York.
Surdilovic, D., Schreck, G., Schmidt, U. (2010). Development of collaborative robots (COBOTS) for flexible human-integrated assembly automation. Eds. Verband der Elektrotechnik, Elektronik, Informationstechnik -VDE-. Fraunhofer IPK. Red Hook, NY (Joint 41st International Symposium on Robotics and 6th German Conference on Robotics, ISR/ROBOTIK 2010. Vol.1 : Munich, Germany, 7 - 9 June 2010).
The Automation Federation (2014), „What is Automation?”, available at: http://www.automationfederation.org/Content/NavigationMenu/General_Information/Alliances_and_Associations/The_Automation_Federation/About1/What_is_Automation_/What_is_Automation_.htm, (accessed 25 April 2014).
TNS Opinion & Social (2012), “Public attitudes towards Robots”, Special Eurobarometer 382 / Wave EB77.1.
Tobe, R. (2013), „Do industrial robots really have a positive impact on employment?” The Robot Report (Ed.). Available at: http://www.everything-robotic.com/2013/04/do-industrial-robots-really-have.html, Last updated 09 April 2013), (accessed 20 September 2013).
Tzafestas, S.G. (1992), Robotic systems. Advanced techniques and applications, Kluwer Academic (International series on microprocessor-based and intelligent systems engineering, v. 10), Dordrecht, Boston.
UNCTAD (2005), World Investment Report 2005, United Nations, New York/Geneva.
UNCTAD (2007), World Investment Report 2007, United Nations, New York/Geneva.
UNCTAD (2009), World Investment Report 2009, Transnational Corporations, Agricultural Production and Development, United Nations New York and Geneva.

Analysis of the impact of robotic systems on employment in the European Union
September 2014 73
Vernon, R. (1966), “International investment and international trade in the product cycle”, Quarterly Journal of Economics, Vol. 80 No. 2, pp. 190-207.
Vernon, R. (1979), “The product cycle hypothesis in the new international environment”, Oxford Bulletin of Economics and Statistics, Vol. 41, pp. 255-267.
Wagner, J. (2002), “The causal effects of exports on firm size and labor productivity: first evidence form a matching approach”, Economics Letters, Vol. 77 No. 2, pp. 287-92.
Widmann, W. (2007), „Automatisierung in der Intralogistik (Teil 1). Roboter können die Kostenfrage lösen“ (Automation in intra-logistics (Part 1). Robots can solve the cost issue), Produktion, No. 47, 19.11.2009, pp. 14.
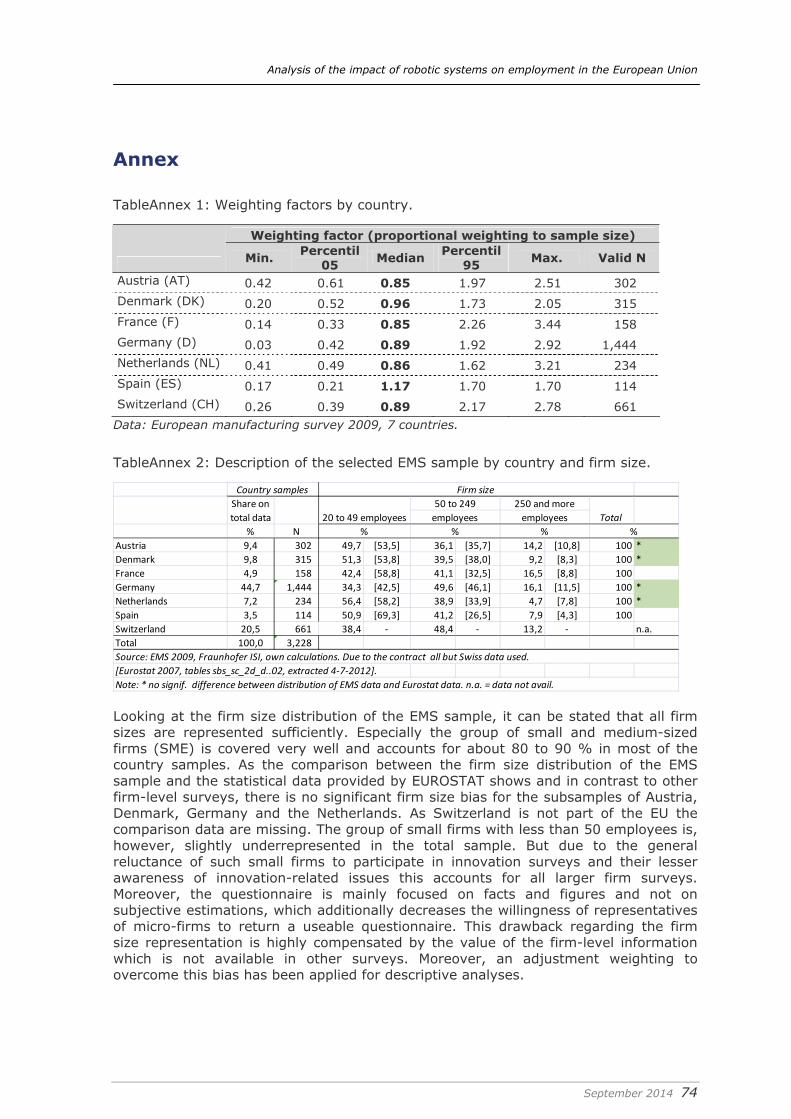
Analysis of the impact of robotic systems on employment in the European Union
September 2014 74
Annex
TableAnnex 1: Weighting factors by country.
Weighting factor (proportional weighting to sample size)
Min. Percentil 05 Median Percentil
95 Max. Valid N
Austria (AT) 0.42 0.61 0.85 1.97 2.51 302 Denmark (DK) 0.20 0.52 0.96 1.73 2.05 315 France (F) 0.14 0.33 0.85 2.26 3.44 158 Germany (D) 0.03 0.42 0.89 1.92 2.92 1,444 Netherlands (NL) 0.41 0.49 0.86 1.62 3.21 234 Spain (ES) 0.17 0.21 1.17 1.70 1.70 114 Switzerland (CH) 0.26 0.39 0.89 2.17 2.78 661 Data: European manufacturing survey 2009, 7 countries.
TableAnnex 2: Description of the selected EMS sample by country and firm size.
% N Austria 9,4 302 49,7 [53,5] 36,1 [35,7] 14,2 [10,8] 100 * Denmark 9,8 315 51,3 [53,8] 39,5 [38,0] 9,2 [8,3] 100 * France 4,9 158 42,4 [58,8] 41,1 [32,5] 16,5 [8,8] 100 Germany 44,7 1,444 34,3 [42,5] 49,6 [46,1] 16,1 [11,5] 100 * Netherlands 7,2 234 56,4 [58,2] 38,9 [33,9] 4,7 [7,8] 100 * Spain 3,5 114 50,9 [69,3] 41,2 [26,5] 7,9 [4,3] 100 Switzerland 20,5 661 38,4 - 48,4 - 13,2 - n.a. Total 100,0 3,228
[Eurostat 2007, tables sbs_sc_2d_d..02, extracted 4-7-2012]. Source: EMS 2009, Fraunhofer ISI, own calculations. Due to the contract all but Swiss data used.
Note: * no signif. difference between distribution of EMS data and Eurostat data. n.a. = data not avail.
Total % % % %
Country samples Firm size
Share on total data 20 to 49 employees
50 to 249employees
250 and moreemployees
Looking at the firm size distribution of the EMS sample, it can be stated that all firm sizes are represented sufficiently. Especially the group of small and medium-sized firms (SME) is covered very well and accounts for about 80 to 90 % in most of the country samples. As the comparison between the firm size distribution of the EMS sample and the statistical data provided by EUROSTAT shows and in contrast to other firm-level surveys, there is no significant firm size bias for the subsamples of Austria, Denmark, Germany and the Netherlands. As Switzerland is not part of the EU the comparison data are missing. The group of small firms with less than 50 employees is, however, slightly underrepresented in the total sample. But due to the general reluctance of such small firms to participate in innovation surveys and their lesser awareness of innovation-related issues this accounts for all larger firm surveys. Moreover, the questionnaire is mainly focused on facts and figures and not on subjective estimations, which additionally decreases the willingness of representatives of micro-firms to return a useable questionnaire. This drawback regarding the firm size representation is highly compensated by the value of the firm-level information which is not available in other surveys. Moreover, an adjustment weighting to overcome this bias has been applied for descriptive analyses.

Analysis of the impact of robotic systems on employment in the European Union
September 2014 75
TableAnnex 3: Description of the selected EMS sample by sector affiliation.
% N Country Austria 32,1 [37,4] 61,9 [58,0] 6 [4,6] 100 302 * Denmark 27,7 [29,7] 64,9 [64,4] 7,3 [6,0] 100 328 * France 31,6 [33,7] 61,4 [60,1] 7 [6,2] 100 158 * Germany 22,4 [26,4] 67,2 [66,1] 10,3 [7,4] 100 1444 * Netherlands 28,2 [28,9] 66,7 [66,1] 5,1 [4,9] 100 234 * Spain 33,3 [37,6] 60,5 [59,8] 6,1 [2,3] 100 114 * Switzerland 25,6 - 57,3 - 17,1 - 100 86 n.a.
% % %
Source: EMS 2009, Fraunhofer ISI, own calculations. [Eurostat 2007, tables sbs_sc_2d_d...02, extracted 4-7-2012]. Note: Sector classification based on the typology of Legler/Frietsch (2006) using 2 digit level of NACE classification. * no
Sector classification on R&D intensity Firms in the non-R&D-intensive
sector
Firms in the sector of highly developed
products
Firms in the high technology sector
Total
The firm sample is composed by all kinds of manufacturing sectors, including non-R&D-intensive sectors (e.g. food, beverages, textiles, metal processing), sectors of highly developed products (e.g. automotive in-dustry, mechanical engineering) as well as the so-called high technology sectors (e.g. medical engineering, systems for measurement and control, electrical engineering). Comparing the sector classification structure of the EMS sample with EUROSTAT data as far as available reveals a very good representation regarding the sector distribution. Firms which belongs to sectors of highly developed products represent two third of the manufacturing industry in every country concerned. High technology sectors count only for less than 10 % of the firms. This picture is very well covered by EMS 2009 data; chi square tests comparing the distribution of EMS and EUROSTAT data did not reveal significant differences for almost all sub-samples. Hence, the EMS 2009 sample covers the whole range regarding firm size as well as regarding sector providing a reliable and valid database for the intended quantitative analyses. Moreover, the samples were drawn randomly and applying a stratification to the population list based on two major characteristics, firm-size and sector affiliation. After conducting the survey, no striking selective non-response is observed regarding those criteria. The overview over the weighting factors underlines this statement. The range of the factors is relatively low for the different national samples. Therefore, we are convinced that the data are a meaningful base for analyses in this context. Besides, the data have been proven very valuable in the context of another research project on behalf of the European Commission (Analysis of innovation drivers and barriers in support of better policies Economic and Market Intelligence on Innova-tion. Organisational and Marketing Innovation – Promises and Pitfalls?, 2012).

Analysis of the impact of robotic systems on employment in the European Union
September 2014 76
TableAnnex 4: Questions from EMS employed for the operationalization.
Robot utilisation (including extent of used potential)
Relocation activities
Development of the competitive and employment situation

Analysis of the impact of robotic systems on employment in the European Union
September 2014 77
TableAnnex 5: Countries that have been considered for EU- and World-values in Figure 2-3. Source: IFR 2013a.
Country list: • Argentina • Australia • Austria • Belgium • Brazil • Canada • China • Croatia • Czech Republic • Denmark • Estonia • Finland • France • Germany • Greece • Hungary • India • Indonesia • Iran • Israel • Italy • Japan • Malaysia
Country list, continued: • Mexico • Netherlands • New Zealand • Norway • Philippines • Poland • Portugal • Republic of Korea • Romania • Russian Federation • Slovakia • Slovenia • South Africa • Spain • Sweden • Switzerland • Taiwan • Thailand • Turkey • Ukraine • United Kingdom • USA
Note: Countries in italic were taken into account for calculating the European mean. All countries listed were taken into account for calculating the World mean

Analysis of the impact of robotic systems on employment in the European Union
September 2014 78
TableAnnex 6: Estimation and projection on distribution of industrial robots on companies in Spain and Germany.
Germany Spain
Number of robots used in manufacturing in 2009 (1) 134,397 27,516
Number of firms in 2008 (2) 45,863 22,276
Share of firms using robots in 2009, weighted data (3) 29% 48%
Estimated number of firms using robots 13,300 10,692
Estimated average number of robots per firm 10.1 2.6
Extrapolations
Exampe 1: Assumption of equally high user rate
Share of firms using robots 48% 48%
Number of firms using robots 22,014 10,692
Extrapolated average number of robots per firm 6.1 2.6
Example 2: Assumption of equally low user rate …
Share of firms using robots 29% 29%
Number of firms using robots 13,300 6,460
Extrapolated average number of robots per firm 10.1 4.3Sources: (1) IFR 2013d, (2) according to national statistics, (3) European Manufacturing Survey 2009, own calculations, weighted data. Note: The first case represents actual data, all exampels in italic are only notional calculations. TableAnnex 6 shows that in Germany the total amount of industrial robots in use is almost five times as high as in Spain. The number of firms located in Germany is almost twice as high as in Spain. Almost 50 % of the firms located in Spain are using robots, whereas in Germany less than 30 % are making use of robots. This leads to an average number of 10.1 robots per firm in Germany in contrast to 2.6 in Spain, leading to the conclusion that the high number of robots in use in Germany is concentrated on a relatively low number of companies. As it can be seen in the different extrapolations the total number of firms using robots as well as the average number of robots per firm is a lot higher in Germany than in Spain, no matter if the share of firms using robots is on the level of Spain in both countries, or on the level of Germany. Furthermore, EMS gathers data on the utilization of robots on a firm-level. A random sample of all firms in the manufacturing industry is asked if they utilized robots within their production. This allows for a profound estimate on the question “How many firms within manufacturing use robots in their production within a specific country?” based on a broad data set of high quality. Even if a slight (!) bias of the sample cannot be precluded completely as possibly in Spain the survey tends to include more innovative companies within EMS, the detected differences may not be caused only by that. IFR, however, captures country-specific stocks of operational industrial robots, by aggregating sales data from robot manufacturers on a national basis. This data allows for an appropriate estimate on how many robots are used in a certain country. However, it does not give a hint which share of companies are using these robots.

Analysis of the impact of robotic systems on employment in the European Union
September 2014 79
TableAnnex 7: Logistic regression model of firm-level determinants for the probability to use industrial robots, as summarized in Table 3-3.
Variable Label Coeff. Sig. OR
Austria .235 .191 1.264
Switzerland .490 .000 1.632
Netherlands -.026 .903 .974
Denmark .894 .000 2.444
Country (1)
Spain 1.060 .000 2.886
Firm size Ln. of number of employees .617 .000 1.854 Food, beverages, tobacco (15 16) -.154 .525 .858 Chemical products (24) -.400 .104 .670 Rubber/plastic products (25) .601 .006 1.825 Metal products (27 28) .517 .002 1.676 Electrical/electronic etc. (30-33) .048 .788 1.049 Transport equipment (34 35) .539 .071 1.715
Sector (2)
Other products n.e.c. -.204 .253 .815
Small/medium batch .729 .000 2.074 Batch size (3) Large batch 1.269 .000 3.558
Medium complexity .353 .012 1.424 Complexity (4) Complex products .200 .228 1.221
Type of production(5) Make-to-order production -.153 .174 .858
Strategy (6) Major competition on price .021 .868 1.021
Ln. of export -.050 .333 .951 Export No export -.475 .041 .622
Skill level Share of semiskilled or unskilled .003 .100 1.003
Constant -4.379 .000 .013 -2 Log-Likelihood / Significance 2,463.4 .000
Cox & Snell R-Square .160
Nagelkerkes R-Square .218 Model fit
Number of cases 2,160 Note: Dependent variable: Robot use. Modell specification: logistic regression. Significance level: *** p< 0.001, ** p< 0.05, * p<0.1, n.s. p> 0.1 Reference groups: (1) Germany, (2) machinery, (3) single unit production, (4) simple products, (5) assemble to order or make-to-stock, (6) other prior competition factor.

Analysis of the impact of robotic systems on employment in the European Union
September 2014 80
TableAnnex 8: Logistic regression model of firm-level determinants for the probability to relocate (parts of) the manufacturing activities outside Europe, as summarized in Table 3-4.
Model: Robot use Model: Intensive useVariable Label Coeff. Sig. OR Coeff. Sig. OR
Austria -.576 .262 .562 -.553 .281 .575Switzerland -.226 .519 .797 -.222 .530 .801Netherlands .886 .060 2.427 1.008 .034 2.740Denmark 1.216 .003 3.375 1.163 .005 3.200
Country (1)
Spain 1.954 .000 7.056 2.002 .000 7.400Firm size Ln. of number of employees .647 .000 1.910 .614 .000 1.848
Food / beverages(15 16) -1.713 .108 .180 -1.707 .111 .181Chemical products (24) -.373 .493 .689 -.410 .458 .664Rubber/plastic products (25) -.282 .604 .754 -.287 .602 .750Metal products (27 28) -1.091 .026 .336 -1.028 .036 .358Electrical/electronic etc. (30-33) .317 .326 1.373 .388 .236 1.474Transport equipment (34 35) -.104 .865 .901 -.012 .984 .988
Sector (2)
Other products n.e.c. .200 .579 1.221 .331 .360 1.393Amall/medium batch -.104 .714 .901 -.140 .620 .869Batch size (3) Large batch -1.179 .016 .308 -1.194 .015 .303Medium complexity -.065 .858 .937 -.105 .773 .900Complexity
(4) Complex products .261 .519 1.298 .248 .540 1.282Type of production (5) Make-to-order production -.258 .304 .773 -.251 .321 .778
Strategy (6) Major competition on price .280 .374 1.323 .295 .351 1.342Ln. of export .500 .003 1.649 .515 .002 1.673Export Control for no export .201 .833 1.223 .177 .853 1.194
Skill level Share of semiskilled or unskilled .006 .269 1.006 .005 .357 1.005
R&D More R&D/construction employees than manufacturing personell
-.379 .435 .684 -.616 .239 .540
Vertical range of manufacturing .298 .726 1.347 .258 .765 1.294Vertical range Control for missing information
on vertical range .065 .909 1.067 .099 .863 1.104Intensive robot use -1.166 .012 .312Robot use (7) Robot use -.613 .018 .542
Constant -7.799 .000 .000 -7.786 .000 .000
-2 Log-Likelihood / Significance 619.1 .000 608.1 .000 Cox & Snell R-Square .070 .072Nagelkerkes R-Square .218 .224
Model fit
Number of cases 1,972 1,949Note: Dependent variable: Relocating outside Europe vs. not relocating. Model specification: logistic regression. Significance level: *** p< 0.001, ** p< 0.05, * p<0.1, n.s. p> 0.1 Reference groups: (1) Germany, (2) machinery, (3) single unit production, (4) simple products, (5) assemble to order or make-to-stock, (6) other prior competition factor, (7) no use or used to a lesser degree.

Analysis of the impact of robotic systems on employment in the European Union
September 2014 81
TableAnnex 9: Characteristics used for calculating the adjusted predictions at representative values as displayed in Figure 3-9.
Construct Value Country Germany
Firm size (logarithm of no. of employees) Varying from 3.43 to 7.6
Sector Machinery
Batch size Medium complexity
Complexity Small/medium batch
Type of production Make-to-order production
Strategy No price strategy
Export (logarithm of share of export) 2.94 (median)
Skill level 31.9 (mean)
R&D Less than in manufacturing
Vertical range of Manufacturing 0.37 (mean)
TableAnnex 10: Predicted probability for factors used in Figure 3-9 by country.
Country AT D CH NL DK ES
Predicted probability to relocate outside Europe* … when not using robots 1.7% 2.5% 3.1% 4.7% 10.0% 15.7%
… when using robots 0.9% 1.4% 1.7% 2.6% 5.7% 9.1%relative change of
predicted probability 45.4% 45.2% 45.0% 44.6% 43.2% 41.6%
Predicted probability to relocate outside Europe** … when not intensively using robots 1.5% 2.1% 2.6% 4.4% 8.2% 13.6%
… when intensively using robots 0.5% 0.6% 0.8% 1.4% 2.7% 4.7%relative change of
predicted probability 68.5% 68.4% 68.3% 67.9% 67.0% 65.6%
Notes: * Based on model 1, Table Annex 3, ** Based on model 2, Table Annex 3

Analysis of the impact of robotic systems on employment in the European Union
September 2014 82
TableAnnex 11: Extrapolation of the potential reduction of companies relocating manufacturing ac-tivities outside the EU by (intensive) use of industrial robots.
Country AT DK D ES NL Total of 5 countries **
Estimationfor EU 27**
Manufacturing with et least 20 employees (total in 2008/2007)* 4,267 3,054 36,947 23,586 6,440 74,289 233,983
Percentage of firms relocating 1.6% 9.0% 2.7% 10.0% 5.3% 5.5% 5.5%
Estimated number of firms relocating 67 273 1,007 2,367 339 4,053 12,766
Estimated number of relocation firms …
… not using robots 49 153 717 1,227 262 2,408 7,583
… using robots but not intensively 16 103 263 845 69 1,296 4,177
Potential reduction of firms relocating manufacturing activities ontside Europe
… by introducing robot use 22 66 324 511 117 1,040 3,277
… by intensifying existing robot use 5 38 92 279 19 432 1,211 Notes: * Eurostat data 2007/2008 (European Union 2014). ** Estimated numbers.

Analysis of the impact of robotic systems on employment in the European Union
September 2014 83
TableAnnex 12: Logistic regression models of firm-level determinants of the probability of a positive resp. negative development of employment between 2007 and 2009.
Model: Positive development
Model: Negative development
Variable Label Coeff. Sig. OR Coeff. Sig. OR Austria .035 .861 1.035 .174 .422 1.190Switzerland .440 .003 1.552 -.252 .134 .777Netherlands -.224 .310 .799 .453 .063 1.572France -.640 .010 .527 1.155 .000 3.175Denmark -.066 .857 .936 .686 .075 1.985
Country (1)
Spain -.132 .663 .877 .543 .085 1.721Firm size Ln. of number of employees .303 .000 1.353 -.047 .486 .954
Food / beverages(15 16) -.259 .310 .772 .490 .093 1.633Chemical products (24) -.561 .036 .571 .442 .148 1.556Rubber/plastic products (25) -.440 .067 .644 .864 .001 2.373Metal products (27 28) -.175 .374 .839 .290 .213 1.337Electrical/electronic etc. (30-33) -.361 .086 .697 .806 .001 2.239Transport equipment (34 35) -.363 .334 .695 .389 .341 1.476
Sector (2)
Other products n.e.c. -.568 .003 .566 .755 .001 2.129Ln. of export .020 .735 1.020 .036 .575 1.036Export Control for no export .008 .974 1.008 -.059 .827 .943Vertical range of manufacturing .872 .010 2.391 -.683 .063 .505
Vertical range Control for missing information on vertical range
.506 .040 1.659 -.737 .007 .478
Major competition on price -.310 .049 .734 .330 .054 1.391Strategy (3)
Major competition on quality .069 .592 1.071 -.055 .701 .946
Firm age Ln. of age of firm -.319 .000 .727 .235 .003 1.265
Share with new products (Ln. + Missing) -.139 .061 .870 .059 .458 1.061New Products No new products -.183 .383 .832 .108 .634 1.114
Turnover Turnover trend between 2006-2008 .121 .000 1.128 -.131 .000 .877
Robot use (4) Intensive robot use -.232 .163 .793 .266 .132 1.305
Constant -.349 .485 .706 -1.487 .007 .226
-2 Log-Likelihood / Significance 1,951.2 ,000 1,651.1 .000 Cox & Snell R-Square 0.259 0.241Nagelkerkes R-Square 0.356 0.357
Model fit
Number of cases 1,951 1,951Note: Dependent variable: Binary indicator of employment growth, model 1 analyzing positive development (> 0) vs. not positive development resp. model 2 analyzing negative development (< 0) vs. not negative development. Model specification: logistic regression. Significance level: *** p< 0.001, ** p< 0.05, * p<0.1, n.s. p> 0.1 Reference groups: (1) Germany, (2) machinery, (3) other prior competition factor, (4) no robot use or used to a lesser degree.

Analysis of the impact of robotic systems on employment in the European Union
September 2014 84
TableAnnex 13: Linear regression models of firm-level determinants for logarithm of the extent of positive resp. negative employment growth between 2007 and 2009 measured in %.
Model 1: Positive
development
Model 2: Negative
development
Construct Variables Coeff. Sig. Coeff. Sig.
Austria 0.036 0.175 -0.001 0.979
Switzerland 0.056 0.041 0.048 0.300
Netherlands 0.049 0.067 0.158 0.001
France -0.008 0.756 -0.052 0.259
Denmark 0.028 0.310 0.098 0.050
Country (1)
Spain 0.004 0.862 0.039 0.385
Firm size Ln. of number of employees -0.050 0.083 -0.241 0.000 Food, beverages, tobacco (15 16) 0.004 0.887 -0.064 0.269 Chemical products (24) -0.003 0.905 -0.023 0.658 Rubber/plastic products (25) 0.014 0.629 -0.008 0.894 Metal products (27 28) 0.026 0.435 -0.009 0.888 Electrical/electronic etc. (30-33) 0.040 0.199 0.067 0.284 Transport equipment (34 35) 0.066 0.012 0.022 0.654
Sector (2)
Other products n.e.c. -0.041 0.210 0.089 0.225
Ln. of export 0.053 0.197 0.054 0.420 Export No export 0.064 0.093 0.028 0.644
Vertical range of manufacture 0.067 0.124 -0.034 0.622 Vertical range Control for missing information 0.107 0.018 0.007 0.927
Major competition on price 0.006 0.838 -0.037 0.475 Strategy (3) Major competition on quality -0.021 0.448 -0.110 0.029
Firm age Ln. of age of firm -0.183 0.000 -0.060 0.201
Share with new products (Ln. + Missing) 0.085 0.076 0.208 0.007 New Products No new products 0.038 0.426 0.068 0.375
Turnover Turnover trend between 2006-2008 0.361 0.000 -0.156 0.001 Intensive robto use (4) Intensive robot use
0.030 0.234 -0.020 0.641 Constant 0.000 0.000
N 1,260 484 Model fit corr. R² / Sig. 0.223 0.000 0.117 0.000
Note: Dependent variable: Ln. of the positive (1) or negative (2) trend of employment. Model specification: linear regression. Significance level: *** p< 0.001, ** p< 0.05, * p<0.1, n.s. p> 0.1 Reference groups: (1) Germany, (2) machinery, (3) other prior competition factor, (4) no robot use or used to a lesser degree.

Digital Agenda for
European Commission Analysis of the impact of robotic systems on employment in the European Union Luxembourg, Publications Office of the European Union 2015 – 94 pages ISBN: 978-92-79-48086-7 DOI: 10.2759/516348

Digital Agenda for Europe
KK
-02
-15
-35
1-EN
-N
DOI: 10.2759/516348 ISBN 978-92-79-48086-7


![Cloud Networked Robotics - Teknologisk Institut Networked Robotics.pdf · expansion of such robotic middleware as ROS [3] or RT-Middleware [4]. Since such ... of robots on cloud servers,](https://img.pdfslide.net/doc/110x75/5ad65c807f8b9a5d058e6241/cloud-networked-robotics-teknologisk-networked-roboticspdfexpansion-of-such-robotic.jpg)