Embed Size (px)
Citation preview
Analysis of the President’s Budget for 2013:
Making Health Spending Inclusive
Rosario G. Manasan
Special Papers
Improvement of the Implementation Procedures and Management Systems for the Health Facilities Enhancement Grant of the Department of Health
Rouselle F. Lavado, Ida Marie T. Pantig,
Kristine Tyrol Z. Rosales, and Valerie Gilbert T. Ulep
Review of the Cheaper Medicines Program of the Philippines: Botika ng Barangay, Botika ng Bayan,
PHP100 Treatment Pack, and the Role of PITC Pharma, Inc. in Government Drug Procurement
Oscar F. Picazo
Philippine Institute for Development Studies Surian sa mga Pag-aaral Pangkaunlaran ng Pilipinas
ii
Copyright 2013
Philippine Institute for Development Studies
Printed in the Philippines. All rights reserved.
The views expressed in this volume are those of the authors and do not necessarily reflect the
views of the any individual or organization. Please do not quote without permission from the
authors or PIDS.
Please address all inquiries to:
Philippine Institute for Development Studies NEDA sa Makati Building, 106 Amorsolo Street Legaspi Village, 1229 Makati City, Philippines Tel: (63-2) 8939573 / 8942584 / 8935705 Fax: (63-2) 8939589 / 8161091 E-mail: [email protected] Website: http://www.pids.gov.ph ISSN 2244-5951 Copyeditors: Sheila V. Siar, Felipe F. Salvosa II Original cover design: Joel C. Lozare Production coordination: Jane C. Alcantara Graphic designer: Jose Ignacio O. Tenorio
iii
Table of Contents
List of Tables, Figures, Appendix Tables, and Annexes v Foreword ix List of Acronyms xi Main paper Analysis of the President’s Budget for 2013 by Rosario G. Manasan Introduction 1 Overall fiscal position in perspective 1 Expenditure program 7 Revenue program 27 Financing program 35 Conclusion 37 References 38 Appendix Tables 41 Special papers Improvement of the Implementation Procedures and Management Systems for the Health Facilities Enhancement Grant of the Department of Health by Rouselle F. Lavado, Ida Marie T. Pantig, Kristine Tyrol Z. Rosales, and Valerie Gilbert T. Ulep Introduction 47 Description of the program: HFEP 48 The HFEP budget 49 Structure 50 Sources of fund 51 Planning and budgeting 52 Budget allocation 53 Budget execution 60 Monitoring and control 62 The way forward 64 References 65 Annexes 68
iv
Review of the Cheaper Medicines Program of the Philippines: Botika ng Barangay, Botika ng Bayan, PHP100 Treatment Pack, and the Role of PITC Pharma, Inc. in Government Drug Procurement by Oscar F. Picazo Introduction 86 Pharmaceutical sector context 88 Review of the Botika ng Barangay program 99 Review of the Botika ng Bayan program 115 Review of the PHP100 Treatment Pack program 122 Review of the Drug Inventory Management System supporting the government 132 pharmaceutical programs Review of PITC mandate and performance 135 References 141
v
List of Tables, Figures, Appendix Tables, and Annexes
Analysis of the President’s Budget for 2013 Table 1 National government fiscal position, 2010–2013 5 2 Debt sustainability simulation, 2013–2017 7 3 2013 national budget program (in million pesos) 10 4 Comparative analysis of National Expenditure Program (NEP) by sector, 11
2011–2013 5a Top gainers in 2013 NEP, selected agencies 12 5b Top gainers in 2013 NEP, selected agencies 17 6 Government spending on education sector in selected countries, 2000–2011 25 7 Recent revenue performance, by semester, 2007–2011 29 8 Existing excise tax rates on tobacco and alcoholic products (RA 9334) 31 9 Excise tax rates on tobacco and alcoholic products (RA 10351) 33 Figure 1 National government fiscal performance, 1996–2012 2 2 National government outstanding debt (% to GDP), 1996–2012 2 3 Aggregate national government expenditures, as a percentage of GDP, 20
1975–2013 4 Budget share of debt service and transfers to LGUs (%), 1975–2013 21 5 Percentage distribution of national government expenditures net of debt 23
service, by major expenditure group, 1975–2013 6 National government expenditures on social services sectors, as a percentage 24
of GDP, 1975–2013 7 Real per capita national government expenditures on social services sectors, 25
1975–2013 (in 2000 prices) 8 National government expenditures on all economic services sectors and all 27
infrastructure sectors, as percentage of GDP, 1975–2013 9 National government revenue effort, 1975–2012 28 10 Excise tax revenues as percent of GDP 32 11 Composition of national government borrowing (%) 1996–2013 36 12 Composition of national government outstanding debt (%) 1996–2012 36 13 Distribution of national government outstanding debt, by maturity, 1996–2012 37 Appendix Table 1 National government expenditures, obligation basis, as a percentage of GDP, 42
1975–2013 2 Percentage distribution of national government expenditures, obligation 43
basis, by function or sectors, 1975–2013
vi
3 Percentage distribution of national government expenditures net of debt 44 service, by function or sectors, 1975–2013
4 Real per capita national government expenditures, obligation basis, 45 1975–2013 (in 2000 prices)
5 National government revenue effort, as percent of GDP, 1992–2012 46 Improvement of the Implementation Procedures and Management Systems for the Health Facilities Enhancement Grant of the Department of Health Table 1 HFEP budget, General Appropriations Act 49 2 Sources of fund for HFEP 51 3 HFEP criteria 54 4 Average number of days of release of funds 60 5 HFEP appropriations, allotments, and obligations 61 6 Physical accomplishment report, 2009 63 7 Physical accomplishment report, 2010 63 Figure 1 Flow of budget release 50 2 Process flow of approval for HFEP funding in 2010 53 3 Performance-based budgeting of hospitals 55 4 HFEP allocation per capita and poverty incidence 56 5 HFEP allocation per capita and population 57 6 Total HFEP expenditure and PIPH requirement 58 7 Budget utilization 61 Annex 1 Relationship between HFEP allocation and some key indicators, 68
by funding source 2 Maps of facilities for upgrading in 2011 75 3 Issuance of SAA from the date GAA was passed 83 4 Review of funding allocation under the MNCHN grants facility 84 Review of the Cheaper Medicines Program of the Philippines: Botika ng Barangay, Botika ng Bayan, PHP100 Treatment Pack, and the Role of PITC Pharma, Inc. in Government Drug Procurement Table 1 Price comparison (in peso equivalent) of three selected drugs 89
in the Philippines, India, and Pakistan, 2008 2 Price comparison (in peso equivalent) of four selected drugs 89
in the Philippines and India, 2010
vii
3 Median medicine price ratios for innovator brands and their generic equivalents 90 in the Philippines, in public and private sectors, 2002, 2005, and 2008/09
4 Percent of SWS-surveyed Filipino households that reported purchase of generic 91 and branded medicines, 2003 and 2008
5 Number of days that the lowest-paid government employee needs to work 91 to purchase one day’s worth of generic medicine, by type of condition, 2009
6 Urban and rural poor households with and without health insurance 93 based on data derived from proxy means test
7 Value of parallel drug imports (in USD million), 2000 to March 2010 98 8 BnBs by site, 2009 101 9 Regional distribution of BnBs and population/BnB in each region, 2009 103 10 Selling price of selected drugs between BnB and a leading private drugstore 106
chain, June 2006 11 Price comparison of retail prices between the BnB and The Generics 107
Pharmacy, as of April 2010 12 Selling price (PHP) of selected drugs among BnB, private generic, branded 108
generic, and innovator drugs, 2009 13 Price variations of three prescription and three over-the-counter drugs 109
in BnBs, 2009 14 Number of BnBs by sponsoring organization or individual, 2009 110 15 Functionality of BnBs using alternative definitions, 2009 111 16 Level of gross sales of BnBs, 2009 112 17 Proposed design for an impact evaluation of BnB and BNB 115 18 Number of BNB outlets by region and population/BNB, 2010 118 19 Types of BNB by major island group and number of BNBs that have closed, 120
as of end-2010 20 Estimated annual projected marginal statement of operations, in PHP 121 21 Drugs included in the PHP100 program and peso savings per treatment pack 123
relative to the common brand, 2010 22 Price comparison of PHP100 treatment pack with equivalent common brand 124
in Oriental Mindoro pilot and overall DOH, 2009 23 Funding of Treatment Pack Program by type of recipients and classification 128
of households 24 PITC procurement and distribution process for the BnB program 133 25 Proposed new procurement system for the PHP100 program 135 26 Variation of actual procurement price (PHP) of generic amoxicillin 137
and ranitidine at each procurement entity in NCR, Region IV-A, and Region IV-B, 2008
27 Price comparison of a sample of essential medicines among PITC generic, 137 branded generic, private sector generic, and innovator drugs, 2009 (PHP)
viii
Figure 1 Ratio of Philippine price to India price for selected medicines, 2004 and 2010 90 2 Percentage of household cash spending on drugs to total household spending 92
for medical care, by income decile, 2006 3 Maximum, average, and minimum prices of selected fast-moving drugs 96
in the Philippines (in PHP), May 26, 2010 4 Retailing of parallel drug imports in the Philippines 97 5 Annual and cumulative number of BnBs established, 2003–2010 100 6 Percentage of barangays with a BnB, by region, as of May 2010 103 7 Annual and cumulative number of BNBs established, 2005–2010 (end of year) 118 8 Percentage of cities and municipalities with BNB, by region, as of May 2010 119
ix
Foreword
We are pleased to present to the public this year’s edition of our Analysis of the President’s
Budget. This is the fifth release of the Philippine Institute for Development Studies’ (PIDS)
annual contribution to the promotion of sound fiscal policy. The budget analysis not only
presents a prognosis of the health of national government finances, it also analyzes how
appropriations have been distributed through the tedious budgeting process and whether or
not they lead to the attainment of the administration’s economic and social objectives. This
book outlines the government’s main priorities as indicated by amount of resources it is
willing to allocate to various projects and programs.
PIDS Senior Research Fellow Rosario G. Manasan provides us anew with a thorough
analysis of the 2013 budget, noting that the government has again arrived at a more balanced
budget distribution between social and economic services in an effort to achieve inclusive
growth. Social services, she notes, accounted for more than half of the increase in the 2013
National Expenditure Program. But while education has the biggest share of the increase, the
country’s basic education budget still pales in comparison with our peers in the region. Our
limited fiscal space is highlighted by the low priority given to national defense, a critical area
given current geopolitical issues. Manasan’s assessment nonetheless shows an encouraging
picture of the country’s deficit and debt situation. Expectations of high-than-target collections
by the Bureau of Internal Revenue, from an improved tax effort and incremental revenues
from excise taxes, should allow the government enough elbow room to meet its deficit target.
Analysis, meanwhile, shows that the national debt will exhibit a downward trajectory, and,
barring shocks, may even hit well below half of gross domestic product.
Two special papers accompany the main budget analysis in keeping with this year’s
focus on health expenditures. Senior Research Consultant Oscar F. Picazo reviews the
government’s cheaper medicines program (“Review of the Cheaper Medicines Program of
the Philippines: Botika ng Barangay, Botika ng Bayan, PHP100 Treatment Pack, and the
Role of PITC Pharma, Inc. in Government Drug Procurement”), and finds that Botika ng
Barangay (BnB) outlets have been successful in making the retail drug market more
contestable. But BnBs suffer from lack of financial and management support aside from
supply and sustainability issues. In the paper “Improvement of the Implementation
Procedures and Management Systems for the Health Facilities Enhancement Grant of the
Department of Health”, the research team led by Senior Research Fellow Rouselle F. Lavado
x
points to the inefficient allocation of funds in health facilities nationwide, and finds that
requests from politicians during budget deliberations as well as House and Senate initiatives
tend to divert resources away from provinces in most need of upgraded health facilities.
We thank Dr. Manasan as well as Mr. Picazo and Dr. Lavado for their work and for
continuing our yearly budget analysis. PIDS hopes that our Analysis of the President’s
Budget will continue to be a useful and relevant resource in the crafting of fiscal policy by the
Executive and Legislative branches of government and in engaging stakeholders through a
greater understanding of the national budget.
GILBERTO M. LLANTO
President, PIDS
xi
List of Acronyms
4Ps – Pantawid Pamilyang Pilipino Program ABC – authorized budget ceiling ACPC – Agricultural Credit Policy Council AHA – Aquino Health Agenda AO – Administrative Order AOPs – Annual Operation Plans ARMM – Autonomous Region in Muslim Mindanao BEmONC – Basic Emergency Obstetric and Newborn Care BESF – Budget of Expenditures and Sources of Financing BFAD – Bureau of Food and Drugs BFAR – Bureau of Fisheries and Aquatic Resources BHS – barangay health station BIR – Bureau of Internal Revenue BnB – Botika ng Barangay BNB – Botika ng Bayan BOC – Bureau of Customs BUB – bottom-up budgeting approach CAR – Cordillera Administrative Region CCT – conditional cash transfer CEmONC – Comprehensive Emergency Obstetric and Newborn Care CHD – Center for Health Development CMP – Cheaper Medicines Program CO – capital outlay COA – Commission on Audit COBAC – Central Office Bids and Awards Committee CON – Certificate of Need DA – Department of Agriculture DALY – daily-adjusted life years DBM – Department of Budget and Management DENR – Department of Environment and Natural Resources DepEd – Department of Education DO – Department Order DOH – Department of Health DM – Department Memorandum DPWH – Department of Public Works and Highways DRF – drug revolving fund DSWD – Department of Social Welfare and Development EO – Executive Order EU – European Union FDA – Food and Drug Administration
xii
FHO – Family Health Office FIMO – Field Implementation Management Office FUR – Fund Utilization Report GAA – General Appropriations Act GDP – gross domestic product GMAP – government-mediated access price GMP – Good Manufacturing Practice HFEP – Health Facilities Enhancement Program IP – Indigent Program IRA – internal revenue allotment IT – information technology LGU – local government unit MeTA – Medicines Transparency MMR – maternal mortality ratio MNCHN – Maternal, Newborn and Child Health and Nutrition MOOE – maintenance and other operating expenses MPR – median price ratio MRP – maximum retail price MSH – Management Sciences for Health NCHFD – National Center for Health Facility Development NCPAM – National Center for Pharmaceutical Access and Management NEP – National Expenditure Program NGO – nongovernment organization NHA – National Housing Authority OSEC – Office of the Secretary OTC – over the counter PAMANA – Payapa at Masaganang Pamayanan PB – President’s Budget PBB – Performance-Based Budgeting PCA – Philippine Crop Authority PCIC – Philippine Crop Insurance Corporation PCP – primary care provider PCSO – Philippine Charity Sweepstakes Office PDAF – Priority Development Assistance Fund PDI – parallel drug importation PGSO – Provincial General Services Office PHAP – Pharmaceutical Healthcare Association of the Philippines PHO – Provincial Health Office PIDS – Philippine Institute for Development Studies PIPH – Province-wide Investment Plan for Health PITC – Philippine International Trading Corp. PNDF – Philippine National Drug Formulary PNP – Philippine National Police
xiii
PR – Purchase Request RA – Republic Act RatPlan – Rationalization Plan RHU – rural health unit RSBSA – Registry System for Basic Sectors in Agriculture SAA – Sub-Allotment Advice SARO – Special Allotment Release Order SONA – state of the nation address SSL3 – Salary Standardization Law Phase 3 SUCs – state universities and colleges TGP – The Generics Pharmacy VAT – value-added tax WHO – World Health Organization WTO – World Trade Organization ZBB – zero-based budgeting
1
Analysis of the President’s Budget for 2013
Rosario G. Manasan
Introduction This paper evaluates the President’s Budget (PB) or the National Expenditure Program (NEP)
for 2013. The assessment is composed of four parts: (i) an evaluation of the overall fiscal
picture as projected in the 2013 Budget of Expenditures and Sources of Financing (BESF);
(ii) an examination of its revenue program; (iii) an appraisal of the expenditure program
embodied in the NEP; and (iv) an analysis of the financing program.
The national government’s fiscal position in any given year (by showing whether the
government has a surplus or a deficit) provides an overall measure of the fiscal health of the
nation. Thus, Section 2 evaluates the likelihood that the estimate of the fiscal deficit that is
targeted in the PB will be met. At the same time, it also assesses if the projected fiscal
position will lead to greater fiscal instability.
Section 3 assesses the Aquino II administration’s expenditure priorities relative to its
policy pronouncements and the overarching imperative for inclusive growth. Section 4
presents an analysis of the present administration’s revenue program in support of the 2012
PB. Section 5 provides an assessment of the government’s borrowing program.
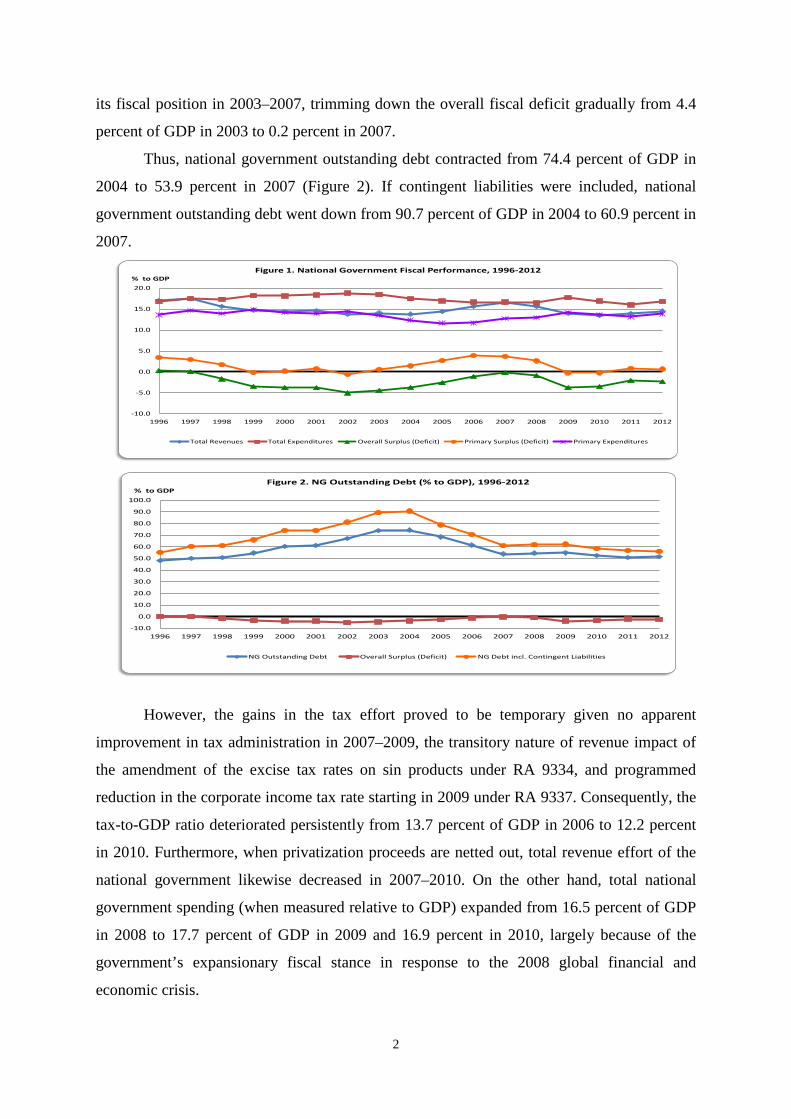
Overall Fiscal Position in Perspective The national government fiscal position deteriorated quite rapidly and continuously, from
small surpluses in 1996 and 1997 to deficits that grew from 1.9 percent of the gross domestic
product (GDP) in 1998 to an average of 3.7 percent in 1999–2001 and 5.0 percent in 2002
following the Asian financial crisis (Figure 1). A combination of expenditure compression
and increased tax effort resulting from the enactment of new tax measures in 2004/20051
subsequently enabled the national government to achieve considerable progress in improving 1 Republic Act (RA) No. 9334, which amended excise tax rates on sin products, was legislated in late 2004 and took effect in January 2005. On the other hand, RA No. 9337, otherwise known as the Reformed VAT Law, was legislated in the first half of 2005 and took effect in the last quarter of that year. RA 9337 not only expanded the coverage of the valued-added tax (VAT) but also provided for an increase in the gross receipts tax (on royalties, rentals of property, real or personal, profits from exchange, and all other items treated as gross income) of banks and nonbank financial intermediaries from 5 percent to 7 percent and a temporary increase in the corporate tax rate from 32 percent to 35 percent. Moreover, RA 9337 also enabled the president to authorize the increase in the VAT rate from 10 percent to 12 percent in January 2006.
2
its fiscal position in 2003–2007, trimming down the overall fiscal deficit gradually from 4.4
percent of GDP in 2003 to 0.2 percent in 2007.
Thus, national government outstanding debt contracted from 74.4 percent of GDP in
2004 to 53.9 percent in 2007 (Figure 2). If contingent liabilities were included, national
government outstanding debt went down from 90.7 percent of GDP in 2004 to 60.9 percent in
2007.
-10.0
-5.0
0.0
5.0
10.0
15.0
20.0
1996 1997 1998 1999 2000 2001 2002 2003 2004 2005 2006 2007 2008 2009 2010 2011 2012
% to GDPFigure 1. National Government Fiscal Performance, 1996-2012
Total Revenues Total Expenditures Overall Surplus (Deficit) Primary Surplus (Deficit) Primary Expenditures
-10.0
0.0
10.0
20.0
30.0
40.0
50.0
60.0
70.0
80.0
90.0
100.0
1996 1997 1998 1999 2000 2001 2002 2003 2004 2005 2006 2007 2008 2009 2010 2011 2012
% to GDPFigure 2. NG Outstanding Debt (% to GDP), 1996-2012
NG Outstanding Debt Overall Surplus (Deficit) NG Debt incl. Contingent Liabilities
However, the gains in the tax effort proved to be temporary given no apparent
improvement in tax administration in 2007–2009, the transitory nature of revenue impact of
the amendment of the excise tax rates on sin products under RA 9334, and programmed
reduction in the corporate income tax rate starting in 2009 under RA 9337. Consequently, the
tax-to-GDP ratio deteriorated persistently from 13.7 percent of GDP in 2006 to 12.2 percent
in 2010. Furthermore, when privatization proceeds are netted out, total revenue effort of the
national government likewise decreased in 2007–2010. On the other hand, total national
government spending (when measured relative to GDP) expanded from 16.5 percent of GDP
in 2008 to 17.7 percent of GDP in 2009 and 16.9 percent in 2010, largely because of the
government’s expansionary fiscal stance in response to the 2008 global financial and
economic crisis.
3
As a result, the fiscal deficit went up once again from 0.2 percent of GDP in 2007 and
0.9 percent in 2008 to 3.7 percent in 2009 and 3.5 percent in 2010. Moreover, the national
government incurred small primary deficits in 2009 and 2010, indicating that the government
had to borrow some more to cover its interest payments. As a result, the national
government’s outstanding debt rose from 53.9 percent of GDP in 2007 to 54.7 percent of
GDP in 2008 and 54.8 percent in 2009 before declining to 52.4 percent in 2010 (Figure 2). If
contingent liabilities were included, total outstanding debt went up from 60.9 percent of GDP
in 2007 to 61.7 percent in 2008 and 62.4 percent in 2009 before contracting to 58.5 percent in
2010.
The Bureau of Internal Revenue (BIR) exhibited creditable progress toward
improving its tax effort in 2011, despite the fact that no new tax measures were implemented
during the first two years of the Aquino II administration. Thus, BIR tax effort went up from
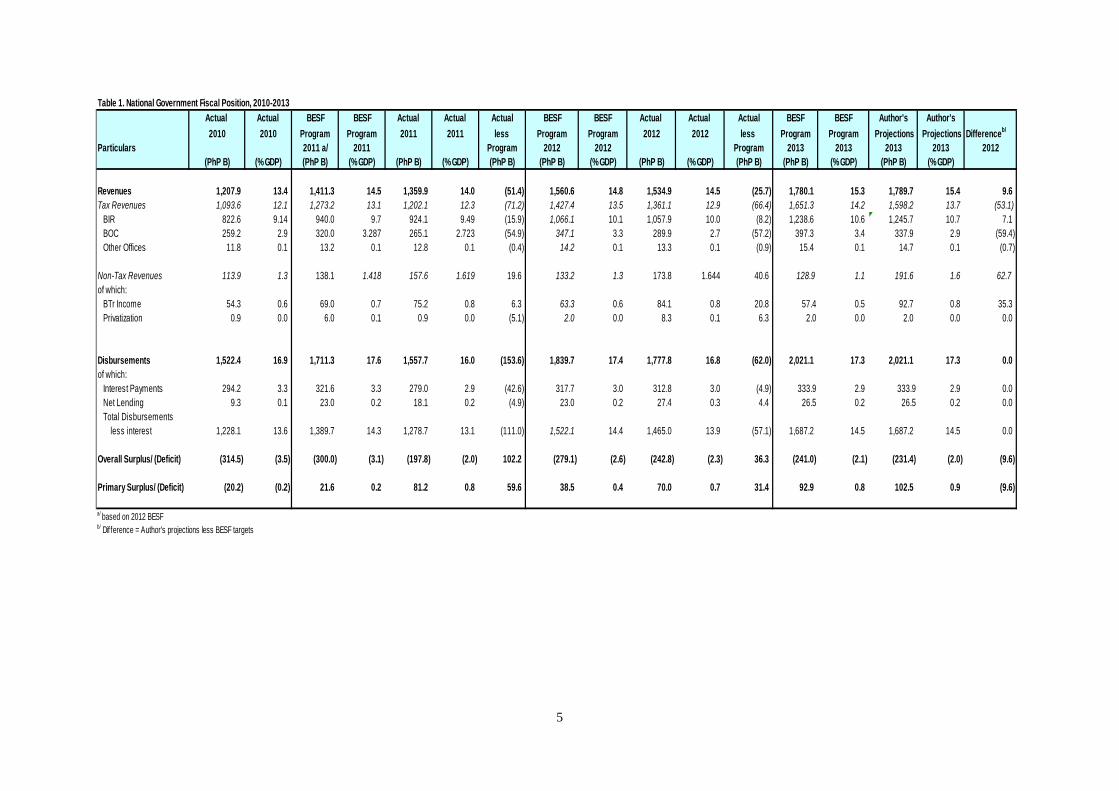
9.1 percent of GDP in 2010 to 9.5 percent in 2011 and 10.0 percent in 2012 (Table 1).
Similarly, nontax revenue effort went up from 1.3 percent of GDP in 2010 to 1.6 percent in
2011–2012. In contrast, the Bureau of Customs (BOC) failed to show similar success in
improving its tax effort; its collections contracted from 2.9 percent of GDP in 2010 to 2.7
percent in 2011 and 2012. Nonetheless, the overall revenue effort of the national government
rose from 13.4 percent in 2010 to 14.0 percent in 2011 and 14.5 percent in 2012 as the
expansion in BIR tax effort and nontax revenue effort swamped the contraction in BOC tax
effort in 2010–2012.
On the other hand, national government expenditures were significantly lower than
what was programmed in 2011 largely because of delays in the implementation of projects as
the new administration reviewed and at times even cancelled the contracts of many
infrastructure projects,2 and partly because of lower interest payments due to the lower-than-
projected foreign exchange rate and interest rate. To wit, national government expenditures
2 A report by the Philippine Center for Investigative Journalism showed that efforts to improve the procurement process at the Department of Public Works and Highways (DPWH) yielded significant cost savings (Landingin 2012). For instance, it found that the contract price for some 14 projects that were cancelled in July 2010 and subsequently rebidded was, on average, 34 percent lower than their original cost. The report also found indications that the bidding/procurement process at the DPWH has become more competitive. In particular, the study reveals that the average number of bidders for projects worth PHP 50 million and above rose from 1.3 under the Arroyo administration to 4.4 under the Aquino II administration while for projects worth less than PHP 50 million, it increased from 1.3 bidders to 2.4 bidders. Also, the difference between the authorized budget ceiling (ABC) and the lowest bid for larger projects went up from 4 percent under the Arroyo administration to 11 percent under the Aquino II administration while the difference between the ABC and the lowest bid for smaller projects rose from 1 percent to 5 percent.
4
stood at 16.0 percent of GDP in 2011, more than 1.2 percentage points of GDP lower than
programmed and 0.9 percentage point of GDP lower than the 2010 level.3 National
government expenditures continued to be below the programmed level in 2012, albeit to a
smaller degree than in the previous year. To wit, actual national government expenditures
were equal to 16.8 percent of GDP in 2012 compared to the programmed level of 17.4
percent of GDP (Table 1). Thus, the government was able to trim down the fiscal deficit to
2.0 percent of GDP in 2011 (more than 1 percentage point lower than the 3.1% level that was
originally programmed) and 2.3 percent of GDP in 2012 (lower than the programmed level
but higher than the 2011 level). Consequently, outstanding national government debt
decreased from 52.4 percent of GDP in 2010 to 50.9 percent in 2011 but increased to 51.4
percent in 2012 (Figure 2).
National government fiscal program for 2013
The PB assumes that the BIR tax revenues will grow from PHP 1.06 trillion in 2012 to PHP
1.24 trillion in 2013. In contrast, this paper projects BIR collections to reach PHP 1.26 trillion
in 2013 (Table 1). This higher projection is based on the assumption that BIR is able to
improve its tax effort by another 0.4 percentage point of GDP in 2013 in the same manner it
did in 2011 and 2012. It also takes into account the passage of the amendments to the excise
tax law on sin products that is expected to yield an additional revenue of PHP 34 billion in
2013.4
As to BOC collections, the PB’s forecast is PHP 397 billion or 3.3 percent of GDP5 in
2013. However, this paper’s projection is PHP 338 billion or 2.9 percent of GDP, which is
equal to the actual BOC effort in 2010.
The PB projects nontax revenues to be equal to PHP 129 billion or 1.1 percent of
GDP in 2013. In contrast, this paper projects higher nontax revenues amounting to PHP 192
billion or 1.6 percent of GDP, which is equal to the actual tax effort in 2011 and 2012.
3 National government underspending (i.e., spending below the programmed level) in 2011 has contributed to the lackluster economic growth during that year. 4 It should be emphasized that the BESF revenue projections were reckoned relative to the higher GDP growth projections for both 2012 and 2013. The BESF assumed that GDP will grow in nominal terms by 10.3 percent in 2012 and by 11.3 percent in 2013. As it turned out, GDP actually grew by 8.6 percent in nominal terms in 2012.son, this pape assumes that GDP will grow by 6 percent in real terms while inflation is assumed to 4 percent in 2013. Thus, GDP is projected to grow by 10.2 percent in nominal terms in 2013. 5 This ratio is reckoned relative to the BESF’s GDP projection. Note that the figure shown in Table 1 is higher because of the lower GDP projection used in this paper.
5
Table 1. National Government Fiscal Position, 2010-2013Actual Actual BESF BESF Actual Actual Actual BESF BESF Actual Actual Actual BESF BESF Author's Author's2010 2010 Program Program 2011 2011 less Program Program 2012 2012 less Program Program Projections Projections Differenceb/
Particulars 2011 a/ 2011 Program 2012 2012 Program 2013 2013 2013 2013 2012(PhP B) (% GDP) (PhP B) (% GDP) (PhP B) (% GDP) (PhP B) (PhP B) (% GDP) (PhP B) (% GDP) (PhP B) (PhP B) (% GDP) (PhP B) (% GDP)
Revenues 1,207.9 13.4 1,411.3 14.5 1,359.9 14.0 (51.4) 1,560.6 14.8 1,534.9 14.5 (25.7) 1,780.1 15.3 1,789.7 15.4 9.6Tax Revenues 1,093.6 12.1 1,273.2 13.1 1,202.1 12.3 (71.2) 1,427.4 13.5 1,361.1 12.9 (66.4) 1,651.3 14.2 1,598.2 13.7 (53.1) BIR 822.6 9.14 940.0 9.7 924.1 9.49 (15.9) 1,066.1 10.1 1,057.9 10.0 (8.2) 1,238.6 10.6 1,245.7 10.7 7.1 BOC 259.2 2.9 320.0 3.287 265.1 2.723 (54.9) 347.1 3.3 289.9 2.7 (57.2) 397.3 3.4 337.9 2.9 (59.4) Other Offices 11.8 0.1 13.2 0.1 12.8 0.1 (0.4) 14.2 0.1 13.3 0.1 (0.9) 15.4 0.1 14.7 0.1 (0.7)
Non-Tax Revenues 113.9 1.3 138.1 1.418 157.6 1.619 19.6 133.2 1.3 173.8 1.644 40.6 128.9 1.1 191.6 1.6 62.7of which: BTr Income 54.3 0.6 69.0 0.7 75.2 0.8 6.3 63.3 0.6 84.1 0.8 20.8 57.4 0.5 92.7 0.8 35.3 Privatization 0.9 0.0 6.0 0.1 0.9 0.0 (5.1) 2.0 0.0 8.3 0.1 6.3 2.0 0.0 2.0 0.0 0.0
Disbursements 1,522.4 16.9 1,711.3 17.6 1,557.7 16.0 (153.6) 1,839.7 17.4 1,777.8 16.8 (62.0) 2,021.1 17.3 2,021.1 17.3 0.0of which: Interest Payments 294.2 3.3 321.6 3.3 279.0 2.9 (42.6) 317.7 3.0 312.8 3.0 (4.9) 333.9 2.9 333.9 2.9 0.0 Net Lending 9.3 0.1 23.0 0.2 18.1 0.2 (4.9) 23.0 0.2 27.4 0.3 4.4 26.5 0.2 26.5 0.2 0.0 Total Disbursements less interest 1,228.1 13.6 1,389.7 14.3 1,278.7 13.1 (111.0) 1,522.1 14.4 1,465.0 13.9 (57.1) 1,687.2 14.5 1,687.2 14.5 0.0
Overall Surplus/ (Deficit) (314.5) (3.5) (300.0) (3.1) (197.8) (2.0) 102.2 (279.1) (2.6) (242.8) (2.3) 36.3 (241.0) (2.1) (231.4) (2.0) (9.6)
Primary Surplus/ (Deficit) (20.2) (0.2) 21.6 0.2 81.2 0.8 59.6 38.5 0.4 70.0 0.7 31.4 92.9 0.8 102.5 0.9 (9.6)
a/ based on 2012 BESFb/ Difference = Author's projections less BESF targets
6
In summary, this paper projects total national government revenues to be equal to
PHP 1.8 trillion (or 15.4% of GDP) in 2013. This value is PHP 9.6 billion higher than the
BESF’s projection. As a corollary, this paper projects that the fiscal deficit is PHP 9.6 billion
lower than that of the BESF which is at PHP 231 billion (or 2.0% of GDP).6
Fiscal sustainability in the medium term
Fiscal deficits per se are not bad. However, persistently large fiscal deficits may lead to fiscal
instability. As government debt accumulates over time, interest payments on the debt may
increase because the government pays interest not only on debt that it had in the past but also
on the new debt that was issued to cover the deficit of the current year. This results in even
larger fiscal deficits and even higher levels of government debt stock, leading to an explosive
situation where fiscal deficit feeds on itself. In this subsection, the sustainability of the fiscal
policy is evaluated in terms of its ability to stabilize the ratio of government debt to GDP.
Anand and van Wijbergen (1989), Catsambas and Pigato (1989), and Fedelino et al.
(2009) have established that the change in the debt-to-GDP ratio depends on the
interrelationship among the GDP growth rate, domestic real interest rate, rate of inflation,
foreign interest rate, exchange rate, stock of domestic and foreign government debt at the
start of the period, and primary deficit. The said relationship suggests that the higher the
domestic real interest rate and the lower the GDP growth rate, the more likely is the rise in
the debt-to-GDP ratio. Similarly, the higher the foreign interest rate, the higher the
depreciation of the exchange rate. The lower the domestic inflation rate, the greater is the
tendency of the debt-to-GDP ratio to increase.
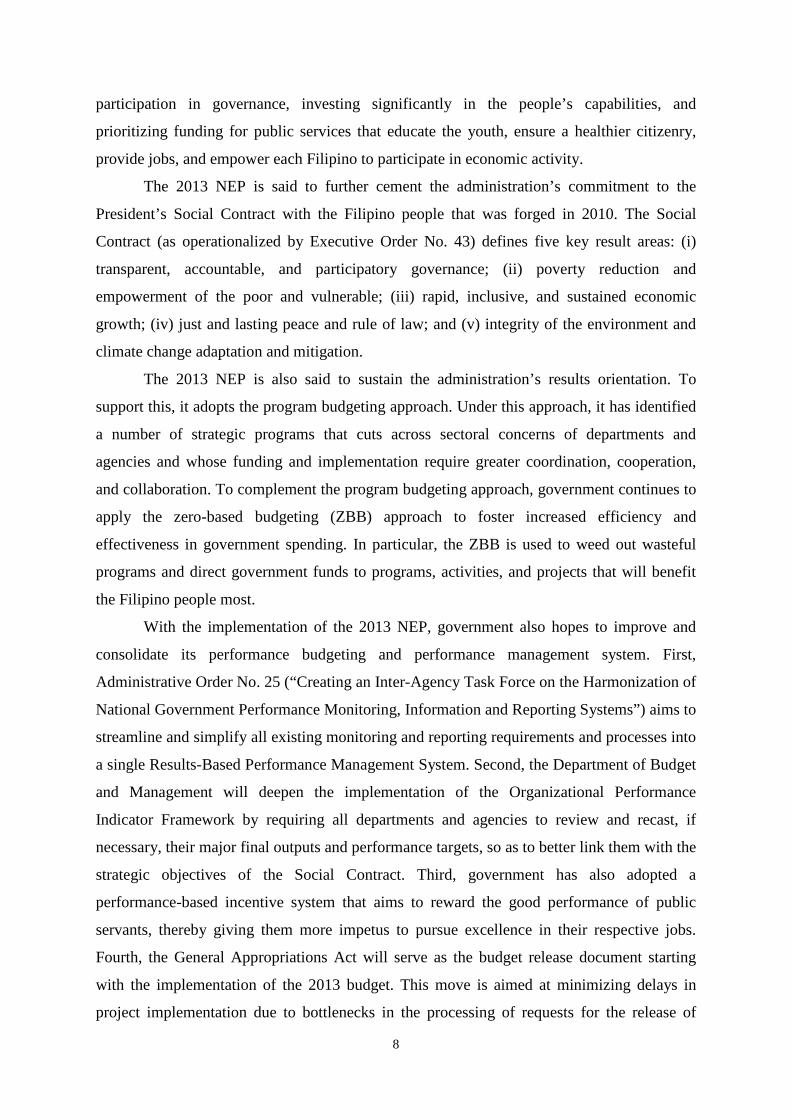
The debt sustainability analysis that was undertaken for this paper suggests that if the
overall tax effort gradually improves to 16 percent of GDP in 2016, and if aggregate national
government expenditures gradually expands to 18 percent of GDP in the same year as
indicated in the government’s medium-term fiscal program, national government debt-to-
GDP ratio will contract from 51.4 percent of GDP in 2012 to 41.7 percent in 2016 while the
fiscal deficit is maintained at about 2 percent of GDP in 2014–2016. In more specific terms,
if the overall revenue effort were to increase by 0.2 percentage point of GDP yearly from
2014 onwards after rising by 0.9 percent of GDP in 2013 following the enactment of the new
sin tax law, and if non-interest expenditures were to rise by 0.3 percentage point of GDP from
2014 onwards while assuming that (i) GDP will grow by 6 percent in 2013, 5.5 percent in
6 This paper takes the expenditure projection of the BESF for 2013 as a given.
7
2014, and 5 percent yearly in 2015–2017, (ii) inflation remains steady at 4 percent yearly in
2013–2017, (iii) interest rate on government debt stays at the 2012/2013 level, and (iv) the
foreign exchange rate stays at PHP 41.50 to the dollar, then the level of fiscal deficit will
initially rise from 1.2 percent of GDP in 2013 to 2.0 percent of GDP in 2014–2017 (Table 2).
Despite said increase in the overall fiscal deficit during the period, the national debt stock is
projected to exhibit a downward trajectory, going down 51.4 percent of GDP in 2012 to 47.5
percent in 2013 and 40.3 percent in 2017.
Table 2. Debt Sustainability Simulation, 2013-2017
2011 2012 2013 2014 2015 2016 2017actual actual projected projected projected projected projected
Assume:NG total revenues (in billion pesos) 1,359.9 1,534.9 1,789.7 1,990.9 2,203.8 2,438.9 2,698.7 % to GDP 14.0 14.5 15.4 15.6 15.8 16.0 16.2
Non-interest expd (in billion pesos) 1,278.7 1,465.0 1,687.2 1,895.9 2,119.2 2,367.5 2,643.6 % to GDP 13.1 13.9 14.5 14.8 15.2 15.5 15.9
Interest payments (in billion pesos) 279.0 312.8 333.9 344.5 360.1 377.2 396.3 % to GDP 2.9 3.0 2.9 2.7 2.6 2.5 2.4
Implied fiscal deficit & NG outstanding debt:Fiscal deficit (in billion pesos) 197.8 242.8 140.8 249.6 275.5 305.8 341.2 % to GDP 2.0 2.3 1.2 2.0 2.0 2.0 2.0
NG outstanding debt (in million pesos) 4,951.2 5,437.1 5,530.5 5,780.0 6,055.5 6,361.4 6,702.6 % to GDP 50.9 51.4 47.5 45.2 43.4 41.7 40.3 a/ assumes NG total revenues will increase to 16% of GDP in 2016% ; non-interest expenditures to be equal to 14.5% of GDP in 2013 rising by 0.35% of GDP every year from 2014 onwards; GDP will grow by 6% in 2013, 5.5% in 2014 and 5% yearly in 2015-2017; inflation remains steady at 4% yearly in 2013 onwards; average interest rate on government debt to be equal to the average in 2012 and 2013; foreign exchange rate to be equal to PhP 41.50 to the dollar in 2013-2017
Alternative simulations show that the debt-to-GDP ratio will start to rise by 2016 after
declining from 51.4 percent of GDP in 2012 to 47.8 percent in 2015 if there is a simultaneous
reduction in the GDP growth rate by 1-percentage point, a 2-percentage point increase in
interest rate, and a PHP 2 depreciation in the foreign exchange rate given the revenue and
expenditure program described above. On the other hand, if any of the aforementioned
shocks were to occur singly, debt sustainability will still be attained, albeit the debt-to-GDP
ratio will be higher than shown in Table 2.
Expenditure Program
The President’s Budget Message for 2013 very clearly states that the 2013 budget is an
empowerment budget. It views the 2013 budget as “a crucial step in the government’s pursuit
of good governance—governance that will give our impoverished countrymen the
opportunity to lift themselves out of their situations.” To this end, it envisions that the budget
will empower the people, particularly the poor, by creating more opportunities for public
8
participation in governance, investing significantly in the people’s capabilities, and
prioritizing funding for public services that educate the youth, ensure a healthier citizenry,
provide jobs, and empower each Filipino to participate in economic activity.
The 2013 NEP is said to further cement the administration’s commitment to the
President’s Social Contract with the Filipino people that was forged in 2010. The Social
Contract (as operationalized by Executive Order No. 43) defines five key result areas: (i)
transparent, accountable, and participatory governance; (ii) poverty reduction and
empowerment of the poor and vulnerable; (iii) rapid, inclusive, and sustained economic
growth; (iv) just and lasting peace and rule of law; and (v) integrity of the environment and
climate change adaptation and mitigation.
The 2013 NEP is also said to sustain the administration’s results orientation. To
support this, it adopts the program budgeting approach. Under this approach, it has identified
a number of strategic programs that cuts across sectoral concerns of departments and
agencies and whose funding and implementation require greater coordination, cooperation,
and collaboration. To complement the program budgeting approach, government continues to
apply the zero-based budgeting (ZBB) approach to foster increased efficiency and
effectiveness in government spending. In particular, the ZBB is used to weed out wasteful
programs and direct government funds to programs, activities, and projects that will benefit
the Filipino people most.
With the implementation of the 2013 NEP, government also hopes to improve and
consolidate its performance budgeting and performance management system. First,
Administrative Order No. 25 (“Creating an Inter-Agency Task Force on the Harmonization of
National Government Performance Monitoring, Information and Reporting Systems”) aims to
streamline and simplify all existing monitoring and reporting requirements and processes into
a single Results-Based Performance Management System. Second, the Department of Budget
and Management will deepen the implementation of the Organizational Performance
Indicator Framework by requiring all departments and agencies to review and recast, if
necessary, their major final outputs and performance targets, so as to better link them with the
strategic objectives of the Social Contract. Third, government has also adopted a
performance-based incentive system that aims to reward the good performance of public
servants, thereby giving them more impetus to pursue excellence in their respective jobs.
Fourth, the General Appropriations Act will serve as the budget release document starting
with the implementation of the 2013 budget. This move is aimed at minimizing delays in
project implementation due to bottlenecks in the processing of requests for the release of
9
allotments. In line with this, government agencies have been advised to conduct
preprocurement activities in the fourth quarter of 2012, in anticipation of Congress’ approval
of this proposed budget so that contracts can then be awarded on the first working day of the
following fiscal year. Fifth, all appropriations will have a validity of one year starting in
2013. This measure is meant to improve the predictability of the budget execution process as
the system moves away from a policy that allows the carry-over of appropriations for
maintenance expenditures and capital outlays to the following fiscal year. Sixth, the
administration introduced the bottom-up budgeting approach (BUB) to provide the grassroots
with a voice in the allocation of public funds. Under the BUB, the 609 poorest municipalities
were asked to develop Local Poverty Reduction Action Plans with local communities and
civil society organizations in their jurisdictions. These plans were then submitted to the
national budget for inclusion in the 2013 budget. A total of 593 of these municipalities
submitted plans for community-determined, antipoverty interventions (such as agriculture
and fisheries support, potable water supply, public health care, and basic education) worth a
total of PHP 8.37 billion.
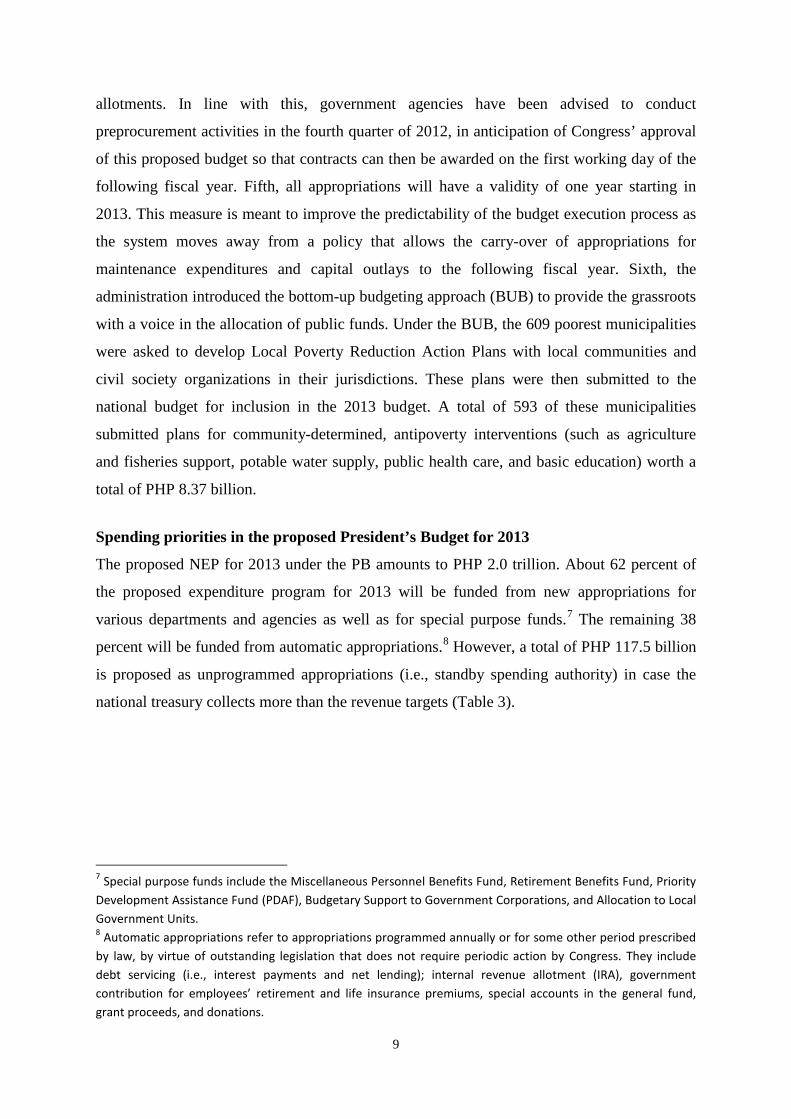
Spending priorities in the proposed President’s Budget for 2013
The proposed NEP for 2013 under the PB amounts to PHP 2.0 trillion. About 62 percent of
the proposed expenditure program for 2013 will be funded from new appropriations for
various departments and agencies as well as for special purpose funds.7 The remaining 38
percent will be funded from automatic appropriations.8 However, a total of PHP 117.5 billion
is proposed as unprogrammed appropriations (i.e., standby spending authority) in case the
national treasury collects more than the revenue targets (Table 3).
7 Special purpose funds include the Miscellaneous Personnel Benefits Fund, Retirement Benefits Fund, Priority Development Assistance Fund (PDAF), Budgetary Support to Government Corporations, and Allocation to Local Government Units. 8 Automatic appropriations refer to appropriations programmed annually or for some other period prescribed by law, by virtue of outstanding legislation that does not require periodic action by Congress. They include debt servicing (i.e., interest payments and net lending); internal revenue allotment (IRA), government contribution for employees’ retirement and life insurance premiums, special accounts in the general fund, grant proceeds, and donations.
10
Table 3. 2013 National Budget Program (in million pesos)
Amount % dist.
New General Appropriations Departments and Agencies 959,927 Special Purpose Funds 408,402 Total, New General Appropriations 1,368,329 Less: Unprogrammed Appropriations 117,548 Total, Programmed New Appropriations 1,250,781 62.4
Automatic Appropriations 755,219 37.6Total Expenditure Program 2,006,000 100.0
Source: 2013 National Expenditure Program
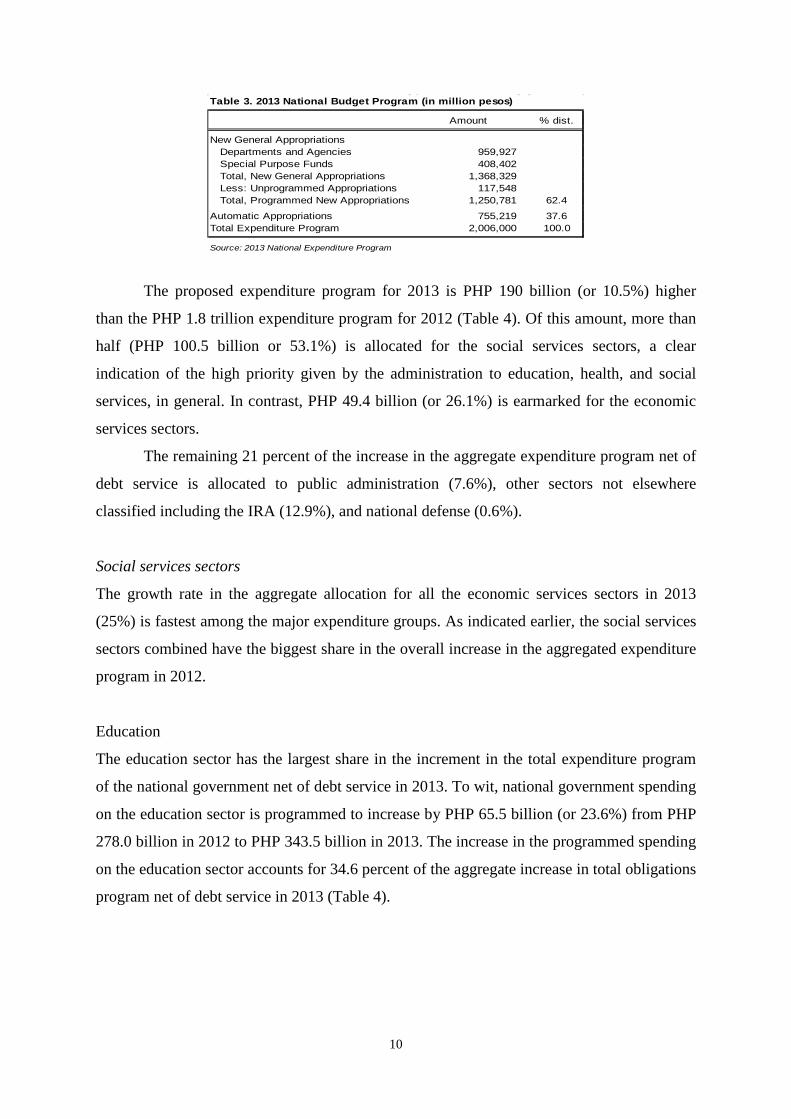
The proposed expenditure program for 2013 is PHP 190 billion (or 10.5%) higher
than the PHP 1.8 trillion expenditure program for 2012 (Table 4). Of this amount, more than
half (PHP 100.5 billion or 53.1%) is allocated for the social services sectors, a clear
indication of the high priority given by the administration to education, health, and social
services, in general. In contrast, PHP 49.4 billion (or 26.1%) is earmarked for the economic
services sectors.
The remaining 21 percent of the increase in the aggregate expenditure program net of
debt service is allocated to public administration (7.6%), other sectors not elsewhere
classified including the IRA (12.9%), and national defense (0.6%).
Social services sectors
The growth rate in the aggregate allocation for all the economic services sectors in 2013
(25%) is fastest among the major expenditure groups. As indicated earlier, the social services
sectors combined have the biggest share in the overall increase in the aggregated expenditure
program in 2012.
Education
The education sector has the largest share in the increment in the total expenditure program
of the national government net of debt service in 2013. To wit, national government spending
on the education sector is programmed to increase by PHP 65.5 billion (or 23.6%) from PHP
278.0 billion in 2012 to PHP 343.5 billion in 2013. The increase in the programmed spending
on the education sector accounts for 34.6 percent of the aggregate increase in total obligations
program net of debt service in 2013 (Table 4).
11
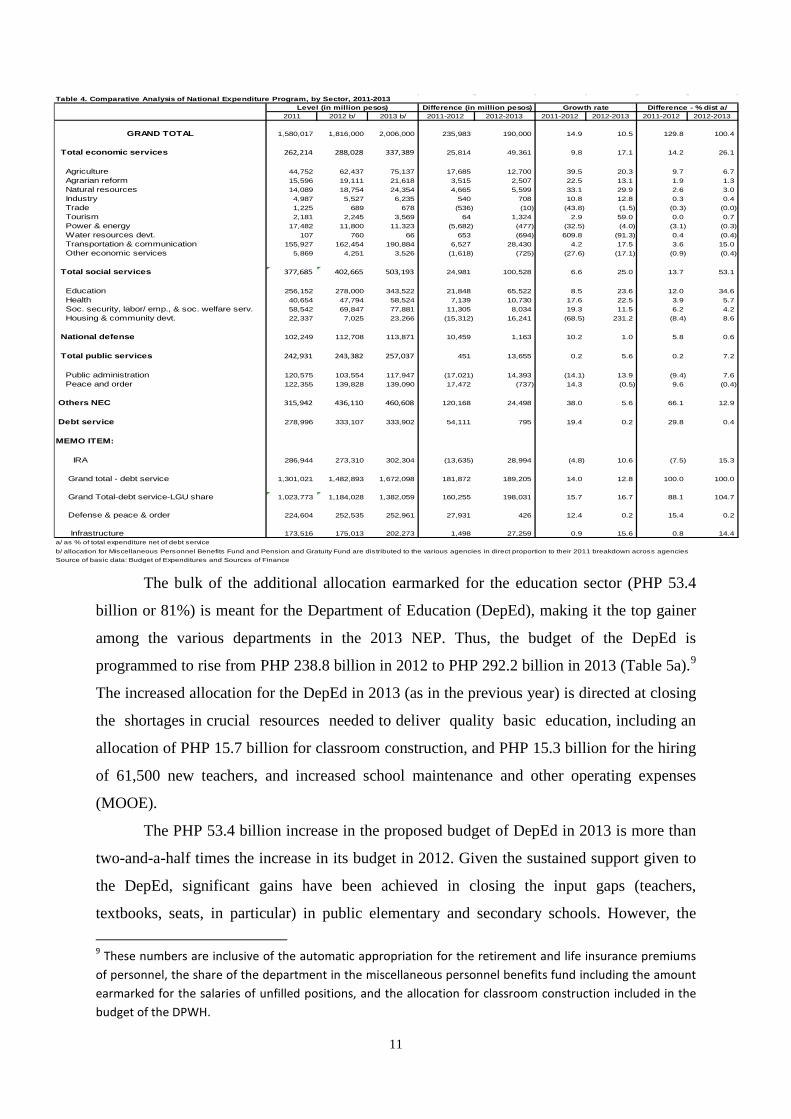
Table 4. Comparative Analysis of National Expenditure Program, by Sector, 2011-2013
2011 2012 b/ 2013 b/ 2011-2012 2012-2013 2011-2012 2012-2013 2011-2012 2012-2013
GRAND TOTAL 1,580,017 1,816,000 2,006,000 235,983 190,000 14.9 10.5 129.8 100.4
Total economic services 262,214 288,028 337,389 25,814 49,361 9.8 17.1 14.2 26.1
Agriculture 44,752 62,437 75,137 17,685 12,700 39.5 20.3 9.7 6.7 Agrarian reform 15,596 19,111 21,618 3,515 2,507 22.5 13.1 1.9 1.3 Natural resources 14,089 18,754 24,354 4,665 5,599 33.1 29.9 2.6 3.0 Industry 4,987 5,527 6,235 540 708 10.8 12.8 0.3 0.4 Trade 1,225 689 678 (536) (10) (43.8) (1.5) (0.3) (0.0) Tourism 2,181 2,245 3,569 64 1,324 2.9 59.0 0.0 0.7 Power & energy 17,482 11,800 11,323 (5,682) (477) (32.5) (4.0) (3.1) (0.3) Water resources devt. 107 760 66 653 (694) 609.8 (91.3) 0.4 (0.4) Transportation & communication 155,927 162,454 190,884 6,527 28,430 4.2 17.5 3.6 15.0 Other economic services 5,869 4,251 3,526 (1,618) (725) (27.6) (17.1) (0.9) (0.4)
Total social services 377,685 402,665 503,193 24,981 100,528 6.6 25.0 13.7 53.1
Education 256,152 278,000 343,522 21,848 65,522 8.5 23.6 12.0 34.6 Health 40,654 47,794 58,524 7,139 10,730 17.6 22.5 3.9 5.7 Soc. security, labor/ emp., & soc. welfare serv. 58,542 69,847 77,881 11,305 8,034 19.3 11.5 6.2 4.2 Housing & community devt. 22,337 7,025 23,266 (15,312) 16,241 (68.5) 231.2 (8.4) 8.6
National defense 102,249 112,708 113,871 10,459 1,163 10.2 1.0 5.8 0.6
Total public services 242,931 243,382 257,037 451 13,655 0.2 5.6 0.2 7.2
Public administration 120,575 103,554 117,947 (17,021) 14,393 (14.1) 13.9 (9.4) 7.6 Peace and order 122,355 139,828 139,090 17,472 (737) 14.3 (0.5) 9.6 (0.4)
Others NEC 315,942 436,110 460,608 120,168 24,498 38.0 5.6 66.1 12.9
Debt service 278,996 333,107 333,902 54,111 795 19.4 0.2 29.8 0.4
MEMO ITEM:
IRA 286,944 273,310 302,304 (13,635) 28,994 (4.8) 10.6 (7.5) 15.3
Grand total - debt service 1,301,021 1,482,893 1,672,098 181,872 189,205 14.0 12.8 100.0 100.0
Grand Total-debt service-LGU share 1,023,773 1,184,028 1,382,059 160,255 198,031 15.7 16.7 88.1 104.7
Defense & peace & order 224,604 252,535 252,961 27,931 426 12.4 0.2 15.4 0.2
Infrastructure 173,516 175,013 202,273 1,498 27,259 0.9 15.6 0.8 14.4a/ as % of total expenditure net of debt service
Source of basic data: Budget of Expenditures and Sources of Financeb/ allocation for Miscellaneous Personnel Benefits Fund and Pension and Gratuity Fund are distributed to the various agencies in direct proportion to their 2011 breakdown across agencies
Level (in million pesos) Difference (in million pesos) Growth rate Difference - % dist a/
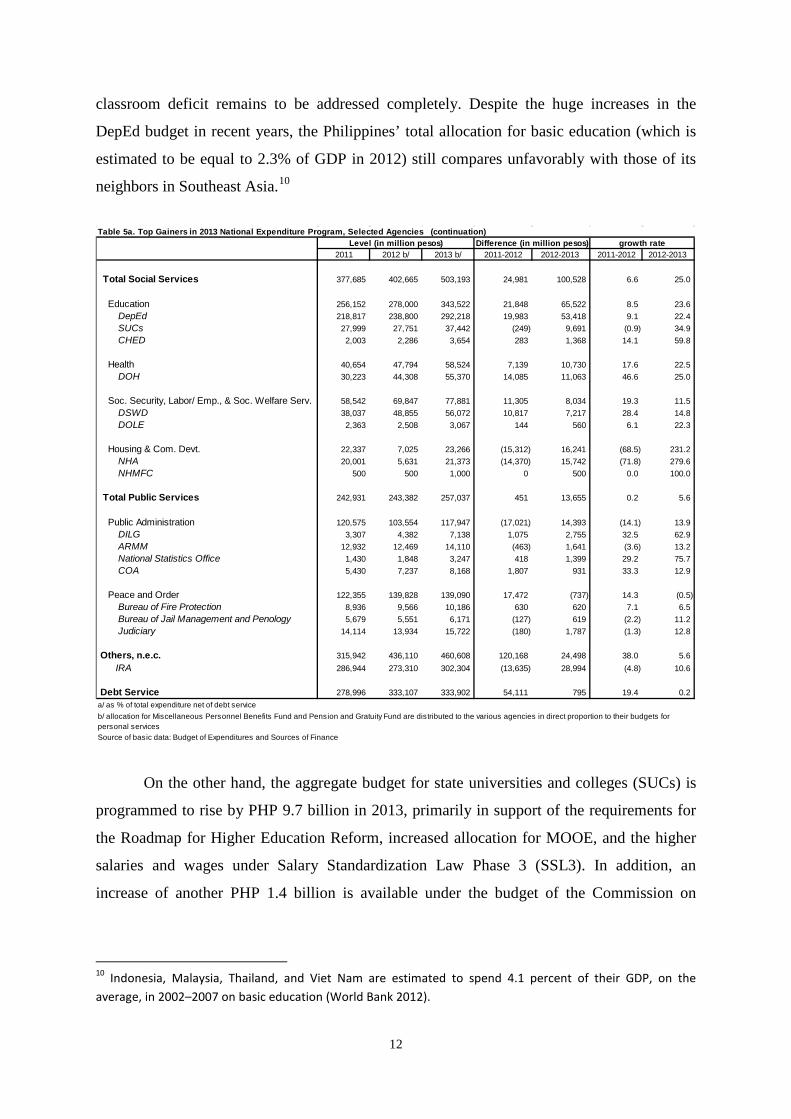
The bulk of the additional allocation earmarked for the education sector (PHP 53.4
billion or 81%) is meant for the Department of Education (DepEd), making it the top gainer
among the various departments in the 2013 NEP. Thus, the budget of the DepEd is
programmed to rise from PHP 238.8 billion in 2012 to PHP 292.2 billion in 2013 (Table 5a).9
The increased allocation for the DepEd in 2013 (as in the previous year) is directed at closing
the shortages in crucial resources needed to deliver quality basic education, including an
allocation of PHP 15.7 billion for classroom construction, and PHP 15.3 billion for the hiring
of 61,500 new teachers, and increased school maintenance and other operating expenses
(MOOE).
The PHP 53.4 billion increase in the proposed budget of DepEd in 2013 is more than
two-and-a-half times the increase in its budget in 2012. Given the sustained support given to
the DepEd, significant gains have been achieved in closing the input gaps (teachers,
textbooks, seats, in particular) in public elementary and secondary schools. However, the 9 These numbers are inclusive of the automatic appropriation for the retirement and life insurance premiums of personnel, the share of the department in the miscellaneous personnel benefits fund including the amount earmarked for the salaries of unfilled positions, and the allocation for classroom construction included in the budget of the DPWH.
12
classroom deficit remains to be addressed completely. Despite the huge increases in the
DepEd budget in recent years, the Philippines’ total allocation for basic education (which is
estimated to be equal to 2.3% of GDP in 2012) still compares unfavorably with those of its
neighbors in Southeast Asia.10
Table 5a. Top Gainers in 2013 National Expenditure Program, Selected Agencies (continuation)
2011 2012 b/ 2013 b/ 2011-2012 2012-2013 2011-2012 2012-2013
Total Social Services 377,685 402,665 503,193 24,981 100,528 6.6 25.0
Education 256,152 278,000 343,522 21,848 65,522 8.5 23.6 DepEd 218,817 238,800 292,218 19,983 53,418 9.1 22.4 SUCs 27,999 27,751 37,442 (249) 9,691 (0.9) 34.9 CHED 2,003 2,286 3,654 283 1,368 14.1 59.8
Health 40,654 47,794 58,524 7,139 10,730 17.6 22.5 DOH 30,223 44,308 55,370 14,085 11,063 46.6 25.0
Soc. Security, Labor/ Emp., & Soc. Welfare Serv. 58,542 69,847 77,881 11,305 8,034 19.3 11.5 DSWD 38,037 48,855 56,072 10,817 7,217 28.4 14.8 DOLE 2,363 2,508 3,067 144 560 6.1 22.3
Housing & Com. Devt. 22,337 7,025 23,266 (15,312) 16,241 (68.5) 231.2 NHA 20,001 5,631 21,373 (14,370) 15,742 (71.8) 279.6 NHMFC 500 500 1,000 0 500 0.0 100.0
Total Public Services 242,931 243,382 257,037 451 13,655 0.2 5.6
Public Administration 120,575 103,554 117,947 (17,021) 14,393 (14.1) 13.9 DILG 3,307 4,382 7,138 1,075 2,755 32.5 62.9 ARMM 12,932 12,469 14,110 (463) 1,641 (3.6) 13.2 National Statistics Office 1,430 1,848 3,247 418 1,399 29.2 75.7 COA 5,430 7,237 8,168 1,807 931 33.3 12.9
Peace and Order 122,355 139,828 139,090 17,472 (737) 14.3 (0.5) Bureau of Fire Protection 8,936 9,566 10,186 630 620 7.1 6.5 Bureau of Jail Management and Penology 5,679 5,551 6,171 (127) 619 (2.2) 11.2 Judiciary 14,114 13,934 15,722 (180) 1,787 (1.3) 12.8
Others, n.e.c. 315,942 436,110 460,608 120,168 24,498 38.0 5.6 IRA 286,944 273,310 302,304 (13,635) 28,994 (4.8) 10.6
Debt Service 278,996 333,107 333,902 54,111 795 19.4 0.2a/ as % of total expenditure net of debt service
Source of basic data: Budget of Expenditures and Sources of Finance
b/ allocation for Miscellaneous Personnel Benefits Fund and Pension and Gratuity Fund are distributed to the various agencies in direct proportion to their budgets for personal services
Level (in million pesos) Difference (in million pesos) growth rate
On the other hand, the aggregate budget for state universities and colleges (SUCs) is
programmed to rise by PHP 9.7 billion in 2013, primarily in support of the requirements for
the Roadmap for Higher Education Reform, increased allocation for MOOE, and the higher
salaries and wages under Salary Standardization Law Phase 3 (SSL3). In addition, an
increase of another PHP 1.4 billion is available under the budget of the Commission on
10 Indonesia, Malaysia, Thailand, and Viet Nam are estimated to spend 4.1 percent of their GDP, on the average, in 2002–2007 on basic education (World Bank 2012).
13
Higher Education for a program that will enhance the research and information and
communication technology capabilities of SUCs.
Under consideration is the phasing out of SUCs programs that are not part of their
mandates, or those that are duplicative. At the same time, the normative funding formula for
SUCs is currently being revised to better promote and reward quality instruction and research
and extension services, and improve the mechanism for public financing of research in
universities, an important public good produced in higher education institutions.
Health
In 2013, national government spending on the health sector is programmed to increase by
PHP 11 billion from its 2012 level. In particular, the allocation for the Department of Health
(DOH) is programmed to increase by 25 percent from PHP 44.3 billion in 2012 to PHP 55.4
billion in 2013, making the DOH the fifth largest gainer among the various government
departments in the 2013 NEP (Table 5a). Arguably, the higher budget support for the DOH in
2013 reflects the administration’s focus on advancing public health and universal health care.
The Health Facilities Enhancement Program (HFEP) accounts for the bulk (PHP 8.5
billion) of the increase in the DOH budget in 2013. Thus, the allocation for the HFEP
increases from PHP 5.1 billion in 2012 to PHP 13.6 billion in 2013. The HFEP is meant to be
used for the rehabilitation and construction of 2,243 rural health units (RHUs) and 403
provincial and district hospitals in order to improve the delivery of basic health services
nationwide.
As indicated in Manasan (2011a), the importance of the upgrading of RHUs and
barangay health stations (BHSs) to serve as basic emergency obstetric and newborn care
facilities, and the upgrading of selected local government unit (LGU) provincial and district
hospitals to serve as comprehensive emergency obstetric and newborn care facilities, is
premised on the need to treat every delivery as an emergency case and to promote the
importance of facility-based deliveries in reducing maternal mortality rate. The upgrading of
RHUs/BHSs and selected LGU hospitals is also expected to improve their “gatekeeping”
function and, thereby, reduce hospital patient case load at the tertiary level (Manasan and
Cuenca 2010). At the same time, the HFEP is best seen as a critical component of the DOH
health care financing strategy (DOH 2010) by (i) enhancing the ability of national
government and LGU health facilities to provide quality and appropriate services that are
responsive to the priority health needs of their catchment population; and (ii) enabling them
to operate on a more sustainable basis by securing appropriate PhilHealth accreditation.
14
The 2013 NEP also increases the budget for the operation of DOH hospitals by PHP
1.5 billion. Of this amount, PHP 800 million are intended for special hospitals while PHP 700
million are for DOH regional hospitals. Thus, the aggregate budget of special hospitals will
increase by 24 percent while that of DOH regional hospitals will rise by 15 percent in 2013.
On the other hand, the budget of the local health assistance including public health
program support is increased by PHP 1.8 billion in 2013. Thus, the allocation for this budget
item will increase by 170 percent during the year. Meanwhile, the allocation for the Doctors
to the Barrios and Rural Health Practice Program is increased by more than PHP 1 billion in
2013. This move will allow the DOH to deploy 131 doctors, 22,500 nurses, and 4,379
midwives to RHUs and government hospitals. Also, the budget support for the Indigent or
Sponsored Program of the National Health Insurance Program is increased by PHP 500
million in 2013. This will allow the DOH to fund the annual premium subsidy of the PHP 5.2
million indigent families identified under the National Household Targeting System. It is
notable that part of the additional revenues that will be generated from the recently enacted
reformed sin tax law will be used to cover the health insurance premium of the families of
some 5.6 million informal sector workers in partnership with LGUs.
Housing and community services
Some 8.0 percent of the total increment in the national government expenditure program net
of debt services in 2013 will go to housing and community development services. In
particular, the budgetary support for the National Housing Authority (NHA) will increase by
PHP 15.7 billion in 2013, making the NHA the fourth biggest gainer in the 2013 NEP (Table
5a). Thus, the budgetary support for the NHA will post an almost four-fold increase to PHP
21.7 billion in 2013 from PHP 5.6 billion in 2012. Some PHP 10 billion of the budgetary
support for the NHA is intended for the resettlement of an estimated 20,000 informal settlers
living in danger zones (e.g., creeks, rivers, and esteros). Said program is an essential
component of the government’s disaster risk reduction and management program. The plan is
to provide in-city multistorey housing structures to informal settler families on government-
owned land in Rizal, Parañaque, Malabon, Caloocan, Pasig, Valenzuela, and Las Piñas. Also,
PHP 4.9 billion will be used for the resettlement of another 33,000 informal settler families
affected by infrastructure projects and living in danger zones in Metro Manila and other
areas. On the other hand, PHP 5.6 billion will be allocated for the housing program for
military and police personnel.
15
Social security, labor/employment, and social welfare services
The allocation for the social security, labor/employment, and social welfare services sector is
programmed to increase by PHP 8 billion in 2013. About 90 percent of this amount is
accounted for by the Department of Social Welfare and Development (DSWD) whose budget
will increase by PHP 7.2 billion in 2013 (Table 5a). This makes the DSWD the eighth biggest
gainer in the 2013 NEP.
Close to 70 percent of the increase in DSWD’s budget in 2013 is due to the Pantawid
Pamilyang Pilipino Program (4Ps). The allocation for the 4Ps is programmed to increase by
PHP 5 billion from 39 billion in 2012 to PHP 44 billion in 2013. The increase will allow the
expansion of the program’s coverage from 3.1 million families in 2012 to 3.8 million families
in 2013. While the initial studies on the impact of the 4Ps indicate that the program has been
successful in improving school attendance and demand for basic health services among
beneficiaries (e.g., Manasan 2011b; Chaudhury et al. 2013), other studies indicate that the
inclusion error in the implementation of the program is not as low as earlier anticipated
(Reyes and Tabuga 2012).
The budget for the Self-Employment Assistance – Kaunlaran Program will increase
by PHP 1.7 billion in 2013. This amount will be used to provide livelihood opportunities to
4Ps beneficiaries to prepare them for the eventual graduation from the program.
The 2013 NEP includes an allocation of PHP 1.5 billion for the implementation and
monitoring of the department’s component of the Payapa at Masaganang Pamayanan
(PAMANA) program. The PAMANA, an interagency program led by the Office of the
Presidential Adviser for the Peace Process, is a framework for peace building, reconstruction,
and development in conflict-affected areas and aims to reduce poverty and vulnerability in
those areas by improving governance and empowering communities. The DSWD component
involves livelihood activities in 845 barangays and the construction of 989 core shelter units.
Economic services sectors
The PHP 49.4 billion increase in the allocation for all the economic sectors as a group in
2013 accounts for 26 percent of the total increment in the national expenditure program net of
debt service (Table 4). This amount is about double the increase in aggregate budget for all
the economic services sectors combined in 2012, indicating increasing importance being
given to the economic services sectors. Thus, the combined allocation for all the economic
services sectors is programmed to rise from PHP 288 million in 2012 to PHP 337 million in
2013.
16
Agriculture
The allocation for all the agencies belonging to the agriculture sector as a group will increase
by PHP 12.7 billion in 2013, lower than the budget increment of PHP 17.7 billion in 2012
(Table 4). Thus, the national government’s expenditure program for the agriculture sector in
2013 (PHP 75.1 billion) is 20 percent higher than that in 2012 (PHP 62.4 billion).
Department of Agriculture. More than half of the PHP 12.7 billion increase in the
allocation for the entire agriculture sector is attributable to the Department of Agriculture
(DA). In more specific terms, the budget of the DA is programmed to increase by PHP 6.8
billion in 2013, making it the ninth largest gainer in the 2013 NEP (Table 5b).
Close to 30 percent, the increase in DA’s budget in 2013 (or PHP 2 billion), is
allocated for farm-to-market roads, with the budget for this item rising from PHP 5 billion in
2012 to PHP 7 billion in 2013. On the other hand, PHP 1.6 billion will go to the restoration,
rehabilitation, and construction of irrigation systems. Thus, the allocation for irrigation will
rise from PHP 25.8 billion in 2012 to PHP 27.4 billion in 2013.
At the same time, the 2013 NEP proposes an increase of about PHP 1.2 billion for the
National Rice Program and PHP 573 million for the National Corn Program.
As noted in Manasan (2011), the increased funding for farm-to-market roads is
consistent with the findings of empirical studies that have established the importance of
market infrastructure, like farm-to-market roads, in improving the profitability of agricultural
producers by linking production areas to markets [e.g., Fan et al. 2000 as cited by David et al.
(2012)]. On the other hand, the higher budget support given to irrigation is aligned with the
findings of earlier studies [e.g., David (2003), World Bank (2007)]. However, these studies
also highlight the need for governance reforms (including greater cost recovery and transfer
of management systems to farmers) to make the irrigation sector more efficient.
In contrast, the proposed increases in the budgetary allocation for commodity-specific
production support programs may need to be revisited. As indicated in Manasan (2013),
government expenditures on these programs in the past went to the provision of private goods
such as fertilizers, hybrid seeds, postharvest facilities and equipment, farm machineries, and
livestock. David et al. (2012) argue that expenditures for production support must be limited
to those that address market failures like lack of access to formal financial markets by small
producers and nonviability of crop insurance. In contrast, subsidies for postharvest facilities
and equipment, farm machineries, hybrid seeds, fertilizers, agricultural chemicals, and animal
distribution that are all private goods are more difficult to justify.
17
The proposed DA budget for 2013 includes a new item, which is the implementation
and monitoring of projects under the PAMANA program. The allocation for the PAMANA
program under the DA budget amounts to PHP 1.3 billion.
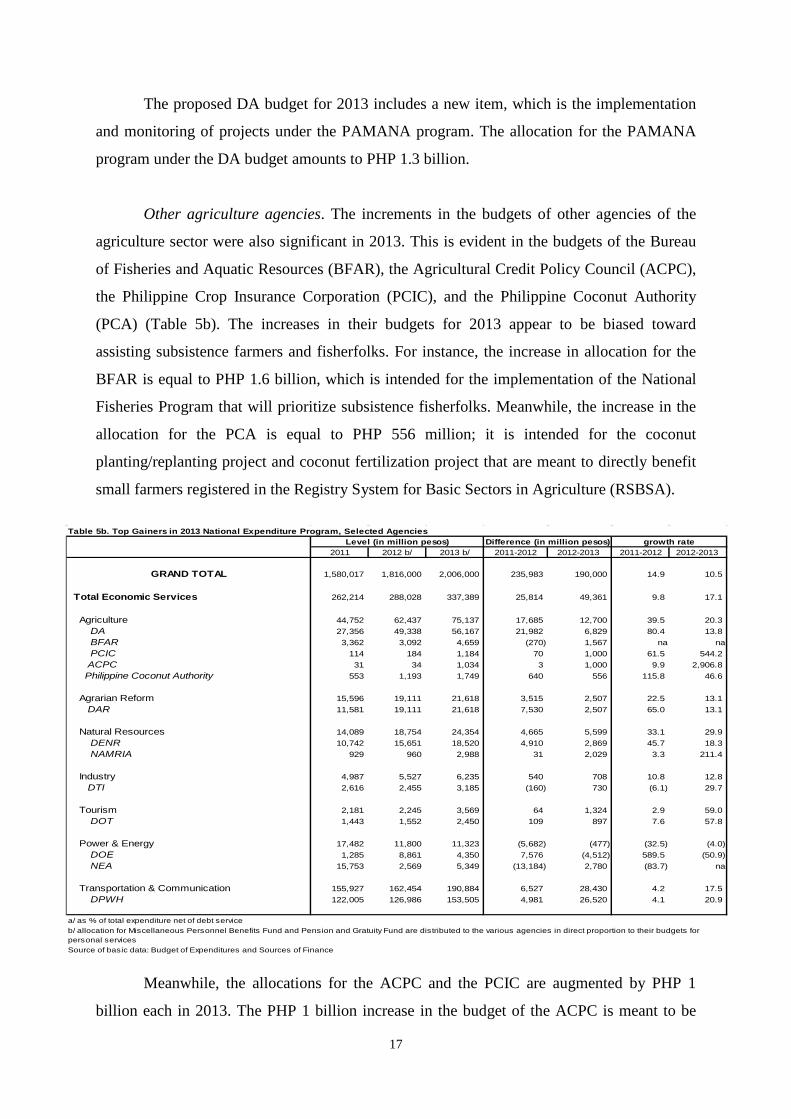
Other agriculture agencies. The increments in the budgets of other agencies of the
agriculture sector were also significant in 2013. This is evident in the budgets of the Bureau
of Fisheries and Aquatic Resources (BFAR), the Agricultural Credit Policy Council (ACPC),
the Philippine Crop Insurance Corporation (PCIC), and the Philippine Coconut Authority
(PCA) (Table 5b). The increases in their budgets for 2013 appear to be biased toward
assisting subsistence farmers and fisherfolks. For instance, the increase in allocation for the
BFAR is equal to PHP 1.6 billion, which is intended for the implementation of the National
Fisheries Program that will prioritize subsistence fisherfolks. Meanwhile, the increase in the
allocation for the PCA is equal to PHP 556 million; it is intended for the coconut
planting/replanting project and coconut fertilization project that are meant to directly benefit
small farmers registered in the Registry System for Basic Sectors in Agriculture (RSBSA).
Table 5b. Top Gainers in 2013 National Expenditure Program, Selected Agencies
2011 2012 b/ 2013 b/ 2011-2012 2012-2013 2011-2012 2012-2013
GRAND TOTAL 1,580,017 1,816,000 2,006,000 235,983 190,000 14.9 10.5
Total Economic Services 262,214 288,028 337,389 25,814 49,361 9.8 17.1
Agriculture 44,752 62,437 75,137 17,685 12,700 39.5 20.3 DA 27,356 49,338 56,167 21,982 6,829 80.4 13.8 BFAR 3,362 3,092 4,659 (270) 1,567 na na PCIC 114 184 1,184 70 1,000 61.5 544.2 ACPC 31 34 1,034 3 1,000 9.9 2,906.8 Philippine Coconut Authority 553 1,193 1,749 640 556 115.8 46.6
Agrarian Reform 15,596 19,111 21,618 3,515 2,507 22.5 13.1 DAR 11,581 19,111 21,618 7,530 2,507 65.0 13.1
Natural Resources 14,089 18,754 24,354 4,665 5,599 33.1 29.9 DENR 10,742 15,651 18,520 4,910 2,869 45.7 18.3 NAMRIA 929 960 2,988 31 2,029 3.3 211.4
Industry 4,987 5,527 6,235 540 708 10.8 12.8 DTI 2,616 2,455 3,185 (160) 730 (6.1) 29.7
Tourism 2,181 2,245 3,569 64 1,324 2.9 59.0 DOT 1,443 1,552 2,450 109 897 7.6 57.8
Power & Energy 17,482 11,800 11,323 (5,682) (477) (32.5) (4.0) DOE 1,285 8,861 4,350 7,576 (4,512) 589.5 (50.9) NEA 15,753 2,569 5,349 (13,184) 2,780 (83.7) na
Transportation & Communication 155,927 162,454 190,884 6,527 28,430 4.2 17.5 DPWH 122,005 126,986 153,505 4,981 26,520 4.1 20.9
a/ as % of total expenditure net of debt service
Source of basic data: Budget of Expenditures and Sources of Finance
Level (in million pesos) Difference (in million pesos) growth rate
b/ allocation for Miscellaneous Personnel Benefits Fund and Pension and Gratuity Fund are distributed to the various agencies in direct proportion to their budgets for personal services
Meanwhile, the allocations for the ACPC and the PCIC are augmented by PHP 1
billion each in 2013. The PHP 1 billion increase in the budget of the ACPC is meant to be
18
transferred to government financial institutions to be used exclusively for the establishment
of a flexible credit facility for the benefit of small farmers registered in the RSBSA. On the
other hand, that for the PCIC shall be used exclusively for the crop insurance premium of
subsistence farmers and agrarian reform beneficiaries.
Agrarian reform
The allocation for the Department of Agrarian Reform is programmed to increase by PHP 2.5
billion in 2013. This amount shall be used mainly for land acquisition and distribution whose
budget will increase from PHP 9.4 billion in 2012 to PHP 13 billion in 2013 (Table 5b).
Environment and natural resources
The allocation for the environment and natural resources sector is programmed to increase by
PHP 5.6 billion in 2013. Some PHP 2.8 billion of the increase in the sector’s allocation in
2013 is meant for the Department of Environment and Natural Resources (DENR). This will
increase the total allocation for the DENR by 18 percent, from PHP 15.7 billion in 2012 to
PHP 18.5 billion in 2013 (Table 5b). In particular, the allocation for the department’s
National Greening Program will increase from PHP 2.2 billion in 2012 to PHP 5.0 billion in
2013. With this budget, the DENR targets to plant 150 million seedlings in 300,000 hectares,
up from the 128,559 hectares planted in 2011 and the target of 215,000 hectares in 2012, with
the long-term goal of increasing forest cover to 30 percent of the total land area from only 24
percent in 2003.
On the other hand, the allocation for the National Mapping and Resource Information
Authority is programmed to increase by PHP 1.5 billion in 2013. This amount is intended for
the implementation of the Unified Mapping Project that aims to produce topographic maps
for the 18 major river basins that will serve as inputs to hazard mapping for disaster risk
reduction and management.
Power and energy
The allocation for all the agencies belonging to the power and energy sector combined is
programmed to decline by PHP 477 million in 2013 because of the decline in the Department
of Energy’s use of income from the collections of fees and revenues from the exploration,
development, and exploitation of energy resources in 2012. However, the allocation for the
National Electrification Authority is programmed to increase by PHP 2.8 billion in 2013
19
(Table 5b). This amount will be used to finance the government’s Rural Electrification
Program.
Transportation and communication
The 2013 NEP proposes a PHP 28.4 billion increase in allocation for all the transportation
and communication agencies combined over the 2012 level (Table 4). Over 90 percent of this
amount (or PHP 26.5 billion) is attributable to the increase in the budget of the DPWH,
making the department the third largest gainer among the various government departments in
the 2013 NEP (Table 5b). In particular, the allocation for national arterial and secondary
roads will increase by PHP 23 billion while that for flood control projects will increase by
PHP 3.5 billion in 2013. The higher allocation for road construction and maintenance
supports the DPWH’s program to complete the pavement of national arterial and secondary
roads and bridges by 2016. On the other hand, the higher allocation for flood control
contributes to the government’s disaster risk reduction and management.
As indicated in Manasan (2013), “the higher priority given to the infrastructure
sectors under Aquino II is consistent with the need to increase funding for basic infrastructure
to help ensure more inclusive growth. Economic theory suggests that increased public
infrastructure investment exerts a positive influence on economic growth by increasing the
productivity of other factors of production (including labor and private capital). This is
especially true when the initial stock of infrastructure assets is low. Moreover, public
infrastructure investments is said to crowd-in private investments, thereby resulting in a
higher private investment rate, precisely because of the higher returns to private investment
resulting from higher factor productivity cited above. On the other hand, improved public
infrastructure is conjectured to magnify the improvements in health and education outcomes
from higher health and education investments by making it easier for individuals to attend
schools and seek health care.”
Public services sectors
The expenditure program for all public services sectors combined will increase by PHP 13.7
billion in 2013 relative to its 2012 level (Table 4).
The agencies under the public services sector that will receive significantly higher
allocations in 2013 relative to their 2012 levels are: Department of Interior and Local
Government (increment of PHP 2.8 billion, of which PHP 600 million is for the PAMANA
20
program and PHP 250 million is for the LGU Challenge Fund11), Judiciary (increment of
PHP 1.8 billion), Autonomous Region in Muslim Mindanao [ARMM] (increment of PHP 1.6
billion of which PHP 500 million is due to the ARMM Social Fund for Peace and
Development and PHP 500 million is for infrastructure projects), National Statistics Office
(increment of PHP 1.4 billion largely for the Census of Agriculture and Fisheries), and
Commission on Audit (increment of PHP 931 million) [Table 5a].
Other sectors, not elsewhere classified
The increase in the allocation for other sectors, not elsewhere classified, is mainly due to the
PHP 29 billion increase in the IRA in 2013.
The 2013 National Expenditure Program in longer-term perspective
Aggregate national government spending
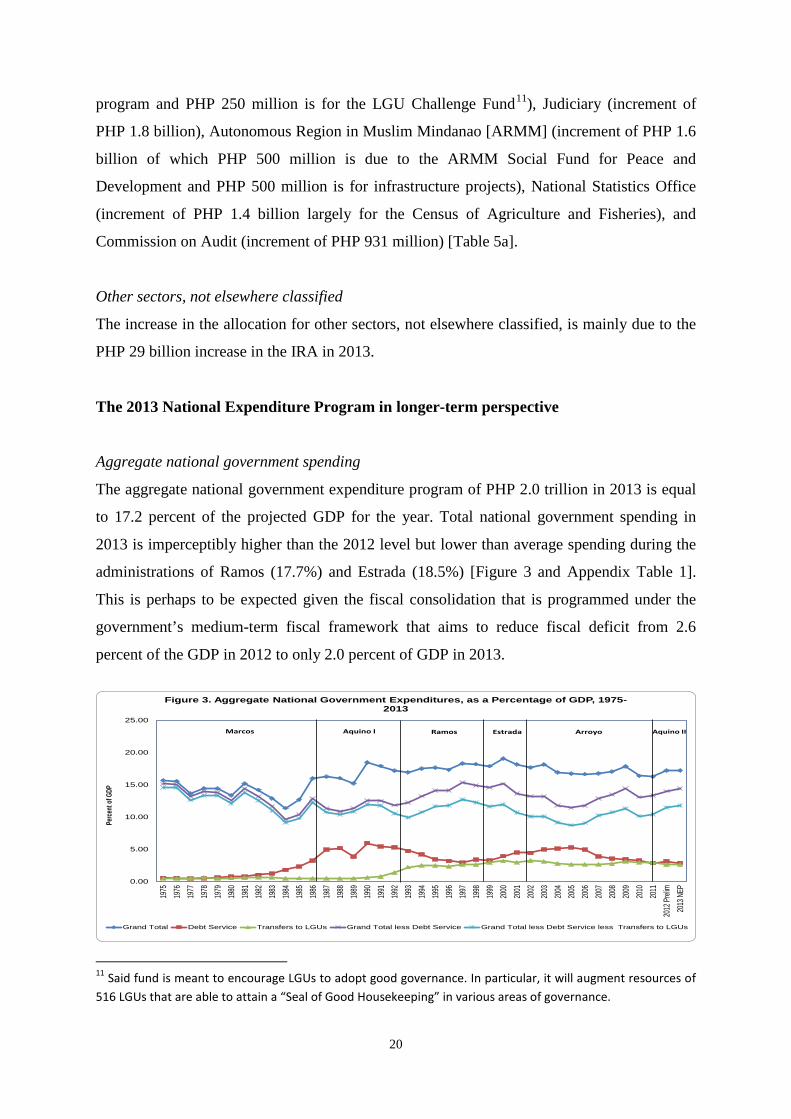
The aggregate national government expenditure program of PHP 2.0 trillion in 2013 is equal
to 17.2 percent of the projected GDP for the year. Total national government spending in
2013 is imperceptibly higher than the 2012 level but lower than average spending during the
administrations of Ramos (17.7%) and Estrada (18.5%) [Figure 3 and Appendix Table 1].
This is perhaps to be expected given the fiscal consolidation that is programmed under the
government’s medium-term fiscal framework that aims to reduce fiscal deficit from 2.6
percent of the GDP in 2012 to only 2.0 percent of GDP in 2013.
0.00
5.00
10.00
15.00
20.00
25.00
1975
1976
1977
1978
1979
1980
1981
1982
1983
1984
1985
1986
1987
1988
1989
1990
1991
1992
1993
1994
1995
1996
1997
1998
1999
2000
2001
2002
2003
2004
2005
2006
2007
2008
2009
2010
2011
2012
Preli
m20
13 N
EP
Perce
nt of
GDP
Figure 3. Aggregate National Government Expenditures, as a Percentage of GDP, 1975-2013
Grand Total Debt Service Transfers to LGUs Grand Total less Debt Service Grand Total less Debt Service less Transfers to LGUs
Marcos Aquino I Ramos Estrada Arroyo Aquino II
11 Said fund is meant to encourage LGUs to adopt good governance. In particular, it will augment resources of 516 LGUs that are able to attain a “Seal of Good Housekeeping” in various areas of governance.
21
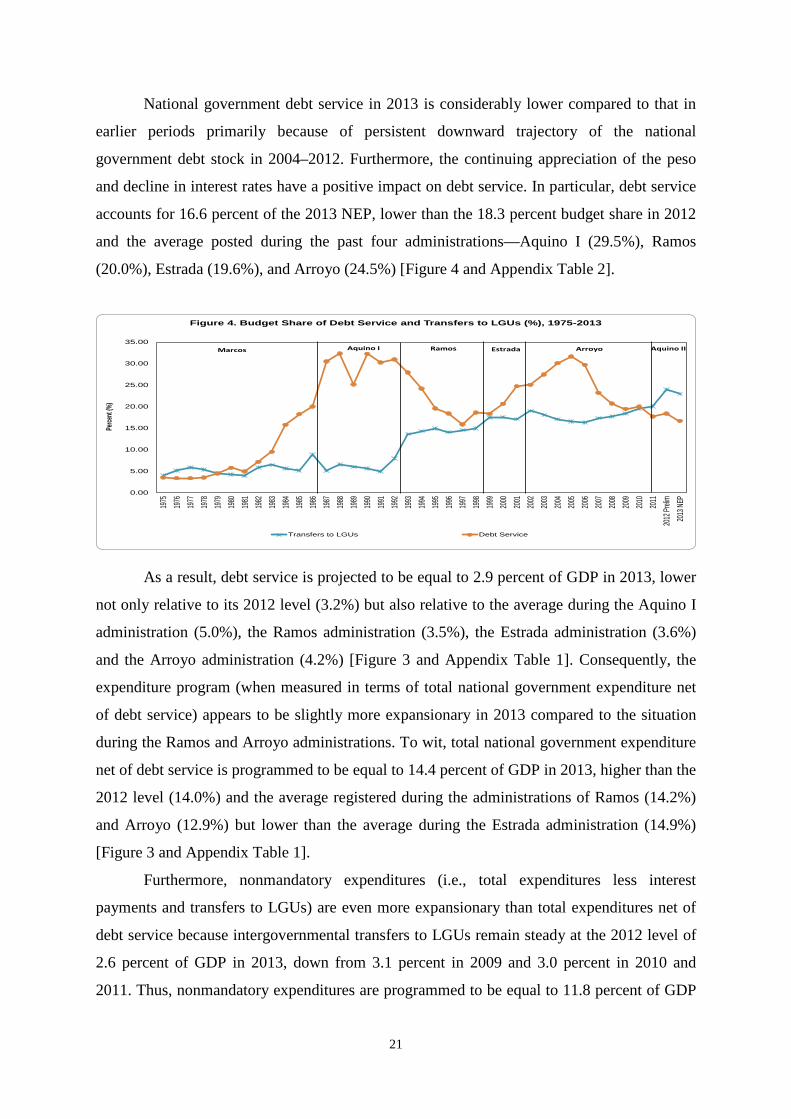
National government debt service in 2013 is considerably lower compared to that in
earlier periods primarily because of persistent downward trajectory of the national
government debt stock in 2004–2012. Furthermore, the continuing appreciation of the peso
and decline in interest rates have a positive impact on debt service. In particular, debt service
accounts for 16.6 percent of the 2013 NEP, lower than the 18.3 percent budget share in 2012
and the average posted during the past four administrations—Aquino I (29.5%), Ramos
(20.0%), Estrada (19.6%), and Arroyo (24.5%) [Figure 4 and Appendix Table 2].
0.00
5.00
10.00
15.00
20.00
25.00
30.00
35.00
1975
1976
1977
1978
1979
1980
1981
1982
1983
1984
1985
1986
1987
1988
1989
1990
1991
1992
1993
1994
1995
1996
1997
1998
1999
2000
2001
2002
2003
2004
2005
2006
2007
2008
2009
2010
2011
2012
Prelim
2013
NEP
Perce
nt (%
)
Figure 4. Budget Share of Debt Service and Transfers to LGUs (%), 1975-2013
Transfers to LGUs Debt Service
Marcos Aquino I Aquino IIRamos Estrada Arroyo
As a result, debt service is projected to be equal to 2.9 percent of GDP in 2013, lower
not only relative to its 2012 level (3.2%) but also relative to the average during the Aquino I
administration (5.0%), the Ramos administration (3.5%), the Estrada administration (3.6%)
and the Arroyo administration (4.2%) [Figure 3 and Appendix Table 1]. Consequently, the
expenditure program (when measured in terms of total national government expenditure net
of debt service) appears to be slightly more expansionary in 2013 compared to the situation
during the Ramos and Arroyo administrations. To wit, total national government expenditure
net of debt service is programmed to be equal to 14.4 percent of GDP in 2013, higher than the
2012 level (14.0%) and the average registered during the administrations of Ramos (14.2%)
and Arroyo (12.9%) but lower than the average during the Estrada administration (14.9%)
[Figure 3 and Appendix Table 1].
Furthermore, nonmandatory expenditures (i.e., total expenditures less interest
payments and transfers to LGUs) are even more expansionary than total expenditures net of
debt service because intergovernmental transfers to LGUs remain steady at the 2012 level of
2.6 percent of GDP in 2013, down from 3.1 percent in 2009 and 3.0 percent in 2010 and
2011. Thus, nonmandatory expenditures are programmed to be equal to 11.8 percent of GDP
22
in 2013, higher than the 2012 level (11.4%) and the average during the administrations of
Marcos (11.6%), Aquino I (11.2%), Ramos (11.7%), and Arroyo (10.1%) but just about equal
to the average during the Estrada administration (Figure 3 and Appendix Table 1).
Allocation across major expenditure groups
The present government’s overarching goal as stated in the Philippine Development Plan is
inclusive growth (NEDA 2011). The Plan defines inclusive growth as sustained, rapid growth
that is broadly shared, i.e., growth that benefits the majority of the citizenry. Such growth is
envisioned to result in reduced poverty and increased employment. The Plan identifies the
key strategies that will help achieve inclusive growth: (i) improved infrastructure support; (ii)
equal access to human development; and (iii) effective and responsive social safety nets. The
2013 NEP supports the abovementioned strategies by supporting interventions that are biased
in favor of the poor and vulnerable even while it gives priority to the basic infrastructure
necessary for the country to attain rapid, inclusive, and sustained economic growth. As such,
the very strong bias toward the social services sectors that characterized the 2011 and 2012
expenditure programs has been tempered in 2013 by having a more balanced distribution of
the budget between the social services sectors and the economic services sectors.
Nonetheless, the social services sectors continue to have the biggest budget share among the
major expenditure groups in 2013 as was the case in the past three administrations—Ramos,
Estrada, and Arroyo.
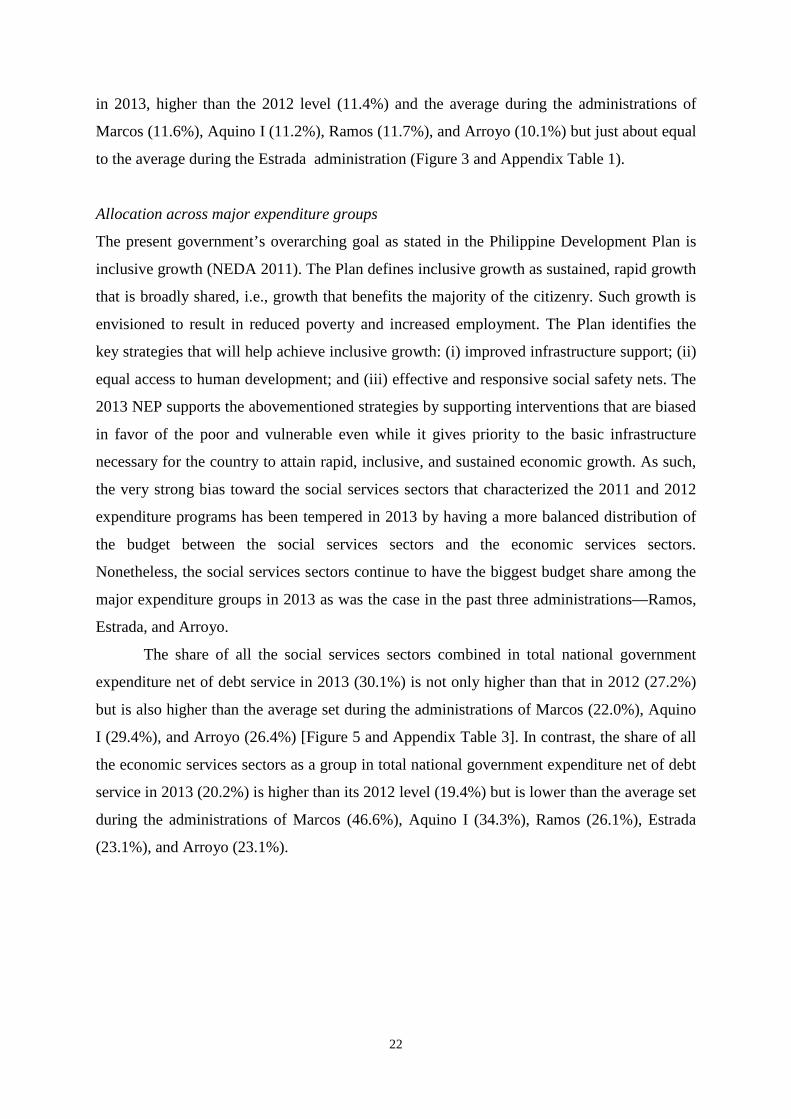
The share of all the social services sectors combined in total national government
expenditure net of debt service in 2013 (30.1%) is not only higher than that in 2012 (27.2%)
but is also higher than the average set during the administrations of Marcos (22.0%), Aquino
I (29.4%), and Arroyo (26.4%) [Figure 5 and Appendix Table 3]. In contrast, the share of all
the economic services sectors as a group in total national government expenditure net of debt
service in 2013 (20.2%) is higher than its 2012 level (19.4%) but is lower than the average set
during the administrations of Marcos (46.6%), Aquino I (34.3%), Ramos (26.1%), Estrada
(23.1%), and Arroyo (23.1%).
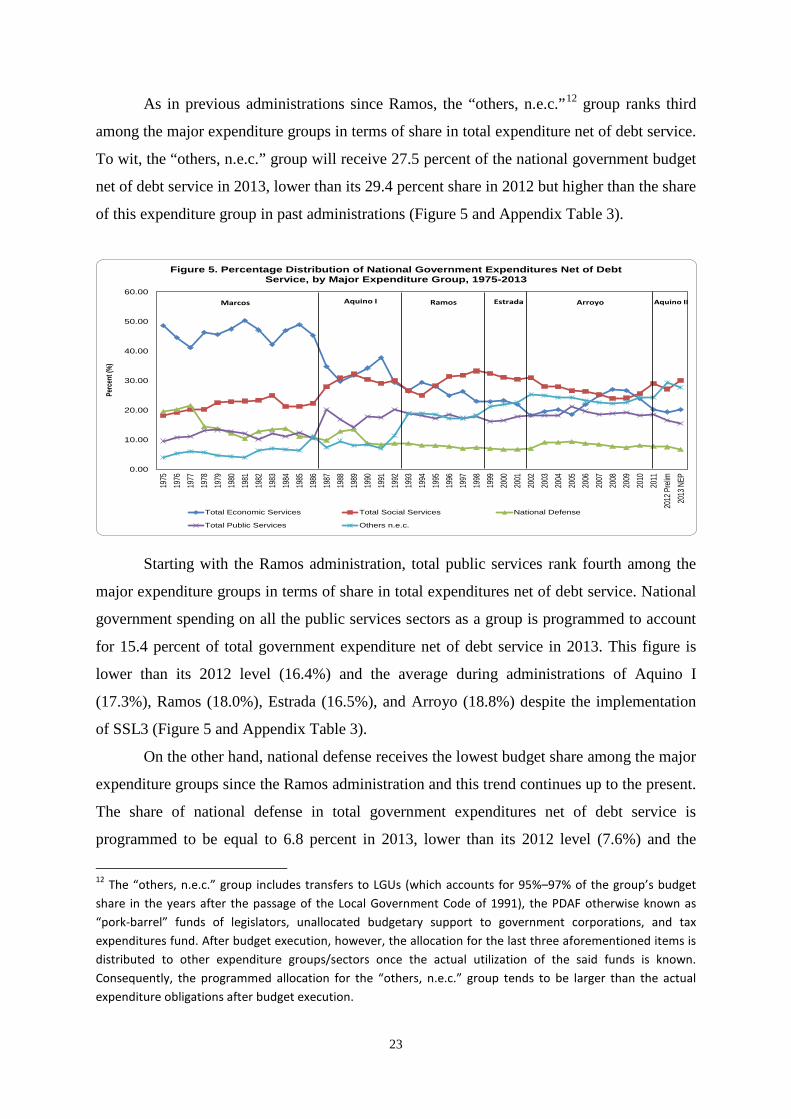
23
As in previous administrations since Ramos, the “others, n.e.c.”12 group ranks third
among the major expenditure groups in terms of share in total expenditure net of debt service.
To wit, the “others, n.e.c.” group will receive 27.5 percent of the national government budget
net of debt service in 2013, lower than its 29.4 percent share in 2012 but higher than the share
of this expenditure group in past administrations (Figure 5 and Appendix Table 3).
0.00
10.00
20.00
30.00
40.00
50.00
60.00
1975
1976
1977
1978
1979
1980
1981
1982
1983
1984
1985
1986
1987
1988
1989
1990
1991
1992
1993
1994
1995
1996
1997
1998
1999
2000
2001
2002
2003
2004
2005
2006
2007
2008
2009
2010
2011
2012
Prel
im20
13 N
EP
Perc
ent (
%)
Figure 5. Percentage Distribution of National Government Expenditures Net of Debt Service, by Major Expenditure Group, 1975-2013
Total Economic Services Total Social Services National Defense
Total Public Services Others n.e.c.
Marcos Aquino I Aquino IIRamos Estrada Arroyo
Starting with the Ramos administration, total public services rank fourth among the
major expenditure groups in terms of share in total expenditures net of debt service. National
government spending on all the public services sectors as a group is programmed to account
for 15.4 percent of total government expenditure net of debt service in 2013. This figure is
lower than its 2012 level (16.4%) and the average during administrations of Aquino I
(17.3%), Ramos (18.0%), Estrada (16.5%), and Arroyo (18.8%) despite the implementation
of SSL3 (Figure 5 and Appendix Table 3).
On the other hand, national defense receives the lowest budget share among the major
expenditure groups since the Ramos administration and this trend continues up to the present.
The share of national defense in total government expenditures net of debt service is
programmed to be equal to 6.8 percent in 2013, lower than its 2012 level (7.6%) and the
12 The “others, n.e.c.” group includes transfers to LGUs (which accounts for 95%–97% of the group’s budget share in the years after the passage of the Local Government Code of 1991), the PDAF otherwise known as “pork-barrel” funds of legislators, unallocated budgetary support to government corporations, and tax expenditures fund. After budget execution, however, the allocation for the last three aforementioned items is distributed to other expenditure groups/sectors once the actual utilization of the said funds is known. Consequently, the programmed allocation for the “others, n.e.c.” group tends to be larger than the actual expenditure obligations after budget execution.
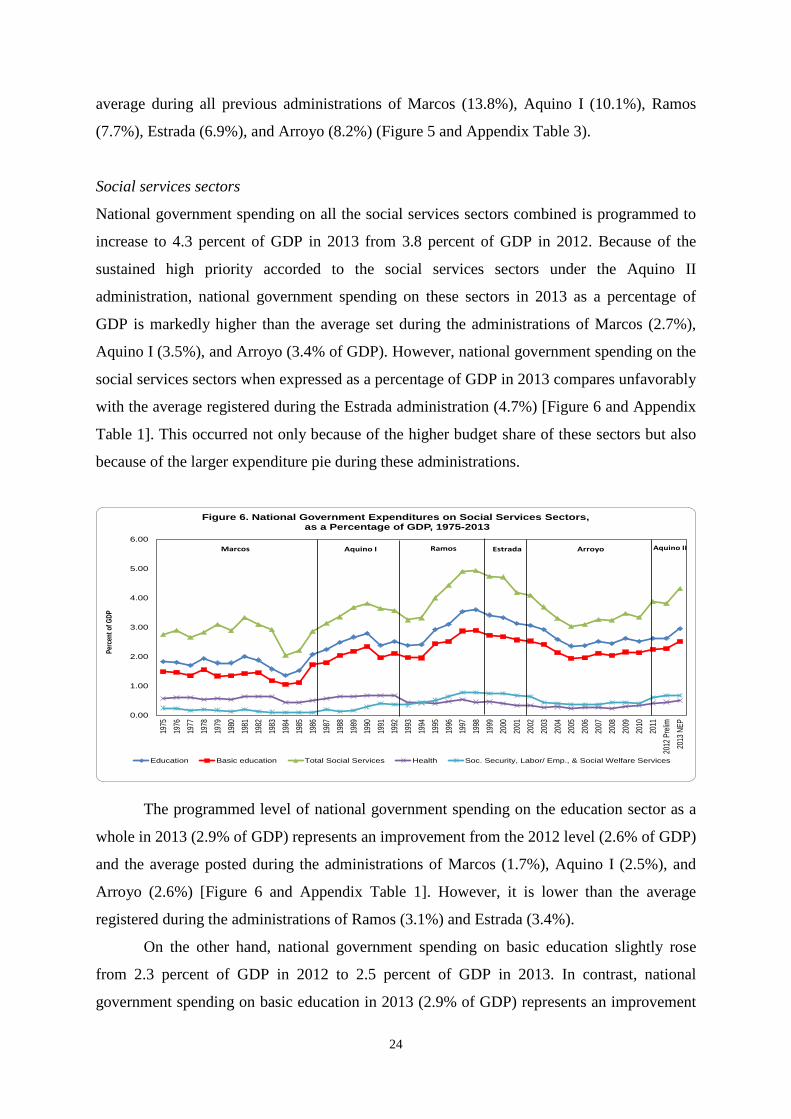
24
average during all previous administrations of Marcos (13.8%), Aquino I (10.1%), Ramos
(7.7%), Estrada (6.9%), and Arroyo (8.2%) (Figure 5 and Appendix Table 3).
Social services sectors
National government spending on all the social services sectors combined is programmed to
increase to 4.3 percent of GDP in 2013 from 3.8 percent of GDP in 2012. Because of the
sustained high priority accorded to the social services sectors under the Aquino II
administration, national government spending on these sectors in 2013 as a percentage of
GDP is markedly higher than the average set during the administrations of Marcos (2.7%),
Aquino I (3.5%), and Arroyo (3.4% of GDP). However, national government spending on the
social services sectors when expressed as a percentage of GDP in 2013 compares unfavorably
with the average registered during the Estrada administration (4.7%) [Figure 6 and Appendix
Table 1]. This occurred not only because of the higher budget share of these sectors but also
because of the larger expenditure pie during these administrations.
0.00
1.00
2.00
3.00
4.00
5.00
6.00
1975
1976
1977
1978
1979
1980
1981
1982
1983
1984
1985
1986
1987
1988
1989
1990
1991
1992
1993
1994
1995
1996
1997
1998
1999
2000
2001
2002
2003
2004
2005
2006
2007
2008
2009
2010
2011
2012
Pre
lim20
13 N
EP
Perc
ent o
f GDP
Figure 6. National Government Expenditures on Social Services Sectors,as a Percentage of GDP, 1975-2013
Education Basic education Total Social Services Health Soc. Security, Labor/ Emp., & Social Welfare Services
Marcos Aquino I Aquino IIRamos Estrada Arroyo
The programmed level of national government spending on the education sector as a
whole in 2013 (2.9% of GDP) represents an improvement from the 2012 level (2.6% of GDP)
and the average posted during the administrations of Marcos (1.7%), Aquino I (2.5%), and
Arroyo (2.6%) [Figure 6 and Appendix Table 1]. However, it is lower than the average
registered during the administrations of Ramos (3.1%) and Estrada (3.4%).
On the other hand, national government spending on basic education slightly rose
from 2.3 percent of GDP in 2012 to 2.5 percent of GDP in 2013. In contrast, national
government spending on basic education in 2013 (2.9% of GDP) represents an improvement
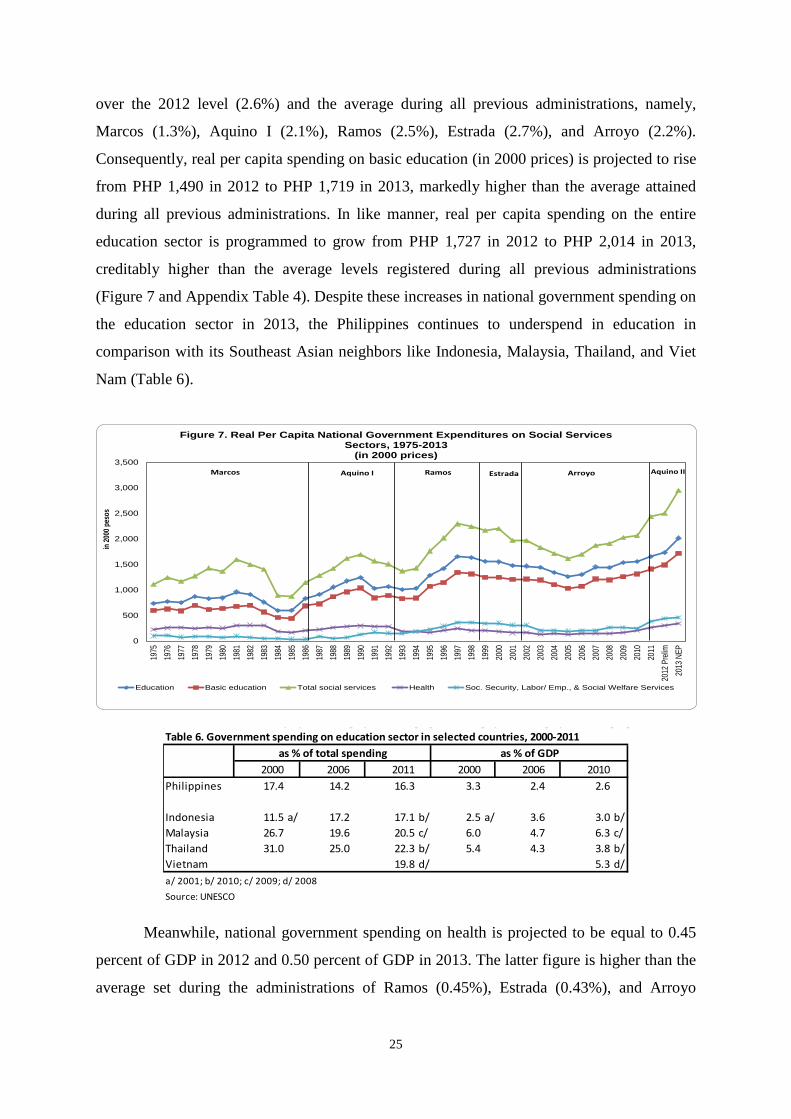
25
over the 2012 level (2.6%) and the average during all previous administrations, namely,
Marcos (1.3%), Aquino I (2.1%), Ramos (2.5%), Estrada (2.7%), and Arroyo (2.2%).
Consequently, real per capita spending on basic education (in 2000 prices) is projected to rise
from PHP 1,490 in 2012 to PHP 1,719 in 2013, markedly higher than the average attained
during all previous administrations. In like manner, real per capita spending on the entire
education sector is programmed to grow from PHP 1,727 in 2012 to PHP 2,014 in 2013,
creditably higher than the average levels registered during all previous administrations
(Figure 7 and Appendix Table 4). Despite these increases in national government spending on
the education sector in 2013, the Philippines continues to underspend in education in
comparison with its Southeast Asian neighbors like Indonesia, Malaysia, Thailand, and Viet
Nam (Table 6).
0
500
1,000
1,500
2,000
2,500
3,000
3,500
1975
1976
1977
1978
1979
1980
1981
1982
1983
1984
1985
1986
1987
1988
1989
1990
1991
1992
1993
1994
1995
1996
1997
1998
1999
2000
2001
2002
2003
2004
2005
2006
2007
2008
2009
2010
2011
2012
Pre
lim20
13 N
EP
in 20
00 p
esos
Figure 7. Real Per Capita National Government Expenditures on Social Services Sectors, 1975-2013
(in 2000 prices)
Education Basic education Total social services Health Soc. Security, Labor/ Emp., & Social Welfare Services
Marcos Aquino I Aquino IIRamos Estrada Arroyo
Table 6. Government spending on education sector in selected countries, 2000-2011
2000 2006 2011 2000 2006 2010Philippines 17.4 14.2 16.3 3.3 2.4 2.6
Indonesia 11.5 a/ 17.2 17.1 b/ 2.5 a/ 3.6 3.0 b/Malaysia 26.7 19.6 20.5 c/ 6.0 4.7 6.3 c/Thailand 31.0 25.0 22.3 b/ 5.4 4.3 3.8 b/Vietnam 19.8 d/ 5.3 d/a/ 2001; b/ 2010; c/ 2009; d/ 2008
Source: UNESCO
as % of total spending as % of GDP
Meanwhile, national government spending on health is projected to be equal to 0.45
percent of GDP in 2012 and 0.50 percent of GDP in 2013. The latter figure is higher than the
average set during the administrations of Ramos (0.45%), Estrada (0.43%), and Arroyo
26
(0.29%) but is lower than the average posted during the administrations of Marcos (0.54%)
and Aquino I (0.63%).13 As a result, real per capita spending on health is projected to
increase from PHP 297 in 2012 to PHP 343 in 2013 (Figure 7 and Appendix Table 4). It is
laudable that the 2013 level is higher than the average levels registered during the
administrations of Ramos, Estrada, and Arroyo.
On the other hand, national government spending on social security,
labor/employment, and social welfare services is projected to rise from 0.66 percent of GDP
in 2012 to 0.67 percent of GDP in 2013. Perhaps as a result of the greater importance given to
social protection during the present administration, the level of national government spending
on social security, labor/employment, and social welfare services in 2013 is markedly higher
than the average during the administrations of Marcos (0.14% of GDP), Aquino I (0.3%), and
Arroyo (0.44%) [Figure 6 and Appendix Table 1]. At the same time, real per capita spending
on social security, labor/employment, and social welfare services is projected to rise from
PHP 434 in 2012 to PHP 457 in 2013, higher than the average levels posted during all
previous administrations.
Economic services sectors
National government spending on all the economic services sectors combined is programmed
to increase from 2.7 percent of GDP in 2012 to 2.9 percent of GDP in 2013, a reversal of the
downward trend in 2010–2011 (Figure 8 and Appendix Table 1). Despite the said increase in
the national government spending on all the economic services sectors as a group, the 2013
level is still significantly lower than the average levels set during all previous administrations,
namely, Marcos (5.7% of GDP), Aquino I (4.1%), Ramos (3.7%), Estrada (3.4%), and
Arroyo (3.0%).
13 National government spending on the health services sector declined after the devolution of basic health services following the enactment of the Local Government Code in 1991.
27
0.00
1.00
2.00
3.00
4.00
5.00
6.00
7.00
8.00
1975
1976
1977
1978
1979
1980
1981
1982
1983
1984
1985
1986
1987
1988
1989
1990
1991
1992
1993
1994
1995
1996
1997
1998
1999
2000
2001
2002
2003
2004
2005
2006
2007
2008
2009
2010
2011
2012
Preli
m20
13 N
EP
Perce
nt of
GDP
Figure 8. National Government Expenditures on All Economic Services Sectors and All Infrastructure Sectors, as a Percentage of GDP, 1975-2013
Total Economic Services Infrastructure
Marcos Aquino I Ramos Estrada Arroyo Aquino II
In like manner, national government spending on infrastructure is projected to go up
from 1.66 percent of GDP in 2012 to 1.74 percent of GDP in 2013, substantially lower than
the average during all previous administrations, namely, Marcos (3.22%), Aquino I (2.24%),
Ramos (2.22%), Estrada (2.17%), and Arroyo (1.82%). The level of spending on public
infrastructure in 2013 is just about a third of the 5.0 percent of GDP benchmark that the
World Bank (2005) estimates middle-income countries in East Asia need to spend on public
infrastructure to meet their needs.
Revenue Program
Total national government revenues net of privatization proceeds reached a peak of 17.2
percent of GDP in 1997 (Figure 9). Subsequently, overall revenue effort of the national
government deteriorated persistently up to 2004 with total national government revenues net
of privatization proceeds dropping to 13.6 percent of GDP in that year. This decline largely
mirrors the collapse in overall tax effort during the period. A partial recovery was evident in
total revenue effort in 2005–2006 with the enactment of RA 9334 (amending the excise tax
on so-called sin products) and RA 9337 (Reformed VAT Law) in 2005. However, said
recovery was brief and total national government revenues effort deteriorated once again to
13.4 percent of GDP in 2010 after improving to 15.4 percent in 2006.
Manasan (2010) notes that this development is not unexpected altogether as the
positive revenue impact of the excise tax amendment and the reformed VAT law has built-in
sunset provisions. The reformed VAT law temporarily raised the corporate tax rate to 35
percent but this rate is scheduled to be reduced to 30 percent in 2009. On the other hand, the
mandated adjustment in excise tax rates on sin products were not enough to keep pace with
28
inflation and, thus, excise tax revenues were eroded in real terms. At the same time, revenue-
eroding measures have been legislated over the years, including RA 9504 that was passed in
early 2008 to give some (tax) relief to minimum wage earners. Moreover, evidence of further
deterioration in tax administration is evident with respect to the collection of the VAT and
excise taxes while the inherent difficulties in collecting taxes from nonwage earners have not
been addressed (Manasan 2010).
0.0
2.0
4.0
6.0
8.0
10.0
12.0
14.0
16.0
18.0
20.0
1975
1976
1977
1978
1979
198
0 1
981
198
2 1
983
198
4 1
985
198
6 1
987
198
819
8919
9019
9119
9219
9319
9419
9519
9619
9719
9819
9920
0020
0120
0220
0320
0420
0520
0620
0720
0820
0920
1020
1120
12
% to GDPFigure 9. NG Revenue Effort, 1975-2012
Total Revenues net of privatization proceeds Tax Revenues
Bureau of Internal Revenue Bureau of Customs
Marcos Aquino I Ramos Estrada Arroyo
Source of basic data: Bureau of Treasury
Assessment of revenue performance under the Aquino II administration
The Aquino II administration posted laudable gains in the overall revenue effort since it
assumed office. These gains are most pronounced in the case of the BIR. BOC tax effort
actually deteriorated in the first semester of 2011 and only partially recovered lost ground in
the first semester of 2012. In the case of nontax revenue effort, improvements were evident in
the first and second semesters of 2011 but stagnated in 2012. Moreover, these gains are not
enough to fully reverse the decline in national government revenue effort since 1997.
In particular, BIR collections increased from 8.8 percent of GDP in the second
semester of 2009 to 8.9 percent of GDP in the second semester of 2010 (Table 7). Similarly,
BIR collections went up from 9.1 percent of GDP in the entire year of 2010 to 9.5 percent of
GDP in the entire year of 2011, the first year of the Aquino II administration and to 10.0
percent of GDP in 2012. Despite these improvements, BIR tax effort in 2012 is still lower
than the local peak of 10.4 percent of GDP in 2006 and 2007.
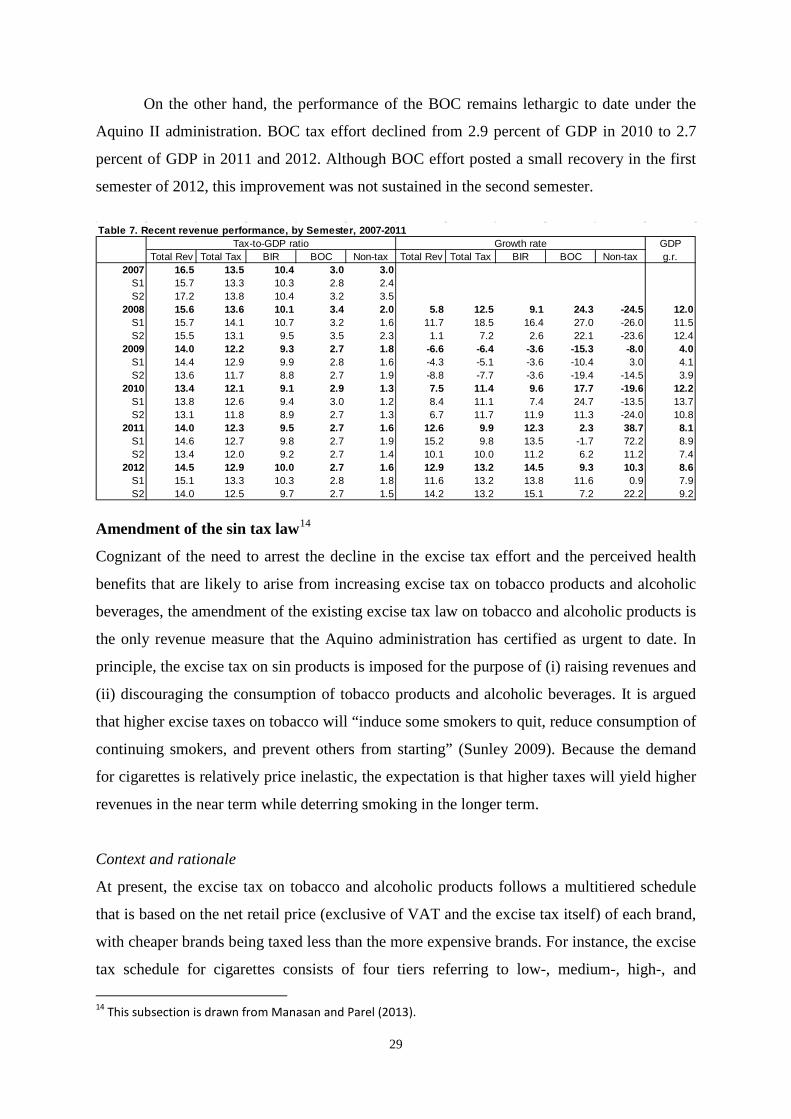
29
On the other hand, the performance of the BOC remains lethargic to date under the
Aquino II administration. BOC tax effort declined from 2.9 percent of GDP in 2010 to 2.7
percent of GDP in 2011 and 2012. Although BOC effort posted a small recovery in the first
semester of 2012, this improvement was not sustained in the second semester.
Table 7. Recent revenue performance, by Semester, 2007-2011
GDPTotal Rev Total Tax BIR BOC Non-tax Total Rev Total Tax BIR BOC Non-tax g.r.
2007 16.5 13.5 10.4 3.0 3.0S1 15.7 13.3 10.3 2.8 2.4S2 17.2 13.8 10.4 3.2 3.5
2008 15.6 13.6 10.1 3.4 2.0 5.8 12.5 9.1 24.3 -24.5 12.0S1 15.7 14.1 10.7 3.2 1.6 11.7 18.5 16.4 27.0 -26.0 11.5S2 15.5 13.1 9.5 3.5 2.3 1.1 7.2 2.6 22.1 -23.6 12.4
2009 14.0 12.2 9.3 2.7 1.8 -6.6 -6.4 -3.6 -15.3 -8.0 4.0S1 14.4 12.9 9.9 2.8 1.6 -4.3 -5.1 -3.6 -10.4 3.0 4.1S2 13.6 11.7 8.8 2.7 1.9 -8.8 -7.7 -3.6 -19.4 -14.5 3.9
2010 13.4 12.1 9.1 2.9 1.3 7.5 11.4 9.6 17.7 -19.6 12.2S1 13.8 12.6 9.4 3.0 1.2 8.4 11.1 7.4 24.7 -13.5 13.7S2 13.1 11.8 8.9 2.7 1.3 6.7 11.7 11.9 11.3 -24.0 10.8
2011 14.0 12.3 9.5 2.7 1.6 12.6 9.9 12.3 2.3 38.7 8.1S1 14.6 12.7 9.8 2.7 1.9 15.2 9.8 13.5 -1.7 72.2 8.9S2 13.4 12.0 9.2 2.7 1.4 10.1 10.0 11.2 6.2 11.2 7.4
2012 14.5 12.9 10.0 2.7 1.6 12.9 13.2 14.5 9.3 10.3 8.6S1 15.1 13.3 10.3 2.8 1.8 11.6 13.2 13.8 11.6 0.9 7.9S2 14.0 12.5 9.7 2.7 1.5 14.2 13.2 15.1 7.2 22.2 9.2
Tax-to-GDP ratio Growth rate
Amendment of the sin tax law14
Cognizant of the need to arrest the decline in the excise tax effort and the perceived health
benefits that are likely to arise from increasing excise tax on tobacco products and alcoholic
beverages, the amendment of the existing excise tax law on tobacco and alcoholic products is
the only revenue measure that the Aquino administration has certified as urgent to date. In
principle, the excise tax on sin products is imposed for the purpose of (i) raising revenues and
(ii) discouraging the consumption of tobacco products and alcoholic beverages. It is argued
that higher excise taxes on tobacco will “induce some smokers to quit, reduce consumption of
continuing smokers, and prevent others from starting” (Sunley 2009). Because the demand
for cigarettes is relatively price inelastic, the expectation is that higher taxes will yield higher
revenues in the near term while deterring smoking in the longer term.
Context and rationale
At present, the excise tax on tobacco and alcoholic products follows a multitiered schedule
that is based on the net retail price (exclusive of VAT and the excise tax itself) of each brand,
with cheaper brands being taxed less than the more expensive brands. For instance, the excise
tax schedule for cigarettes consists of four tiers referring to low-, medium-, high-, and 14 This subsection is drawn from Manasan and Parel (2013).
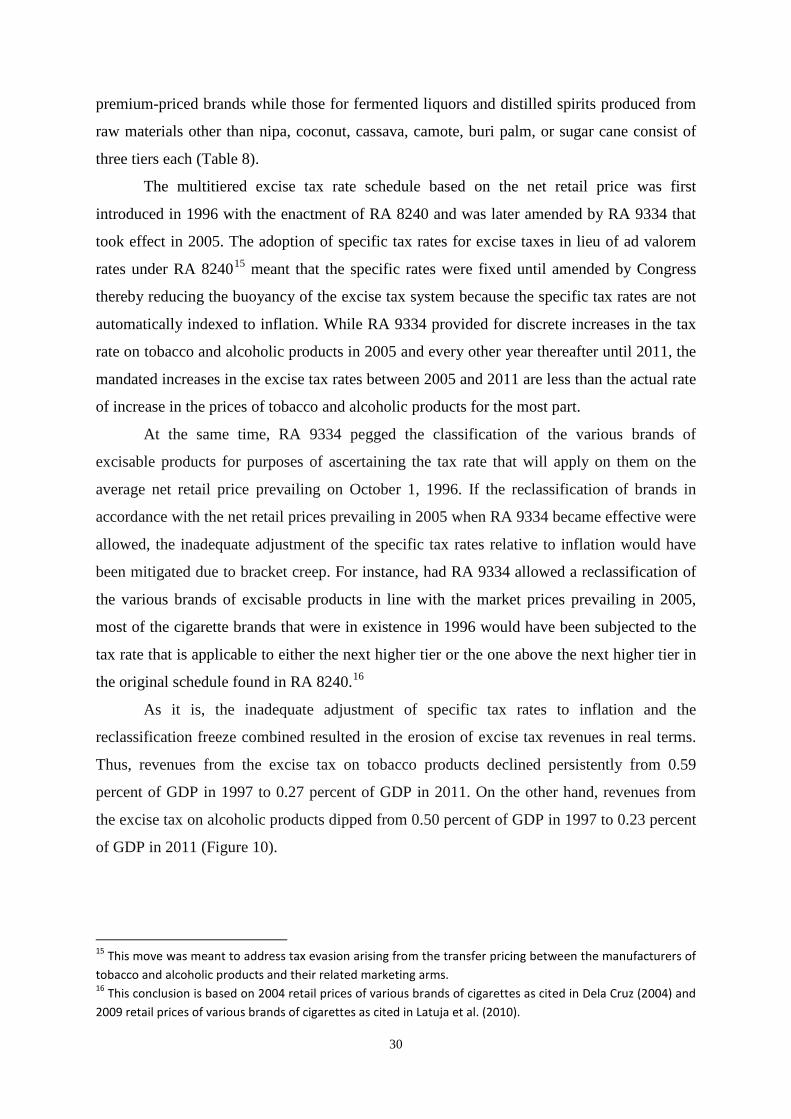
30
premium-priced brands while those for fermented liquors and distilled spirits produced from
raw materials other than nipa, coconut, cassava, camote, buri palm, or sugar cane consist of
three tiers each (Table 8).
The multitiered excise tax rate schedule based on the net retail price was first
introduced in 1996 with the enactment of RA 8240 and was later amended by RA 9334 that
took effect in 2005. The adoption of specific tax rates for excise taxes in lieu of ad valorem
rates under RA 824015 meant that the specific rates were fixed until amended by Congress
thereby reducing the buoyancy of the excise tax system because the specific tax rates are not
automatically indexed to inflation. While RA 9334 provided for discrete increases in the tax
rate on tobacco and alcoholic products in 2005 and every other year thereafter until 2011, the
mandated increases in the excise tax rates between 2005 and 2011 are less than the actual rate
of increase in the prices of tobacco and alcoholic products for the most part.
At the same time, RA 9334 pegged the classification of the various brands of
excisable products for purposes of ascertaining the tax rate that will apply on them on the
average net retail price prevailing on October 1, 1996. If the reclassification of brands in
accordance with the net retail prices prevailing in 2005 when RA 9334 became effective were
allowed, the inadequate adjustment of the specific tax rates relative to inflation would have
been mitigated due to bracket creep. For instance, had RA 9334 allowed a reclassification of
the various brands of excisable products in line with the market prices prevailing in 2005,
most of the cigarette brands that were in existence in 1996 would have been subjected to the
tax rate that is applicable to either the next higher tier or the one above the next higher tier in
the original schedule found in RA 8240.16
As it is, the inadequate adjustment of specific tax rates to inflation and the
reclassification freeze combined resulted in the erosion of excise tax revenues in real terms.
Thus, revenues from the excise tax on tobacco products declined persistently from 0.59
percent of GDP in 1997 to 0.27 percent of GDP in 2011. On the other hand, revenues from
the excise tax on alcoholic products dipped from 0.50 percent of GDP in 1997 to 0.23 percent
of GDP in 2011 (Figure 10).
15 This move was meant to address tax evasion arising from the transfer pricing between the manufacturers of tobacco and alcoholic products and their related marketing arms. 16 This conclusion is based on 2004 retail prices of various brands of cigarettes as cited in Dela Cruz (2004) and 2009 retail prices of various brands of cigarettes as cited in Latuja et al. (2010).
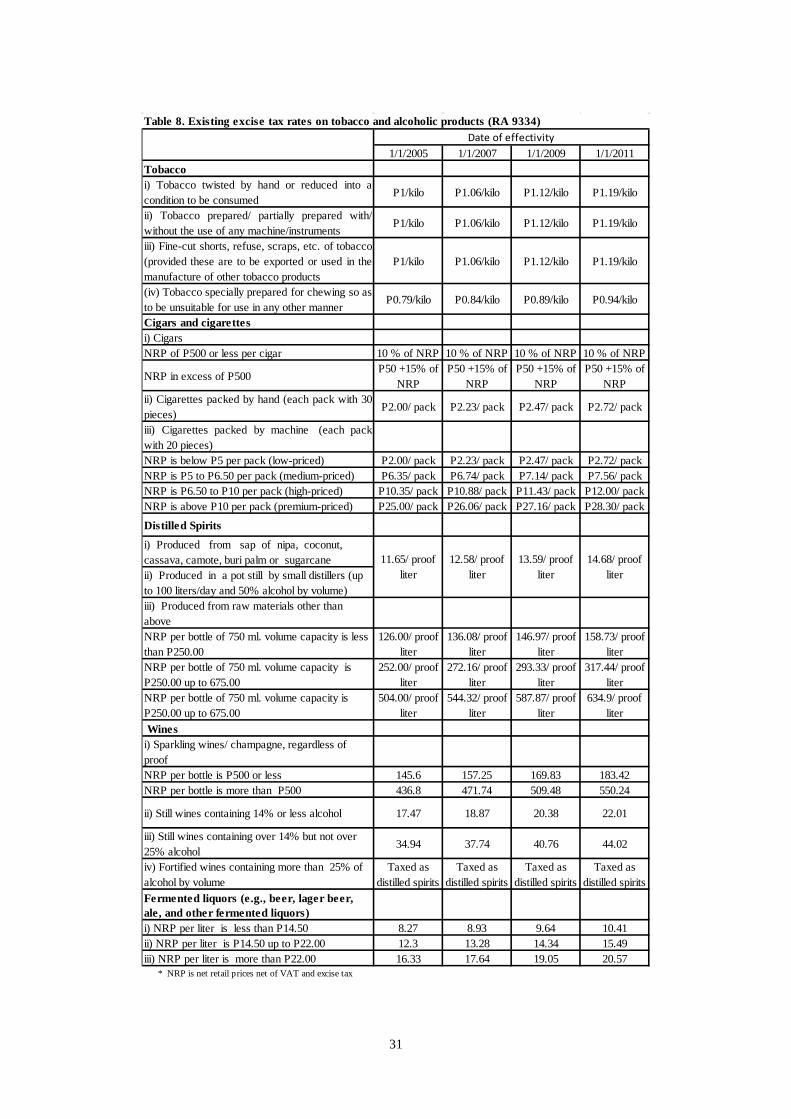
31
Table 8. Existing excise tax rates on tobacco and alcoholic products (RA 9334)
1/1/2005 1/1/2007 1/1/2009 1/1/2011Tobaccoi) Tobacco twisted by hand or reduced into acondition to be consumed
P1/kilo P1.06/kilo P1.12/kilo P1.19/kilo
ii) Tobacco prepared/ partially prepared with/without the use of any machine/instruments
P1/kilo P1.06/kilo P1.12/kilo P1.19/kilo
iii) Fine-cut shorts, refuse, scraps, etc. of tobacco(provided these are to be exported or used in themanufacture of other tobacco products
P1/kilo P1.06/kilo P1.12/kilo P1.19/kilo
(iv) Tobacco specially prepared for chewing so asto be unsuitable for use in any other manner
P0.79/kilo P0.84/kilo P0.89/kilo P0.94/kilo
Cigars and cigarettesi) CigarsNRP of P500 or less per cigar 10 % of NRP 10 % of NRP 10 % of NRP 10 % of NRP
NRP in excess of P500P50 +15% of
NRPP50 +15% of
NRPP50 +15% of
NRPP50 +15% of
NRPii) Cigarettes packed by hand (each pack with 30pieces)
P2.00/ pack P2.23/ pack P2.47/ pack P2.72/ pack
iii) Cigarettes packed by machine (each packwith 20 pieces)NRP is below P5 per pack (low-priced) P2.00/ pack P2.23/ pack P2.47/ pack P2.72/ packNRP is P5 to P6.50 per pack (medium-priced) P6.35/ pack P6.74/ pack P7.14/ pack P7.56/ packNRP is P6.50 to P10 per pack (high-priced) P10.35/ pack P10.88/ pack P11.43/ pack P12.00/ packNRP is above P10 per pack (premium-priced) P25.00/ pack P26.06/ pack P27.16/ pack P28.30/ pack
Distilled Spirits
i) Produced from sap of nipa, coconut, cassava, camote, buri palm or sugarcaneii) Produced in a pot still by small distillers (up to 100 liters/day and 50% alcohol by volume)iii) Produced from raw materials other than aboveNRP per bottle of 750 ml. volume capacity is less than P250.00
126.00/ proof liter
136.08/ proof liter
146.97/ proof liter
158.73/ proof liter
NRP per bottle of 750 ml. volume capacity is P250.00 up to 675.00
252.00/ proof liter
272.16/ proof liter
293.33/ proof liter
317.44/ proof liter
NRP per bottle of 750 ml. volume capacity is P250.00 up to 675.00
504.00/ proof liter
544.32/ proof liter
587.87/ proof liter
634.9/ proof liter
Wines i) Sparkling wines/ champagne, regardless of proofNRP per bottle is P500 or less 145.6 157.25 169.83 183.42NRP per bottle is more than P500 436.8 471.74 509.48 550.24
ii) Still wines containing 14% or less alcohol 17.47 18.87 20.38 22.01
iii) Still wines containing over 14% but not over 25% alcohol
34.94 37.74 40.76 44.02
iv) Fortified wines containing more than 25% of alcohol by volume
Taxed as distilled spirits
Taxed as distilled spirits
Taxed as distilled spirits
Taxed as distilled spirits
Fermented liquors (e.g., beer, lager beer, ale, and other fermented liquors)i) NRP per liter is less than P14.50 8.27 8.93 9.64 10.41ii) NRP per liter is P14.50 up to P22.00 12.3 13.28 14.34 15.49iii) NRP per liter is more than P22.00 16.33 17.64 19.05 20.57 * NRP is net retail prices net of VAT and excise tax
11.65/ proof liter
12.58/ proof liter
13.59/ proof liter
14.68/ proof liter
Date of effectivity
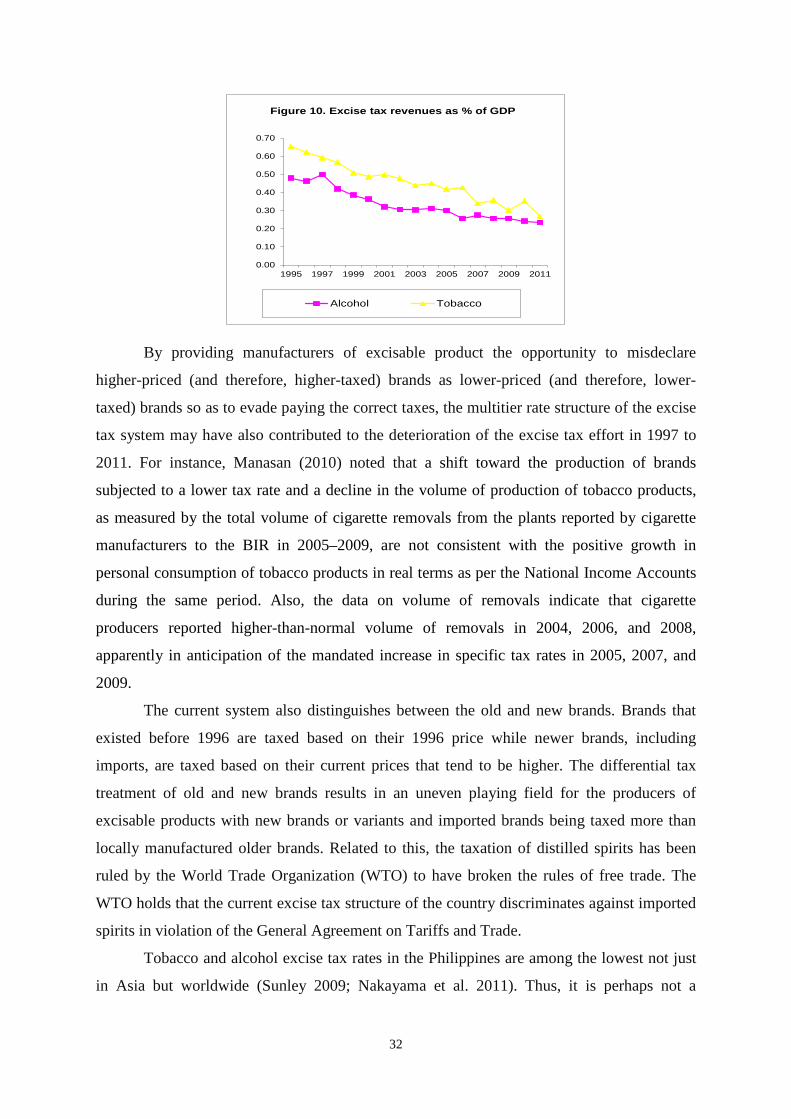
32
0.00
0.10
0.20
0.30
0.40
0.50
0.60
0.70
1995 1997 1999 2001 2003 2005 2007 2009 2011
Figure 10. Excise tax revenues as % of GDP
Alcohol Tobacco
By providing manufacturers of excisable product the opportunity to misdeclare
higher-priced (and therefore, higher-taxed) brands as lower-priced (and therefore, lower-
taxed) brands so as to evade paying the correct taxes, the multitier rate structure of the excise
tax system may have also contributed to the deterioration of the excise tax effort in 1997 to
2011. For instance, Manasan (2010) noted that a shift toward the production of brands
subjected to a lower tax rate and a decline in the volume of production of tobacco products,
as measured by the total volume of cigarette removals from the plants reported by cigarette
manufacturers to the BIR in 2005–2009, are not consistent with the positive growth in
personal consumption of tobacco products in real terms as per the National Income Accounts
during the same period. Also, the data on volume of removals indicate that cigarette
producers reported higher-than-normal volume of removals in 2004, 2006, and 2008,
apparently in anticipation of the mandated increase in specific tax rates in 2005, 2007, and
2009.
The current system also distinguishes between the old and new brands. Brands that
existed before 1996 are taxed based on their 1996 price while newer brands, including
imports, are taxed based on their current prices that tend to be higher. The differential tax
treatment of old and new brands results in an uneven playing field for the producers of
excisable products with new brands or variants and imported brands being taxed more than
locally manufactured older brands. Related to this, the taxation of distilled spirits has been
ruled by the World Trade Organization (WTO) to have broken the rules of free trade. The
WTO holds that the current excise tax structure of the country discriminates against imported
spirits in violation of the General Agreement on Tariffs and Trade.
Tobacco and alcohol excise tax rates in the Philippines are among the lowest not just
in Asia but worldwide (Sunley 2009; Nakayama et al. 2011). Thus, it is perhaps not a
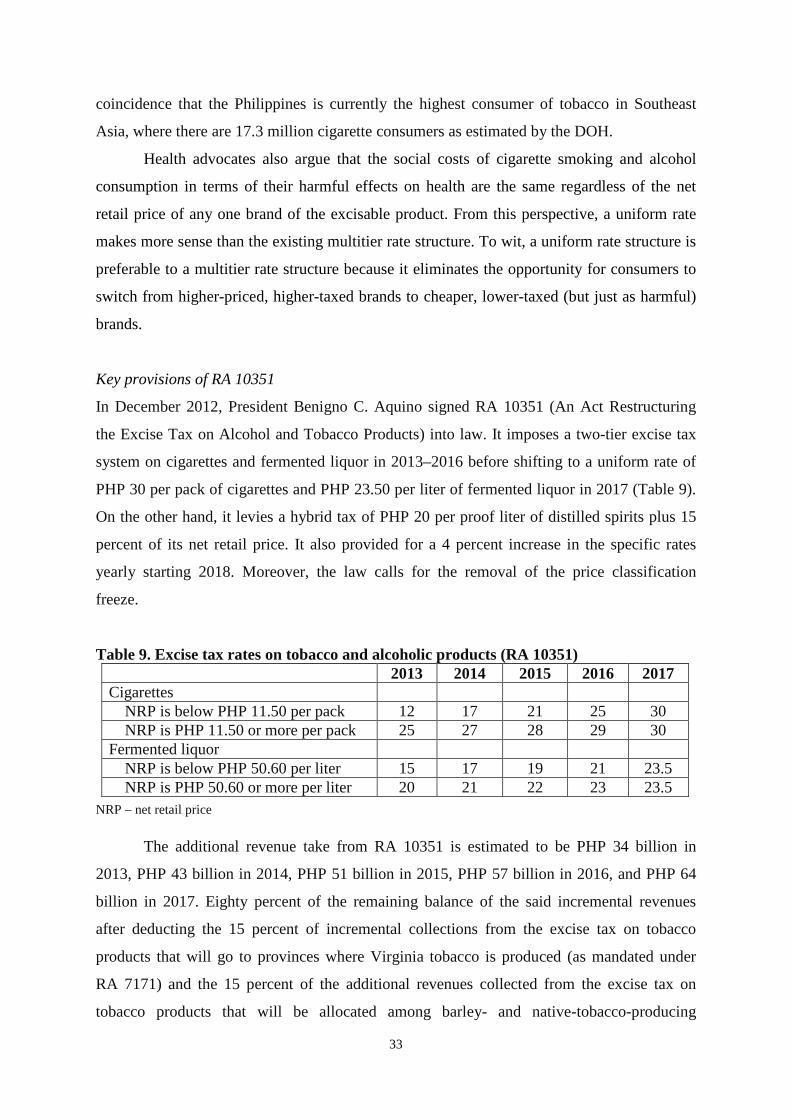
33
coincidence that the Philippines is currently the highest consumer of tobacco in Southeast
Asia, where there are 17.3 million cigarette consumers as estimated by the DOH.
Health advocates also argue that the social costs of cigarette smoking and alcohol
consumption in terms of their harmful effects on health are the same regardless of the net
retail price of any one brand of the excisable product. From this perspective, a uniform rate
makes more sense than the existing multitier rate structure. To wit, a uniform rate structure is
preferable to a multitier rate structure because it eliminates the opportunity for consumers to
switch from higher-priced, higher-taxed brands to cheaper, lower-taxed (but just as harmful)
brands.
Key provisions of RA 10351
In December 2012, President Benigno C. Aquino signed RA 10351 (An Act Restructuring
the Excise Tax on Alcohol and Tobacco Products) into law. It imposes a two-tier excise tax
system on cigarettes and fermented liquor in 2013–2016 before shifting to a uniform rate of
PHP 30 per pack of cigarettes and PHP 23.50 per liter of fermented liquor in 2017 (Table 9).
On the other hand, it levies a hybrid tax of PHP 20 per proof liter of distilled spirits plus 15
percent of its net retail price. It also provided for a 4 percent increase in the specific rates
yearly starting 2018. Moreover, the law calls for the removal of the price classification
freeze.
Table 9. Excise tax rates on tobacco and alcoholic products (RA 10351) 2013 2014 2015 2016 2017 Cigarettes NRP is below PHP 11.50 per pack 12 17 21 25 30 NRP is PHP 11.50 or more per pack 25 27 28 29 30 Fermented liquor NRP is below PHP 50.60 per liter 15 17 19 21 23.5 NRP is PHP 50.60 or more per liter 20 21 22 23 23.5
NRP – net retail price
The additional revenue take from RA 10351 is estimated to be PHP 34 billion in
2013, PHP 43 billion in 2014, PHP 51 billion in 2015, PHP 57 billion in 2016, and PHP 64
billion in 2017. Eighty percent of the remaining balance of the said incremental revenues
after deducting the 15 percent of incremental collections from the excise tax on tobacco
products that will go to provinces where Virginia tobacco is produced (as mandated under
RA 7171) and the 15 percent of the additional revenues collected from the excise tax on
tobacco products that will be allocated among barley- and native-tobacco-producing
34
provinces (as mandated under RA 8240) shall be allocated for the universal health care under
the National Health Insurance Program, the attainment of the Millennium Development
Goals, and health awareness campaigns. On the other hand, the remaining 20 percent of the
remaining balance shall be allocated based on political and district subdivisions for medical
assistance and the health facilities enhancement program.
RA 10351 appears to have successfully put together the desirable provisions of the
House and Senate versions of the sin tax bill. The law has greatly simplified the tax structure
by adopting a unitary excise tax rate for cigarettes, fermented liquor, and distilled spirits.
Such a shift away from the existing multitiered tax structure will tend to result in greater ease
in tax administration by minimizing the opportunities for misclassification or misdeclaration
of goods and transactions. Furthermore, such a move will tend to minimize the downshifting
to cheaper brands thus tending to reduce consumption of tobacco products and alcoholic
beverages better.
Although RA 10351 does not allow for the automatic indexation of the excise tax
rates to inflation, it does allow for a 4 percent increase in the excise tax rates yearly from
2018 onwards. This change will not only yield additional revenues in the near term but will
also prevent the erosion of excise tax revenues in real terms over the long term. Furthermore,
a yearly adjustment in the excise tax rate is preferable over an adjustment that occurs every
other year as proposed to the House version because the latter tends to give manufacturers the
opportunity to avoid taxes by reporting higher-than-normal volume of removals in the year
prior to the mandated increase in specific rates.
Also, by doing away with the freeze on price classification of excisable products, RA
10351 eliminates the preferential tax treatment given to existing brands over new entrants and
imports. Such a move tends to level the playing field among the various industry players and
enables the country to comply with WTO requirements. On the other hand, the provision
concerning the local content of tobacco products in the Senate version is muted somewhat in
the bicameral version which states that, “Of the total volume of cigarettes sold in the country,
any manufacturer and/or seller of tobacco products must source at least 15% of its tobacco
leaf raw materials supply locally, subject to adjustment based on international treaty
commitments."
While RA 10351 removed the very detailed earmarking provisions found in the
Senate version of the sin tax bill, earmarking of the incremental revenues resulting from the
proposed amendment to the excise tax law continues to be one of its major features. The
arguments against earmarking in the public finance literature are well known. To wit,
35
earmarking is said to lead “to inefficient budgeting, essentially because it creates rigidities in
the expenditure allocation process and prevents authorities from smoothly reallocating funds
when spending priorities change.” Also, when earmarked funds are off-budget, some loss in
budgetary accountability may result because “off-budget often means out of sight and out of
mind” (Bird and Jun 2005). However, earmarking may be justified if there is a close link
between the payment of earmarked taxes and the benefits accruing to the taxpayer from the
favored expenditures as this is consistent with the benefit principle of taxation. But the
International Monetary Fund pointed out that “it is difficult to isolate health expenditure on
smoking related diseases and finance them by tobacco duties” or taxes (Nakayama et al.
2011).
Financing Program
Given the emerging fiscal picture for 2012, the debt sustainability analysis that was
undertaken in the section “Overall Fiscal Position in Perspective” indicates that the fiscal
deficit targets embodied in the 2013 PB will result in a consistent reduction of the
outstanding debt stock of the national government. Thus, the national government debt stock
is projected to decline persistently from 54.8 percent of GDP in 2009 to 52.4 percent in 2010,
50.9 percent in 2011, and 51.4 percent in 2012 (Figure 2).
Given the uncertainties in the international financial market, the financing of the
national government aims to (i) shift the national government borrowing mix toward a 25:75
ratio in favor of domestic borrowing and (ii) extend the maturities of existing debt. These
changes are evident in the programmed borrowing mix in 2011–2012. Specifically, net
domestic borrowing rose from 55.4 percent in 2011 to 87.0 percent in 2012 (Figure 11).
Consequently, the share of domestic debt to total national government outstanding debt
inclusive of contingent liabilities expanded from 53.5 percent in 2010 to 54.9 percent in 2011
and 60.8 percent in 2012 (Figure 12). At the same time, the country’s debt profile improved
as the share of debt with long-term maturities in the total debt stock of the national
government increased from 73.6 percent in 2010 to 86.2 percent in 2012 while the share of
short-term debt to total national government debt decreased from 11.2 percent to 5.1 percent
(Figure 13).
The trends described above are expected to persist as the profile of national
government borrowing in 2013 continues to be biased in favor of domestic borrowings. To
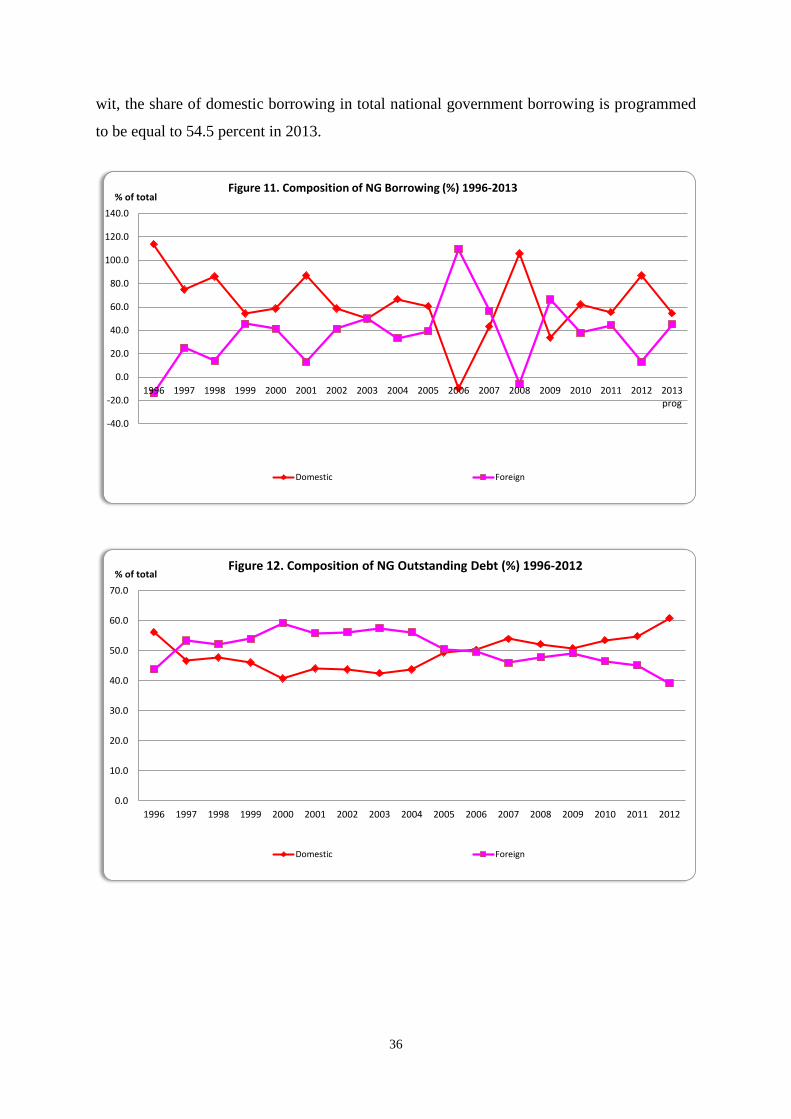
36
wit, the share of domestic borrowing in total national government borrowing is programmed
to be equal to 54.5 percent in 2013.
-40.0
-20.0
0.0
20.0
40.0
60.0
80.0
100.0
120.0
140.0
1996 1997 1998 1999 2000 2001 2002 2003 2004 2005 2006 2007 2008 2009 2010 2011 2012 2013prog
% of totalFigure 11. Composition of NG Borrowing (%) 1996-2013
Domestic Foreign
0.0
10.0
20.0
30.0
40.0
50.0
60.0
70.0
1996 1997 1998 1999 2000 2001 2002 2003 2004 2005 2006 2007 2008 2009 2010 2011 2012
% of totalFigure 12. Composition of NG Outstanding Debt (%) 1996-2012
Domestic Foreign

37
0.0
10.0
20.0
30.0
40.0
50.0
60.0
70.0
80.0
90.0
100.0
1996 1997 1998 1999 2000 2001 2002 2003 2004 2005 2006 2007 2008 2009 2010 2011 2012
% of totalFigure 13. Distribution of NG Outstanding Debt, by Maturity, 1996-2012
Short-term Medium-term Long-term
Conclusion
Significant improvements in tax efforts, specifically by the BIR, as well as markedly lower
than programmed government expenditures since 2011, have resulted in improved fiscal
performance of the country. Fiscal deficits in 2011 and 2012 are lower than the programmed
levels, while outstanding national government debt stocks in both years are lower than both
the projected levels and the 2010 level.
It appears that the fiscal deficit target for 2013 can be met, or can even be lower than
the projected target. This is due to the expectation that government revenues will be higher
than the projections of the BESF. Although this paper projects the BOC collections and
nontax revenues to be equal to their 2011 and 2012 levels, additional government revenues
are expected from BIR collections, which are targeted to reach PHP 1.26 trillion in 2013, in
contrast to the PHP 1.24 trillion target under the PB. This can be met provided the BIR is able
to improve its tax efforts in the same manner it did in 2011 and 2012, and taking into account
the passage of the amendments to the excise tax law on sin products that is estimated to yield
an additional revenue of PHP 34 billion in 2013.
In line with the government’s goal of a more inclusive growth, a more balanced
distribution of the budget between the social services and economic services sectors has
characterized the 2013 NEP. Nevertheless, the social services sector still accounts for more
than half of the PHP 190 billion increase in the expenditure program for 2013. Of the social
services, the education sector has the largest share (34.6%) in the increment in the total
38
expenditure program of the national government. However, the budget for basic education
still compares unfavorably with those of our neighbors in Southeast Asia. On the other hand,
national defense receives the lowest budget share among the major expenditure groups.
Finally, this paper highlights the improving debt profile of the country. It is expected
that in 2013, the trends in national government borrowing will continue to be biased in favor
of domestic borrowings.
References
Anand, R. and S. Wijnbergen. 1989. Inflation and the financing of government expenditure:
An introductory analysis with an application to Turkey. World Bank Economic
Review 3(1):17–38.
Bird, R. and J. Jun. 2005. Earmarking in theory and Korean practice. Working Paper 05-15.
Atlanta, Georgia: Andrew Young School of Policy Studies, Georgia State University.
http://aysps.gsu.edu/isp/files/ispwp0515.pdf (accessed November 22, 2012).
Catsambas, T. and M. Pigato. 1989. The consistency of government deficits with
macroeconomic adjustment: An application to Kenya and Ghana. Working Paper
Series 287. Washington, D.C.: World Bank. http://econ.worldbank.org/external/
default/main?pagePK=64165259&theSitePK=469072&piPK=64165421&menuPK
=64166093&entityID=000009265_3960928082353 (accessed November 2, 2012).
Chaudhury, N., J. Friedman, and J. Onishi. 2013. Philippines conditional cash transfer
program impact evaluation 2012. Washington, D.C.: World Bank. http://pantawid
.dswd.gov.ph/images/philippines_conditional_cash_transfer_program_impact
_evaluation_2012.pdf (accessed November 4, 2012).
David, C.C. 2003. Agriculture. In The Philippine economy: Development, policies, and
challenges, eds. A.M. Balisacan and H. Hill. New York: Oxford University Press.
———, R.M. Briones, A.E. Inocencio, P.S. Intal, Jr., M.P.S. Geron, and M.M. Ballesteros.
2012. Monitoring and evaluation of agricultural policy indicators. PIDS Discussion
Paper No. 2012-26. Makati City: Philippine Institute for Development Studies.
Dela Cruz, R. 2004. The smoking gun. Today, November 10. http://www3.pids.gov.ph/ris/
pitn/today_nov10.pdf (accessed November 22, 2012).
Department of Health (DOH). 2010. PhilHealth benefit delivery review: A consolidated
report on a review of PhilHealth performance in implementing the National Health
39
Insurance Program. Health Sector Reform Agenda (HSRA Technical Report). Manila:
DOH.
Fedelino, A., A. Ivanona, and M. Horton. 2009. Computing cyclically adjusted balances and
automatic stabilizers. Technical Notes and Manuals. Washington, D.C.: International
Monetary Fund. http://www.imf.org/external/pubs/ft/tnm/2009/tnm0905.pdf
(accessed November 5, 2012).
Landingin, R.R. 2012. More open bids, savings up amid project delays. Manila: Philippine
Center for Investigative Journalism, April 8. http://pcij.org/stories/more-open-bids
-savings-up-amid-project-delays/ (accessed November 2, 2012).
Latuja, J., I. Reyes, D. Sy, U. Dorotheo, R. Prugsamatz, and J. Reyes. 2010. Philippines
tobacco report card. Health Justice Philippines. http://healthjustice.ph/attachments/
124_Philippines%20Tax%20Report%20Card.pdf (accessed November 22, 2012).
Manasan, R.G. 2013. Analysis of the President’s Budget for 2012: Financing of state
universities and colleges. Makati City: Philippines Institute for Development Studies.
———. 2011. Analysis of the President’s Budget for 2012. PIDS Discussion Paper No.
2011-20. Makati City: Philippine Institute for Development Studies.
———. 2011a. Expanding social health insurance coverage: New issues and challenges.
PIDS Discussion Paper No. 2011-21. Makati City: Philippine Institute for
Development Studies.
———. 2011b. Pantawid Pamilyang Pilipino Program and school attendance: Early
indications of success. PIDS Policy Notes No. 2011-19. Makati City: Philippine
Institute for Development Studies.
———. 2010. Financing the MDGs and inclusive growth in the time of fiscal consolidation.
PIDS Discussion Paper No. 2010-34. Makati City: Philippine Institute for
Development Studies.
——— and D.K. Parel. 2013. Amending the sin tax law. PIDS Discussion Paper No. 2013-
19. Makati City: Philippine Institute for Development Studies.
——— and J.S. Cuenca. 2010. Multiyear spending plan for the Department of Health: An
update. Report submitted to the Department of Health. Unpublished.
Nakayama, K., S. Caner, and P. Mullins. 2011. Philippines: Road map for a pro-growth
equitable tax system. IMF Country Report No. 12/60. http://www.imf.org/external/
pubs/ft/ scr/2012/cr1260.pdf (accessed November 22, 2012).
40
National Economic and Development Authority (NEDA). 2011. Philippine Development
Plan 2011–2014. Manila: NEDA. http://www.neda.gov.ph/PDP/2011-2016/ (accessed
November 5, 2012).
Reyes, C.M. and A.D. Tabuga. 2012. Conditional cash transfer program in the Philippines: Is
it reaching the extremely poor? PIDS Discussion Paper Series No. 2012-42. Makati
City: Philippine Institute for Development Studies.
Sunley, E. 2009. Taxation of cigarettes in the Bloomberg Initiative countries: Overview of
policy issues and proposal for reform. Report submitted to the Bloomberg Initiative to
Reduce Tobacco Use under a contract from the International Union Against
Tubercolosis and Lung Disease. http://tobaccofreecenter.org/files/pdfs/en/
Cigarette_tax_BIcountries.pdf (accessed August 24, 2010).
World Bank. 2012. Philippines - Basic education: Public expenditure review. Washington
D.C.: The Worldbank. http://documents.worldbank.org/curated/en/2012/01/16764589/
philippines-basic-education-public-expenditure-review (accessed November 5, 2012).
———. 2007. Philippines: Agriculture public expenditure review. Technical Working Paper
No. 40493. Washington, D.C.: World Bank.
———. 2005. Philippines: Meeting infrastructure challenges. Washington, D.C.: World
Bank.

41
APPENDIX TABLES
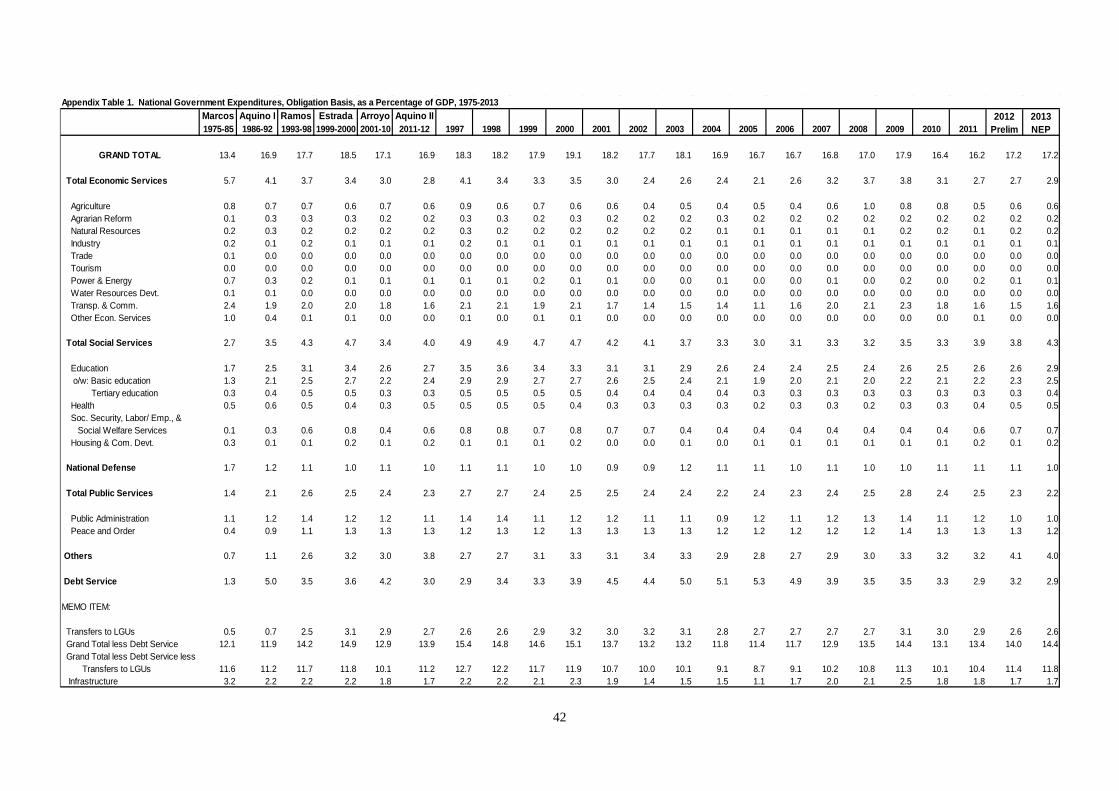
42
Appendix Table 1. National Government Expenditures, Obligation Basis, as a Percentage of GDP, 1975-2013Marcos Aquino I Ramos Estrada Arroyo Aquino II1975-85 1986-92 1993-98 1999-2000 2001-10 2011-12 1997 1998 1999 2000 2001 2002 2003 2004 2005 2006 2007 2008 2009 2010 2011
GRAND TOTAL 13.4 16.9 17.7 18.5 17.1 16.9 18.3 18.2 17.9 19.1 18.2 17.7 18.1 16.9 16.7 16.7 16.8 17.0 17.9 16.4 16.2 17.2 17.2
Total Economic Services 5.7 4.1 3.7 3.4 3.0 2.8 4.1 3.4 3.3 3.5 3.0 2.4 2.6 2.4 2.1 2.6 3.2 3.7 3.8 3.1 2.7 2.7 2.9
Agriculture 0.8 0.7 0.7 0.6 0.7 0.6 0.9 0.6 0.7 0.6 0.6 0.4 0.5 0.4 0.5 0.4 0.6 1.0 0.8 0.8 0.5 0.6 0.6 Agrarian Reform 0.1 0.3 0.3 0.3 0.2 0.2 0.3 0.3 0.2 0.3 0.2 0.2 0.2 0.3 0.2 0.2 0.2 0.2 0.2 0.2 0.2 0.2 0.2 Natural Resources 0.2 0.3 0.2 0.2 0.2 0.2 0.3 0.2 0.2 0.2 0.2 0.2 0.2 0.1 0.1 0.1 0.1 0.1 0.2 0.2 0.1 0.2 0.2 Industry 0.2 0.1 0.2 0.1 0.1 0.1 0.2 0.1 0.1 0.1 0.1 0.1 0.1 0.1 0.1 0.1 0.1 0.1 0.1 0.1 0.1 0.1 0.1 Trade 0.1 0.0 0.0 0.0 0.0 0.0 0.0 0.0 0.0 0.0 0.0 0.0 0.0 0.0 0.0 0.0 0.0 0.0 0.0 0.0 0.0 0.0 0.0 Tourism 0.0 0.0 0.0 0.0 0.0 0.0 0.0 0.0 0.0 0.0 0.0 0.0 0.0 0.0 0.0 0.0 0.0 0.0 0.0 0.0 0.0 0.0 0.0 Power & Energy 0.7 0.3 0.2 0.1 0.1 0.1 0.1 0.1 0.2 0.1 0.1 0.0 0.0 0.1 0.0 0.0 0.1 0.0 0.2 0.0 0.2 0.1 0.1 Water Resources Devt. 0.1 0.1 0.0 0.0 0.0 0.0 0.0 0.0 0.0 0.0 0.0 0.0 0.0 0.0 0.0 0.0 0.0 0.0 0.0 0.0 0.0 0.0 0.0 Transp. & Comm. 2.4 1.9 2.0 2.0 1.8 1.6 2.1 2.1 1.9 2.1 1.7 1.4 1.5 1.4 1.1 1.6 2.0 2.1 2.3 1.8 1.6 1.5 1.6 Other Econ. Services 1.0 0.4 0.1 0.1 0.0 0.0 0.1 0.0 0.1 0.1 0.0 0.0 0.0 0.0 0.0 0.0 0.0 0.0 0.0 0.0 0.1 0.0 0.0
Total Social Services 2.7 3.5 4.3 4.7 3.4 4.0 4.9 4.9 4.7 4.7 4.2 4.1 3.7 3.3 3.0 3.1 3.3 3.2 3.5 3.3 3.9 3.8 4.3
Education 1.7 2.5 3.1 3.4 2.6 2.7 3.5 3.6 3.4 3.3 3.1 3.1 2.9 2.6 2.4 2.4 2.5 2.4 2.6 2.5 2.6 2.6 2.9 o/w: Basic education 1.3 2.1 2.5 2.7 2.2 2.4 2.9 2.9 2.7 2.7 2.6 2.5 2.4 2.1 1.9 2.0 2.1 2.0 2.2 2.1 2.2 2.3 2.5 Tertiary education 0.3 0.4 0.5 0.5 0.3 0.3 0.5 0.5 0.5 0.5 0.4 0.4 0.4 0.4 0.3 0.3 0.3 0.3 0.3 0.3 0.3 0.3 0.4 Health 0.5 0.6 0.5 0.4 0.3 0.5 0.5 0.5 0.5 0.4 0.3 0.3 0.3 0.3 0.2 0.3 0.3 0.2 0.3 0.3 0.4 0.5 0.5 Soc. Security, Labor/ Emp., & Social Welfare Services 0.1 0.3 0.6 0.8 0.4 0.6 0.8 0.8 0.7 0.8 0.7 0.7 0.4 0.4 0.4 0.4 0.4 0.4 0.4 0.4 0.6 0.7 0.7 Housing & Com. Devt. 0.3 0.1 0.1 0.2 0.1 0.2 0.1 0.1 0.1 0.2 0.0 0.0 0.1 0.0 0.1 0.1 0.1 0.1 0.1 0.1 0.2 0.1 0.2
National Defense 1.7 1.2 1.1 1.0 1.1 1.0 1.1 1.1 1.0 1.0 0.9 0.9 1.2 1.1 1.1 1.0 1.1 1.0 1.0 1.1 1.1 1.1 1.0
Total Public Services 1.4 2.1 2.6 2.5 2.4 2.3 2.7 2.7 2.4 2.5 2.5 2.4 2.4 2.2 2.4 2.3 2.4 2.5 2.8 2.4 2.5 2.3 2.2
Public Administration 1.1 1.2 1.4 1.2 1.2 1.1 1.4 1.4 1.1 1.2 1.2 1.1 1.1 0.9 1.2 1.1 1.2 1.3 1.4 1.1 1.2 1.0 1.0 Peace and Order 0.4 0.9 1.1 1.3 1.3 1.3 1.2 1.3 1.2 1.3 1.3 1.3 1.3 1.2 1.2 1.2 1.2 1.2 1.4 1.3 1.3 1.3 1.2
Others 0.7 1.1 2.6 3.2 3.0 3.8 2.7 2.7 3.1 3.3 3.1 3.4 3.3 2.9 2.8 2.7 2.9 3.0 3.3 3.2 3.2 4.1 4.0
Debt Service 1.3 5.0 3.5 3.6 4.2 3.0 2.9 3.4 3.3 3.9 4.5 4.4 5.0 5.1 5.3 4.9 3.9 3.5 3.5 3.3 2.9 3.2 2.9
MEMO ITEM:
Transfers to LGUs 0.5 0.7 2.5 3.1 2.9 2.7 2.6 2.6 2.9 3.2 3.0 3.2 3.1 2.8 2.7 2.7 2.7 2.7 3.1 3.0 2.9 2.6 2.6 Grand Total less Debt Service 12.1 11.9 14.2 14.9 12.9 13.9 15.4 14.8 14.6 15.1 13.7 13.2 13.2 11.8 11.4 11.7 12.9 13.5 14.4 13.1 13.4 14.0 14.4 Grand Total less Debt Service less Transfers to LGUs 11.6 11.2 11.7 11.8 10.1 11.2 12.7 12.2 11.7 11.9 10.7 10.0 10.1 9.1 8.7 9.1 10.2 10.8 11.3 10.1 10.4 11.4 11.8 Infrastructure 3.2 2.2 2.2 2.2 1.8 1.7 2.2 2.2 2.1 2.3 1.9 1.4 1.5 1.5 1.1 1.7 2.0 2.1 2.5 1.8 1.8 1.7 1.7
2012 Prelim
2013 NEP
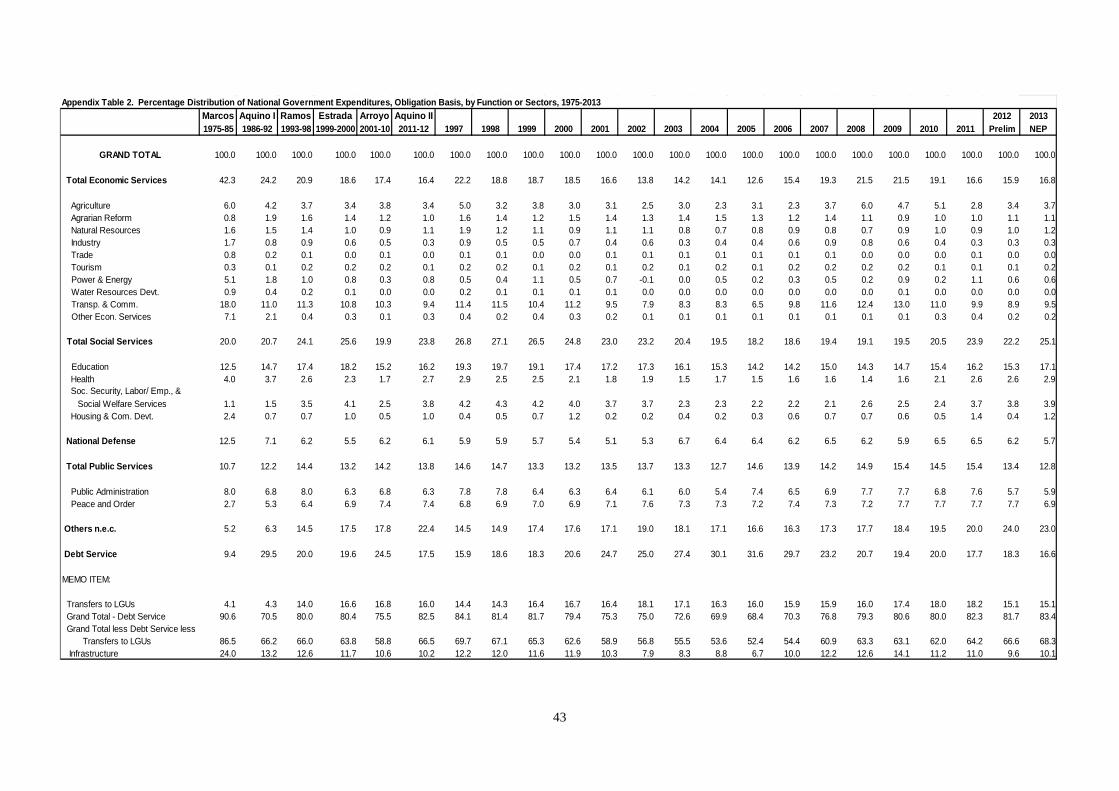
43
Appendix Table 2. Percentage Distribution of National Government Expenditures, Obligation Basis, by Function or Sectors, 1975-2013Marcos Aquino I Ramos Estrada Arroyo Aquino II 2012 20131975-85 1986-92 1993-98 1999-2000 2001-10 2011-12 1997 1998 1999 2000 2001 2002 2003 2004 2005 2006 2007 2008 2009 2010 2011 Prelim NEP
GRAND TOTAL 100.0 100.0 100.0 100.0 100.0 100.0 100.0 100.0 100.0 100.0 100.0 100.0 100.0 100.0 100.0 100.0 100.0 100.0 100.0 100.0 100.0 100.0 100.0
Total Economic Services 42.3 24.2 20.9 18.6 17.4 16.4 22.2 18.8 18.7 18.5 16.6 13.8 14.2 14.1 12.6 15.4 19.3 21.5 21.5 19.1 16.6 15.9 16.8
Agriculture 6.0 4.2 3.7 3.4 3.8 3.4 5.0 3.2 3.8 3.0 3.1 2.5 3.0 2.3 3.1 2.3 3.7 6.0 4.7 5.1 2.8 3.4 3.7 Agrarian Reform 0.8 1.9 1.6 1.4 1.2 1.0 1.6 1.4 1.2 1.5 1.4 1.3 1.4 1.5 1.3 1.2 1.4 1.1 0.9 1.0 1.0 1.1 1.1 Natural Resources 1.6 1.5 1.4 1.0 0.9 1.1 1.9 1.2 1.1 0.9 1.1 1.1 0.8 0.7 0.8 0.9 0.8 0.7 0.9 1.0 0.9 1.0 1.2 Industry 1.7 0.8 0.9 0.6 0.5 0.3 0.9 0.5 0.5 0.7 0.4 0.6 0.3 0.4 0.4 0.6 0.9 0.8 0.6 0.4 0.3 0.3 0.3 Trade 0.8 0.2 0.1 0.0 0.1 0.0 0.1 0.1 0.0 0.0 0.1 0.1 0.1 0.1 0.1 0.1 0.1 0.0 0.0 0.0 0.1 0.0 0.0 Tourism 0.3 0.1 0.2 0.2 0.2 0.1 0.2 0.2 0.1 0.2 0.1 0.2 0.1 0.2 0.1 0.2 0.2 0.2 0.2 0.1 0.1 0.1 0.2 Power & Energy 5.1 1.8 1.0 0.8 0.3 0.8 0.5 0.4 1.1 0.5 0.7 -0.1 0.0 0.5 0.2 0.3 0.5 0.2 0.9 0.2 1.1 0.6 0.6 Water Resources Devt. 0.9 0.4 0.2 0.1 0.0 0.0 0.2 0.1 0.1 0.1 0.1 0.0 0.0 0.0 0.0 0.0 0.0 0.0 0.1 0.0 0.0 0.0 0.0 Transp. & Comm. 18.0 11.0 11.3 10.8 10.3 9.4 11.4 11.5 10.4 11.2 9.5 7.9 8.3 8.3 6.5 9.8 11.6 12.4 13.0 11.0 9.9 8.9 9.5 Other Econ. Services 7.1 2.1 0.4 0.3 0.1 0.3 0.4 0.2 0.4 0.3 0.2 0.1 0.1 0.1 0.1 0.1 0.1 0.1 0.1 0.3 0.4 0.2 0.2
Total Social Services 20.0 20.7 24.1 25.6 19.9 23.8 26.8 27.1 26.5 24.8 23.0 23.2 20.4 19.5 18.2 18.6 19.4 19.1 19.5 20.5 23.9 22.2 25.1
Education 12.5 14.7 17.4 18.2 15.2 16.2 19.3 19.7 19.1 17.4 17.2 17.3 16.1 15.3 14.2 14.2 15.0 14.3 14.7 15.4 16.2 15.3 17.1 Health 4.0 3.7 2.6 2.3 1.7 2.7 2.9 2.5 2.5 2.1 1.8 1.9 1.5 1.7 1.5 1.6 1.6 1.4 1.6 2.1 2.6 2.6 2.9 Soc. Security, Labor/ Emp., & Social Welfare Services 1.1 1.5 3.5 4.1 2.5 3.8 4.2 4.3 4.2 4.0 3.7 3.7 2.3 2.3 2.2 2.2 2.1 2.6 2.5 2.4 3.7 3.8 3.9 Housing & Com. Devt. 2.4 0.7 0.7 1.0 0.5 1.0 0.4 0.5 0.7 1.2 0.2 0.2 0.4 0.2 0.3 0.6 0.7 0.7 0.6 0.5 1.4 0.4 1.2
National Defense 12.5 7.1 6.2 5.5 6.2 6.1 5.9 5.9 5.7 5.4 5.1 5.3 6.7 6.4 6.4 6.2 6.5 6.2 5.9 6.5 6.5 6.2 5.7
Total Public Services 10.7 12.2 14.4 13.2 14.2 13.8 14.6 14.7 13.3 13.2 13.5 13.7 13.3 12.7 14.6 13.9 14.2 14.9 15.4 14.5 15.4 13.4 12.8
Public Administration 8.0 6.8 8.0 6.3 6.8 6.3 7.8 7.8 6.4 6.3 6.4 6.1 6.0 5.4 7.4 6.5 6.9 7.7 7.7 6.8 7.6 5.7 5.9 Peace and Order 2.7 5.3 6.4 6.9 7.4 7.4 6.8 6.9 7.0 6.9 7.1 7.6 7.3 7.3 7.2 7.4 7.3 7.2 7.7 7.7 7.7 7.7 6.9
Others n.e.c. 5.2 6.3 14.5 17.5 17.8 22.4 14.5 14.9 17.4 17.6 17.1 19.0 18.1 17.1 16.6 16.3 17.3 17.7 18.4 19.5 20.0 24.0 23.0
Debt Service 9.4 29.5 20.0 19.6 24.5 17.5 15.9 18.6 18.3 20.6 24.7 25.0 27.4 30.1 31.6 29.7 23.2 20.7 19.4 20.0 17.7 18.3 16.6
MEMO ITEM:
Transfers to LGUs 4.1 4.3 14.0 16.6 16.8 16.0 14.4 14.3 16.4 16.7 16.4 18.1 17.1 16.3 16.0 15.9 15.9 16.0 17.4 18.0 18.2 15.1 15.1 Grand Total - Debt Service 90.6 70.5 80.0 80.4 75.5 82.5 84.1 81.4 81.7 79.4 75.3 75.0 72.6 69.9 68.4 70.3 76.8 79.3 80.6 80.0 82.3 81.7 83.4 Grand Total less Debt Service less Transfers to LGUs 86.5 66.2 66.0 63.8 58.8 66.5 69.7 67.1 65.3 62.6 58.9 56.8 55.5 53.6 52.4 54.4 60.9 63.3 63.1 62.0 64.2 66.6 68.3 Infrastructure 24.0 13.2 12.6 11.7 10.6 10.2 12.2 12.0 11.6 11.9 10.3 7.9 8.3 8.8 6.7 10.0 12.2 12.6 14.1 11.2 11.0 9.6 10.1
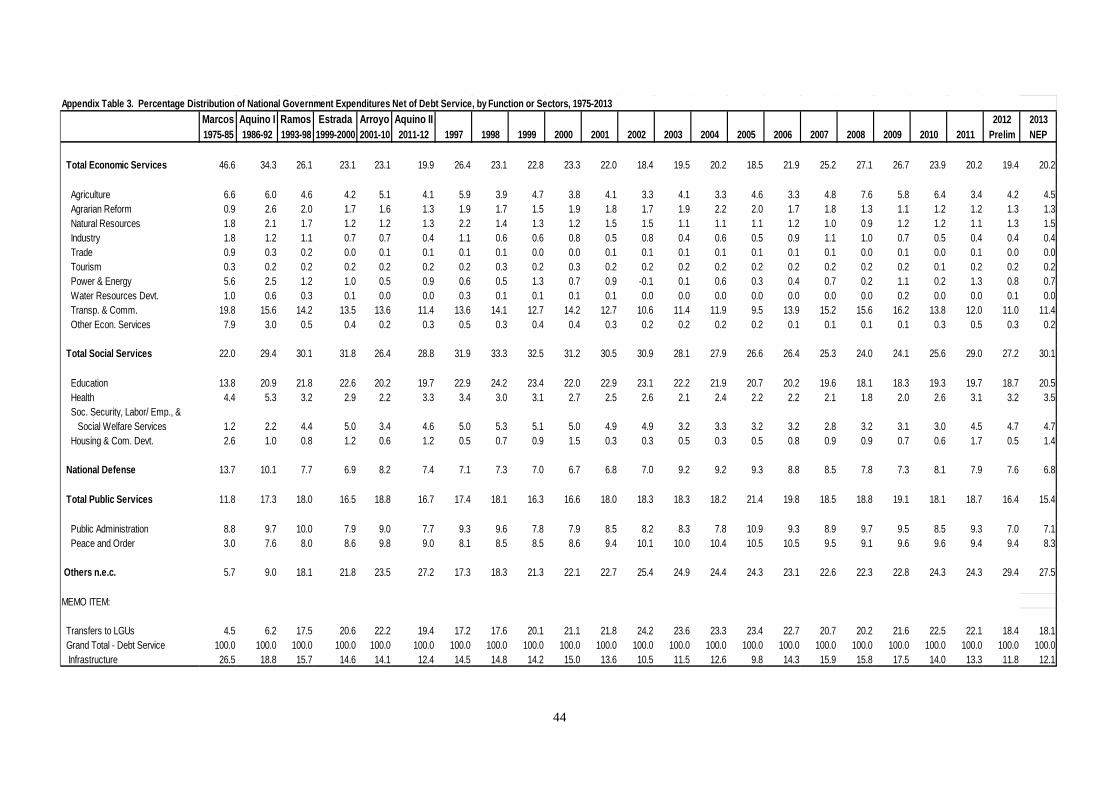
44
Appendix Table 3. Percentage Distribution of National Government Expenditures Net of Debt Service, by Function or Sectors, 1975-2013Marcos Aquino I Ramos Estrada Arroyo Aquino II 2012 20131975-85 1986-92 1993-98 1999-2000 2001-10 2011-12 1997 1998 1999 2000 2001 2002 2003 2004 2005 2006 2007 2008 2009 2010 2011 Prelim NEP
Total Economic Services 46.6 34.3 26.1 23.1 23.1 19.9 26.4 23.1 22.8 23.3 22.0 18.4 19.5 20.2 18.5 21.9 25.2 27.1 26.7 23.9 20.2 19.4 20.2
Agriculture 6.6 6.0 4.6 4.2 5.1 4.1 5.9 3.9 4.7 3.8 4.1 3.3 4.1 3.3 4.6 3.3 4.8 7.6 5.8 6.4 3.4 4.2 4.5 Agrarian Reform 0.9 2.6 2.0 1.7 1.6 1.3 1.9 1.7 1.5 1.9 1.8 1.7 1.9 2.2 2.0 1.7 1.8 1.3 1.1 1.2 1.2 1.3 1.3 Natural Resources 1.8 2.1 1.7 1.2 1.2 1.3 2.2 1.4 1.3 1.2 1.5 1.5 1.1 1.1 1.1 1.2 1.0 0.9 1.2 1.2 1.1 1.3 1.5 Industry 1.8 1.2 1.1 0.7 0.7 0.4 1.1 0.6 0.6 0.8 0.5 0.8 0.4 0.6 0.5 0.9 1.1 1.0 0.7 0.5 0.4 0.4 0.4 Trade 0.9 0.3 0.2 0.0 0.1 0.1 0.1 0.1 0.0 0.0 0.1 0.1 0.1 0.1 0.1 0.1 0.1 0.0 0.1 0.0 0.1 0.0 0.0 Tourism 0.3 0.2 0.2 0.2 0.2 0.2 0.2 0.3 0.2 0.3 0.2 0.2 0.2 0.2 0.2 0.2 0.2 0.2 0.2 0.1 0.2 0.2 0.2 Power & Energy 5.6 2.5 1.2 1.0 0.5 0.9 0.6 0.5 1.3 0.7 0.9 -0.1 0.1 0.6 0.3 0.4 0.7 0.2 1.1 0.2 1.3 0.8 0.7 Water Resources Devt. 1.0 0.6 0.3 0.1 0.0 0.0 0.3 0.1 0.1 0.1 0.1 0.0 0.0 0.0 0.0 0.0 0.0 0.0 0.2 0.0 0.0 0.1 0.0 Transp. & Comm. 19.8 15.6 14.2 13.5 13.6 11.4 13.6 14.1 12.7 14.2 12.7 10.6 11.4 11.9 9.5 13.9 15.2 15.6 16.2 13.8 12.0 11.0 11.4 Other Econ. Services 7.9 3.0 0.5 0.4 0.2 0.3 0.5 0.3 0.4 0.4 0.3 0.2 0.2 0.2 0.2 0.1 0.1 0.1 0.1 0.3 0.5 0.3 0.2
Total Social Services 22.0 29.4 30.1 31.8 26.4 28.8 31.9 33.3 32.5 31.2 30.5 30.9 28.1 27.9 26.6 26.4 25.3 24.0 24.1 25.6 29.0 27.2 30.1
Education 13.8 20.9 21.8 22.6 20.2 19.7 22.9 24.2 23.4 22.0 22.9 23.1 22.2 21.9 20.7 20.2 19.6 18.1 18.3 19.3 19.7 18.7 20.5 Health 4.4 5.3 3.2 2.9 2.2 3.3 3.4 3.0 3.1 2.7 2.5 2.6 2.1 2.4 2.2 2.2 2.1 1.8 2.0 2.6 3.1 3.2 3.5 Soc. Security, Labor/ Emp., & Social Welfare Services 1.2 2.2 4.4 5.0 3.4 4.6 5.0 5.3 5.1 5.0 4.9 4.9 3.2 3.3 3.2 3.2 2.8 3.2 3.1 3.0 4.5 4.7 4.7 Housing & Com. Devt. 2.6 1.0 0.8 1.2 0.6 1.2 0.5 0.7 0.9 1.5 0.3 0.3 0.5 0.3 0.5 0.8 0.9 0.9 0.7 0.6 1.7 0.5 1.4
National Defense 13.7 10.1 7.7 6.9 8.2 7.4 7.1 7.3 7.0 6.7 6.8 7.0 9.2 9.2 9.3 8.8 8.5 7.8 7.3 8.1 7.9 7.6 6.8
Total Public Services 11.8 17.3 18.0 16.5 18.8 16.7 17.4 18.1 16.3 16.6 18.0 18.3 18.3 18.2 21.4 19.8 18.5 18.8 19.1 18.1 18.7 16.4 15.4
Public Administration 8.8 9.7 10.0 7.9 9.0 7.7 9.3 9.6 7.8 7.9 8.5 8.2 8.3 7.8 10.9 9.3 8.9 9.7 9.5 8.5 9.3 7.0 7.1 Peace and Order 3.0 7.6 8.0 8.6 9.8 9.0 8.1 8.5 8.5 8.6 9.4 10.1 10.0 10.4 10.5 10.5 9.5 9.1 9.6 9.6 9.4 9.4 8.3
Others n.e.c. 5.7 9.0 18.1 21.8 23.5 27.2 17.3 18.3 21.3 22.1 22.7 25.4 24.9 24.4 24.3 23.1 22.6 22.3 22.8 24.3 24.3 29.4 27.5
MEMO ITEM:
Transfers to LGUs 4.5 6.2 17.5 20.6 22.2 19.4 17.2 17.6 20.1 21.1 21.8 24.2 23.6 23.3 23.4 22.7 20.7 20.2 21.6 22.5 22.1 18.4 18.1 Grand Total - Debt Service 100.0 100.0 100.0 100.0 100.0 100.0 100.0 100.0 100.0 100.0 100.0 100.0 100.0 100.0 100.0 100.0 100.0 100.0 100.0 100.0 100.0 100.0 100.0 Infrastructure 26.5 18.8 15.7 14.6 14.1 12.4 14.5 14.8 14.2 15.0 13.6 10.5 11.5 12.6 9.8 14.3 15.9 15.8 17.5 14.0 13.3 11.8 12.1
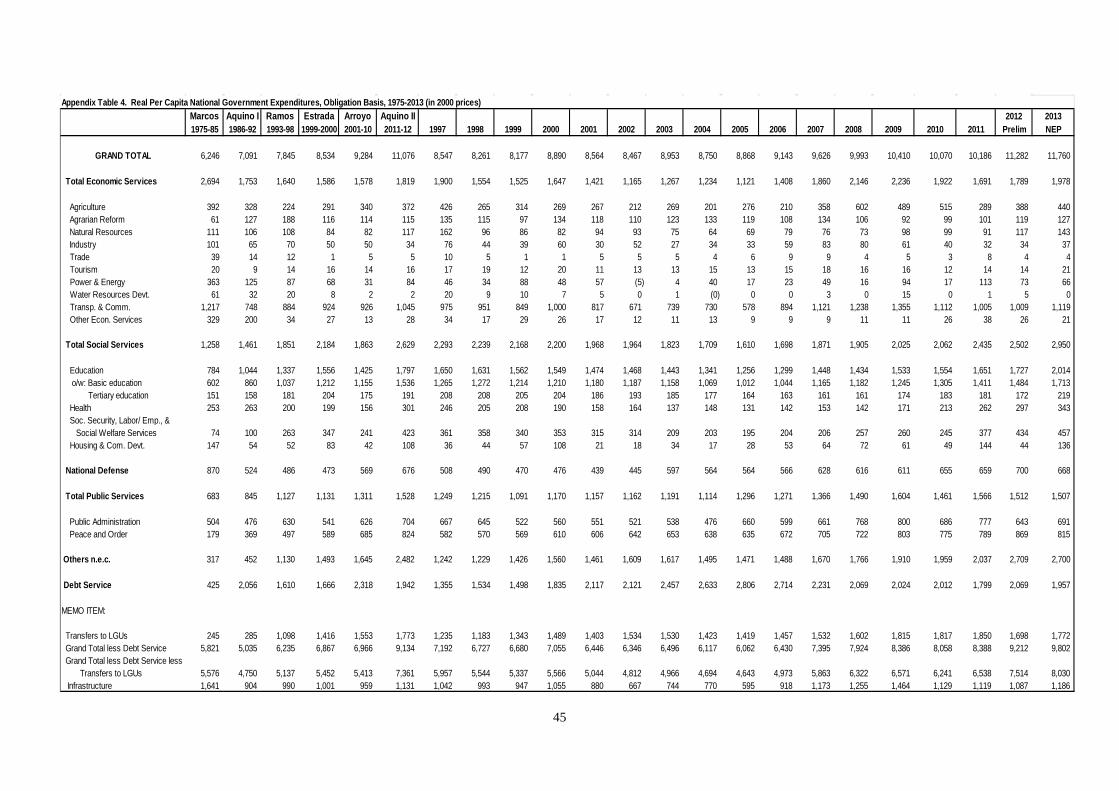
45
Appendix Table 4. Real Per Capita National Government Expenditures, Obligation Basis, 1975-2013 (in 2000 prices)Marcos Aquino I Ramos Estrada Arroyo Aquino II 2012 20131975-85 1986-92 1993-98 1999-2000 2001-10 2011-12 1997 1998 1999 2000 2001 2002 2003 2004 2005 2006 2007 2008 2009 2010 2011 Prelim NEP
GRAND TOTAL 6,246 7,091 7,845 8,534 9,284 11,076 8,547 8,261 8,177 8,890 8,564 8,467 8,953 8,750 8,868 9,143 9,626 9,993 10,410 10,070 10,186 11,282 11,760
Total Economic Services 2,694 1,753 1,640 1,586 1,578 1,819 1,900 1,554 1,525 1,647 1,421 1,165 1,267 1,234 1,121 1,408 1,860 2,146 2,236 1,922 1,691 1,789 1,978
Agriculture 392 328 224 291 340 372 426 265 314 269 267 212 269 201 276 210 358 602 489 515 289 388 440 Agrarian Reform 61 127 188 116 114 115 135 115 97 134 118 110 123 133 119 108 134 106 92 99 101 119 127 Natural Resources 111 106 108 84 82 117 162 96 86 82 94 93 75 64 69 79 76 73 98 99 91 117 143 Industry 101 65 70 50 50 34 76 44 39 60 30 52 27 34 33 59 83 80 61 40 32 34 37 Trade 39 14 12 1 5 5 10 5 1 1 5 5 5 4 6 9 9 4 5 3 8 4 4 Tourism 20 9 14 16 14 16 17 19 12 20 11 13 13 15 13 15 18 16 16 12 14 14 21 Power & Energy 363 125 87 68 31 84 46 34 88 48 57 (5) 4 40 17 23 49 16 94 17 113 73 66 Water Resources Devt. 61 32 20 8 2 2 20 9 10 7 5 0 1 (0) 0 0 3 0 15 0 1 5 0 Transp. & Comm. 1,217 748 884 924 926 1,045 975 951 849 1,000 817 671 739 730 578 894 1,121 1,238 1,355 1,112 1,005 1,009 1,119 Other Econ. Services 329 200 34 27 13 28 34 17 29 26 17 12 11 13 9 9 9 11 11 26 38 26 21
Total Social Services 1,258 1,461 1,851 2,184 1,863 2,629 2,293 2,239 2,168 2,200 1,968 1,964 1,823 1,709 1,610 1,698 1,871 1,905 2,025 2,062 2,435 2,502 2,950
Education 784 1,044 1,337 1,556 1,425 1,797 1,650 1,631 1,562 1,549 1,474 1,468 1,443 1,341 1,256 1,299 1,448 1,434 1,533 1,554 1,651 1,727 2,014 o/w: Basic education 602 860 1,037 1,212 1,155 1,536 1,265 1,272 1,214 1,210 1,180 1,187 1,158 1,069 1,012 1,044 1,165 1,182 1,245 1,305 1,411 1,484 1,713 Tertiary education 151 158 181 204 175 191 208 208 205 204 186 193 185 177 164 163 161 161 174 183 181 172 219 Health 253 263 200 199 156 301 246 205 208 190 158 164 137 148 131 142 153 142 171 213 262 297 343 Soc. Security, Labor/ Emp., & Social Welfare Services 74 100 263 347 241 423 361 358 340 353 315 314 209 203 195 204 206 257 260 245 377 434 457 Housing & Com. Devt. 147 54 52 83 42 108 36 44 57 108 21 18 34 17 28 53 64 72 61 49 144 44 136
National Defense 870 524 486 473 569 676 508 490 470 476 439 445 597 564 564 566 628 616 611 655 659 700 668
Total Public Services 683 845 1,127 1,131 1,311 1,528 1,249 1,215 1,091 1,170 1,157 1,162 1,191 1,114 1,296 1,271 1,366 1,490 1,604 1,461 1,566 1,512 1,507
Public Administration 504 476 630 541 626 704 667 645 522 560 551 521 538 476 660 599 661 768 800 686 777 643 691 Peace and Order 179 369 497 589 685 824 582 570 569 610 606 642 653 638 635 672 705 722 803 775 789 869 815
Others n.e.c. 317 452 1,130 1,493 1,645 2,482 1,242 1,229 1,426 1,560 1,461 1,609 1,617 1,495 1,471 1,488 1,670 1,766 1,910 1,959 2,037 2,709 2,700
Debt Service 425 2,056 1,610 1,666 2,318 1,942 1,355 1,534 1,498 1,835 2,117 2,121 2,457 2,633 2,806 2,714 2,231 2,069 2,024 2,012 1,799 2,069 1,957
MEMO ITEM:
Transfers to LGUs 245 285 1,098 1,416 1,553 1,773 1,235 1,183 1,343 1,489 1,403 1,534 1,530 1,423 1,419 1,457 1,532 1,602 1,815 1,817 1,850 1,698 1,772 Grand Total less Debt Service 5,821 5,035 6,235 6,867 6,966 9,134 7,192 6,727 6,680 7,055 6,446 6,346 6,496 6,117 6,062 6,430 7,395 7,924 8,386 8,058 8,388 9,212 9,802 Grand Total less Debt Service less Transfers to LGUs 5,576 4,750 5,137 5,452 5,413 7,361 5,957 5,544 5,337 5,566 5,044 4,812 4,966 4,694 4,643 4,973 5,863 6,322 6,571 6,241 6,538 7,514 8,030 Infrastructure 1,641 904 990 1,001 959 1,131 1,042 993 947 1,055 880 667 744 770 595 918 1,173 1,255 1,464 1,129 1,119 1,087 1,186
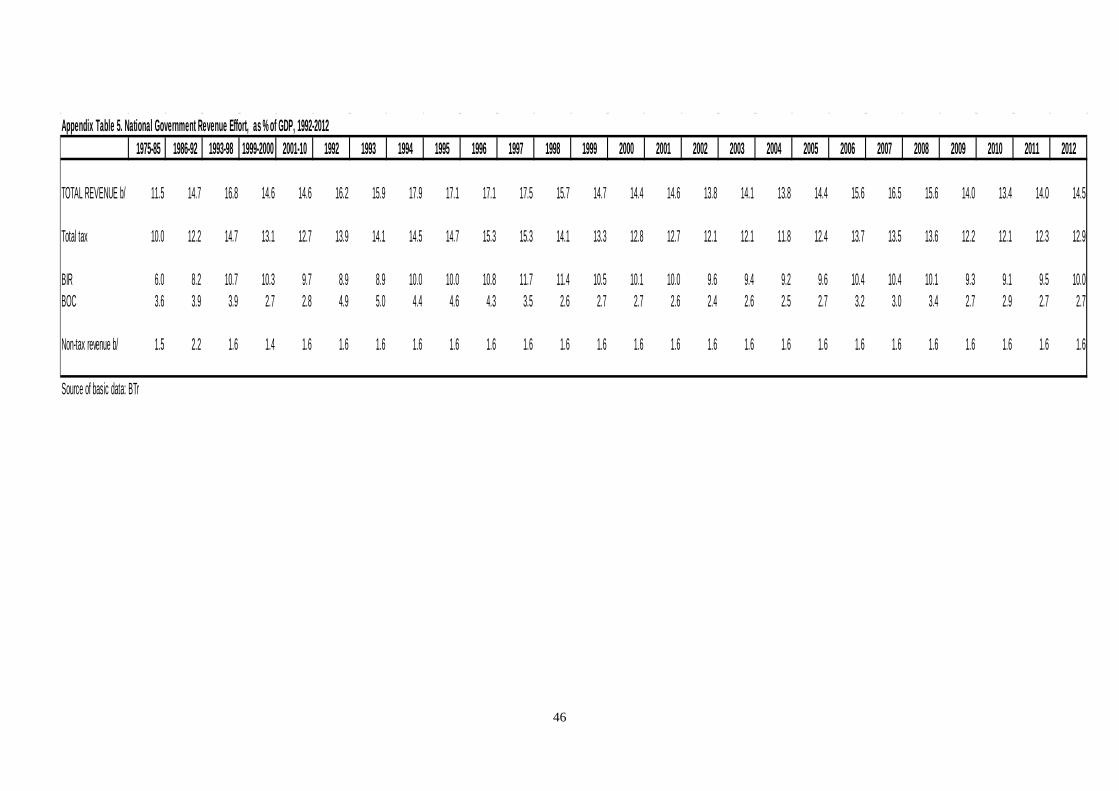
46
Appendix Table 5. National Government Revenue Effort, as % of GDP, 1992-2012
1975-85 1986-92 1993-98 1999-2000 2001-10 1992 1993 1994 1995 1996 1997 1998 1999 2000 2001 2002 2003 2004 2005 2006 2007 2008 2009 2010 2011 2012
TOTAL REVENUE b/ 11.5 14.7 16.8 14.6 14.6 16.2 15.9 17.9 17.1 17.1 17.5 15.7 14.7 14.4 14.6 13.8 14.1 13.8 14.4 15.6 16.5 15.6 14.0 13.4 14.0 14.5
Total tax 10.0 12.2 14.7 13.1 12.7 13.9 14.1 14.5 14.7 15.3 15.3 14.1 13.3 12.8 12.7 12.1 12.1 11.8 12.4 13.7 13.5 13.6 12.2 12.1 12.3 12.9
BIR 6.0 8.2 10.7 10.3 9.7 8.9 8.9 10.0 10.0 10.8 11.7 11.4 10.5 10.1 10.0 9.6 9.4 9.2 9.6 10.4 10.4 10.1 9.3 9.1 9.5 10.0BOC 3.6 3.9 3.9 2.7 2.8 4.9 5.0 4.4 4.6 4.3 3.5 2.6 2.7 2.7 2.6 2.4 2.6 2.5 2.7 3.2 3.0 3.4 2.7 2.9 2.7 2.7
Non-tax revenue b/ 1.5 2.2 1.6 1.4 1.6 1.6 1.6 1.6 1.6 1.6 1.6 1.6 1.6 1.6 1.6 1.6 1.6 1.6 1.6 1.6 1.6 1.6 1.6 1.6 1.6 1.6
Source of basic data: BTr
47
Improvement of the Implementation Procedures
and Management Systems for the Health Facilities Enhancement
Grant of the Department of Health
Rouselle F. Lavado, Ida Marie T. Pantig, Kristine Tyrol Z. Rosales,
and Valerie Gilbert T. Ulep1
Introduction One of the major challenges in the Philippine health sector is providing access to appropriate
health facilities for the poor and the marginalized sector of society. Recognizing this
problem, President Benigno S. Aquino III, in one of his inaugural commitments, vowed to
ensure that quality and affordable care would reach each and every Filipino during his term.
At the core of this commitment is the expansion of the 4Ps, a conditional cash transfer (CCT)
program targeting indigents who are given cash conditional on their utilization of maternal
and child care services. Studies have shown that while cash transfers help overcome demand-
side barriers to health care, it has to be complemented with supply-side strategies, like
improvements in health facilities and training of health professionals, to become effective.
Budgets for capital outlay were sparse in the DOH expenditure schedule from 2000 to
2006. Because of this, maintenance and upkeep of health facilities were postponed, resulting
in the deterioration of most health facilities. According to the DOH, 892 RHUs (36% of the
total), and 99 public hospitals (14% of the total) have yet to qualify for PhilHealth
accreditation. In response to this, the new administration launched the Aquino Health Agenda
(AHA), in which one of the three strategic thrusts is improving access to quality hospitals and
health facilities through the upgrade of facilities.
Efforts began in 2007 to bridge gaps in health care delivery and utilization and
eventually increase access to health facilities and services. The DOH has included in the
General Appropriations Act (GAA) funds for the HFEP, which aims to upgrade health
facilities such as health centers and BHSs to sufficiently provide for emergency and primary
1 Dr. Rouselle F. Lavado, the main author, is a Senior Research Fellow at the Philippine Institute for Development Studies. She was assisted by Ida Marie T. Pantig, Research Analyst II; Kristine Tyrol Z. Rosales, Research Analyst II; and Valerie Gilbert T. Ulep, Supervising Research Specialist.
48
care services. Another goal of the HFEP is to improve and upgrade facilities in government
hospitals.
Since implementation, the HFEP’s budget has increased to PHP 7.1 billion in 2011
from PHP 43.5 million in 2007. The program has also expanded from the initial target of
LGUs in Fourmula One sites only to all provinces in the country. Despite these efforts, the
Department of Budget and Management (DBM) continued to receive feedback regarding
difficulties encountered by the DOH in implementing this program.
The Improvement of the Implementation Procedures and Management Systems for
Health Facilities Enhancement Grant of the DOH study addresses the need to identify the
difficulties encountered by the DOH in implementing the program for the efficient allocation
of funds for facilities across the country. It assesses the indicators used in choosing which
facilities should be targeted for upgrading to ensure equity in the allocation of funds. This
study specifically aims to map and examine the rationale for the choice of facilities that will
be upgraded through HFEP. It also lays out some policy options that can be considered to
improve equity and efficiency in allocation of funds.
Description of the Program: HFEP The DOH implemented the HFEP with the main goal of improving the delivery of basic,
essential, and specialized health services. The project envisions revitalization of primary
health care facilities and the rationalization of the various levels of hospitals to decongest
end-referral hospitals.2 Facilities will be upgraded to make them more responsive to the
“need” of the catchment area, to provide Basic Emergency Obstetric and Newborn Care
(BEmONC) and Comprehensive Emergency Obstetric and Newborn Care (CEmONC)
services to the population, and to strengthen the health facility referral system or network.
Specifically, the objectives of the HFEP are as follows:
1. To upgrade/establish priority BHSs and RHUs nearest to the communities and
provide BEmONC services to reduce the maternal mortality ratio (MMR); to establish
strategically located blood service facilities and upgrade end-referral/training centers
for B/CEmONC personnel;
2 DOH Department Order No. 2008-0162 titled: “Guidelines and Procedures for the Implementation of the Government Hospital Upgrading Project under the CY2008 Health Facilities Enhancement Program Funds of the DOH”, dated 7 July 2008.
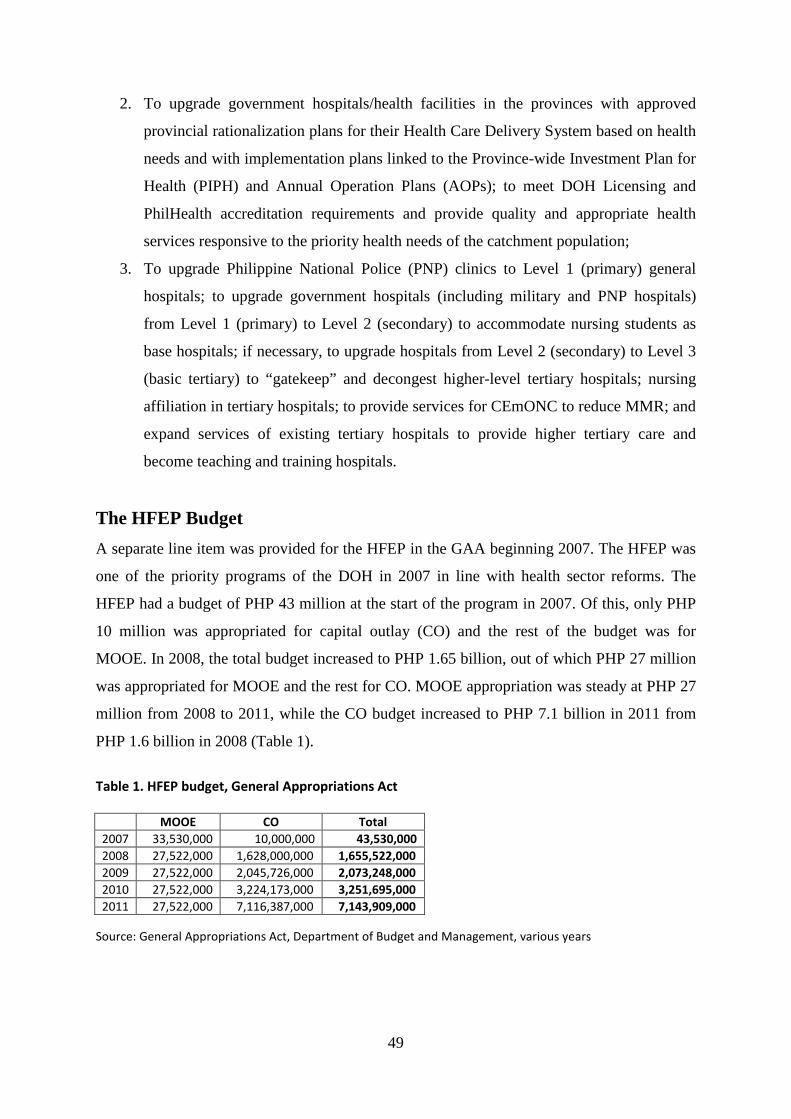
49
2. To upgrade government hospitals/health facilities in the provinces with approved
provincial rationalization plans for their Health Care Delivery System based on health
needs and with implementation plans linked to the Province-wide Investment Plan for
Health (PIPH) and Annual Operation Plans (AOPs); to meet DOH Licensing and
PhilHealth accreditation requirements and provide quality and appropriate health
services responsive to the priority health needs of the catchment population;
3. To upgrade Philippine National Police (PNP) clinics to Level 1 (primary) general
hospitals; to upgrade government hospitals (including military and PNP hospitals)
from Level 1 (primary) to Level 2 (secondary) to accommodate nursing students as
base hospitals; if necessary, to upgrade hospitals from Level 2 (secondary) to Level 3
(basic tertiary) to “gatekeep” and decongest higher-level tertiary hospitals; nursing
affiliation in tertiary hospitals; to provide services for CEmONC to reduce MMR; and
expand services of existing tertiary hospitals to provide higher tertiary care and
become teaching and training hospitals.
The HFEP Budget A separate line item was provided for the HFEP in the GAA beginning 2007. The HFEP was
one of the priority programs of the DOH in 2007 in line with health sector reforms. The
HFEP had a budget of PHP 43 million at the start of the program in 2007. Of this, only PHP
10 million was appropriated for capital outlay (CO) and the rest of the budget was for
MOOE. In 2008, the total budget increased to PHP 1.65 billion, out of which PHP 27 million
was appropriated for MOOE and the rest for CO. MOOE appropriation was steady at PHP 27
million from 2008 to 2011, while the CO budget increased to PHP 7.1 billion in 2011 from
PHP 1.6 billion in 2008 (Table 1).
Table 1. HFEP budget, General Appropriations Act
MOOE CO Total 2007 33,530,000 10,000,000 43,530,000 2008 27,522,000 1,628,000,000 1,655,522,000 2009 27,522,000 2,045,726,000 2,073,248,000 2010 27,522,000 3,224,173,000 3,251,695,000 2011 27,522,000 7,116,387,000 7,143,909,000
Source: General Appropriations Act, Department of Budget and Management, various years
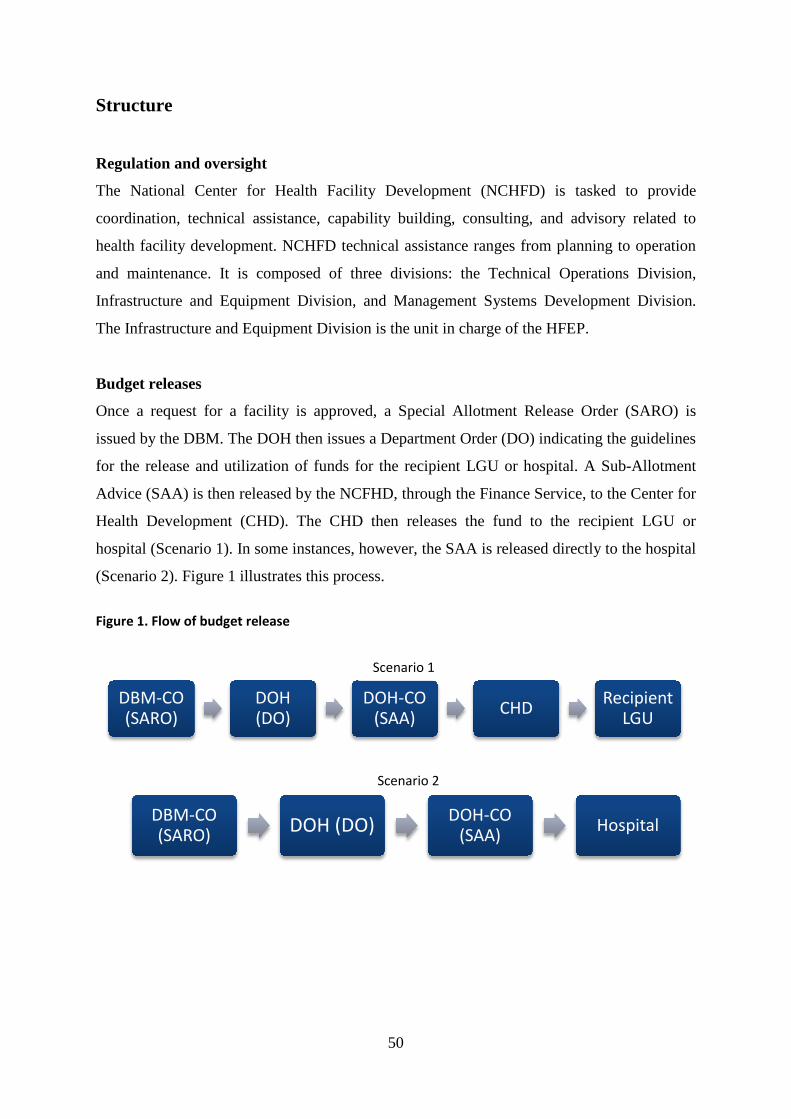
50
Structure
Regulation and oversight
The National Center for Health Facility Development (NCHFD) is tasked to provide
coordination, technical assistance, capability building, consulting, and advisory related to
health facility development. NCHFD technical assistance ranges from planning to operation
and maintenance. It is composed of three divisions: the Technical Operations Division,
Infrastructure and Equipment Division, and Management Systems Development Division.
The Infrastructure and Equipment Division is the unit in charge of the HFEP.
Budget releases
Once a request for a facility is approved, a Special Allotment Release Order (SARO) is
issued by the DBM. The DOH then issues a Department Order (DO) indicating the guidelines
for the release and utilization of funds for the recipient LGU or hospital. A Sub-Allotment
Advice (SAA) is then released by the NCFHD, through the Finance Service, to the Center for
Health Development (CHD). The CHD then releases the fund to the recipient LGU or
hospital (Scenario 1). In some instances, however, the SAA is released directly to the hospital
(Scenario 2). Figure 1 illustrates this process.
Figure 1. Flow of budget release
DBM-CO (SARO)
DOH (DO)
DOH-CO (SAA) CHD Recipient
LGU
DBM-CO (SARO) DOH (DO) DOH-CO
(SAA) Hospital
Scenario 1
Scenario 2
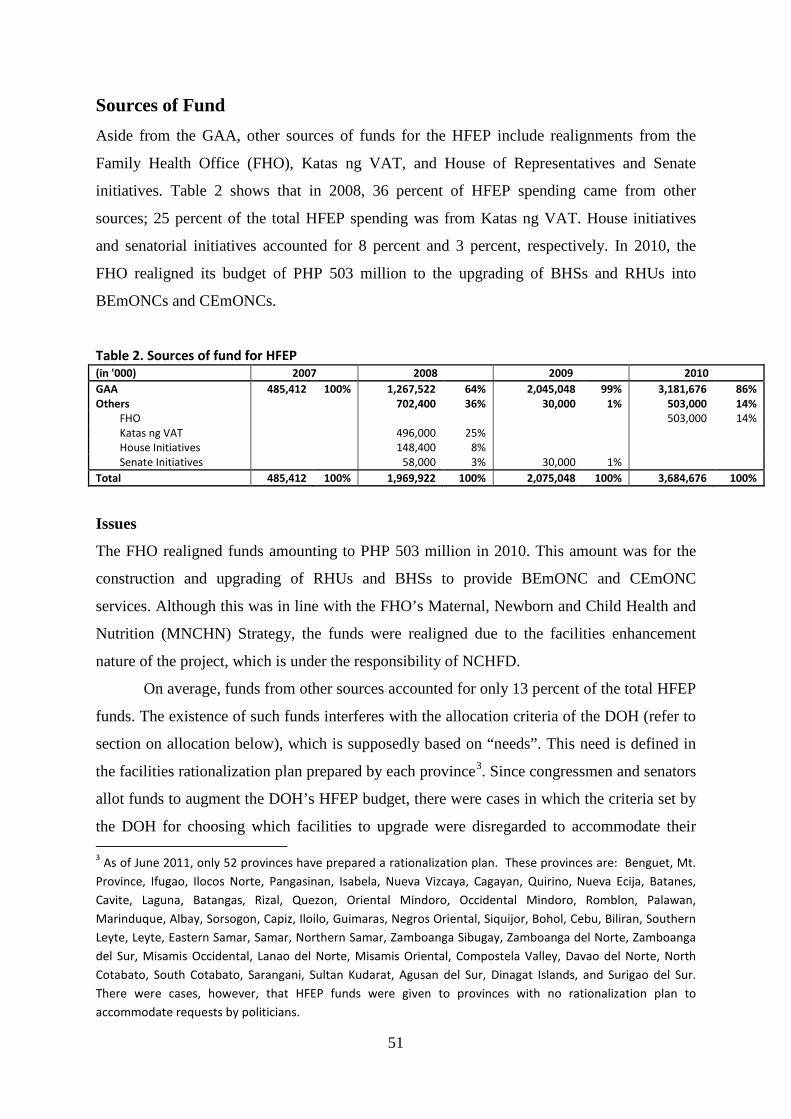
51
Sources of Fund
Aside from the GAA, other sources of funds for the HFEP include realignments from the
Family Health Office (FHO), Katas ng VAT, and House of Representatives and Senate
initiatives. Table 2 shows that in 2008, 36 percent of HFEP spending came from other
sources; 25 percent of the total HFEP spending was from Katas ng VAT. House initiatives
and senatorial initiatives accounted for 8 percent and 3 percent, respectively. In 2010, the
FHO realigned its budget of PHP 503 million to the upgrading of BHSs and RHUs into
BEmONCs and CEmONCs.
Table 2. Sources of fund for HFEP (in '000) 2007 2008 2009 2010 GAA 485,412 100% 1,267,522 64% 2,045,048 99% 3,181,676 86% Others 702,400 36% 30,000 1% 503,000 14%
FHO 503,000 14% Katas ng VAT 496,000 25% House Initiatives 148,400 8% Senate Initiatives 58,000 3% 30,000 1%
Total 485,412 100% 1,969,922 100% 2,075,048 100% 3,684,676 100%
Issues
The FHO realigned funds amounting to PHP 503 million in 2010. This amount was for the
construction and upgrading of RHUs and BHSs to provide BEmONC and CEmONC
services. Although this was in line with the FHO’s Maternal, Newborn and Child Health and
Nutrition (MNCHN) Strategy, the funds were realigned due to the facilities enhancement
nature of the project, which is under the responsibility of NCHFD.
On average, funds from other sources accounted for only 13 percent of the total HFEP
funds. The existence of such funds interferes with the allocation criteria of the DOH (refer to
section on allocation below), which is supposedly based on “needs”. This need is defined in
the facilities rationalization plan prepared by each province3. Since congressmen and senators
allot funds to augment the DOH’s HFEP budget, there were cases in which the criteria set by
the DOH for choosing which facilities to upgrade were disregarded to accommodate their 3 As of June 2011, only 52 provinces have prepared a rationalization plan. These provinces are: Benguet, Mt. Province, Ifugao, Ilocos Norte, Pangasinan, Isabela, Nueva Vizcaya, Cagayan, Quirino, Nueva Ecija, Batanes, Cavite, Laguna, Batangas, Rizal, Quezon, Oriental Mindoro, Occidental Mindoro, Romblon, Palawan, Marinduque, Albay, Sorsogon, Capiz, Iloilo, Guimaras, Negros Oriental, Siquijor, Bohol, Cebu, Biliran, Southern Leyte, Leyte, Eastern Samar, Samar, Northern Samar, Zamboanga Sibugay, Zamboanga del Norte, Zamboanga del Sur, Misamis Occidental, Lanao del Norte, Misamis Oriental, Compostela Valley, Davao del Norte, North Cotabato, South Cotabato, Sarangani, Sultan Kudarat, Agusan del Sur, Dinagat Islands, and Surigao del Sur. There were cases, however, that HFEP funds were given to provinces with no rationalization plan to accommodate requests by politicians.
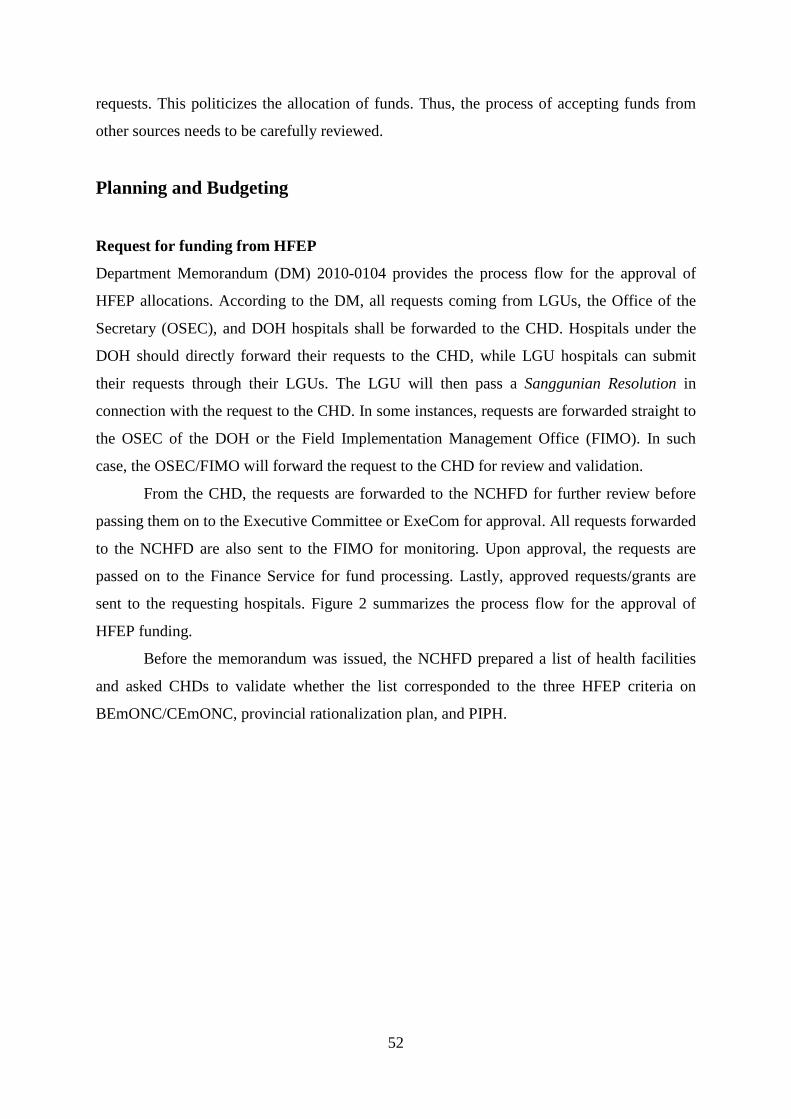
52
requests. This politicizes the allocation of funds. Thus, the process of accepting funds from
other sources needs to be carefully reviewed.
Planning and Budgeting
Request for funding from HFEP
Department Memorandum (DM) 2010-0104 provides the process flow for the approval of
HFEP allocations. According to the DM, all requests coming from LGUs, the Office of the
Secretary (OSEC), and DOH hospitals shall be forwarded to the CHD. Hospitals under the
DOH should directly forward their requests to the CHD, while LGU hospitals can submit
their requests through their LGUs. The LGU will then pass a Sanggunian Resolution in
connection with the request to the CHD. In some instances, requests are forwarded straight to
the OSEC of the DOH or the Field Implementation Management Office (FIMO). In such
case, the OSEC/FIMO will forward the request to the CHD for review and validation.
From the CHD, the requests are forwarded to the NCHFD for further review before
passing them on to the Executive Committee or ExeCom for approval. All requests forwarded
to the NCHFD are also sent to the FIMO for monitoring. Upon approval, the requests are
passed on to the Finance Service for fund processing. Lastly, approved requests/grants are
sent to the requesting hospitals. Figure 2 summarizes the process flow for the approval of
HFEP funding.
Before the memorandum was issued, the NCHFD prepared a list of health facilities
and asked CHDs to validate whether the list corresponded to the three HFEP criteria on
BEmONC/CEmONC, provincial rationalization plan, and PIPH.
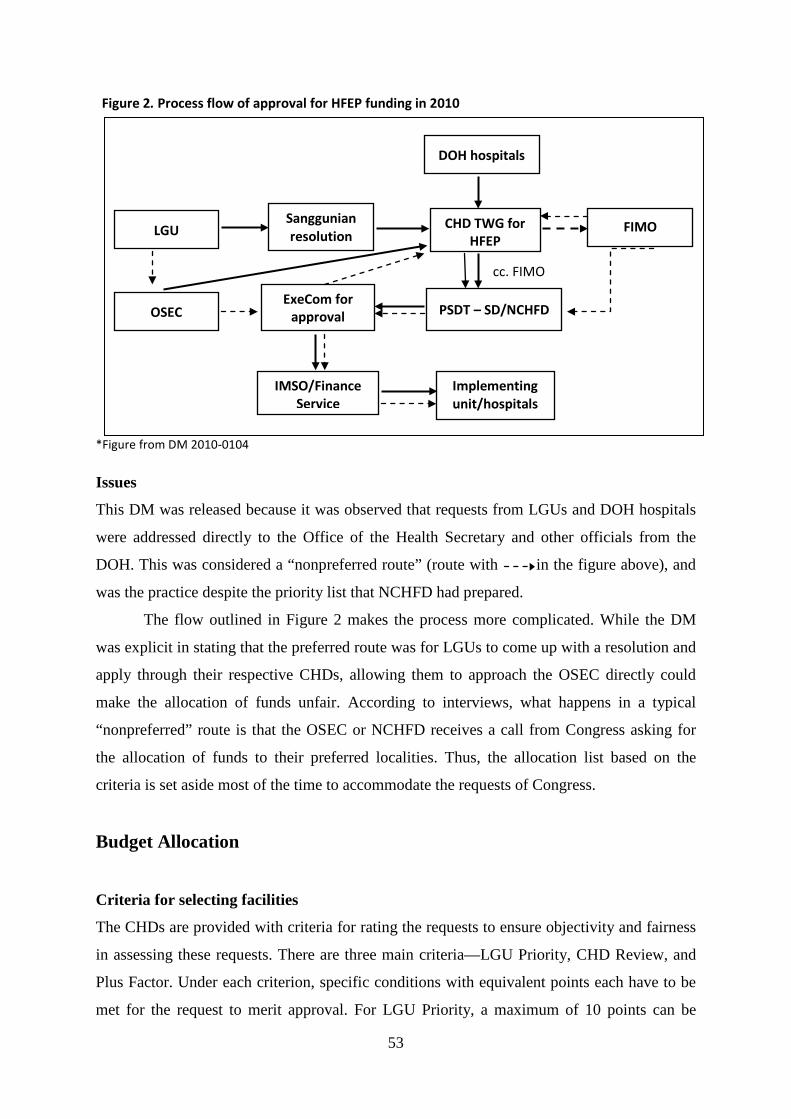
53
Figure 2. Process flow of approval for HFEP funding in 2010 *Figure from DM 2010-0104
Issues
This DM was released because it was observed that requests from LGUs and DOH hospitals
were addressed directly to the Office of the Health Secretary and other officials from the
DOH. This was considered a “nonpreferred route” (route with in the figure above), and
was the practice despite the priority list that NCHFD had prepared.
The flow outlined in Figure 2 makes the process more complicated. While the DM
was explicit in stating that the preferred route was for LGUs to come up with a resolution and
apply through their respective CHDs, allowing them to approach the OSEC directly could
make the allocation of funds unfair. According to interviews, what happens in a typical
“nonpreferred” route is that the OSEC or NCHFD receives a call from Congress asking for
the allocation of funds to their preferred localities. Thus, the allocation list based on the
criteria is set aside most of the time to accommodate the requests of Congress.
Budget Allocation
Criteria for selecting facilities
The CHDs are provided with criteria for rating the requests to ensure objectivity and fairness
in assessing these requests. There are three main criteria—LGU Priority, CHD Review, and
Plus Factor. Under each criterion, specific conditions with equivalent points each have to be
met for the request to merit approval. For LGU Priority, a maximum of 10 points can be
DOH hospitals
LGU CHD TWG for HFEP
IMSO/Finance Service
OSEC
Sanggunian resolution
Implementing unit/hospitals
ExeCom for approval
PSDT – SD/NCHFD
FIMO
cc. FIMO
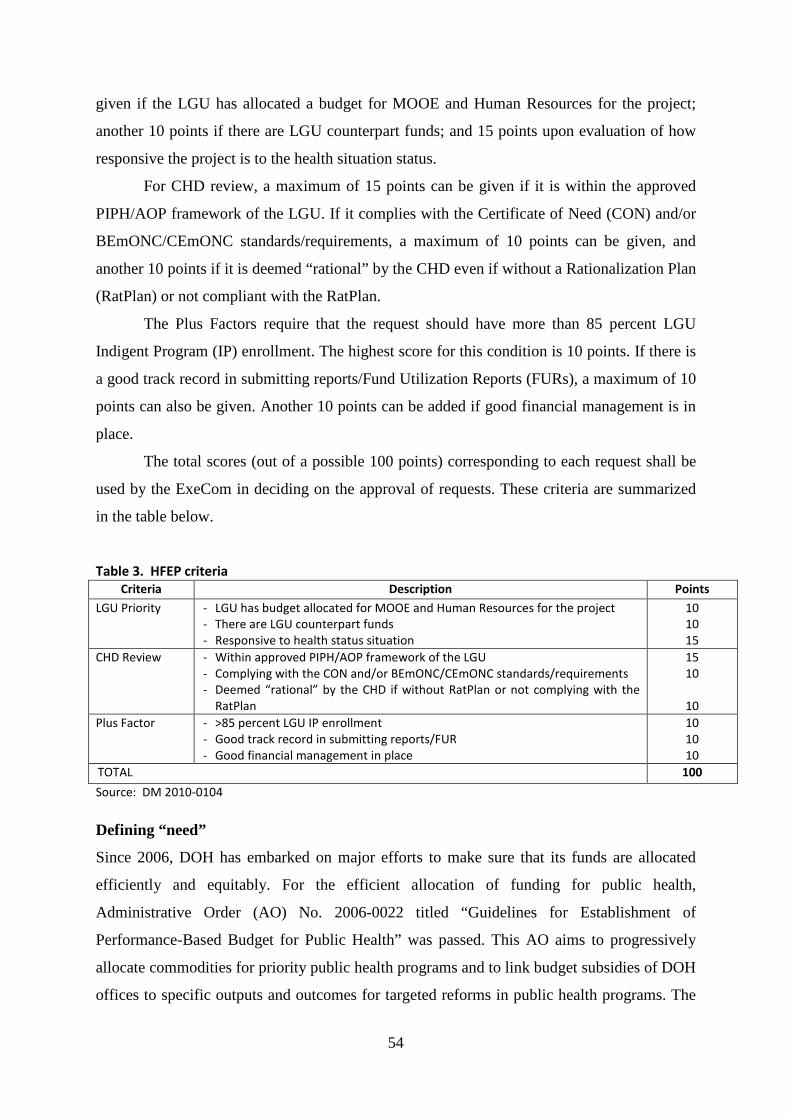
54
given if the LGU has allocated a budget for MOOE and Human Resources for the project;
another 10 points if there are LGU counterpart funds; and 15 points upon evaluation of how
responsive the project is to the health situation status.
For CHD review, a maximum of 15 points can be given if it is within the approved
PIPH/AOP framework of the LGU. If it complies with the Certificate of Need (CON) and/or
BEmONC/CEmONC standards/requirements, a maximum of 10 points can be given, and
another 10 points if it is deemed “rational” by the CHD even if without a Rationalization Plan
(RatPlan) or not compliant with the RatPlan.
The Plus Factors require that the request should have more than 85 percent LGU
Indigent Program (IP) enrollment. The highest score for this condition is 10 points. If there is
a good track record in submitting reports/Fund Utilization Reports (FURs), a maximum of 10
points can also be given. Another 10 points can be added if good financial management is in
place.
The total scores (out of a possible 100 points) corresponding to each request shall be
used by the ExeCom in deciding on the approval of requests. These criteria are summarized
in the table below.
Table 3. HFEP criteria
Criteria Description Points
LGU Priority - LGU has budget allocated for MOOE and Human Resources for the project - There are LGU counterpart funds - Responsive to health status situation
10 10 15
CHD Review - Within approved PIPH/AOP framework of the LGU - Complying with the CON and/or BEmONC/CEmONC standards/requirements - Deemed “rational” by the CHD if without RatPlan or not complying with the
RatPlan
15 10
10
Plus Factor - >85 percent LGU IP enrollment - Good track record in submitting reports/FUR - Good financial management in place
10 10 10
TOTAL 100
Source: DM 2010-0104
Defining “need”
Since 2006, DOH has embarked on major efforts to make sure that its funds are allocated
efficiently and equitably. For the efficient allocation of funding for public health,
Administrative Order (AO) No. 2006-0022 titled “Guidelines for Establishment of
Performance-Based Budget for Public Health” was passed. This AO aims to progressively
allocate commodities for priority public health programs and to link budget subsidies of DOH
offices to specific outputs and outcomes for targeted reforms in public health programs. The
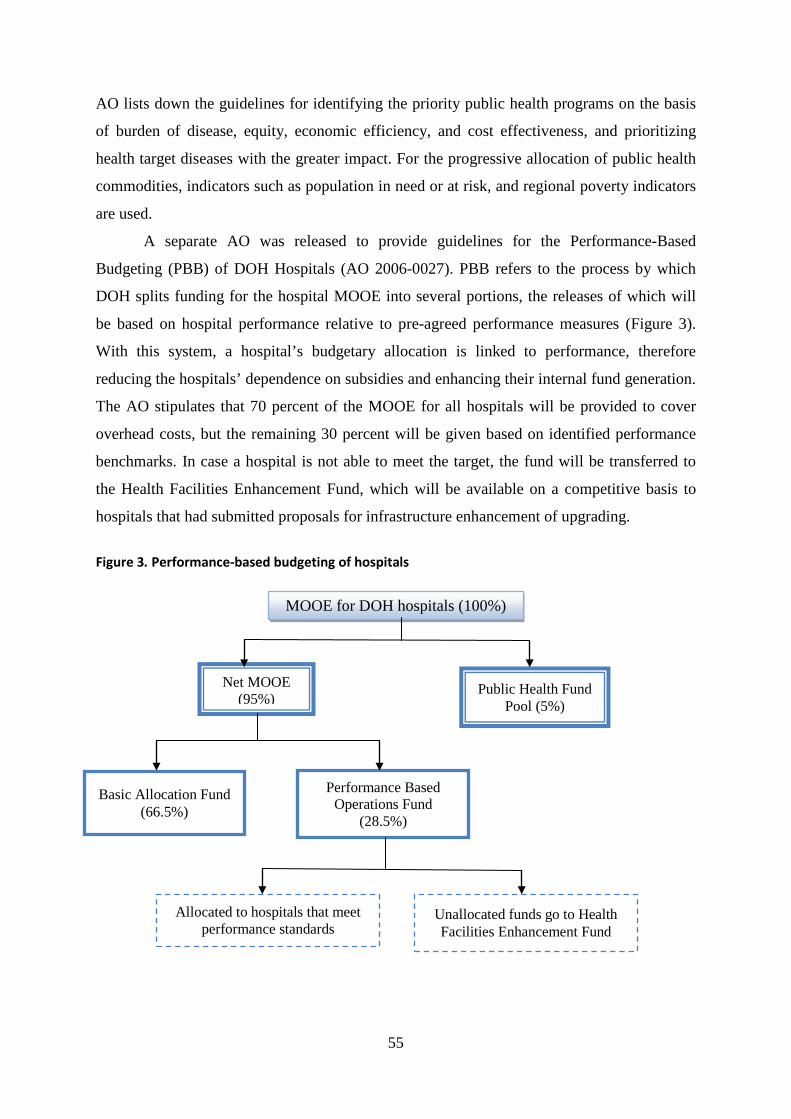
55
AO lists down the guidelines for identifying the priority public health programs on the basis
of burden of disease, equity, economic efficiency, and cost effectiveness, and prioritizing
health target diseases with the greater impact. For the progressive allocation of public health
commodities, indicators such as population in need or at risk, and regional poverty indicators
are used.
A separate AO was released to provide guidelines for the Performance-Based
Budgeting (PBB) of DOH Hospitals (AO 2006-0027). PBB refers to the process by which
DOH splits funding for the hospital MOOE into several portions, the releases of which will
be based on hospital performance relative to pre-agreed performance measures (Figure 3).
With this system, a hospital’s budgetary allocation is linked to performance, therefore
reducing the hospitals’ dependence on subsidies and enhancing their internal fund generation.
The AO stipulates that 70 percent of the MOOE for all hospitals will be provided to cover
overhead costs, but the remaining 30 percent will be given based on identified performance
benchmarks. In case a hospital is not able to meet the target, the fund will be transferred to
the Health Facilities Enhancement Fund, which will be available on a competitive basis to
hospitals that had submitted proposals for infrastructure enhancement of upgrading.
Figure 3. Performance-based budgeting of hospitals
MOOE for DOH hospitals (100%)
Net MOOE (95%)
Public Health Fund Pool (5%)
Basic Allocation Fund (66.5%)
Performance Based Operations Fund
(28.5%)
Allocated to hospitals that meet performance standards
Unallocated funds go to Health Facilities Enhancement Fund
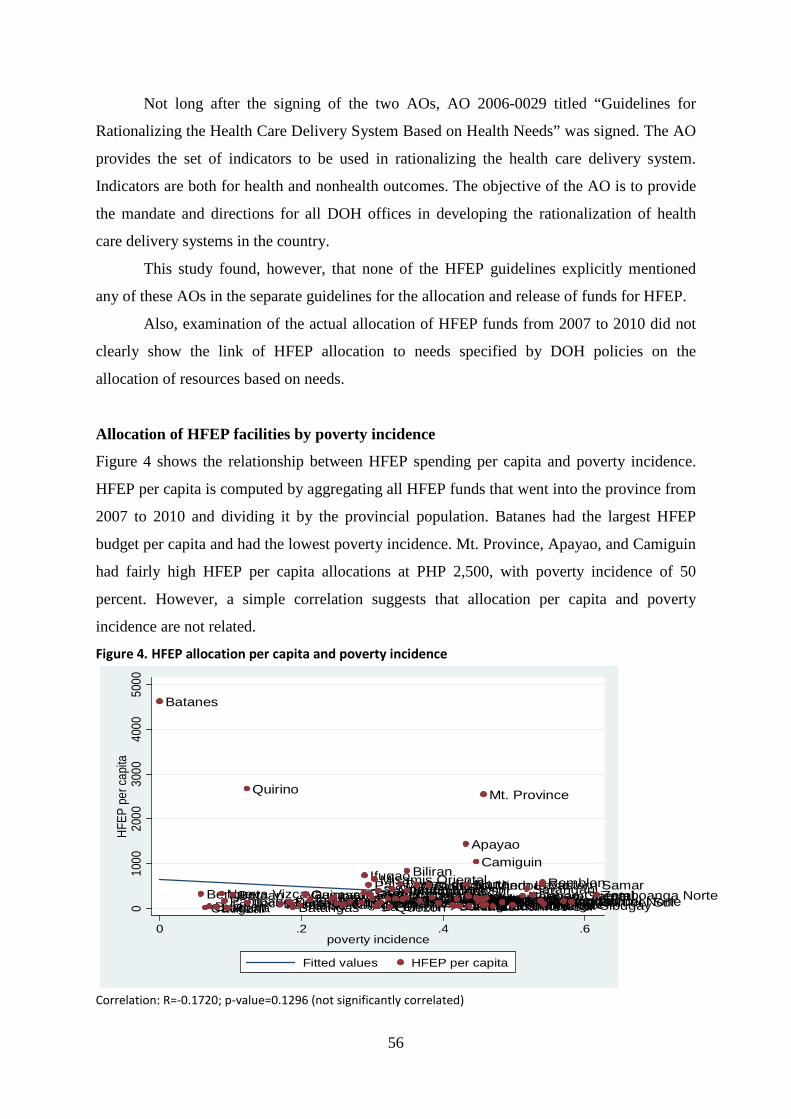
56
Not long after the signing of the two AOs, AO 2006-0029 titled “Guidelines for
Rationalizing the Health Care Delivery System Based on Health Needs” was signed. The AO
provides the set of indicators to be used in rationalizing the health care delivery system.
Indicators are both for health and nonhealth outcomes. The objective of the AO is to provide
the mandate and directions for all DOH offices in developing the rationalization of health
care delivery systems in the country.
This study found, however, that none of the HFEP guidelines explicitly mentioned
any of these AOs in the separate guidelines for the allocation and release of funds for HFEP.
Also, examination of the actual allocation of HFEP funds from 2007 to 2010 did not
clearly show the link of HFEP allocation to needs specified by DOH policies on the
allocation of resources based on needs.
Allocation of HFEP facilities by poverty incidence
Figure 4 shows the relationship between HFEP spending per capita and poverty incidence.
HFEP per capita is computed by aggregating all HFEP funds that went into the province from
2007 to 2010 and dividing it by the provincial population. Batanes had the largest HFEP
budget per capita and had the lowest poverty incidence. Mt. Province, Apayao, and Camiguin
had fairly high HFEP per capita allocations at PHP 2,500, with poverty incidence of 50
percent. However, a simple correlation suggests that allocation per capita and poverty
incidence are not related.
Figure 4. HFEP allocation per capita and poverty incidence
Correlation: R=-0.1720; p-value=0.1296 (not significantly correlated)
Batanes
BenguetCaviteBulacanLaguna
Nueva VizcayaPampangaRizalBataan
Quirino
Ilocos NorteIlocos SurZambalesBatangasTarlacGuimarasCagayanIsabelaAuroraDavao del SurPangasinanKalingaIloiloCatanduanes
CapizIfugaoPalawanSouth CotabatoBasilanCebuMisamis Oriental
La UnionZamboanga del SurNueva EcijaNegros OccidentalQuezon
Oriental MindoroNorth CotabatoDavao del NorteLeyteMarinduqueAgusan del Norte
BiliranOccidental MindoroCompostela Valley
SiquijorTawi-TawiAntiqueSorsogonBukidnonNegros OrientalCamarines Norte
Apayao
Southern LeyteAlbayAbraSultan Kudarat
Camiguin
Lanao del SurSurigao del SurSamarLanao del NorteMisamis Occidental
Mt. Province
SuluAklanCamarines SurBoholZamboanga SibugayNorthern SamarSaranganiDavao OrientalMaguindanao
Eastern SamarRomblon
MasbateSurigao del NorteAgusan del SurZamboanga Norte
010
0020
0030
0040
0050
00HF
EP p
er ca
pita
0 .2 .4 .6poverty incidence
Fitted values HFEP per capita
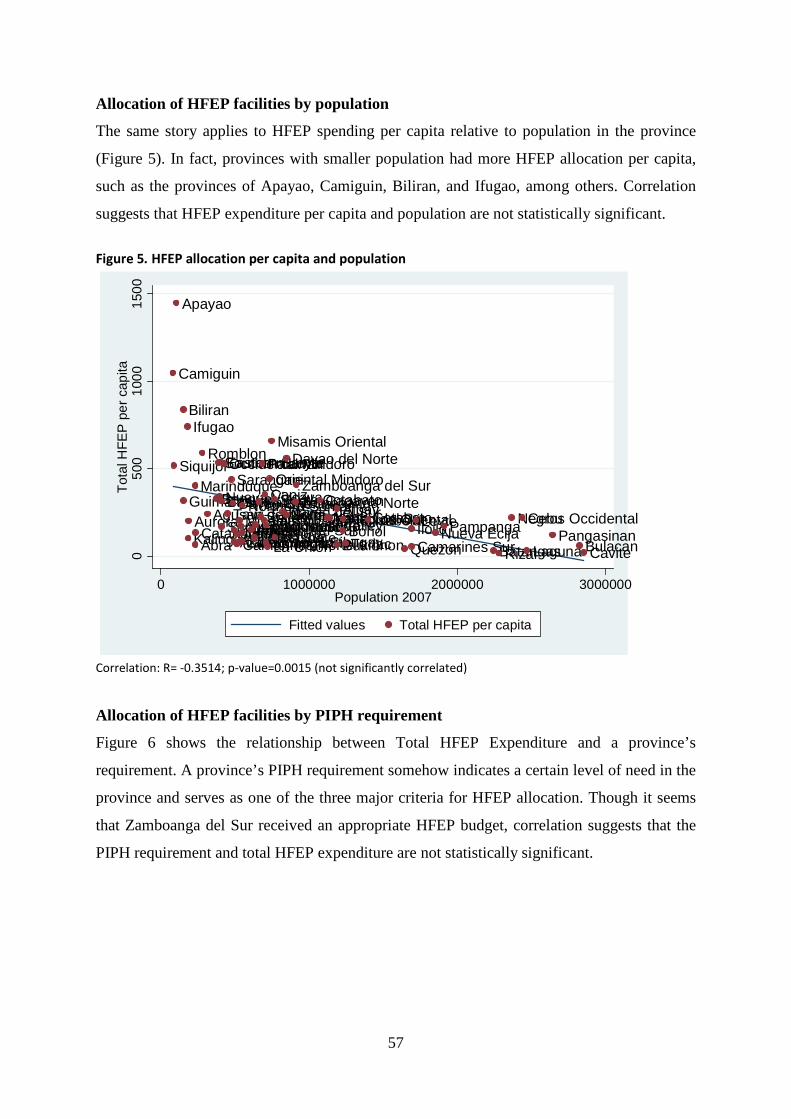
57
Allocation of HFEP facilities by population
The same story applies to HFEP spending per capita relative to population in the province
(Figure 5). In fact, provinces with smaller population had more HFEP allocation per capita,
such as the provinces of Apayao, Camiguin, Biliran, and Ifugao, among others. Correlation
suggests that HFEP expenditure per capita and population are not statistically significant.
Figure 5. HFEP allocation per capita and population
Correlation: R= -0.3514; p-value=0.0015 (not significantly correlated)
Allocation of HFEP facilities by PIPH requirement
Figure 6 shows the relationship between Total HFEP Expenditure and a province’s
requirement. A province’s PIPH requirement somehow indicates a certain level of need in the
province and serves as one of the three major criteria for HFEP allocation. Though it seems
that Zamboanga del Sur received an appropriate HFEP budget, correlation suggests that the
PIPH requirement and total HFEP expenditure are not statistically significant.
Camiguin
Siquijor
Apayao
Biliran
Guimaras
Ifugao
KalingaAurora
Marinduque
AbraCatanduanes
Romblon
Agusan del NorteBenguet
Southern Leyte
Nueva Vizcaya
Eastern Samar
Basilan
Surigao del Norte
Occidental Mindoro
Tawi-Tawi
SaranganiDavao Oriental
ZambalesAklanCamarines NorteAntiqueMisamis OccidentalLanao del NorteSurigao del SurZamboanga SibugayIlocos Norte
Northern SamarAgusan del SurIlocos SurCompostela ValleyBataanSultan Kudarat
Palawan
Samar
Capiz
SorsogonMaguindanaoLa Union
Oriental Mindoro
Misamis Oriental
South Cotabato
Masbate
Davao del Sur
Davao del Norte
SuluZamboanga NorteZamboanga del Sur
CagayanNorth CotabatoLanao del Sur
Bukidnon
AlbayBoholNegros OrientalTarlac
Isabela
QuezonIloiloCamarines Sur
LeyteNueva EcijaPampanga
BatangasRizal
Negros OccidentalCebu
LagunaPangasinan
BulacanCavite050
010
0015
00To
tal H
FEP
per
cap
ita
0 1000000 2000000 3000000Population 2007
Fitted values Total HFEP per capita
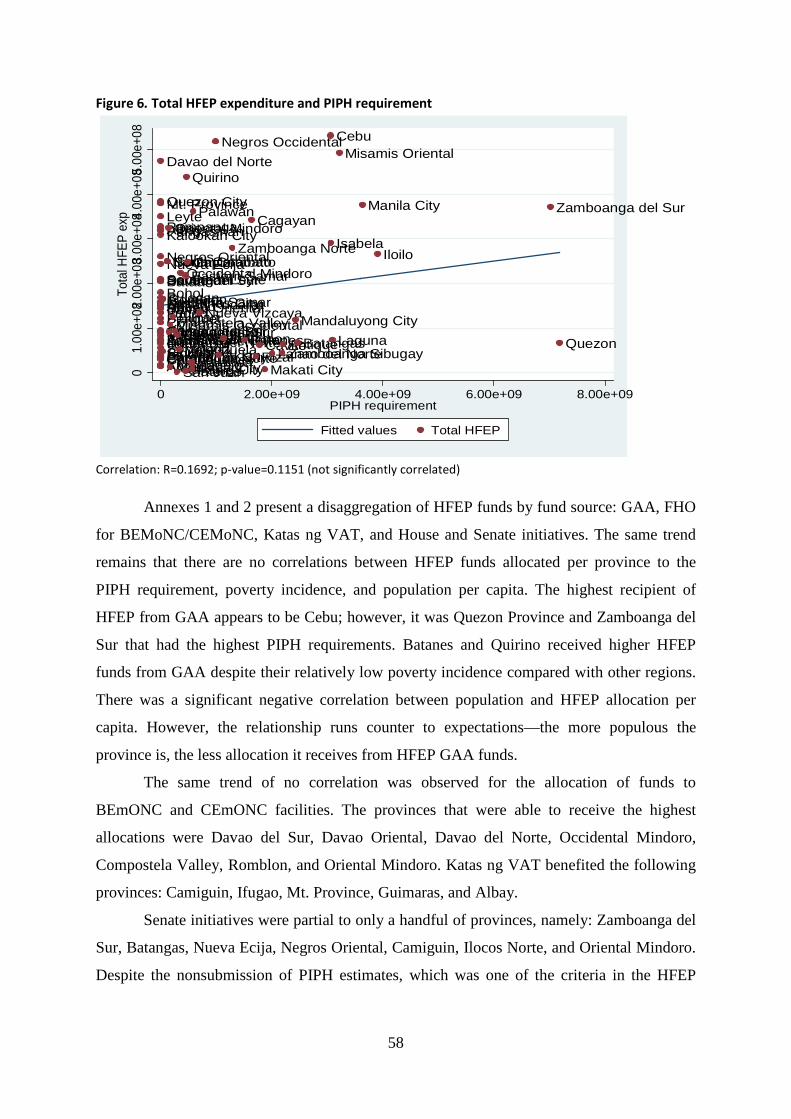
58
Figure 6. Total HFEP expenditure and PIPH requirement
Correlation: R=0.1692; p-value=0.1151 (not significantly correlated)
Annexes 1 and 2 present a disaggregation of HFEP funds by fund source: GAA, FHO
for BEMoNC/CEMoNC, Katas ng VAT, and House and Senate initiatives. The same trend
remains that there are no correlations between HFEP funds allocated per province to the
PIPH requirement, poverty incidence, and population per capita. The highest recipient of
HFEP from GAA appears to be Cebu; however, it was Quezon Province and Zamboanga del
Sur that had the highest PIPH requirements. Batanes and Quirino received higher HFEP
funds from GAA despite their relatively low poverty incidence compared with other regions.
There was a significant negative correlation between population and HFEP allocation per
capita. However, the relationship runs counter to expectations—the more populous the
province is, the less allocation it receives from HFEP GAA funds.
The same trend of no correlation was observed for the allocation of funds to
BEmONC and CEmONC facilities. The provinces that were able to receive the highest
allocations were Davao del Sur, Davao Oriental, Davao del Norte, Occidental Mindoro,
Compostela Valley, Romblon, and Oriental Mindoro. Katas ng VAT benefited the following
provinces: Camiguin, Ifugao, Mt. Province, Guimaras, and Albay.
Senate initiatives were partial to only a handful of provinces, namely: Zamboanga del
Sur, Batangas, Nueva Ecija, Negros Oriental, Camiguin, Ilocos Norte, and Oriental Mindoro.
Despite the nonsubmission of PIPH estimates, which was one of the criteria in the HFEP
Pampanga
Tarlac
Southern Leyte
La Union
Mt. Province
Kalinga
Samar
SiquijorCatanduanesIlocos Norte
Ifugao
Leyte
ZambalesSorsogonIlocos SurCamarines SurMasbateCompostela ValleyNorthern Samar
Nueva Ecija
Pangasinan
Bataan
Davao Oriental
Kalookan City
Camarines NorteParanaque City
BulacanLas Pinas CityBoholSarangani
Benguet
Surigao del NorteAgusan del Norte
Sultan Kudarat
Negros Oriental
Apayao
Surigao del Sur
Albay
Quezon City
Aurora
Davao del Norte
Davao del Sur
AbraGuimaras
Romblon
North CotabatoSouth Cotabato
Oriental Mindoro
Agusan del SurMisamis Occidental
Marikina City
BiliranMarinduque
San Juan
CamiguinValenzuela
Occidental Mindoro
Pateros
Eastern Samar
Quirino
Capiz
MalabonTaguigPasig City
Palawan
Nueva Vizcaya
Negros Occidental
AklanBukidnon
Zamboanga Norte
Batanes
Cagayan
RizalCavite
Makati CityLanao del NorteZamboanga Sibugay
Antique
Mandaluyong City
Batangas
Cebu
Isabela
Laguna
Misamis Oriental
Manila City
Iloilo
Zamboanga del Sur
Quezon
01.
00e+
082.0
0e+0
83.00
e+084
.00e
+08 5.
00e+
08To
tal H
FEP
exp
0 2.00e+09 4.00e+09 6.00e+09 8.00e+09PIPH requirement
Fitted values Total HFEP
59
guidelines, the provinces of Camiguin, Ilocos Norte, and Oriental Mindoro were allocated
good sums of funds from Senate initiatives.
Similarly, House funds benefited only five—the City of Manila, Quirino,
Catanduanes, Albay, and Ilocos Sur. It should again be noted that Albay and Ilocos Sur did
not submit PIPH estimates to the DOH.
Discussion
In this study’s review of AOs, DOs, and DMs issued by DOH, it appears that there was no
reference made by HFEP guidelines to the AOs issued by the DOH on the definition of
“need” and rationalization of health facilities. For instance, the link of the HFEP to the Health
Facilities Enhancement Fund mentioned in the performance-based budgeting AO on hospitals
was not evident. Also, while AO 2006-0029 clearly outlines what the definition of need
should be, the DM for the criteria and process flow does not appear to be consistent with the
definition of need in the AO.
Based on interviews conducted, the funding priority for 2007 and 2008 were Levels 1
and 2 hospitals intended to serve as base hospitals for nursing students. This was following
the pronouncement of the previous administration that the government would provide
training hospitals for nursing students. For 2009, BHS and RHUs were included in the
priority to decongest DOH tertiary hospitals. Levels 1 and 2 hospitals identified for
BeMONC conversion were prioritized for regions with high maternal mortality rates. It
should be noted that it was only in 2010 that allocations were based on clear criteria specified
in administrative orders (AO 2009-0022 and AO 2010-0006).
As such, it was no surprise that when allocations from 2007 to 2010 were plotted with
PIPH, poverty incidence, and equity, there seemed to be no structured allocating mechanism
for the HFEP. While this was true for all funding sources, the gap was greater for HFEP
funds filled up by House and Senate initiatives that appeared to benefit only a handful of
provinces. Since the goal of the HFEP from 2007 to 2010 was to reduce maternal mortality,
identification of facilities for funding was geared toward reduction of travel time to health
facilities, which might not equate with the poverty incidence in the provinces. According to
the DOH, the plan for 2011–2012 was to saturate all the upgrading needs for BEmONC and
CEmONC. For 2013 onwards, it will focus on upgrading Levels 3 and 4 hospitals where
poverty incidence and other socioeconomic indicators will be considered in identifying
priority facilities.
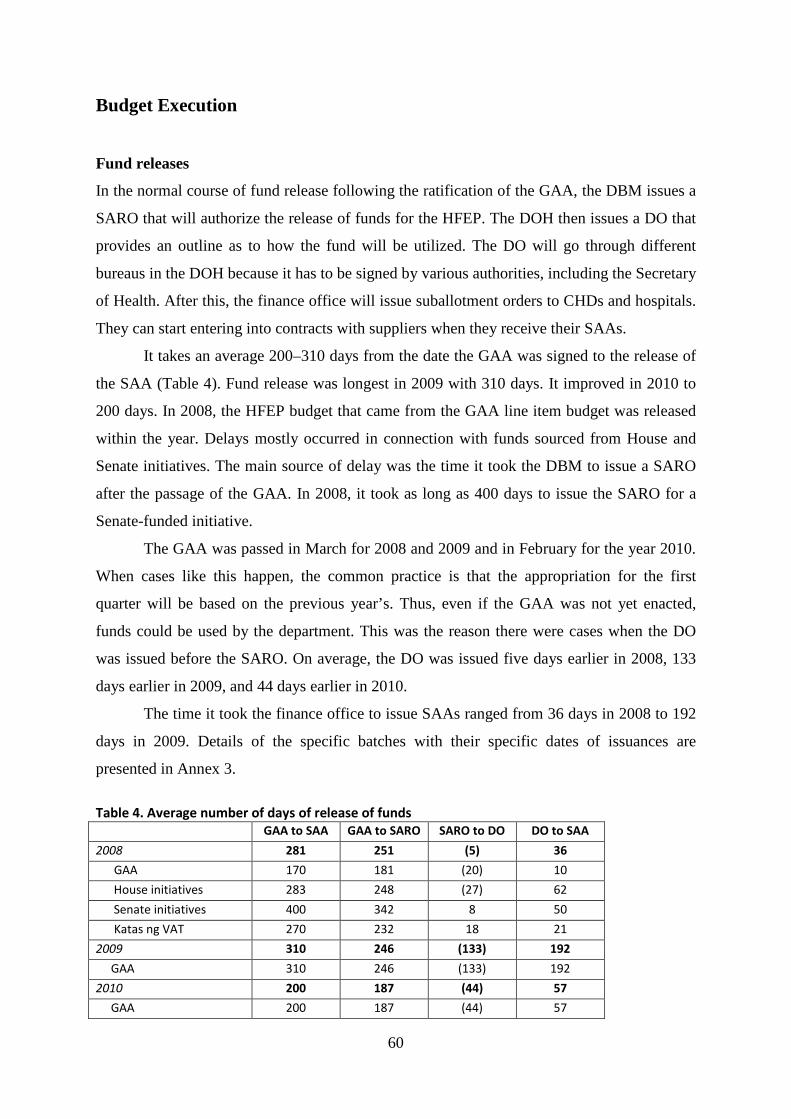
60
Budget Execution
Fund releases
In the normal course of fund release following the ratification of the GAA, the DBM issues a
SARO that will authorize the release of funds for the HFEP. The DOH then issues a DO that
provides an outline as to how the fund will be utilized. The DO will go through different
bureaus in the DOH because it has to be signed by various authorities, including the Secretary
of Health. After this, the finance office will issue suballotment orders to CHDs and hospitals.
They can start entering into contracts with suppliers when they receive their SAAs.
It takes an average 200–310 days from the date the GAA was signed to the release of
the SAA (Table 4). Fund release was longest in 2009 with 310 days. It improved in 2010 to
200 days. In 2008, the HFEP budget that came from the GAA line item budget was released
within the year. Delays mostly occurred in connection with funds sourced from House and
Senate initiatives. The main source of delay was the time it took the DBM to issue a SARO
after the passage of the GAA. In 2008, it took as long as 400 days to issue the SARO for a
Senate-funded initiative.
The GAA was passed in March for 2008 and 2009 and in February for the year 2010.
When cases like this happen, the common practice is that the appropriation for the first
quarter will be based on the previous year’s. Thus, even if the GAA was not yet enacted,
funds could be used by the department. This was the reason there were cases when the DO
was issued before the SARO. On average, the DO was issued five days earlier in 2008, 133
days earlier in 2009, and 44 days earlier in 2010.
The time it took the finance office to issue SAAs ranged from 36 days in 2008 to 192
days in 2009. Details of the specific batches with their specific dates of issuances are
presented in Annex 3.
Table 4. Average number of days of release of funds GAA to SAA GAA to SARO SARO to DO DO to SAA
2008 281 251 (5) 36
GAA 170 181 (20) 10
House initiatives 283 248 (27) 62
Senate initiatives 400 342 8 50
Katas ng VAT 270 232 18 21
2009 310 246 (133) 192
GAA 310 246 (133) 192
2010 200 187 (44) 57
GAA 200 187 (44) 57
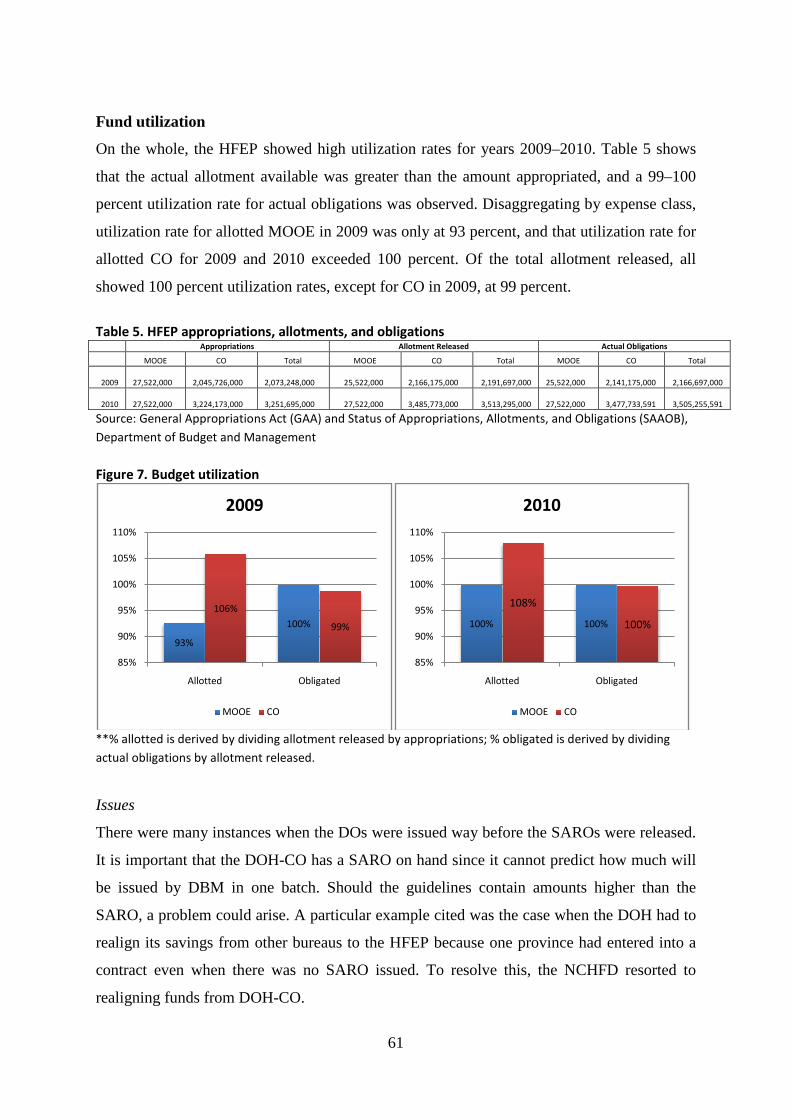
61
Fund utilization
On the whole, the HFEP showed high utilization rates for years 2009–2010. Table 5 shows
that the actual allotment available was greater than the amount appropriated, and a 99–100
percent utilization rate for actual obligations was observed. Disaggregating by expense class,
utilization rate for allotted MOOE in 2009 was only at 93 percent, and that utilization rate for
allotted CO for 2009 and 2010 exceeded 100 percent. Of the total allotment released, all
showed 100 percent utilization rates, except for CO in 2009, at 99 percent.
Table 5. HFEP appropriations, allotments, and obligations Appropriations Allotment Released Actual Obligations
MOOE CO Total MOOE CO Total MOOE CO Total
2009 27,522,000 2,045,726,000 2,073,248,000 25,522,000 2,166,175,000 2,191,697,000
25,522,000
2,141,175,000 2,166,697,000
2010 27,522,000 3,224,173,000 3,251,695,000 27,522,000 3,485,773,000 3,513,295,000
27,522,000
3,477,733,591 3,505,255,591
Source: General Appropriations Act (GAA) and Status of Appropriations, Allotments, and Obligations (SAAOB), Department of Budget and Management
Figure 7. Budget utilization
**% allotted is derived by dividing allotment released by appropriations; % obligated is derived by dividing actual obligations by allotment released.
Issues
There were many instances when the DOs were issued way before the SAROs were released.
It is important that the DOH-CO has a SARO on hand since it cannot predict how much will
be issued by DBM in one batch. Should the guidelines contain amounts higher than the
SARO, a problem could arise. A particular example cited was the case when the DOH had to
realign its savings from other bureaus to the HFEP because one province had entered into a
contract even when there was no SARO issued. To resolve this, the NCHFD resorted to
realigning funds from DOH-CO.
93%
100%
106%
99%
85%
90%
95%
100%
105%
110%
Allotted Obligated
2009
MOOE CO
100% 100%
108%
100%
85%
90%
95%
100%
105%
110%
Allotted Obligated
2010
MOOE CO
62
During the period covered by the study, the bidding and awarding of contract was
done by every LGU that received the HFEP funds. The NCHFD saw some inefficiencies in
this process and is revising its guidelines to conduct bulk bidding and procurement at the
CHD level.
Utilization rates appear to be high but it should be noted that this stops at the level of
the Central Office giving suballotment to CHDs/hospitals. Monitoring of obligation of HFEP
funds at the LGU level was a responsibility of the CHDs. Thus, unless the CHD submits its
financial report, the Central Office will not be informed of the fund utilization of the HFEP.
What the Central Office monitors, through the Infrastructure Division of the NCHFD, are
physical accomplishment reports of each facility on the reported percentage of completion
(for infrastructure projects) and procurement/delivery status (for equipment).
Monitoring and Control As part of HFEP monitoring and reporting, CHDs are in charge of conducting regular
monitoring of hospital upgrading projects for both DOH and LGU hospitals as well as other
health facilities. CHDs are also tasked to submit quarterly status reports of physical and
financial accomplishments to the FIMO and provide a copy to the NCHFD. Once
consolidated, the DOH, through the NCHFD, submits these quarterly status reports to the
Presidential Management Staff, the National Economic and Development Authority, and
other requesting agencies. Suballotment utilization reports are also submitted by the CHD to
the Finance Service.
As mentioned earlier, the Infrastructure Division of the NCHFD collects information
on the percentage of completion of infrastructure projects and procurement/delivery status of
equipment funded by the HFEP. Using this data as proxy for fund utilization, Table 6 shows
that a total of 63 percent of obligated funds in 2009 should have been utilized as of June
2011. Table 7 shows that for HFEP projects in 2010, 6 percent of the obligated funds were
under preprocurement and 36 percent were undergoing procurement. Meanwhile, 34 percent
of the funds went to equipment delivered for infrastructure projects being implemented and
12 percent to equipment delivered for completed infrastructure projects. A problem with
using this data as proxy was that 27 percent of obligated funds in 2009 and 13 percent in
2010 were unaccounted for; there appeared to be no status reports for these projects.
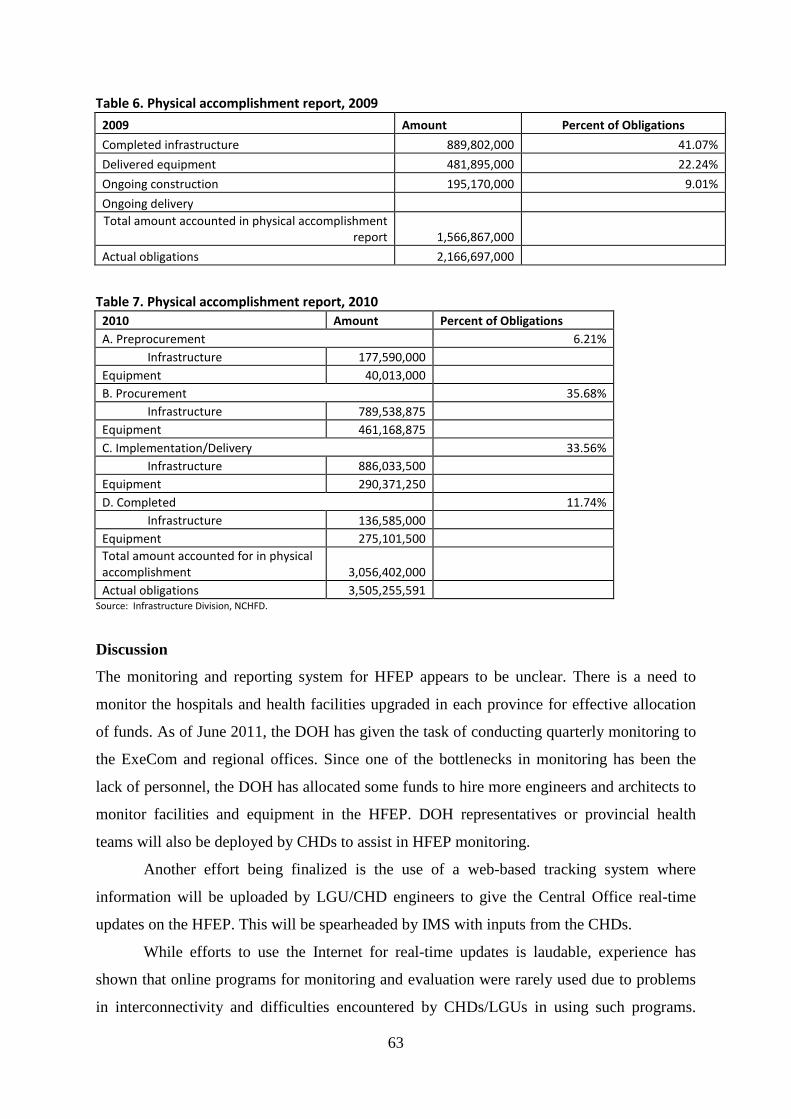
63
Table 6. Physical accomplishment report, 2009
Table 7. Physical accomplishment report, 2010
Source: Infrastructure Division, NCHFD.
Discussion
The monitoring and reporting system for HFEP appears to be unclear. There is a need to
monitor the hospitals and health facilities upgraded in each province for effective allocation
of funds. As of June 2011, the DOH has given the task of conducting quarterly monitoring to
the ExeCom and regional offices. Since one of the bottlenecks in monitoring has been the
lack of personnel, the DOH has allocated some funds to hire more engineers and architects to
monitor facilities and equipment in the HFEP. DOH representatives or provincial health
teams will also be deployed by CHDs to assist in HFEP monitoring.
Another effort being finalized is the use of a web-based tracking system where
information will be uploaded by LGU/CHD engineers to give the Central Office real-time
updates on the HFEP. This will be spearheaded by IMS with inputs from the CHDs.
While efforts to use the Internet for real-time updates is laudable, experience has
shown that online programs for monitoring and evaluation were rarely used due to problems
in interconnectivity and difficulties encountered by CHDs/LGUs in using such programs.
2009 Amount Percent of Obligations
Completed infrastructure 889,802,000 41.07%
Delivered equipment 481,895,000 22.24%
Ongoing construction 195,170,000 9.01%
Ongoing delivery Total amount accounted in physical accomplishment
report 1,566,867,000
Actual obligations 2,166,697,000
2010 Amount Percent of Obligations A. Preprocurement 6.21% Infrastructure 177,590,000 Equipment 40,013,000 B. Procurement 35.68% Infrastructure 789,538,875 Equipment 461,168,875 C. Implementation/Delivery 33.56% Infrastructure 886,033,500 Equipment 290,371,250 D. Completed 11.74% Infrastructure 136,585,000 Equipment 275,101,500 Total amount accounted for in physical accomplishment 3,056,402,000 Actual obligations 3,505,255,591
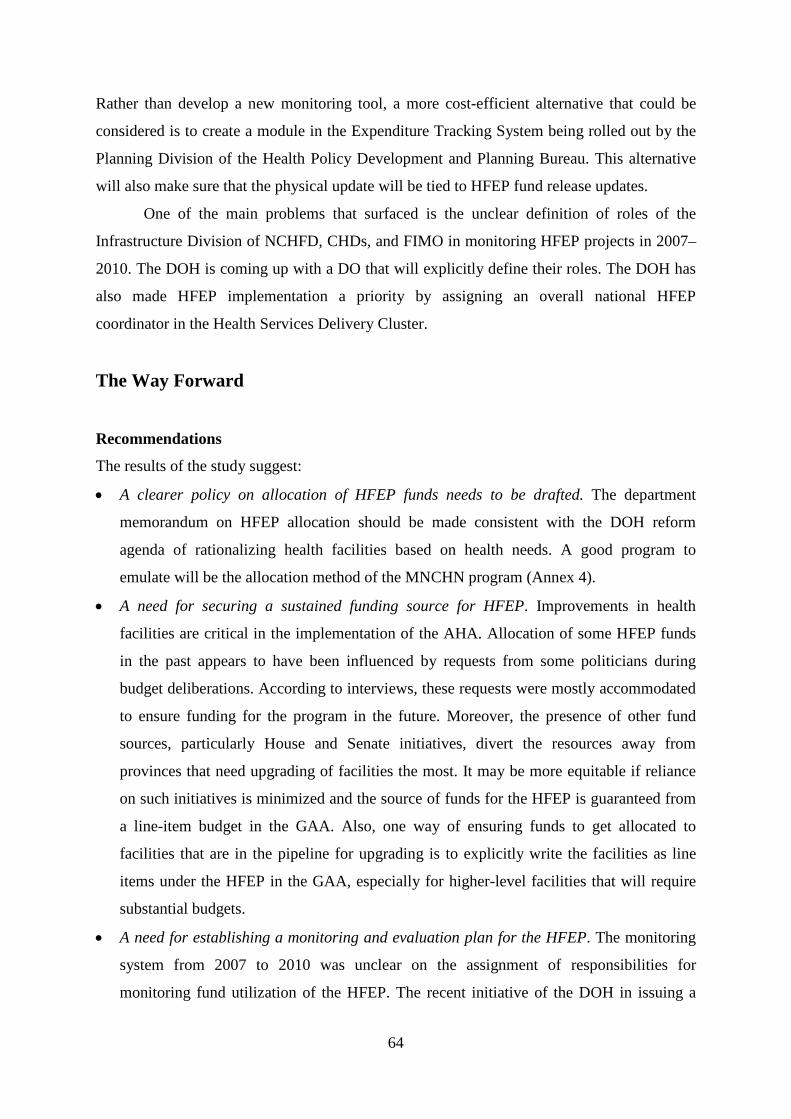
64
Rather than develop a new monitoring tool, a more cost-efficient alternative that could be
considered is to create a module in the Expenditure Tracking System being rolled out by the
Planning Division of the Health Policy Development and Planning Bureau. This alternative
will also make sure that the physical update will be tied to HFEP fund release updates.
One of the main problems that surfaced is the unclear definition of roles of the
Infrastructure Division of NCHFD, CHDs, and FIMO in monitoring HFEP projects in 2007–
2010. The DOH is coming up with a DO that will explicitly define their roles. The DOH has
also made HFEP implementation a priority by assigning an overall national HFEP
coordinator in the Health Services Delivery Cluster.
The Way Forward
Recommendations
The results of the study suggest:
• A clearer policy on allocation of HFEP funds needs to be drafted. The department
memorandum on HFEP allocation should be made consistent with the DOH reform
agenda of rationalizing health facilities based on health needs. A good program to
emulate will be the allocation method of the MNCHN program (Annex 4).
• A need for securing a sustained funding source for HFEP. Improvements in health
facilities are critical in the implementation of the AHA. Allocation of some HFEP funds
in the past appears to have been influenced by requests from some politicians during
budget deliberations. According to interviews, these requests were mostly accommodated
to ensure funding for the program in the future. Moreover, the presence of other fund
sources, particularly House and Senate initiatives, divert the resources away from
provinces that need upgrading of facilities the most. It may be more equitable if reliance
on such initiatives is minimized and the source of funds for the HFEP is guaranteed from
a line-item budget in the GAA. Also, one way of ensuring funds to get allocated to
facilities that are in the pipeline for upgrading is to explicitly write the facilities as line
items under the HFEP in the GAA, especially for higher-level facilities that will require
substantial budgets.
• A need for establishing a monitoring and evaluation plan for the HFEP. The monitoring
system from 2007 to 2010 was unclear on the assignment of responsibilities for
monitoring fund utilization of the HFEP. The recent initiative of the DOH in issuing a
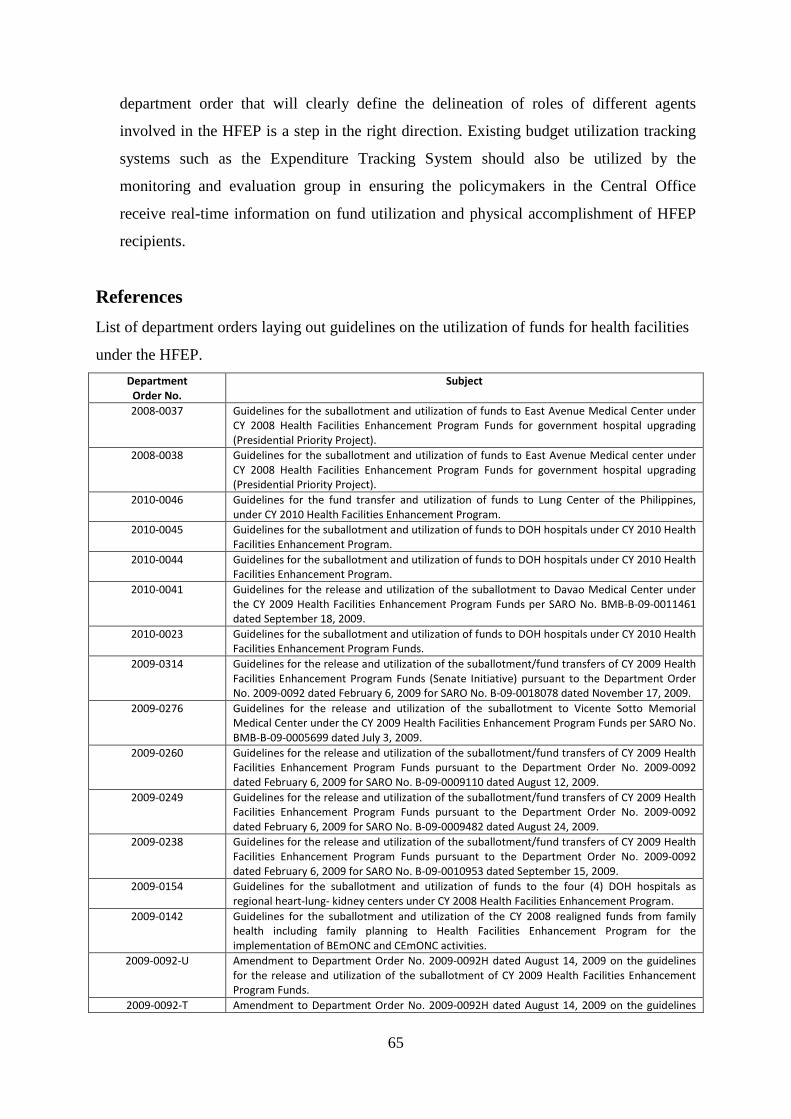
65
department order that will clearly define the delineation of roles of different agents
involved in the HFEP is a step in the right direction. Existing budget utilization tracking
systems such as the Expenditure Tracking System should also be utilized by the
monitoring and evaluation group in ensuring the policymakers in the Central Office
receive real-time information on fund utilization and physical accomplishment of HFEP
recipients.
References List of department orders laying out guidelines on the utilization of funds for health facilities
under the HFEP. Department
Order No. Subject
2008-0037 Guidelines for the suballotment and utilization of funds to East Avenue Medical Center under CY 2008 Health Facilities Enhancement Program Funds for government hospital upgrading (Presidential Priority Project).
2008-0038 Guidelines for the suballotment and utilization of funds to East Avenue Medical center under CY 2008 Health Facilities Enhancement Program Funds for government hospital upgrading (Presidential Priority Project).
2010-0046 Guidelines for the fund transfer and utilization of funds to Lung Center of the Philippines, under CY 2010 Health Facilities Enhancement Program.
2010-0045 Guidelines for the suballotment and utilization of funds to DOH hospitals under CY 2010 Health Facilities Enhancement Program.
2010-0044 Guidelines for the suballotment and utilization of funds to DOH hospitals under CY 2010 Health Facilities Enhancement Program.
2010-0041 Guidelines for the release and utilization of the suballotment to Davao Medical Center under the CY 2009 Health Facilities Enhancement Program Funds per SARO No. BMB-B-09-0011461 dated September 18, 2009.
2010-0023 Guidelines for the suballotment and utilization of funds to DOH hospitals under CY 2010 Health Facilities Enhancement Program Funds.
2009-0314 Guidelines for the release and utilization of the suballotment/fund transfers of CY 2009 Health Facilities Enhancement Program Funds (Senate Initiative) pursuant to the Department Order No. 2009-0092 dated February 6, 2009 for SARO No. B-09-0018078 dated November 17, 2009.
2009-0276 Guidelines for the release and utilization of the suballotment to Vicente Sotto Memorial Medical Center under the CY 2009 Health Facilities Enhancement Program Funds per SARO No. BMB-B-09-0005699 dated July 3, 2009.
2009-0260 Guidelines for the release and utilization of the suballotment/fund transfers of CY 2009 Health Facilities Enhancement Program Funds pursuant to the Department Order No. 2009-0092 dated February 6, 2009 for SARO No. B-09-0009110 dated August 12, 2009.
2009-0249 Guidelines for the release and utilization of the suballotment/fund transfers of CY 2009 Health Facilities Enhancement Program Funds pursuant to the Department Order No. 2009-0092 dated February 6, 2009 for SARO No. B-09-0009482 dated August 24, 2009.
2009-0238 Guidelines for the release and utilization of the suballotment/fund transfers of CY 2009 Health Facilities Enhancement Program Funds pursuant to the Department Order No. 2009-0092 dated February 6, 2009 for SARO No. B-09-0010953 dated September 15, 2009.
2009-0154 Guidelines for the suballotment and utilization of funds to the four (4) DOH hospitals as regional heart-lung- kidney centers under CY 2008 Health Facilities Enhancement Program.
2009-0142 Guidelines for the suballotment and utilization of the CY 2008 realigned funds from family health including family planning to Health Facilities Enhancement Program for the implementation of BEmONC and CEmONC activities.
2009-0092-U Amendment to Department Order No. 2009-0092H dated August 14, 2009 on the guidelines for the release and utilization of the suballotment of CY 2009 Health Facilities Enhancement Program Funds.
2009-0092-T Amendment to Department Order No. 2009-0092H dated August 14, 2009 on the guidelines
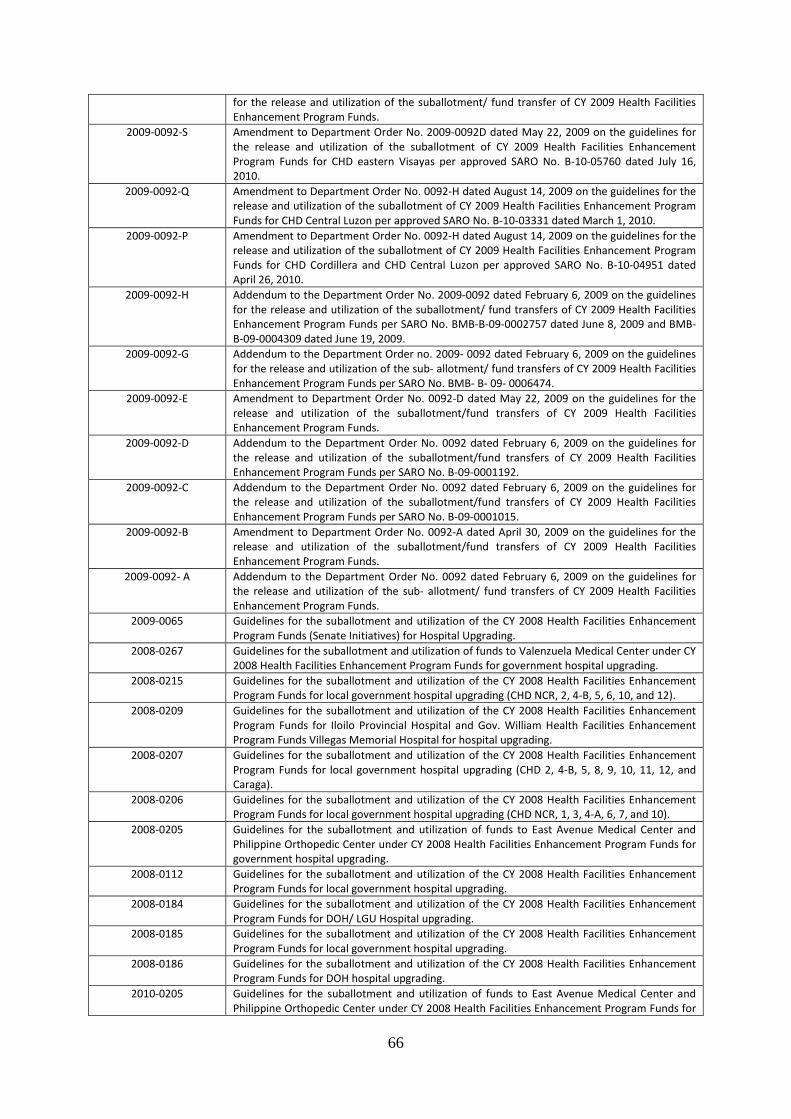
66
for the release and utilization of the suballotment/ fund transfer of CY 2009 Health Facilities Enhancement Program Funds.
2009-0092-S Amendment to Department Order No. 2009-0092D dated May 22, 2009 on the guidelines for the release and utilization of the suballotment of CY 2009 Health Facilities Enhancement Program Funds for CHD eastern Visayas per approved SARO No. B-10-05760 dated July 16, 2010.
2009-0092-Q Amendment to Department Order No. 0092-H dated August 14, 2009 on the guidelines for the release and utilization of the suballotment of CY 2009 Health Facilities Enhancement Program Funds for CHD Central Luzon per approved SARO No. B-10-03331 dated March 1, 2010.
2009-0092-P Amendment to Department Order No. 0092-H dated August 14, 2009 on the guidelines for the release and utilization of the suballotment of CY 2009 Health Facilities Enhancement Program Funds for CHD Cordillera and CHD Central Luzon per approved SARO No. B-10-04951 dated April 26, 2010.
2009-0092-H Addendum to the Department Order No. 2009-0092 dated February 6, 2009 on the guidelines for the release and utilization of the suballotment/ fund transfers of CY 2009 Health Facilities Enhancement Program Funds per SARO No. BMB-B-09-0002757 dated June 8, 2009 and BMB-B-09-0004309 dated June 19, 2009.
2009-0092-G Addendum to the Department Order no. 2009- 0092 dated February 6, 2009 on the guidelines for the release and utilization of the sub- allotment/ fund transfers of CY 2009 Health Facilities Enhancement Program Funds per SARO No. BMB- B- 09- 0006474.
2009-0092-E Amendment to Department Order No. 0092-D dated May 22, 2009 on the guidelines for the release and utilization of the suballotment/fund transfers of CY 2009 Health Facilities Enhancement Program Funds.
2009-0092-D Addendum to the Department Order No. 0092 dated February 6, 2009 on the guidelines for the release and utilization of the suballotment/fund transfers of CY 2009 Health Facilities Enhancement Program Funds per SARO No. B-09-0001192.
2009-0092-C Addendum to the Department Order No. 0092 dated February 6, 2009 on the guidelines for the release and utilization of the suballotment/fund transfers of CY 2009 Health Facilities Enhancement Program Funds per SARO No. B-09-0001015.
2009-0092-B Amendment to Department Order No. 0092-A dated April 30, 2009 on the guidelines for the release and utilization of the suballotment/fund transfers of CY 2009 Health Facilities Enhancement Program Funds.
2009-0092- A Addendum to the Department Order No. 0092 dated February 6, 2009 on the guidelines for the release and utilization of the sub- allotment/ fund transfers of CY 2009 Health Facilities Enhancement Program Funds.
2009-0065 Guidelines for the suballotment and utilization of the CY 2008 Health Facilities Enhancement Program Funds (Senate Initiatives) for Hospital Upgrading.
2008-0267 Guidelines for the suballotment and utilization of funds to Valenzuela Medical Center under CY 2008 Health Facilities Enhancement Program Funds for government hospital upgrading.
2008-0215 Guidelines for the suballotment and utilization of the CY 2008 Health Facilities Enhancement Program Funds for local government hospital upgrading (CHD NCR, 2, 4-B, 5, 6, 10, and 12).
2008-0209 Guidelines for the suballotment and utilization of the CY 2008 Health Facilities Enhancement Program Funds for Iloilo Provincial Hospital and Gov. William Health Facilities Enhancement Program Funds Villegas Memorial Hospital for hospital upgrading.
2008-0207 Guidelines for the suballotment and utilization of the CY 2008 Health Facilities Enhancement Program Funds for local government hospital upgrading (CHD 2, 4-B, 5, 8, 9, 10, 11, 12, and Caraga).
2008-0206 Guidelines for the suballotment and utilization of the CY 2008 Health Facilities Enhancement Program Funds for local government hospital upgrading (CHD NCR, 1, 3, 4-A, 6, 7, and 10).
2008-0205 Guidelines for the suballotment and utilization of funds to East Avenue Medical Center and Philippine Orthopedic Center under CY 2008 Health Facilities Enhancement Program Funds for government hospital upgrading.
2008-0112 Guidelines for the suballotment and utilization of the CY 2008 Health Facilities Enhancement Program Funds for local government hospital upgrading.
2008-0184 Guidelines for the suballotment and utilization of the CY 2008 Health Facilities Enhancement Program Funds for DOH/ LGU Hospital upgrading.
2008-0185 Guidelines for the suballotment and utilization of the CY 2008 Health Facilities Enhancement Program Funds for local government hospital upgrading.
2008-0186 Guidelines for the suballotment and utilization of the CY 2008 Health Facilities Enhancement Program Funds for DOH hospital upgrading.
2010-0205 Guidelines for the suballotment and utilization of funds to East Avenue Medical Center and Philippine Orthopedic Center under CY 2008 Health Facilities Enhancement Program Funds for
67
government hospital upgrading. 2010-0064 Guidelines for the release and utilization of the suballotment of CY 2009 Health Facilities
Enhancement Program Funds (Continuing Appropriation) pursuant to the Department Order No. 2009-0092 dated February 6, 2009 for SARO No. B-10-03794 dated March 1, 2010.
2010-0088 Guidelines for the release and utilization of the suballotment/fund transfers of CY 2010 Health Facilities Enhancement Program Funds per SARO No. BMB-B-10-0001481 dated March 19, 2010.
2010-0115 Guidelines for the release and utilization of the suballotment of CY 2010 Health Facilities Enhancement Program Funds.
2010-0137 Guidelines for the release and utilization of the suballotment/fund transfer of CY 2010 Health Facilities Enhancement Program Funds for Center for Health Development for MIMAROPA per SARO No. BMB-B-10-0004271 dated June 16, 2010.
2010-0138 Guidelines for the release and utilization of the sub- allotment/ fund transfer of CY 2010 Health Facilities Enhancement Program Funds for Center for Health Development for CARAGA per SARO No. BMB- B- 10- 0004271 dated June 16, 2010.
2010-0139 Guidelines for the release and utilization of the suballotment/fund transfer of CY 2010 Health Facilities Enhancement Program Funds for Center for Health Development for Cordillera per SARO No. BMB-B-10-00004271 dated June 16, 2010.
2010-0140 Guidelines for the release and utilization of the suballotment/fund transfer of CY 2010 Health Facilities Enhancement Program Funds for Center for Health Development for Cagayan Valley per SARO No. BMB-B-10-0004271 dated June 16, 2010.
2010-0141 Guidelines for the release and utilization of the suballotment/fund transfer of CY 2010 Health Facilities Enhancement Program Funds for Center for Health Development for Ilocos per SARO No. BMB-B-10-0004271 dated June 16, 2010.
2010-0142 Guidelines for the release and utilization of the suballotment/fund transfer of CY 2010 Health Facilities Enhancement Program Funds for Center for Health Development for Northern Mindanao per SARO No. BMB-B-10-0004271 dated June 16, 2010.
2010-0143 Guidelines for the release and utilization of the suballotment/fund transfer of CY 2010 Health Facilities Enhancement Program Funds for Center for Health Development for SOCCSKSARGEN per SARO No. BMB-B-10-0004271 dated June 16, 2010.
2010-0144 Guidelines for the release and utilization of the suballotment/fund transfer of CY 2010 Health Facilities Enhancement Program Funds for Center for Health Development for Eastern Visayas per SARO No. BMB-B-10-0004271 dated June 16, 2010.
2010-0145 Guidelines for the release and utilization of the suballotment/fund transfer of CY 2010 Health Facilities Enhancement Program Funds for Center for Health Development for Central Visayas per SARO No. BMB-B-10-0004271 dated June 16, 2010.
2010-0146 Guidelines for the release and utilization of the suballotment/fund transfer of CY 2010 Health Facilities Enhancement Program Funds for Center for Health Development for Western Visayas per SARO No. BMB-B-10-0004271 dated June 16, 2010.
2010-0147 Guidelines for the release and utilization of the suballotment/fund transfer of CY 2010 Health Facilities Enhancement Program Funds for Center for Health Development for Metro Manila (NCR) per SARO No. BMB-B-10-0004271 dated June 16, 2010.
2010-0148 Guidelines for the release and utilization of the suballotment/fund transfer of CY 2010 Health Facilities Enhancement Program Funds for Center for Health Development for CALABARZON per SARO No. BMB-B-10-0004271 dated June 16, 2010.
2010-0149 Guidelines for the release and utilization of the suballotment/fund transfer of CY 2010 Health Facilities Enhancement Program Funds for Center for Health Development for DOH hospitals/ specialty centers per SARO No. BMB-B-10-0004271 dated June 16, 2010.
2010-0157 Guidelines for the release and utilization of the suballotment/fund transfer of CY 2010 Health Facilities Enhancement Program Funds for Center for Health Development for Central Luzon per SARO No. BMB-B-10-0004271 dated June 16, 2010.
2010-0168 Guidelines for the release and utilization of the suballotment/fund transfer of CY 2010 Health Facilities Enhancement Program Funds for Center for Health Development for DOH Blood Centers per SARO No. BMB-B-10-0004271 dated June 16, 2010.
2010-0181 Guidelines for the release and utilization of the suballotment/fund transfer of CY 2010 Health Facilities Enhancement Program Funds for Center for Health Development for DOH hospital per SARO No. BMB-B-10-0004271 dated June 16, 2010.
2010-0241 Guidelines for the release and utilization of the suballotment of CY 2010 Health Facilities Enhancement Program Funds.
2010-0245 Guidelines for the release and utilization of the suballotment/fund transfer of CY 2010 Health Facilities Enhancement Program Funds per SARO No. BMB-B-10-0024466 dated December 3, 2010.
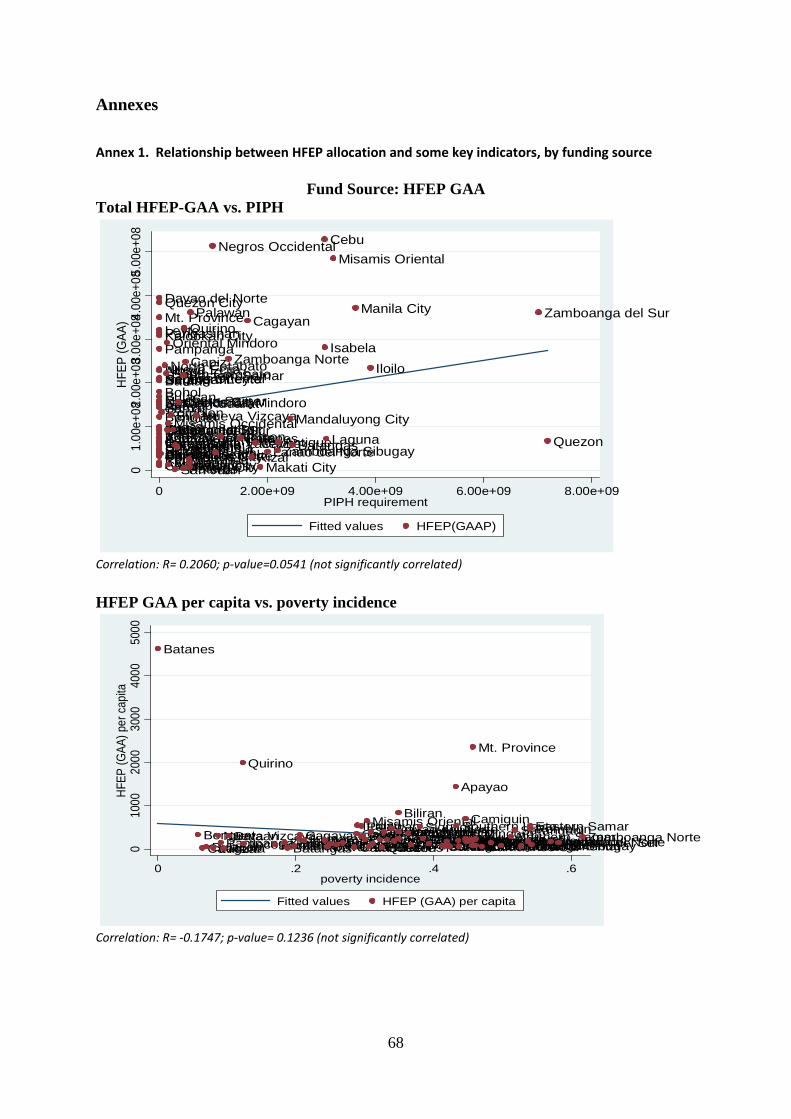
68
Annexes
Annex 1. Relationship between HFEP allocation and some key indicators, by funding source
Fund Source: HFEP GAA Total HFEP-GAA vs. PIPH
Correlation: R= 0.2060; p-value=0.0541 (not significantly correlated)
HFEP GAA per capita vs. poverty incidence
Correlation: R= -0.1747; p-value= 0.1236 (not significantly correlated)
Davao Oriental
Kalookan City
Davao del Sur
SamarNorthern Samar
Surigao del NorteParanaque CityIlocos SurCamarines Sur
Nueva Ecija
Agusan del Norte
Davao del Norte
Ilocos Norte
BenguetBulacan
ZambalesCompostela Valley
Southern Leyte
Camarines Norte
Masbate
Leyte
BoholSultan Kudarat
Catanduanes
Albay
ApayaoLas Pinas City
Tarlac
Bataan
Kalinga
Pangasinan
Negros OrientalSarangani
Quezon City
AuroraAbra
Pampanga
Mt. Province
La Union
IfugaoSurigao del SurSorsogonSiquijorGuimaras
Romblon
North CotabatoSouth Cotabato
Oriental Mindoro
Agusan del SurMisamis Occidental
Marikina City
BiliranMarinduque
San Juan
CamiguinValenzuela
Occidental Mindoro
Pateros
Eastern Samar
Quirino
Capiz
MalabonTaguigPasig City
Palawan
Nueva Vizcaya
Negros Occidental
AklanBukidnon
Zamboanga Norte
Batanes
Cagayan
RizalCavite
Makati CityLanao del NorteZamboanga Sibugay
Antique
Mandaluyong City
Batangas
Cebu
Isabela
Laguna
Misamis Oriental
Manila City
Iloilo
Zamboanga del Sur
Quezon
01.
00e+
082.0
0e+0
83.00
e+084
.00e
+085.
00e+
08HF
EP (G
AA)
0 2.00e+09 4.00e+09 6.00e+09 8.00e+09PIPH requirement
Fitted values HFEP(GAAP)
Batanes
BenguetCaviteBulacanLaguna
Nueva VizcayaPampangaRizalBataan
Quirino
Ilocos NorteIlocos SurZambalesBatangasTarlacGuimarasCagayanIsabelaAuroraDavao del SurPangasinanKalingaIloiloCatanduanesCapizIfugaoSouth CotabatoPalawanBasilanCebuMisamis Oriental
La UnionZamboanga del SurNueva EcijaNegros OccidentalQuezon
Oriental MindoroNorth CotabatoDavao del NorteLeyteMarinduqueBiliran
Agusan del NorteOccidental MindoroCompostela Valley
SiquijorTawi-TawiAntiqueSorsogonBukidnonNegros OrientalCamarines Norte
Apayao
Southern LeyteAlbayAbraSultan Kudarat
Camiguin
Lanao del SurSurigao del SurSamarLanao del Norte
Mt. Province
Misamis OccidentalAklanSuluCamarines SurBoholZamboanga SibugayNorthern SamarSarangani
Davao OrientalMaguindanaoRomblonEastern SamarMasbateSurigao del NorteAgusan del SurZamboanga Norte
010
0020
0030
0040
0050
00HF
EP (G
AA) p
er c
apita
0 .2 .4 .6poverty incidence
Fitted values HFEP (GAA) per capita
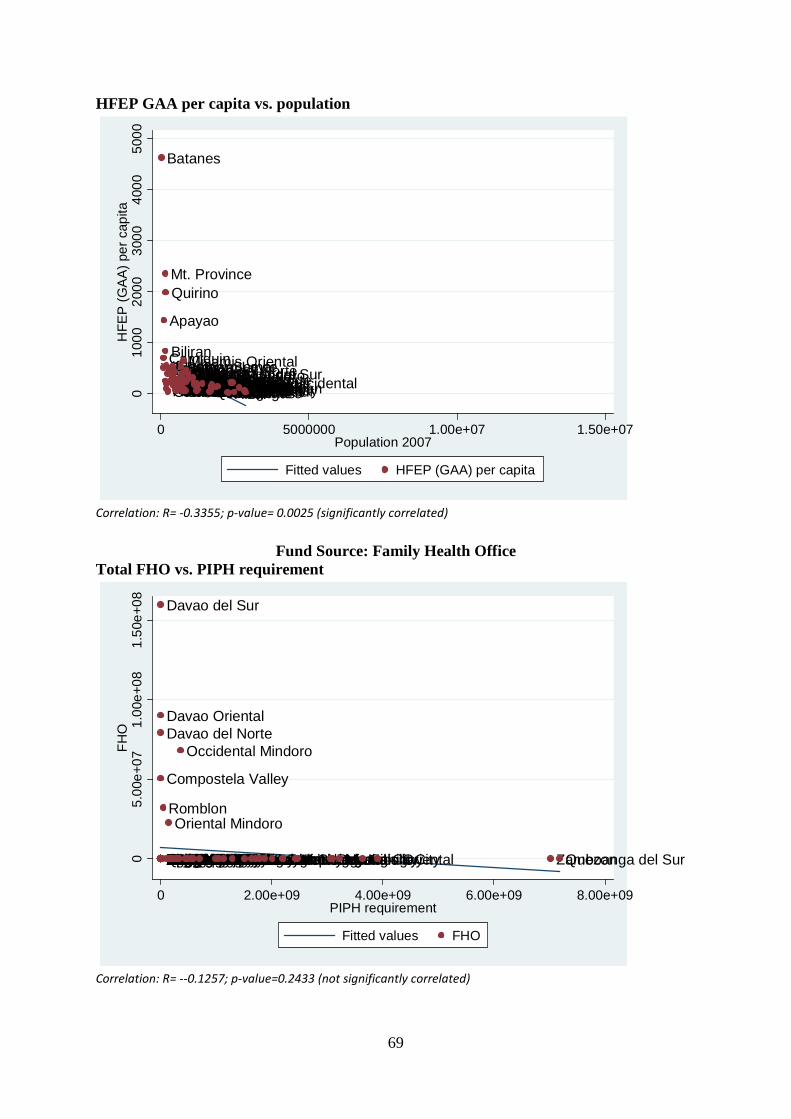
69
HFEP GAA per capita vs. population
Correlation: R= -0.3355; p-value= 0.0025 (significantly correlated)
Fund Source: Family Health Office
Total FHO vs. PIPH requirement
Correlation: R= --0.1257; p-value=0.2433 (not significantly correlated)
Batanes
CamiguinSiquijor
Apayao
Mt. Province
Biliran
Guimaras
Quirino
IfugaoKalingaAuroraMarinduqueAbraCatanduanesRomblonAgusan del NorteBenguetSouthern LeyteNueva VizcayaEastern SamarBasilanSurigao del NorteOccidental MindoroTawi-TawiSaranganiDavao OrientalZambalesAklanCamarines NorteAntiqueMisamis OccidentalLanao del NorteSurigao del SurZamboanga SibugayIlocos NorteNorthern SamarAgusan del SurIlocos SurCompostela ValleyBataanSultan KudaratPalawanSamarCapizSorsogonMaguindanaoLa UnionOriental MindoroMisamis OrientalSouth CotabatoMasbateDavao del SurDavao del NorteSuluZamboanga NorteZamboanga del SurCagayanNorth CotabatoLanao del SurBukidnonAlbayBoholNegros OrientalTarlacIsabelaQuezonIloiloCamarines SurLeyteNueva EcijaPampangaBatangasRizal
Negros OccidentalCebuLagunaPangasinanBulacanCavite010
0020
0030
0040
0050
00H
FEP
(GA
A) p
er c
apita
0 5000000 1.00e+07 1.50e+07Population 2007
Fitted values HFEP (GAA) per capita
Negros OrientalNorthern Samar
Davao del Norte
Southern LeyteSamarAlbayLeyteKalingaAuroraLas Pinas CityParanaque CityMasbateTarlac
Davao Oriental
PangasinanIlocos NorteIfugaoAbra
Davao del Sur
BenguetSultan KudaratZambalesIlocos Sur
Compostela Valley
La UnionSorsogonCatanduanesKalookan CitySurigao del NorteSiquijorCamarines NorteBataanSurigao del SurQuezon CityCamarines SurPampangaBulacanApayaoNueva EcijaSaranganiMt. ProvinceAgusan del NorteBoholGuimaras
Romblon
North CotabatoSouth Cotabato
Oriental Mindoro
Agusan del SurMisamis OccidentalMarikina CityBiliranMarinduqueSan JuanCamiguinValenzuela
Occidental Mindoro
PaterosEastern SamarQuirinoCapizMalabonTaguigPasig CityPalawanNueva VizcayaNegros OccidentalAklanBukidnonZamboanga NorteBatanesCagayanRizalCaviteMakati CityLanao del NorteZamboanga SibugayAntiqueMandaluyong CityBatangasCebuIsabelaLagunaMisamis OrientalManila CityIloilo Zamboanga del SurQuezon05.
00e+
071.
00e+
081.
50e+
08FH
O
0 2.00e+09 4.00e+09 6.00e+09 8.00e+09PIPH requirement
Fitted values FHO
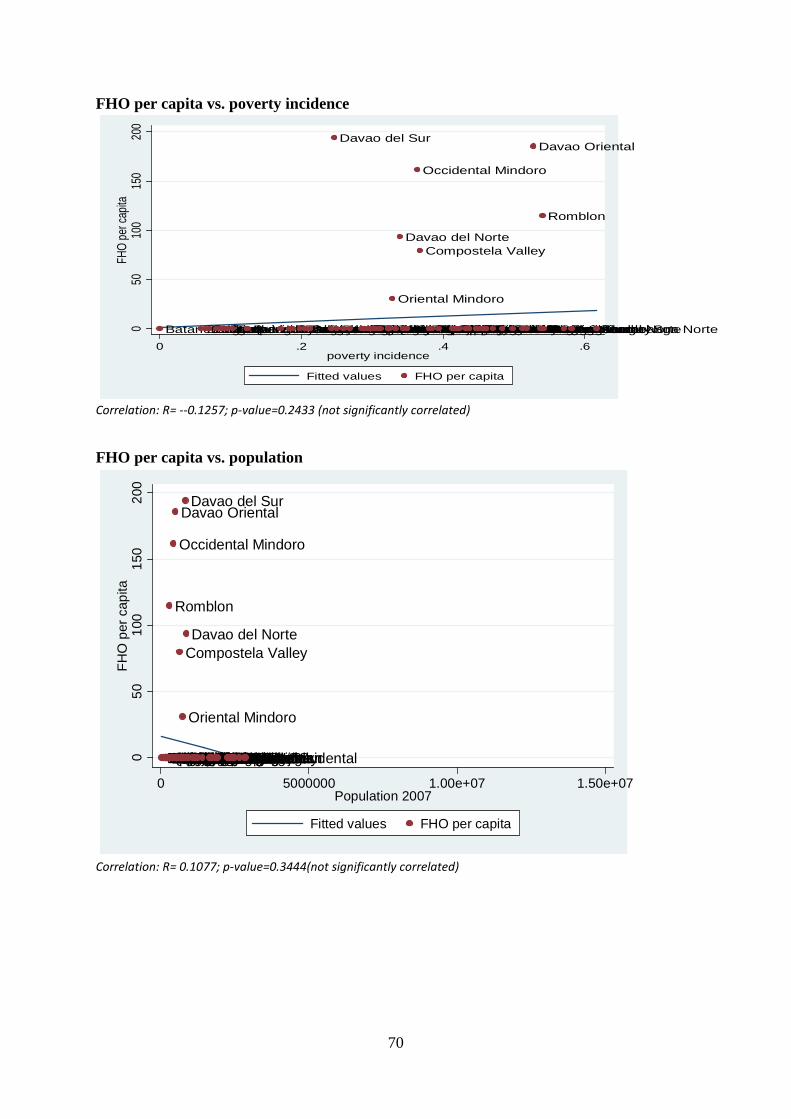
70
FHO per capita vs. poverty incidence
Correlation: R= --0.1257; p-value=0.2433 (not significantly correlated)
FHO per capita vs. population
Correlation: R= 0.1077; p-value=0.3444(not significantly correlated)
BatanesBenguetCaviteBulacanLagunaNueva VizcayaPampangaRizalBataanQuirinoIlocos NorteIlocos SurZambalesBatangasTarlacGuimarasCagayanIsabelaAurora
Davao del Sur
PangasinanKalingaIloiloCatanduanesCapizIfugaoPalawanSouth CotabatoBasilanCebuMisamis OrientalLa UnionZamboanga del SurNueva EcijaNegros OccidentalQuezon
Oriental Mindoro
North Cotabato
Davao del Norte
LeyteAgusan del NorteMarinduqueBiliran
Occidental Mindoro
Compostela Valley
SiquijorTawi-TawiAntiqueSorsogonBukidnonNegros OrientalCamarines NorteApayaoSouthern LeyteAlbayAbraSultan KudaratCamiguinLanao del SurSurigao del SurSamarLanao del NorteMt. ProvinceMisamis OccidentalSuluAklanCamarines SurBoholZamboanga SibugayNorthern SamarSarangani
Davao Oriental
MaguindanaoEastern Samar
Romblon
MasbateSurigao del NorteAgusan del SurZamboanga Norte050
100
150
200
FHO
per c
apita
0 .2 .4 .6poverty incidence
Fitted values FHO per capita
BatanesCamiguinSiquijorApayaoMt. ProvinceBiliranGuimarasQuirinoIfugaoKalingaAuroraMarinduqueAbraCatanduanes
Romblon
Agusan del NorteBenguetSouthern LeyteNueva VizcayaEastern SamarBasilanSurigao del Norte
Occidental Mindoro
Tawi-TawiSarangani
Davao Oriental
ZambalesAklanCamarines NorteAntiqueMisamis OccidentalLanao del NorteSurigao del SurZamboanga SibugayIlocos NorteNorthern SamarAgusan del SurIlocos Sur
Compostela Valley
BataanSultan KudaratPalawanSamarCapizSorsogonMaguindanaoLa Union
Oriental Mindoro
Misamis OrientalSouth CotabatoMasbate
Davao del Sur
Davao del Norte
SuluZamboanga NorteZamboanga del SurCagayanNorth CotabatoLanao del SurBukidnonAlbayBoholNegros OrientalTarlacIsabelaQuezonIloiloCamarines SurLeyteNueva EcijaPampangaBatangasRizalNegros OccidentalCebuLagunaPangasinanBulacanCavite050
100
150
200
FHO
per
cap
ita
0 5000000 1.00e+07 1.50e+07Population 2007
Fitted values FHO per capita
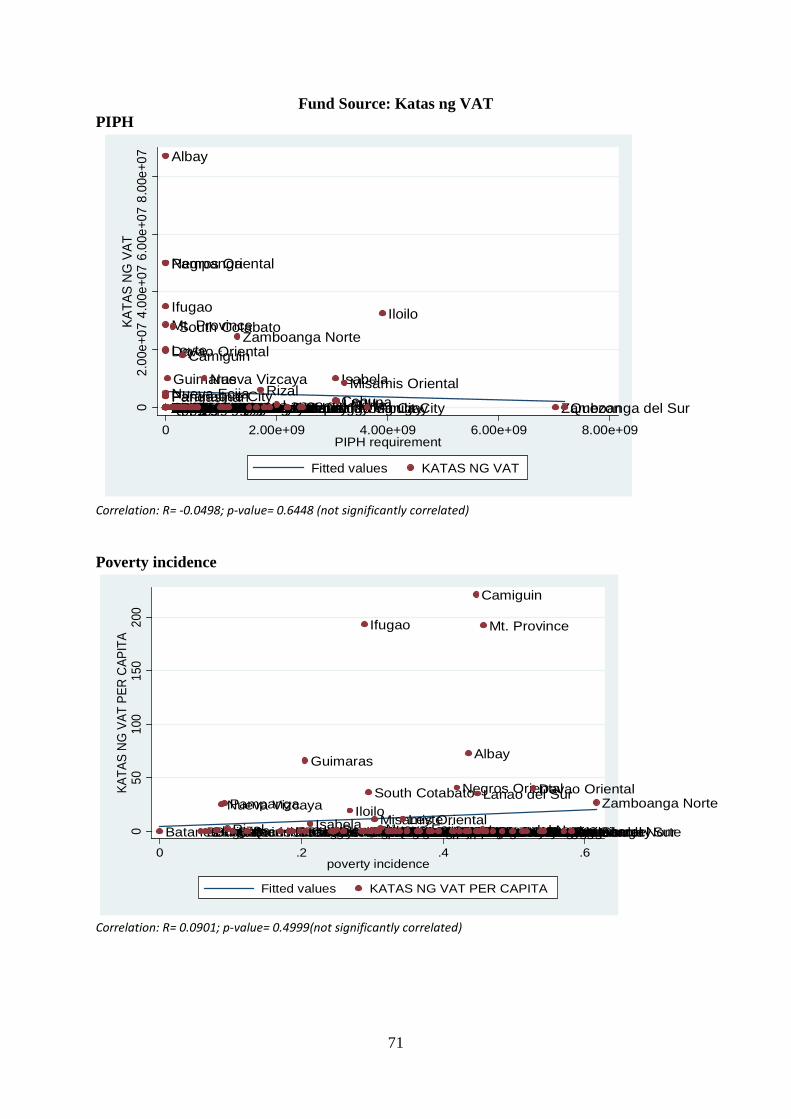
71
Fund Source: Katas ng VAT PIPH
Correlation: R= -0.0498; p-value= 0.6448 (not significantly correlated) Poverty incidence
Correlation: R= 0.0901; p-value= 0.4999(not significantly correlated)
Pampanga
Masbate
Negros Oriental
Ifugao
Northern Samar
Albay
Ilocos NorteSamarDavao del SurKalingaBohol
Mt. Province
SorsogonZambalesNueva EcijaSaranganiLa UnionKalookan CityPangasinanSultan KudaratLas Pinas CityCatanduanesSouthern LeyteParanaque City
Leyte
Ilocos SurSurigao del SurTarlacCamarines Sur
Davao Oriental
ApayaoAuroraBataanSiquijorSurigao del NorteBenguetAgusan del NorteBulacanCamarines NorteAbraQuezon CityCompostela ValleyDavao del Norte
Guimaras
RomblonNorth Cotabato
South Cotabato
Oriental MindoroAgusan del SurMisamis OccidentalMarikina CityBiliranMarinduqueSan Juan
Camiguin
ValenzuelaOccidental MindoroPaterosEastern SamarQuirinoCapizMalabonTaguigPasig CityPalawan
Nueva Vizcaya
Negros OccidentalAklanBukidnon
Zamboanga Norte
BatanesCagayanRizalCaviteMakati CityLanao del NorteZamboanga SibugayAntiqueMandaluyong CityBatangasCebu
IsabelaLagunaMisamis Oriental
Manila City
Iloilo
Zamboanga del SurQuezon02.
00e+
074.
00e+
076.
00e+
078.
00e+
07KA
TAS
NG
VAT
0 2.00e+09 4.00e+09 6.00e+09 8.00e+09PIPH requirement
Fitted values KATAS NG VAT
BatanesBenguetCaviteBulacanLaguna
Nueva VizcayaPampanga
RizalBataanQuirinoIlocos NorteIlocos SurZambalesBatangasTarlac
Guimaras
CagayanIsabelaAuroraDavao del SurPangasinanKalingaIloilo
CatanduanesCapiz
Ifugao
Palawan
South Cotabato
BasilanCebuMisamis OrientalLa UnionZamboanga del SurNueva EcijaNegros OccidentalQuezonOriental MindoroNorth CotabatoDavao del Norte
LeyteAgusan del NorteBiliranMarinduqueOccidental MindoroCompostela ValleySiquijorTawi-TawiAntiqueSorsogonBukidnon
Negros Oriental
Camarines NorteApayaoSouthern Leyte
Albay
AbraSultan Kudarat
Camiguin
Lanao del Sur
Surigao del SurSamarLanao del Norte
Mt. Province
Misamis OccidentalSuluAklanCamarines SurBoholZamboanga SibugayNorthern SamarSarangani
Davao Oriental
MaguindanaoEastern SamarRomblonMasbateSurigao del NorteAgusan del Sur
Zamboanga Norte
050
100
150
200
KATA
S N
G V
AT P
ER C
APIT
A
0 .2 .4 .6poverty incidence
Fitted values KATAS NG VAT PER CAPITA
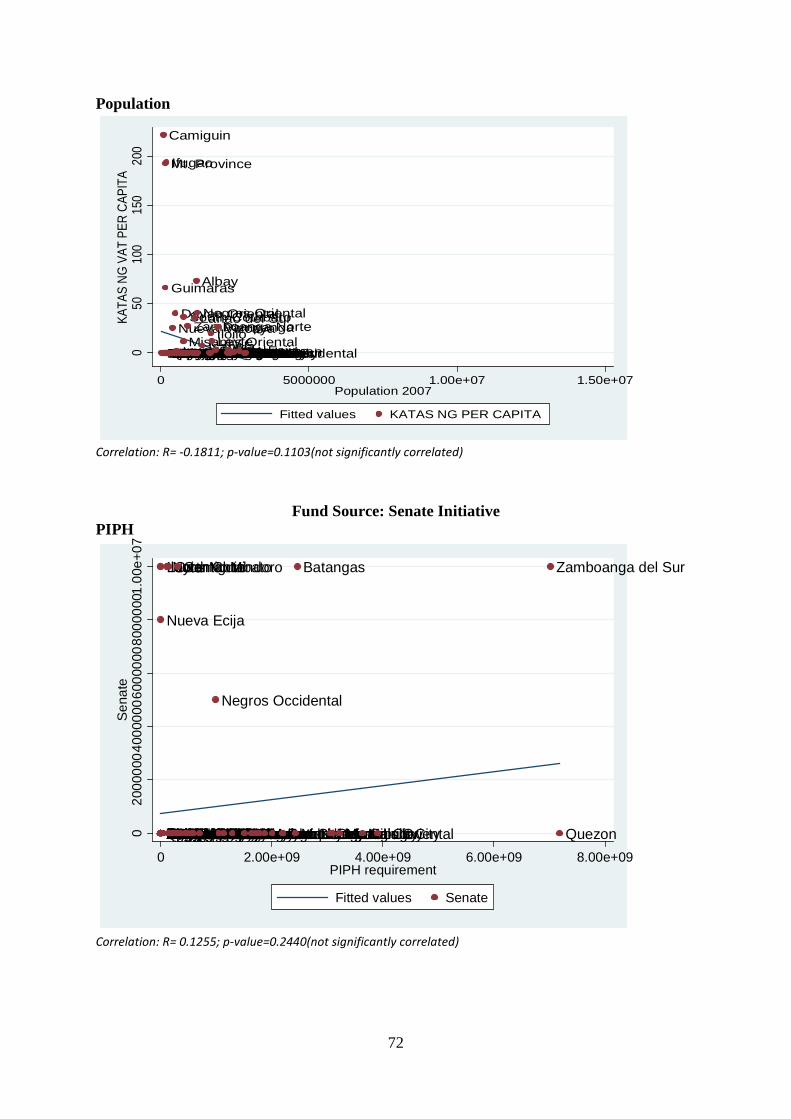
72
Population
Correlation: R= -0.1811; p-value=0.1103(not significantly correlated)
Fund Source: Senate Initiative
PIPH
Correlation: R= 0.1255; p-value=0.2440(not significantly correlated)
Batanes
Camiguin
SiquijorApayao
Mt. Province
Biliran
Guimaras
Quirino
Ifugao
KalingaAuroraMarinduqueAbraCatanduanesRomblonAgusan del NorteBenguetSouthern Leyte
Nueva Vizcaya
Eastern SamarBasilanSurigao del NorteOccidental MindoroTawi-TawiSarangani
Davao Oriental
ZambalesAklanCamarines NorteAntiqueMisamis OccidentalLanao del NorteSurigao del SurZamboanga SibugayIlocos NorteNorthern SamarAgusan del SurIlocos SurCompostela ValleyBataanSultan KudaratPalawanSamarCapizSorsogonMaguindanaoLa UnionOriental MindoroMisamis Oriental
South Cotabato
MasbateDavao del SurDavao del NorteSulu
Zamboanga Norte
Zamboanga del SurCagayanNorth Cotabato
Lanao del Sur
Bukidnon
Albay
Bohol
Negros Oriental
TarlacIsabelaQuezonIloiloCamarines SurLeyteNueva Ecija
Pampanga
BatangasRizalNegros OccidentalCebuLagunaPangasinanBulacanCavite050
100
150
200
KATA
S NG
VAT
PER
CAP
ITA
0 5000000 1.00e+07 1.50e+07Population 2007
Fitted values KATAS NG PER CAPITA
MasbateNegros OrientalApayaoDavao del NorteDavao OrientalNorthern SamarBataanAgusan del NorteAuroraSaranganiCatanduanes
Nueva Ecija
KalingaKalookan CityQuezon CityIlocos Sur
Ilocos Norte
SorsogonDavao del SurPangasinanSamarCompostela ValleySiquijorTarlacAlbay
Leyte
ZambalesLas Pinas CityPampangaParanaque CityCamarines NorteBenguetSouthern LeyteSurigao del SurSurigao del NorteLa UnionBulacanAbraBoholMt. ProvinceIfugaoSultan KudaratCamarines SurGuimarasRomblon
North Cotabato
South Cotabato
Oriental Mindoro
Agusan del SurMisamis OccidentalMarikina CityBiliranMarinduqueSan Juan
Camiguin
ValenzuelaOccidental MindoroPaterosEastern SamarQuirinoCapizMalabonTaguigPasig CityPalawanNueva Vizcaya
Negros Occidental
AklanBukidnonZamboanga NorteBatanesCagayanRizalCaviteMakati CityLanao del NorteZamboanga SibugayAntiqueMandaluyong City
Batangas
CebuIsabelaLagunaMisamis OrientalManila CityIloilo
Zamboanga del Sur
Quezon020
0000
0400
0000
6000
0008
0000
001.
00e+
07S
enat
e
0 2.00e+09 4.00e+09 6.00e+09 8.00e+09PIPH requirement
Fitted values Senate
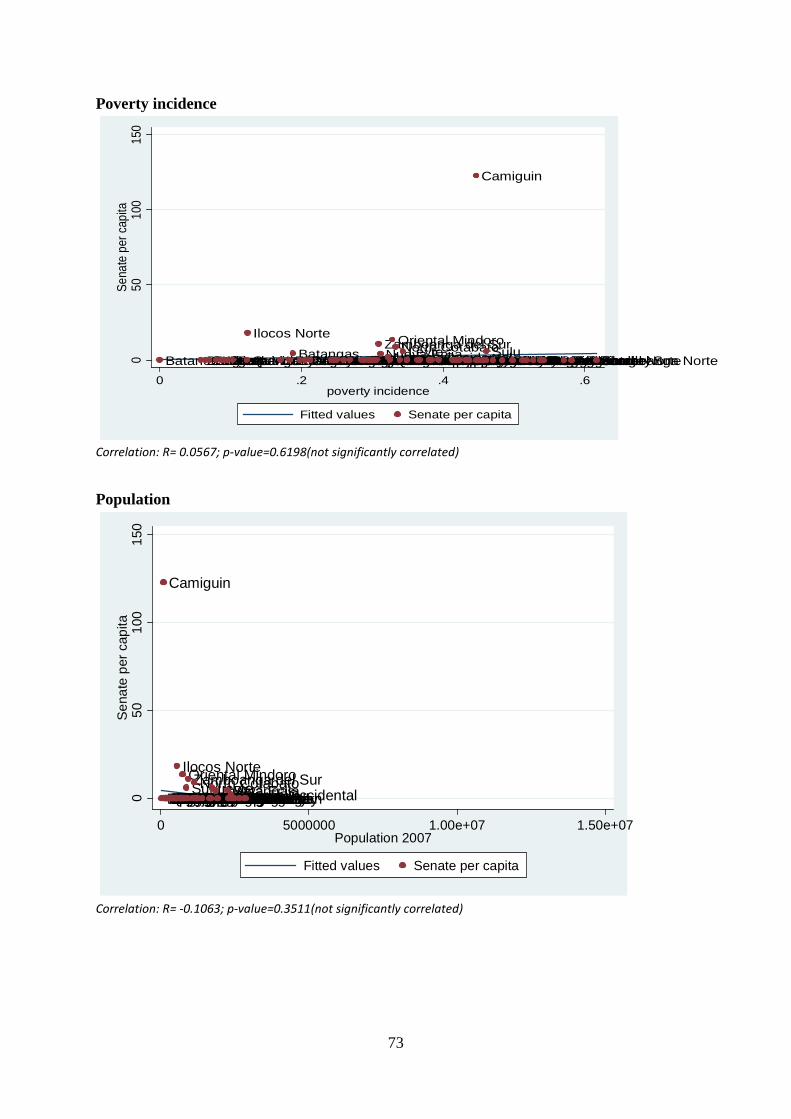
73
Poverty incidence
Correlation: R= 0.0567; p-value=0.6198(not significantly correlated) Population
Correlation: R= -0.1063; p-value=0.3511(not significantly correlated)
BatanesBenguetCaviteBulacanLagunaNueva VizcayaPampangaRizalBataanQuirino
Ilocos Norte
Ilocos SurZambalesBatangasTarlacGuimarasCagayanIsabelaAuroraDavao del SurPangasinanKalingaIloiloCatanduanesCapizIfugaoPalawanSouth CotabatoBasilanCebuMisamis OrientalLa UnionZamboanga del SurNueva EcijaNegros OccidentalQuezon
Oriental MindoroNorth CotabatoDavao del NorteLeyteBiliranMarinduqueAgusan del NorteOccidental MindoroCompostela ValleySiquijorTawi-TawiAntiqueSorsogonBukidnonNegros OrientalCamarines NorteApayaoSouthern LeyteAlbayAbra
Camiguin
Sultan KudaratLanao del SurSurigao del SurSamarLanao del NorteMt. ProvinceMisamis OccidentalAklanSuluCamarines SurBoholZamboanga SibugayNorthern SamarSaranganiDavao OrientalMaguindanaoRomblonEastern SamarMasbateSurigao del NorteAgusan del SurZamboanga Norte0
5010
015
0Se
nate
per
cap
ita
0 .2 .4 .6poverty incidence
Fitted values Senate per capita
Batanes
Camiguin
SiquijorApayaoMt. ProvinceBiliranGuimarasQuirinoIfugaoKalingaAuroraMarinduqueAbraCatanduanesRomblonAgusan del NorteBenguetSouthern LeyteNueva VizcayaEastern SamarBasilanSurigao del NorteOccidental MindoroTawi-TawiSaranganiDavao OrientalZambalesAklanCamarines NorteAntiqueMisamis OccidentalLanao del NorteSurigao del SurZamboanga Sibugay
Ilocos Norte
Northern SamarAgusan del SurIlocos SurCompostela ValleyBataanSultan KudaratPalawanSamarCapizSorsogonMaguindanaoLa UnionOriental MindoroMisamis OrientalSouth CotabatoMasbateDavao del SurDavao del NorteSuluZamboanga NorteZamboanga del SurCagayanNorth CotabatoLanao del SurBukidnonAlbayBoholNegros OrientalTarlacIsabelaQuezonIloiloCamarines Sur
LeyteNueva EcijaPampangaBatangasRizalNegros OccidentalCebuLagunaPangasinanBulacanCavite050
100
150
Sen
ate
per c
apita
0 5000000 1.00e+07 1.50e+07Population 2007
Fitted values Senate per capita
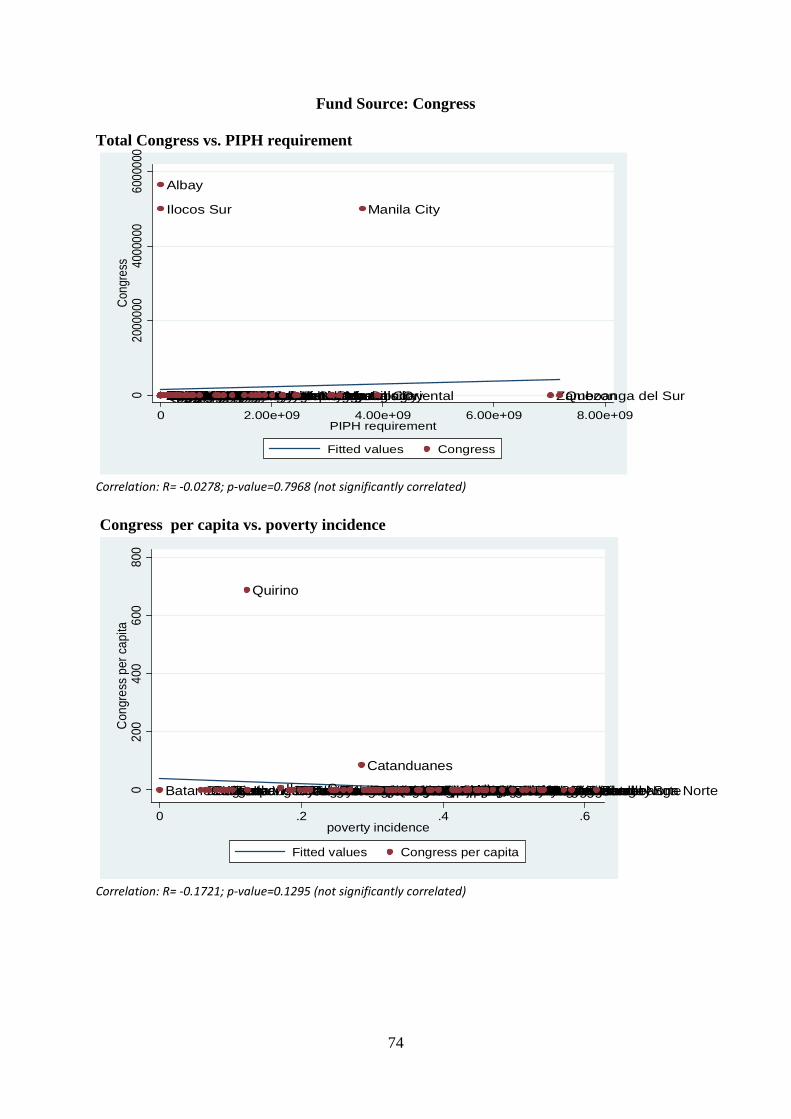
74
Fund Source: Congress Total Congress vs. PIPH requirement
Correlation: R= -0.0278; p-value=0.7968 (not significantly correlated)
Congress per capita vs. poverty incidence
Correlation: R= -0.1721; p-value=0.1295 (not significantly correlated)
Ilocos Sur
BenguetIfugaoLa UnionLas Pinas CityKalookan CityDavao del SurCamarines NorteMt. ProvinceNegros OrientalLeyteNueva EcijaTarlacBoholBulacanMasbateCamarines Sur
Albay
Sultan KudaratSaranganiAuroraDavao del NorteQuezon CityAgusan del NorteSorsogonSouthern LeyteNorthern SamarSiquijorIlocos NorteSurigao del SurBataanPangasinanZambalesKalingaParanaque CityPampangaCompostela ValleyDavao OrientalSamarSurigao del NorteAbraApayaoGuimarasRomblonNorth CotabatoSouth CotabatoOriental MindoroAgusan del SurMisamis OccidentalMarikina CityBiliranMarinduqueSan JuanCamiguinValenzuelaOccidental MindoroPaterosEastern SamarCapizMalabonTaguigPasig CityPalawanNueva VizcayaNegros OccidentalAklanBukidnonZamboanga NorteBatanesCagayanRizalCaviteMakati CityLanao del NorteZamboanga SibugayAntiqueMandaluyong CityBatangasCebuIsabelaLagunaMisamis Oriental
Manila City
Iloilo Zamboanga del SurQuezon020
0000
040
0000
060
0000
0Co
ngre
ss
0 2.00e+09 4.00e+09 6.00e+09 8.00e+09PIPH requirement
Fitted values Congress
BatanesBenguetCaviteBulacanLagunaNueva VizcayaPampangaRizalBataan
Quirino
Ilocos NorteIlocos SurZambalesBatangasTarlacGuimarasCagayanIsabelaAuroraDavao del SurPangasinanKalingaIloilo
Catanduanes
CapizIfugaoSouth CotabatoPalawanBasilanCebuMisamis OrientalLa UnionZamboanga del SurNueva EcijaNegros OccidentalQuezonOriental MindoroNorth CotabatoDavao del NorteLeyteBiliranMarinduqueAgusan del NorteOccidental MindoroCompostela ValleySiquijorTawi-TawiAntiqueSorsogonBukidnonNegros OrientalCamarines NorteApayaoSouthern LeyteAlbayAbraCamiguinSultan KudaratLanao del SurSurigao del SurSamarLanao del NorteMisamis OccidentalMt. ProvinceSuluAklanCamarines SurBoholZamboanga SibugayNorthern SamarSaranganiDavao OrientalMaguindanaoRomblonEastern SamarMasbateSurigao del NorteAgusan del SurZamboanga Norte020
040
060
080
0C
ongr
ess
per c
apita
0 .2 .4 .6poverty incidence
Fitted values Congress per capita
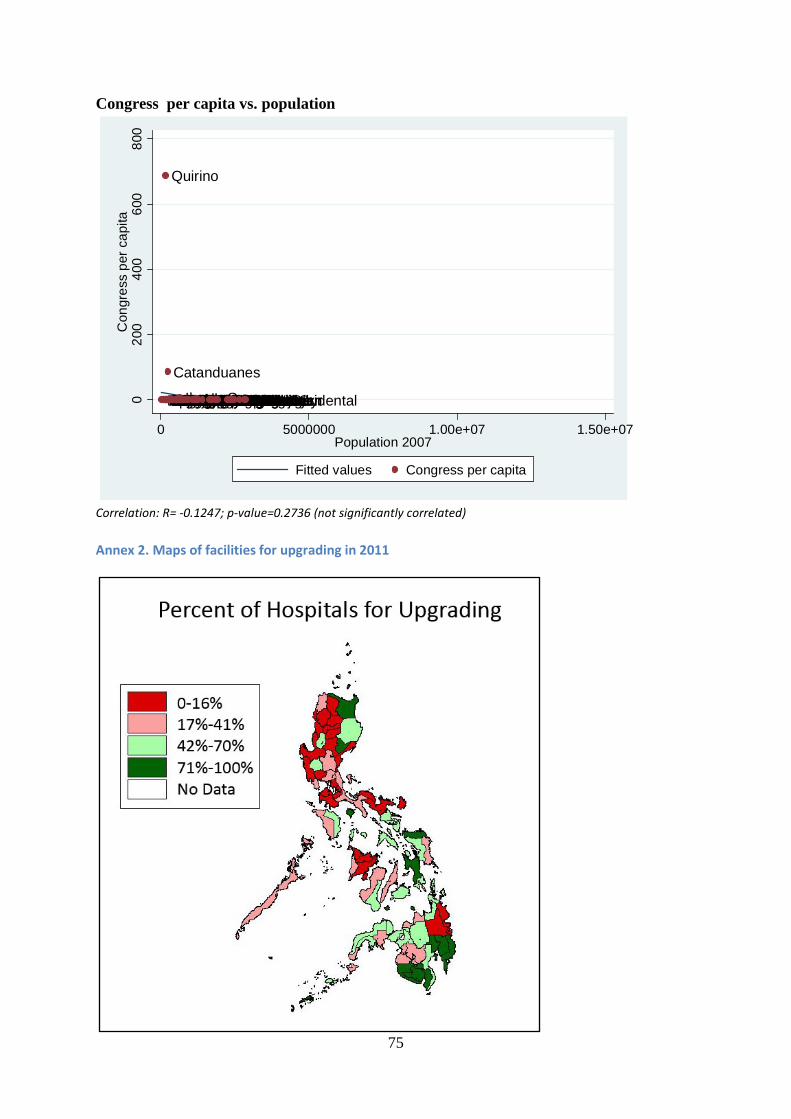
75
Congress per capita vs. population
Correlation: R= -0.1247; p-value=0.2736 (not significantly correlated)
Annex 2. Maps of facilities for upgrading in 2011
BatanesCamiguinSiquijorApayaoMt. ProvinceBiliranGuimaras
Quirino
IfugaoKalingaAuroraMarinduqueAbra
Catanduanes
RomblonAgusan del NorteBenguetSouthern LeyteNueva VizcayaEastern SamarBasilanSurigao del NorteOccidental MindoroTawi-TawiSaranganiDavao OrientalZambalesAklanCamarines NorteAntiqueMisamis OccidentalLanao del NorteSurigao del SurZamboanga SibugayIlocos NorteNorthern SamarAgusan del SurIlocos SurCompostela ValleyBataanSultan KudaratPalawanSamarCapizSorsogonMaguindanaoLa UnionOriental MindoroMisamis OrientalSouth CotabatoMasbateDavao del SurDavao del NorteSuluZamboanga NorteZamboanga del SurCagayanNorth CotabatoLanao del SurBukidnonAlbayBoholNegros OrientalTarlacIsabelaQuezonIloiloCamarines SurLeyteNueva EcijaPampangaBatangasRizalNegros OccidentalCebuLagunaPangasinanBulacanCavite020
040
060
080
0C
ongr
ess
per c
apita
0 5000000 1.00e+07 1.50e+07Population 2007
Fitted values Congress per capita
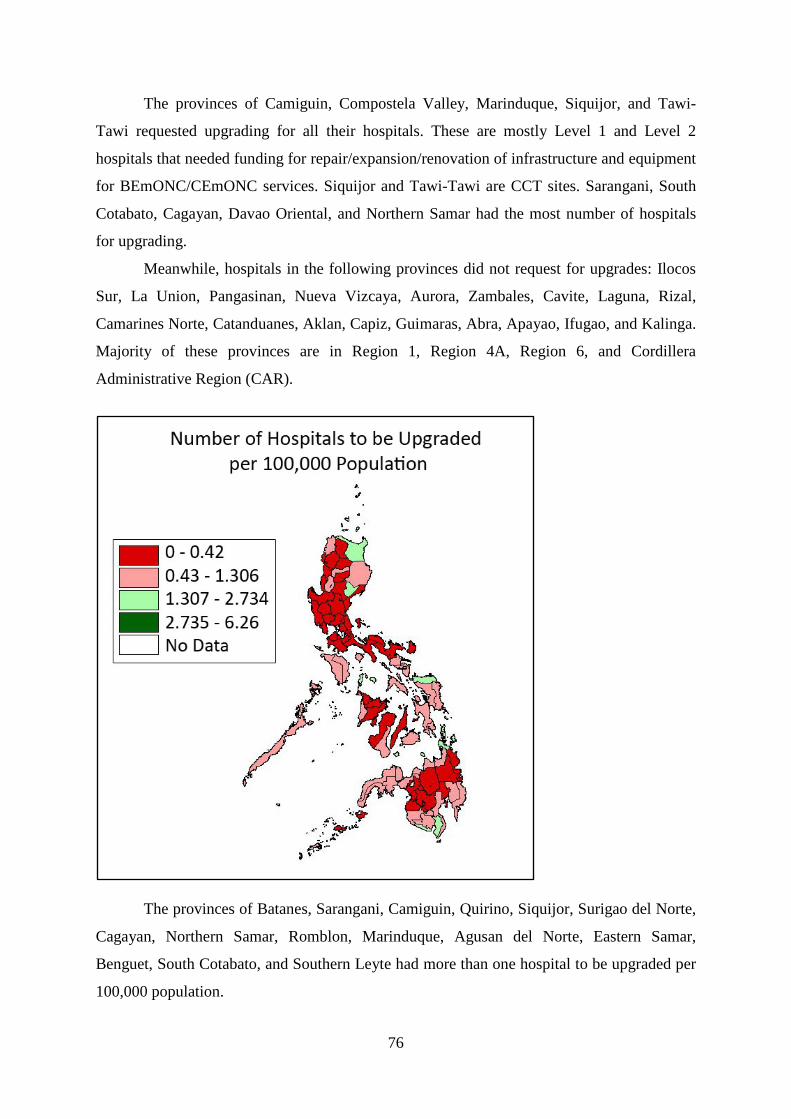
76
The provinces of Camiguin, Compostela Valley, Marinduque, Siquijor, and Tawi-
Tawi requested upgrading for all their hospitals. These are mostly Level 1 and Level 2
hospitals that needed funding for repair/expansion/renovation of infrastructure and equipment
for BEmONC/CEmONC services. Siquijor and Tawi-Tawi are CCT sites. Sarangani, South
Cotabato, Cagayan, Davao Oriental, and Northern Samar had the most number of hospitals
for upgrading.
Meanwhile, hospitals in the following provinces did not request for upgrades: Ilocos
Sur, La Union, Pangasinan, Nueva Vizcaya, Aurora, Zambales, Cavite, Laguna, Rizal,
Camarines Norte, Catanduanes, Aklan, Capiz, Guimaras, Abra, Apayao, Ifugao, and Kalinga.
Majority of these provinces are in Region 1, Region 4A, Region 6, and Cordillera
Administrative Region (CAR).
The provinces of Batanes, Sarangani, Camiguin, Quirino, Siquijor, Surigao del Norte,
Cagayan, Northern Samar, Romblon, Marinduque, Agusan del Norte, Eastern Samar,
Benguet, South Cotabato, and Southern Leyte had more than one hospital to be upgraded per
100,000 population.
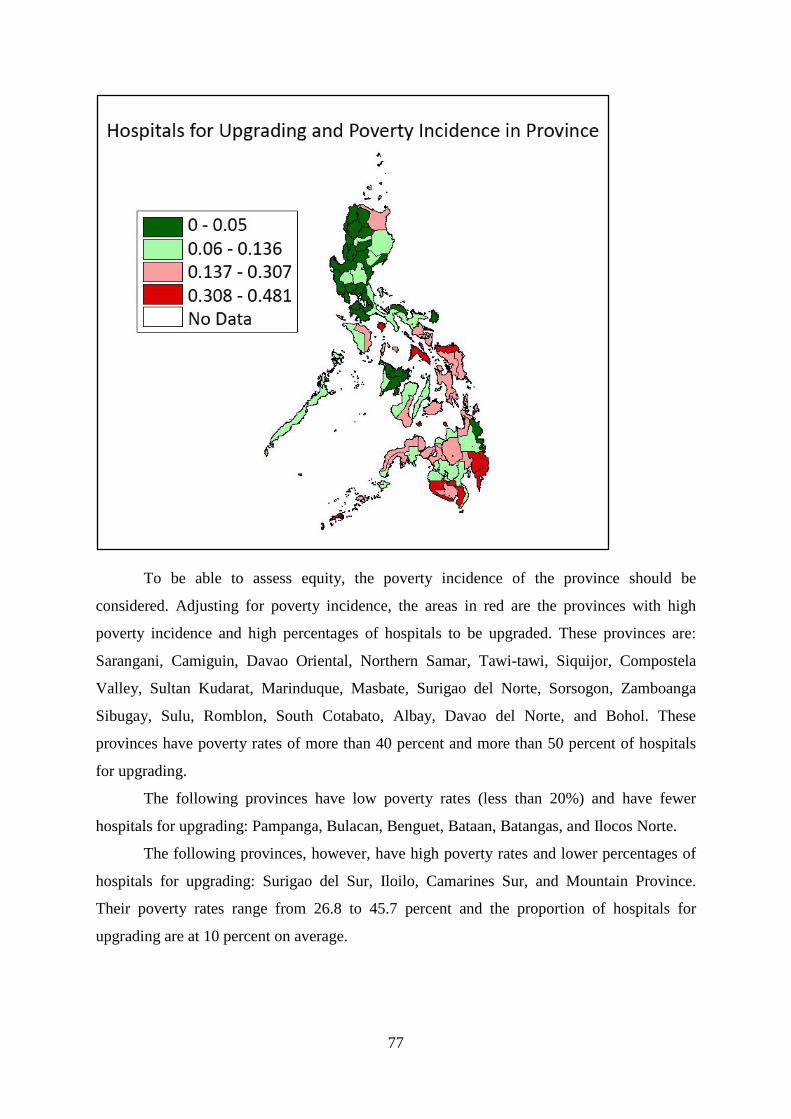
77
To be able to assess equity, the poverty incidence of the province should be
considered. Adjusting for poverty incidence, the areas in red are the provinces with high
poverty incidence and high percentages of hospitals to be upgraded. These provinces are:
Sarangani, Camiguin, Davao Oriental, Northern Samar, Tawi-tawi, Siquijor, Compostela
Valley, Sultan Kudarat, Marinduque, Masbate, Surigao del Norte, Sorsogon, Zamboanga
Sibugay, Sulu, Romblon, South Cotabato, Albay, Davao del Norte, and Bohol. These
provinces have poverty rates of more than 40 percent and more than 50 percent of hospitals
for upgrading.
The following provinces have low poverty rates (less than 20%) and have fewer
hospitals for upgrading: Pampanga, Bulacan, Benguet, Bataan, Batangas, and Ilocos Norte.
The following provinces, however, have high poverty rates and lower percentages of
hospitals for upgrading: Surigao del Sur, Iloilo, Camarines Sur, and Mountain Province.
Their poverty rates range from 26.8 to 45.7 percent and the proportion of hospitals for
upgrading are at 10 percent on average.
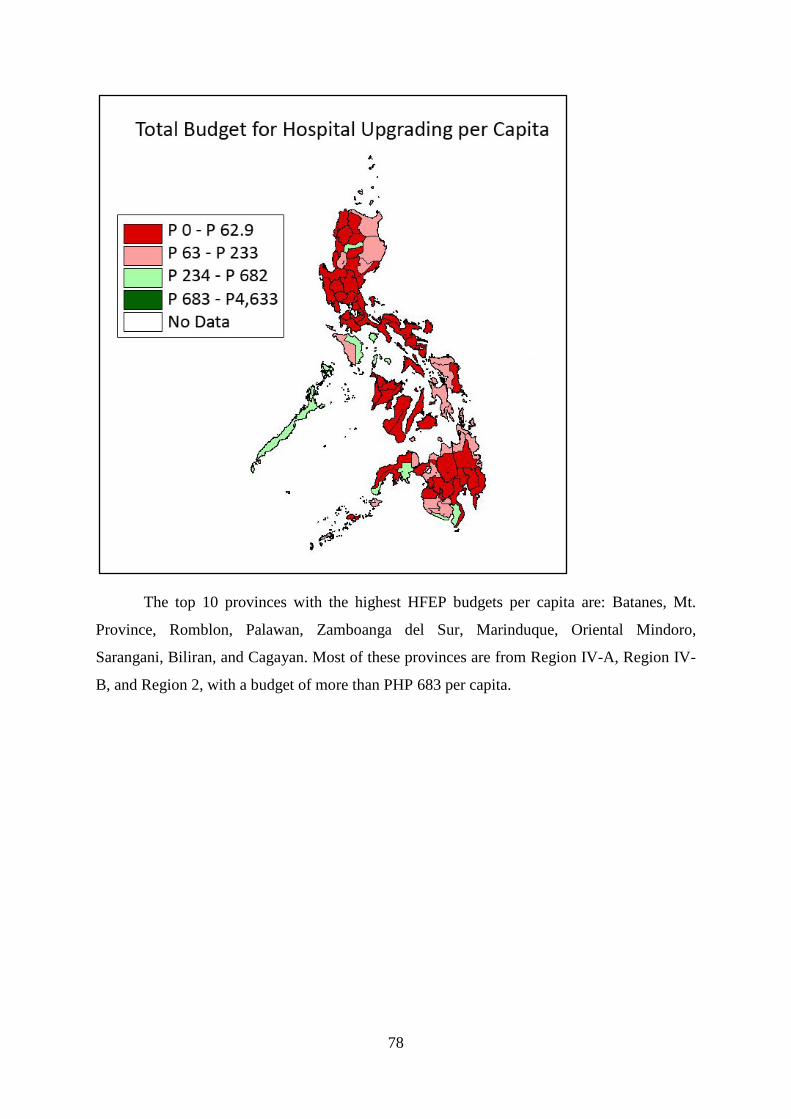
78
The top 10 provinces with the highest HFEP budgets per capita are: Batanes, Mt.
Province, Romblon, Palawan, Zamboanga del Sur, Marinduque, Oriental Mindoro,
Sarangani, Biliran, and Cagayan. Most of these provinces are from Region IV-A, Region IV-
B, and Region 2, with a budget of more than PHP 683 per capita.
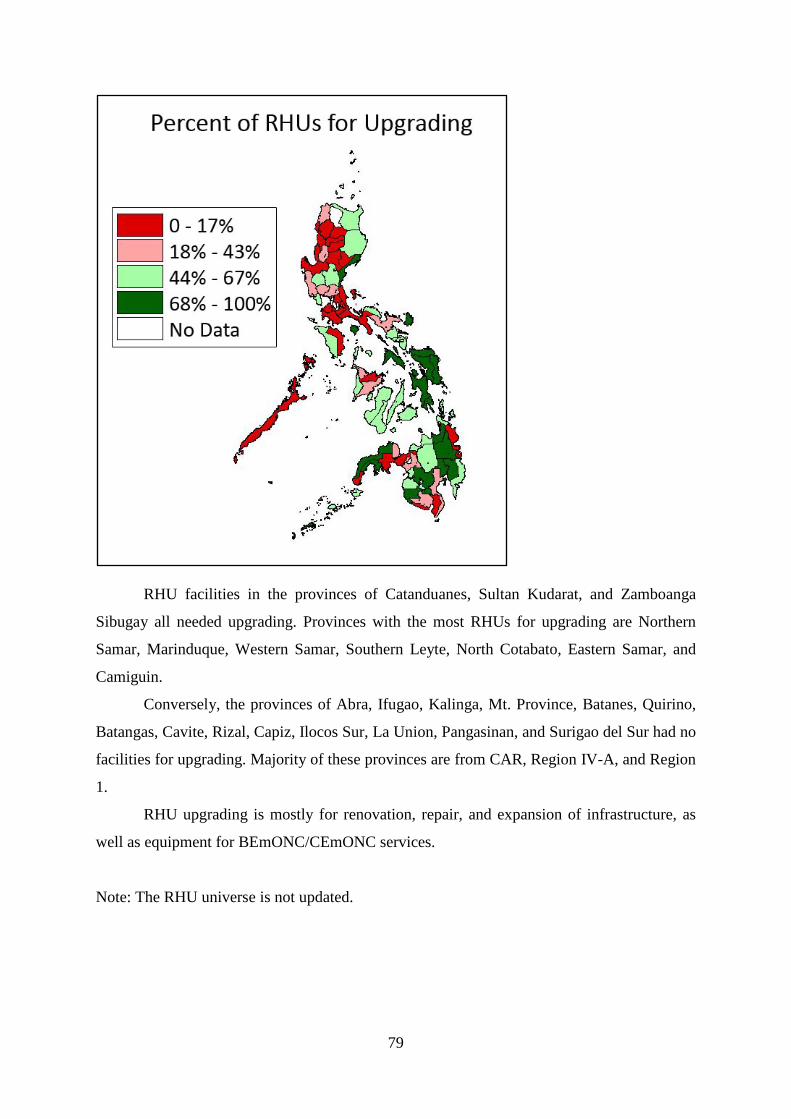
79
RHU facilities in the provinces of Catanduanes, Sultan Kudarat, and Zamboanga
Sibugay all needed upgrading. Provinces with the most RHUs for upgrading are Northern
Samar, Marinduque, Western Samar, Southern Leyte, North Cotabato, Eastern Samar, and
Camiguin.
Conversely, the provinces of Abra, Ifugao, Kalinga, Mt. Province, Batanes, Quirino,
Batangas, Cavite, Rizal, Capiz, Ilocos Sur, La Union, Pangasinan, and Surigao del Sur had no
facilities for upgrading. Majority of these provinces are from CAR, Region IV-A, and Region
1.
RHU upgrading is mostly for renovation, repair, and expansion of infrastructure, as
well as equipment for BEmONC/CEmONC services.
Note: The RHU universe is not updated.
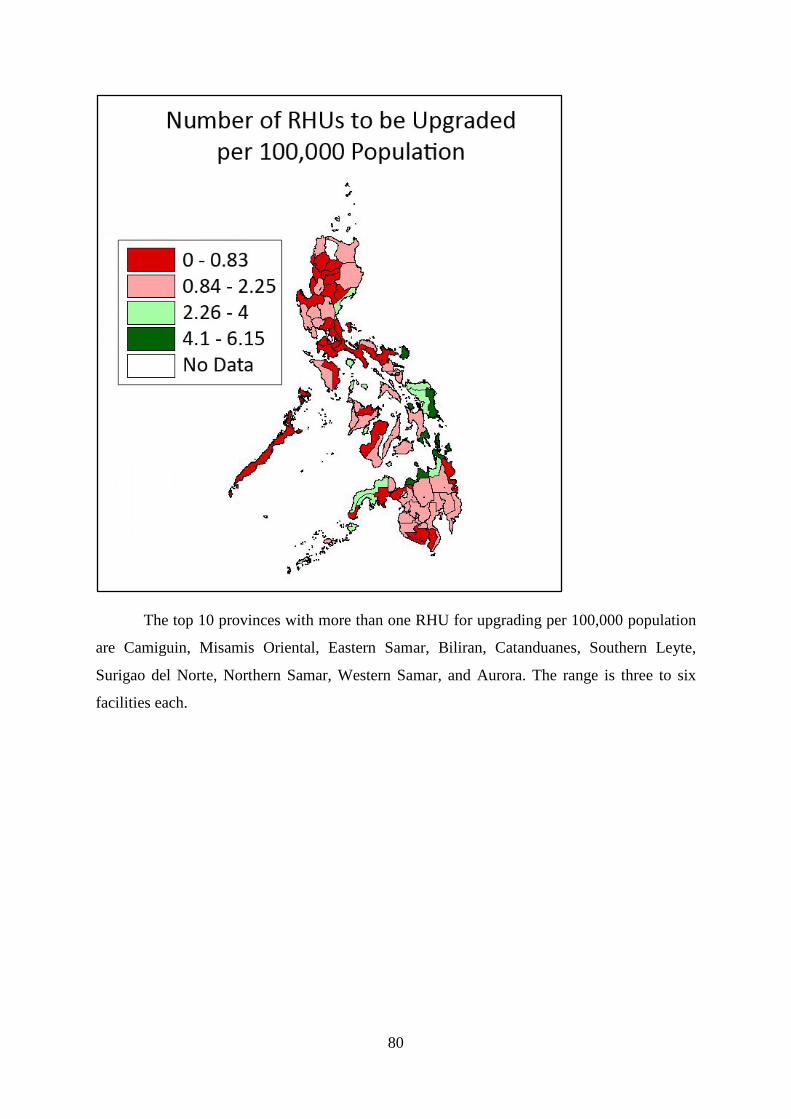
80
The top 10 provinces with more than one RHU for upgrading per 100,000 population
are Camiguin, Misamis Oriental, Eastern Samar, Biliran, Catanduanes, Southern Leyte,
Surigao del Norte, Northern Samar, Western Samar, and Aurora. The range is three to six
facilities each.
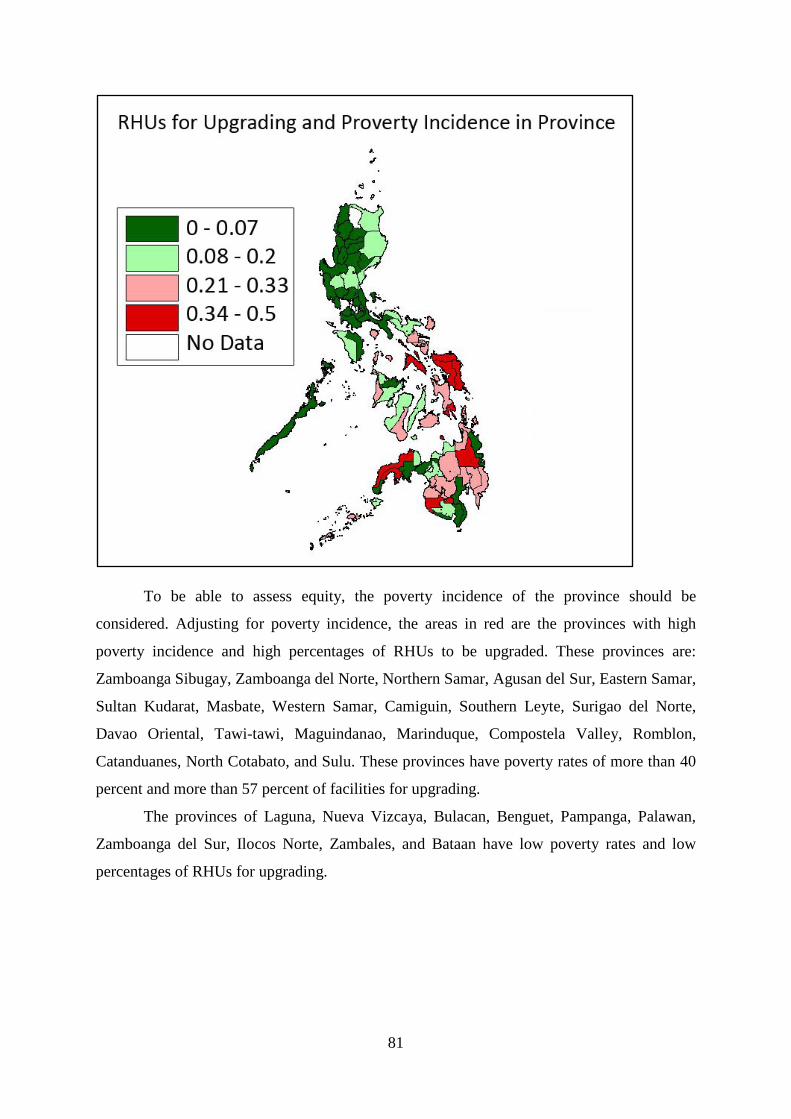
81
To be able to assess equity, the poverty incidence of the province should be
considered. Adjusting for poverty incidence, the areas in red are the provinces with high
poverty incidence and high percentages of RHUs to be upgraded. These provinces are:
Zamboanga Sibugay, Zamboanga del Norte, Northern Samar, Agusan del Sur, Eastern Samar,
Sultan Kudarat, Masbate, Western Samar, Camiguin, Southern Leyte, Surigao del Norte,
Davao Oriental, Tawi-tawi, Maguindanao, Marinduque, Compostela Valley, Romblon,
Catanduanes, North Cotabato, and Sulu. These provinces have poverty rates of more than 40
percent and more than 57 percent of facilities for upgrading.
The provinces of Laguna, Nueva Vizcaya, Bulacan, Benguet, Pampanga, Palawan,
Zamboanga del Sur, Ilocos Norte, Zambales, and Bataan have low poverty rates and low
percentages of RHUs for upgrading.
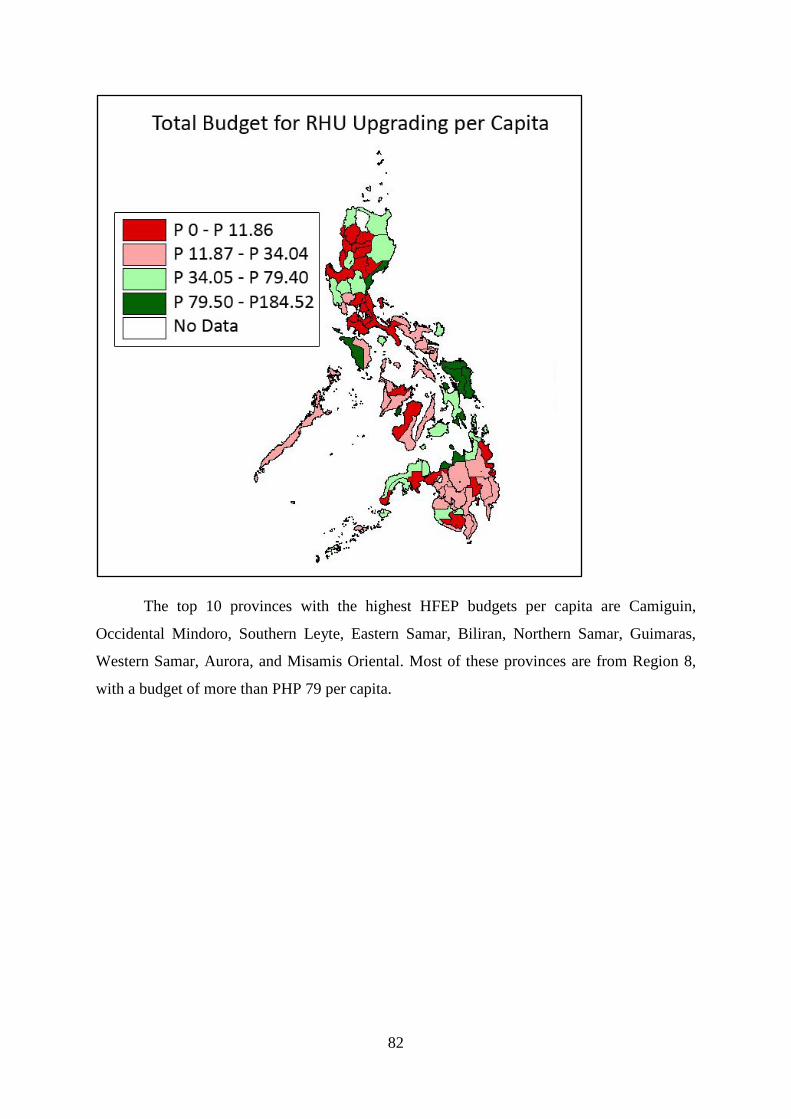
82
The top 10 provinces with the highest HFEP budgets per capita are Camiguin,
Occidental Mindoro, Southern Leyte, Eastern Samar, Biliran, Northern Samar, Guimaras,
Western Samar, Aurora, and Misamis Oriental. Most of these provinces are from Region 8,
with a budget of more than PHP 79 per capita.
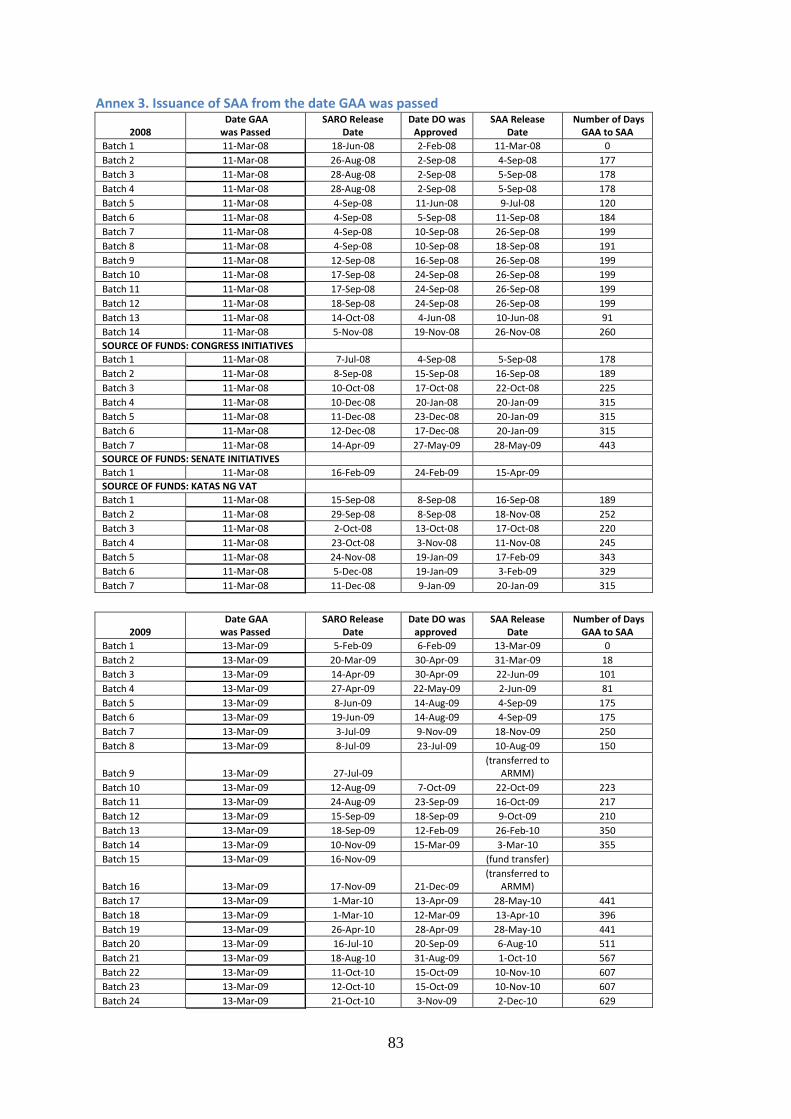
83
Annex 3. Issuance of SAA from the date GAA was passed
2008 Date GAA was Passed
SARO Release Date
Date DO was Approved
SAA Release Date
Number of Days GAA to SAA
Batch 1 11-Mar-08 18-Jun-08 2-Feb-08 11-Mar-08 0 Batch 2 11-Mar-08 26-Aug-08 2-Sep-08 4-Sep-08 177 Batch 3 11-Mar-08 28-Aug-08 2-Sep-08 5-Sep-08 178 Batch 4 11-Mar-08 28-Aug-08 2-Sep-08 5-Sep-08 178 Batch 5 11-Mar-08 4-Sep-08 11-Jun-08 9-Jul-08 120 Batch 6 11-Mar-08 4-Sep-08 5-Sep-08 11-Sep-08 184 Batch 7 11-Mar-08 4-Sep-08 10-Sep-08 26-Sep-08 199 Batch 8 11-Mar-08 4-Sep-08 10-Sep-08 18-Sep-08 191 Batch 9 11-Mar-08 12-Sep-08 16-Sep-08 26-Sep-08 199 Batch 10 11-Mar-08 17-Sep-08 24-Sep-08 26-Sep-08 199 Batch 11 11-Mar-08 17-Sep-08 24-Sep-08 26-Sep-08 199 Batch 12 11-Mar-08 18-Sep-08 24-Sep-08 26-Sep-08 199 Batch 13 11-Mar-08 14-Oct-08 4-Jun-08 10-Jun-08 91 Batch 14 11-Mar-08 5-Nov-08 19-Nov-08 26-Nov-08 260 SOURCE OF FUNDS: CONGRESS INITIATIVES Batch 1 11-Mar-08 7-Jul-08 4-Sep-08 5-Sep-08 178 Batch 2 11-Mar-08 8-Sep-08 15-Sep-08 16-Sep-08 189 Batch 3 11-Mar-08 10-Oct-08 17-Oct-08 22-Oct-08 225 Batch 4 11-Mar-08 10-Dec-08 20-Jan-08 20-Jan-09 315 Batch 5 11-Mar-08 11-Dec-08 23-Dec-08 20-Jan-09 315 Batch 6 11-Mar-08 12-Dec-08 17-Dec-08 20-Jan-09 315 Batch 7 11-Mar-08 14-Apr-09 27-May-09 28-May-09 443 SOURCE OF FUNDS: SENATE INITIATIVES Batch 1 11-Mar-08 16-Feb-09 24-Feb-09 15-Apr-09 SOURCE OF FUNDS: KATAS NG VAT Batch 1 11-Mar-08 15-Sep-08 8-Sep-08 16-Sep-08 189 Batch 2 11-Mar-08 29-Sep-08 8-Sep-08 18-Nov-08 252 Batch 3 11-Mar-08 2-Oct-08 13-Oct-08 17-Oct-08 220 Batch 4 11-Mar-08 23-Oct-08 3-Nov-08 11-Nov-08 245 Batch 5 11-Mar-08 24-Nov-08 19-Jan-09 17-Feb-09 343 Batch 6 11-Mar-08 5-Dec-08 19-Jan-09 3-Feb-09 329 Batch 7 11-Mar-08 11-Dec-08 9-Jan-09 20-Jan-09 315
2009 Date GAA was Passed
SARO Release Date
Date DO was approved
SAA Release Date
Number of Days GAA to SAA
Batch 1 13-Mar-09 5-Feb-09 6-Feb-09 13-Mar-09 0 Batch 2 13-Mar-09 20-Mar-09 30-Apr-09 31-Mar-09 18 Batch 3 13-Mar-09 14-Apr-09 30-Apr-09 22-Jun-09 101 Batch 4 13-Mar-09 27-Apr-09 22-May-09 2-Jun-09 81 Batch 5 13-Mar-09 8-Jun-09 14-Aug-09 4-Sep-09 175 Batch 6 13-Mar-09 19-Jun-09 14-Aug-09 4-Sep-09 175 Batch 7 13-Mar-09 3-Jul-09 9-Nov-09 18-Nov-09 250 Batch 8 13-Mar-09 8-Jul-09 23-Jul-09 10-Aug-09 150
Batch 9 13-Mar-09 27-Jul-09 (transferred to
ARMM) Batch 10 13-Mar-09 12-Aug-09 7-Oct-09 22-Oct-09 223 Batch 11 13-Mar-09 24-Aug-09 23-Sep-09 16-Oct-09 217 Batch 12 13-Mar-09 15-Sep-09 18-Sep-09 9-Oct-09 210 Batch 13 13-Mar-09 18-Sep-09 12-Feb-09 26-Feb-10 350 Batch 14 13-Mar-09 10-Nov-09 15-Mar-09 3-Mar-10 355 Batch 15 13-Mar-09 16-Nov-09 (fund transfer)
Batch 16 13-Mar-09 17-Nov-09 21-Dec-09 (transferred to
ARMM) Batch 17 13-Mar-09 1-Mar-10 13-Apr-09 28-May-10 441 Batch 18 13-Mar-09 1-Mar-10 12-Mar-09 13-Apr-10 396 Batch 19 13-Mar-09 26-Apr-10 28-Apr-09 28-May-10 441 Batch 20 13-Mar-09 16-Jul-10 20-Sep-09 6-Aug-10 511 Batch 21 13-Mar-09 18-Aug-10 31-Aug-09 1-Oct-10 567 Batch 22 13-Mar-09 11-Oct-10 15-Oct-09 10-Nov-10 607 Batch 23 13-Mar-09 12-Oct-10 15-Oct-09 10-Nov-10 607 Batch 24 13-Mar-09 21-Oct-10 3-Nov-09 2-Dec-10 629
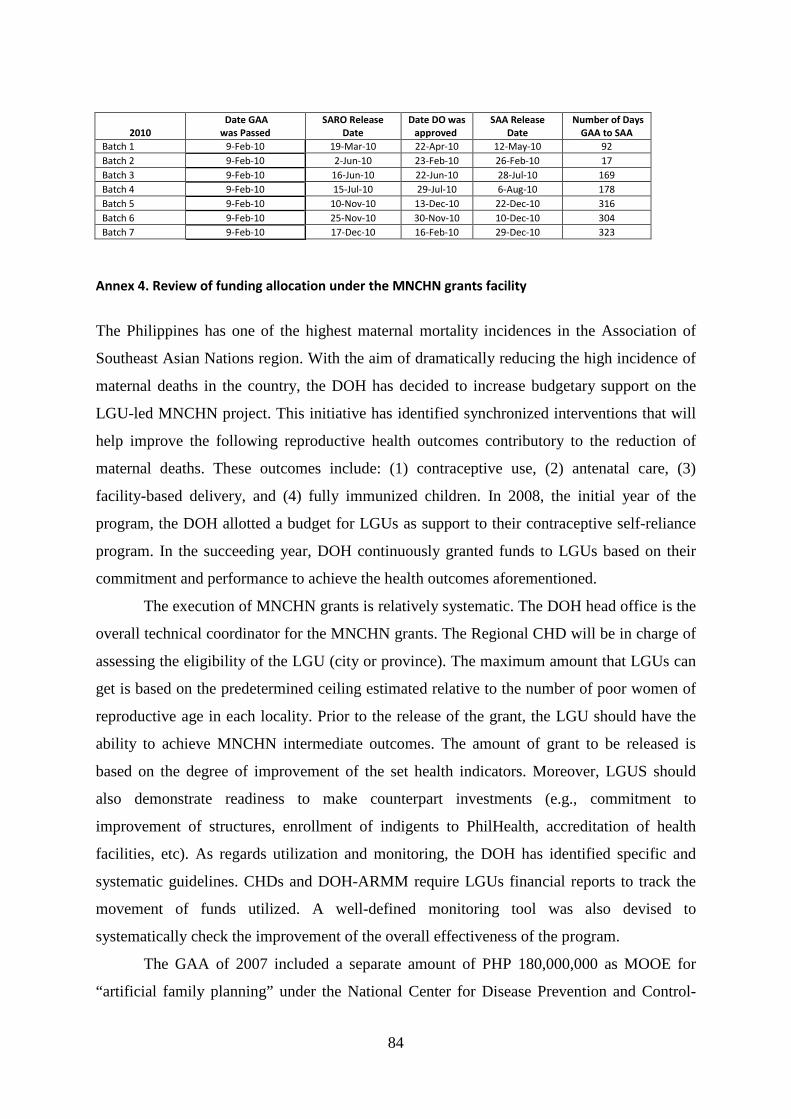
84
2010 Date GAA was Passed
SARO Release Date
Date DO was approved
SAA Release Date
Number of Days GAA to SAA
Batch 1 9-Feb-10 19-Mar-10 22-Apr-10 12-May-10 92 Batch 2 9-Feb-10 2-Jun-10 23-Feb-10 26-Feb-10 17 Batch 3 9-Feb-10 16-Jun-10 22-Jun-10 28-Jul-10 169 Batch 4 9-Feb-10 15-Jul-10 29-Jul-10 6-Aug-10 178 Batch 5 9-Feb-10 10-Nov-10 13-Dec-10 22-Dec-10 316 Batch 6 9-Feb-10 25-Nov-10 30-Nov-10 10-Dec-10 304 Batch 7 9-Feb-10 17-Dec-10 16-Feb-10 29-Dec-10 323
Annex 4. Review of funding allocation under the MNCHN grants facility
The Philippines has one of the highest maternal mortality incidences in the Association of
Southeast Asian Nations region. With the aim of dramatically reducing the high incidence of
maternal deaths in the country, the DOH has decided to increase budgetary support on the
LGU-led MNCHN project. This initiative has identified synchronized interventions that will
help improve the following reproductive health outcomes contributory to the reduction of
maternal deaths. These outcomes include: (1) contraceptive use, (2) antenatal care, (3)
facility-based delivery, and (4) fully immunized children. In 2008, the initial year of the
program, the DOH allotted a budget for LGUs as support to their contraceptive self-reliance
program. In the succeeding year, DOH continuously granted funds to LGUs based on their
commitment and performance to achieve the health outcomes aforementioned.
The execution of MNCHN grants is relatively systematic. The DOH head office is the
overall technical coordinator for the MNCHN grants. The Regional CHD will be in charge of
assessing the eligibility of the LGU (city or province). The maximum amount that LGUs can
get is based on the predetermined ceiling estimated relative to the number of poor women of
reproductive age in each locality. Prior to the release of the grant, the LGU should have the
ability to achieve MNCHN intermediate outcomes. The amount of grant to be released is
based on the degree of improvement of the set health indicators. Moreover, LGUS should
also demonstrate readiness to make counterpart investments (e.g., commitment to
improvement of structures, enrollment of indigents to PhilHealth, accreditation of health
facilities, etc). As regards utilization and monitoring, the DOH has identified specific and
systematic guidelines. CHDs and DOH-ARMM require LGUs financial reports to track the
movement of funds utilized. A well-defined monitoring tool was also devised to
systematically check the improvement of the overall effectiveness of the program.
The GAA of 2007 included a separate amount of PHP 180,000,000 as MOOE for
“artificial family planning” under the National Center for Disease Prevention and Control-
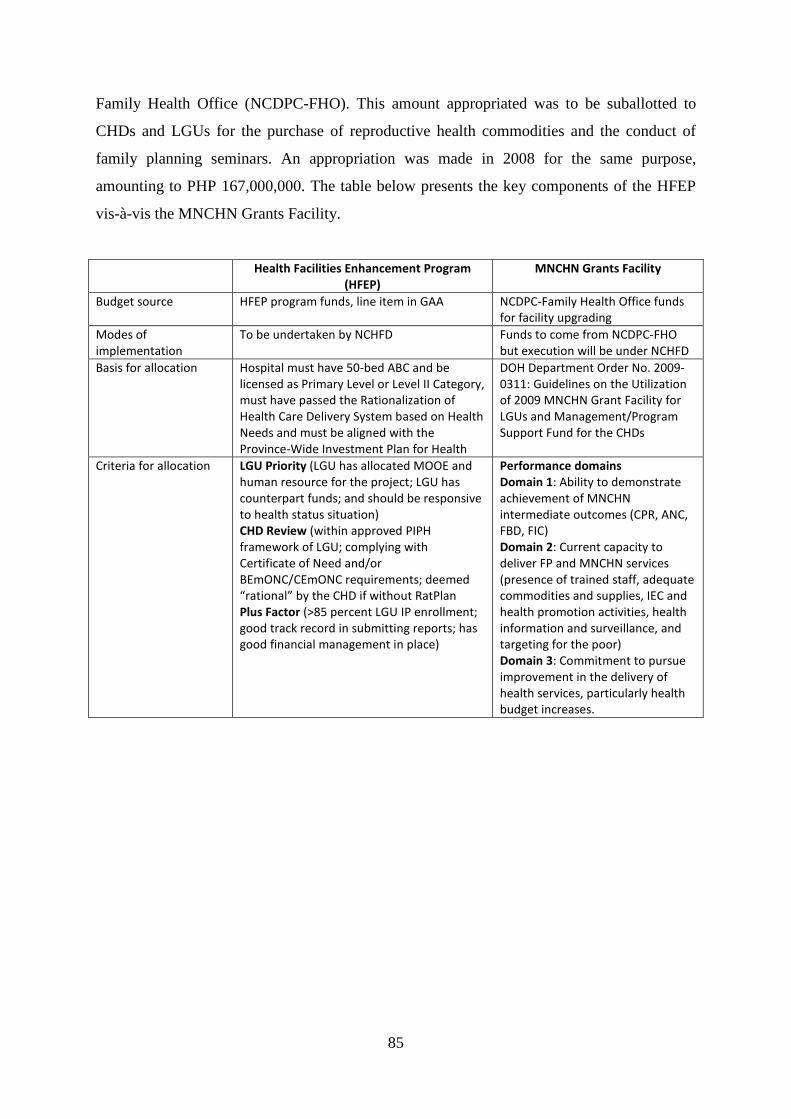
85
Family Health Office (NCDPC-FHO). This amount appropriated was to be suballotted to
CHDs and LGUs for the purchase of reproductive health commodities and the conduct of
family planning seminars. An appropriation was made in 2008 for the same purpose,
amounting to PHP 167,000,000. The table below presents the key components of the HFEP
vis-à-vis the MNCHN Grants Facility.
Health Facilities Enhancement Program (HFEP)
MNCHN Grants Facility
Budget source HFEP program funds, line item in GAA NCDPC-Family Health Office funds for facility upgrading
Modes of implementation
To be undertaken by NCHFD Funds to come from NCDPC-FHO but execution will be under NCHFD
Basis for allocation Hospital must have 50-bed ABC and be licensed as Primary Level or Level II Category, must have passed the Rationalization of Health Care Delivery System based on Health Needs and must be aligned with the Province-Wide Investment Plan for Health
DOH Department Order No. 2009-0311: Guidelines on the Utilization of 2009 MNCHN Grant Facility for LGUs and Management/Program Support Fund for the CHDs
Criteria for allocation LGU Priority (LGU has allocated MOOE and human resource for the project; LGU has counterpart funds; and should be responsive to health status situation) CHD Review (within approved PIPH framework of LGU; complying with Certificate of Need and/or BEmONC/CEmONC requirements; deemed “rational” by the CHD if without RatPlan Plus Factor (>85 percent LGU IP enrollment; good track record in submitting reports; has good financial management in place)
Performance domains Domain 1: Ability to demonstrate achievement of MNCHN intermediate outcomes (CPR, ANC, FBD, FIC) Domain 2: Current capacity to deliver FP and MNCHN services (presence of trained staff, adequate commodities and supplies, IEC and health promotion activities, health information and surveillance, and targeting for the poor) Domain 3: Commitment to pursue improvement in the delivery of health services, particularly health budget increases.
Review of the Cheaper Medicines Program of the Philippines:
Botika ng Barangay, Botika ng Bayan, PHP100 Treatment Pack,
and the Role of PITC Pharma, Inc. in Government Drug
Procurement
Oscar F. Picazo1
Introduction
Objectives of the study
This study forms part of about a dozen assessments of specific policy and programmatic
interventions that the DBM commissioned to the Philippine Institute for Development
Studies (PIDS) in February 2011. The analyses were intended to be used as background
papers for the possible restructuring and budget allocations of these government programs.
This study aims to assess three discrete government programs designed to lower the
cost of medicines in the Philippines: the Botika ng Barangay (BnB), the Botika ng Bayan
(BNB), and the PHP100 treatment pack programs, and the mandate and role of the Philippine
International Trading Corp. (PITC) in these programs.
These interventions form part of a much broader Cheaper Medicines Program (CMP)
of the government which consists of a range of policies and regulations designed to lower the
cost of medicines and improve people’s access to them. In chronological order, the DOH has
formulated the following relevant CMP policies and regulations:
• The Generics Act of 1988 or RA 6675 aimed at promoting, requiring, and ensuring
adequate supply, distribution, use, and acceptance of drugs and medicines identified
by their generic names. Subsequently, the DOH issued the implementing guidelines
for the exclusive use of generic terminology in all prescriptions and orders in all
DOH hospitals (AO 169, s. 2004).
• Executive Order (EO) 49, s. 1993 directed the mandatory use of the Philippine
National Drug Formulary (PNDF) as the basis for the procurement of drug products
1 Research Consultant, PIDS. The research assistance provided by Ms. Leilani Bolong is appreciated.
87
by the government. AO 18, s. 2006 contained the implementing guidelines for the
PNDF system.
• RA 7581, the Price Act, mandated the DOH as the lead agency in identifying
essential drugs as basic necessities and monitoring their corresponding prices.
Following this law, DOH issued the guidelines for DOH-retained hospitals to engage
in wholesale procurement and distribution of essential drugs (AO 10, s. 2005); the
guidelines for drug consignment in government hospitals (AO 145, s. 2004); and the
revised policies and guidelines for the institutionalization and decentralization of the
DOH drug consignment system.
• AO 9, s. 2006 provided the guidelines for institutionalizing and strengthening the
Essential Drug Price Monitoring System; the use of the Drug Price Reference Index
as a guide to rational drug selection and drug prices; and the use of the Reference
Index as the basis for reimbursing drugs and medicines in hospital claims.
• Department Memorandum 98, s. 2004 provided the guidelines for enhancing the
informational transparency in the transactional visits of sales and medical
representatives in all DOH facilities.
• RA 9502 of 2008, the Cheaper Medicines Act, is intended to achieve universally
accessible and cheaper and quality medicines by pursuing an effective competition
policy in the pharmaceutical sector. The president subsequently issued an executive
order requiring maximum retail prices for a number of drugs.
• RA 9711 of 2008 created the Food and Drug Administration (FDA) from the former
Bureau of Food and Drugs (BFAD), and conferred upon it much broader regulatory
powers.
Scope and organization of the report
This study focuses only on the operations of the BnB, BNB, and PHP100 treatment pack
programs. It does not assess the much larger policies on parallel drug importation (PDI) and
the generics drugs law on which these programs depend. It also does not assess the impact of
the Government Mediated Retail Price (maximum retail price) of drugs and the subsequent
voluntary price reduction of pharmaceutical companies, done in the wake of the enactment of
the Cheaper Medicines Act. These issues require more intensive scrutiny beyond the scope of
this study.
88
The study involved a review of published and unpublished literature. Fortunately,
there already exists a wealth of data from studies produced in recent years, especially from
the Medicines Transparency (MeTA) coalition. No primary survey for this study was
involved. The study should not be viewed as an impact evaluation, but only a policy and
program review. The study also involved selected interviews with key informants in Metro
Manila. Due to time limitations, only a limited number of them were interviewed. No visits to
actual BnB, BNB, and PHP100 sites were made.
The report is organized as follows. This section provides the introduction. Section II
situates the assessment in the Philippine pharmaceutical context. Section III reviews the BnB
program, Section IV reviews the BNB program, Section V reviews the PHP100 treatment
pack program, and Section VI reviews the PITC Pharma system supporting government drug
procurement. Finally, Section VII reviews the mandate and performance of PITC in drug
procurement. The conclusions and operational recommendations are contained in the
respective sections, rather than pulled together in a separate section.
The report incorporates the comments of the DOH-NCPAM staff on an earlier version
of the study.
Pharmaceutical Sector Context
Overwhelming role of the private sector
Sales of pharmaceuticals in the Philippines are conservatively estimated at PHP 100 billion
annually, with 70 percent accounted for by multinational firms (Pabico 2006). According to
PHAP data (Ball 2010), about 80 percent of the sales are in drug stores, 10 percent in
hospitals, and 10 percent in other retail outlets. Out of total sales, 63 percent comes from a
major pharmaceutical chain, 17 percent from the combined sales of all other small
independent pharmacies, 7 percent from private hospitals, 2.5 percent from public hospitals,
10 percent from other private outlets, and 0.5 percent from other public outlets. Thus, the
private sector as a whole holds an inordinate share of the market (more than 90 percent),
while the public sector is a very minor financier and purchaser.
Drugs are a requirement for almost all modern health care. Drugs account for about
half of household health spending among Filipinos. Although pharmaceutical reimbursements
of the social health insurance program (PhilHealth) remain small relative to its members’
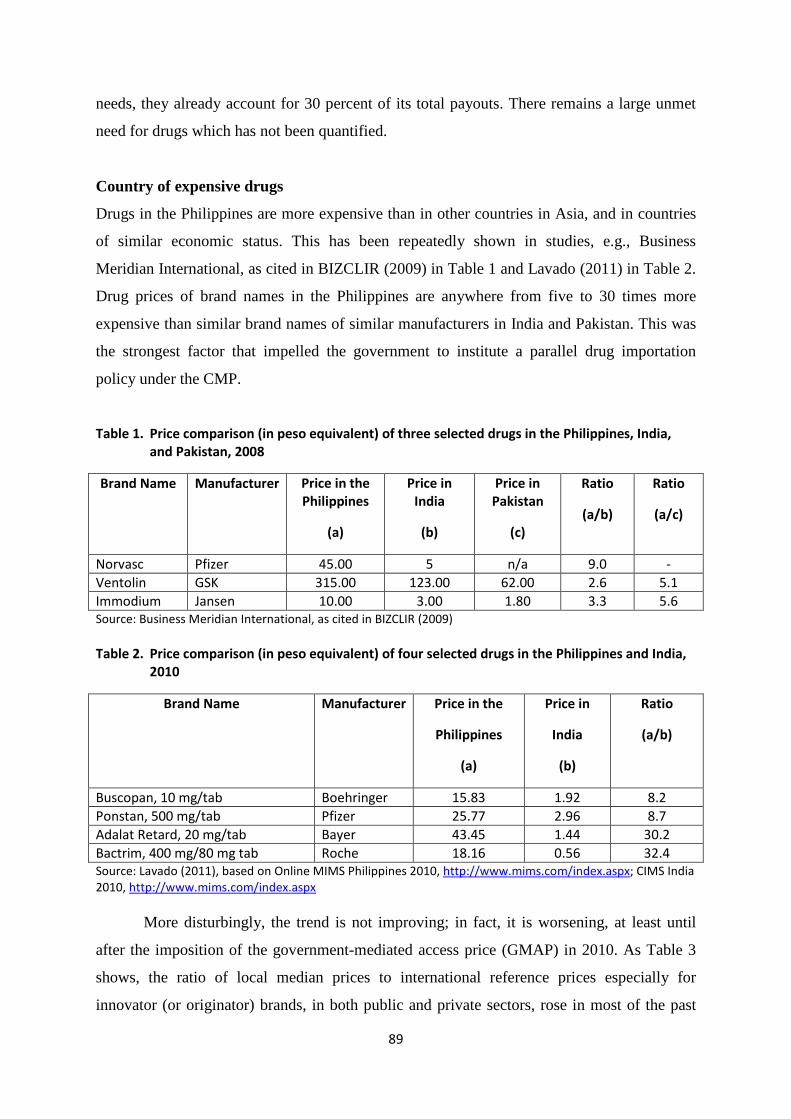
89
needs, they already account for 30 percent of its total payouts. There remains a large unmet
need for drugs which has not been quantified.
Country of expensive drugs
Drugs in the Philippines are more expensive than in other countries in Asia, and in countries
of similar economic status. This has been repeatedly shown in studies, e.g., Business
Meridian International, as cited in BIZCLIR (2009) in Table 1 and Lavado (2011) in Table 2.
Drug prices of brand names in the Philippines are anywhere from five to 30 times more
expensive than similar brand names of similar manufacturers in India and Pakistan. This was
the strongest factor that impelled the government to institute a parallel drug importation
policy under the CMP.
Table 1. Price comparison (in peso equivalent) of three selected drugs in the Philippines, India, and Pakistan, 2008
Brand Name Manufacturer Price in the Philippines
(a)
Price in India
(b)
Price in Pakistan
(c)
Ratio
(a/b)
Ratio
(a/c)
Norvasc Pfizer 45.00 5 n/a 9.0 - Ventolin GSK 315.00 123.00 62.00 2.6 5.1 Immodium Jansen 10.00 3.00 1.80 3.3 5.6 Source: Business Meridian International, as cited in BIZCLIR (2009) Table 2. Price comparison (in peso equivalent) of four selected drugs in the Philippines and India,
2010
Brand Name Manufacturer Price in the
Philippines
(a)
Price in
India
(b)
Ratio
(a/b)
Buscopan, 10 mg/tab Boehringer 15.83 1.92 8.2 Ponstan, 500 mg/tab Pfizer 25.77 2.96 8.7 Adalat Retard, 20 mg/tab Bayer 43.45 1.44 30.2 Bactrim, 400 mg/80 mg tab Roche 18.16 0.56 32.4 Source: Lavado (2011), based on Online MIMS Philippines 2010, http://www.mims.com/index.aspx; CIMS India 2010, http://www.mims.com/index.aspx
More disturbingly, the trend is not improving; in fact, it is worsening, at least until
after the imposition of the government-mediated access price (GMAP) in 2010. As Table 3
shows, the ratio of local median prices to international reference prices especially for
innovator (or originator) brands, in both public and private sectors, rose in most of the past
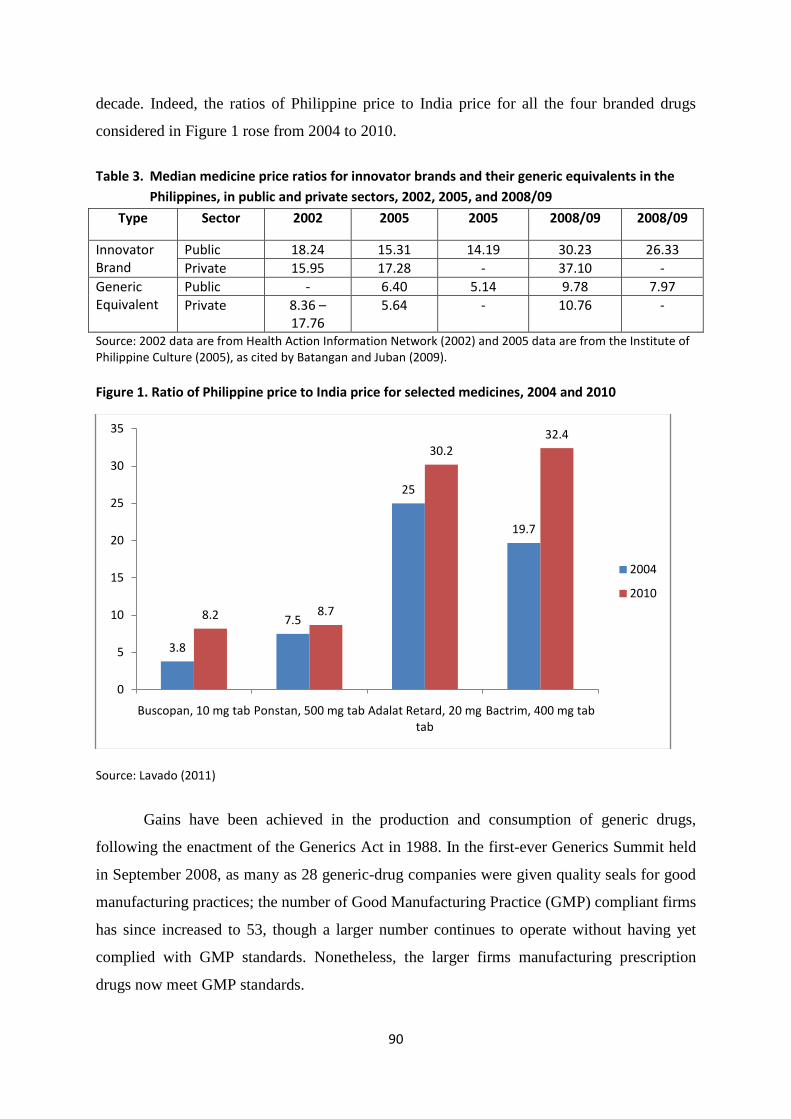
90
decade. Indeed, the ratios of Philippine price to India price for all the four branded drugs
considered in Figure 1 rose from 2004 to 2010.
Table 3. Median medicine price ratios for innovator brands and their generic equivalents in the
Philippines, in public and private sectors, 2002, 2005, and 2008/09
Type Sector 2002 2005 2005 2008/09 2008/09
Innovator Brand
Public 18.24 15.31 14.19 30.23 26.33 Private 15.95 17.28 - 37.10 -
Generic Equivalent
Public - 6.40 5.14 9.78 7.97 Private 8.36 –
17.76 5.64 - 10.76 -
Source: 2002 data are from Health Action Information Network (2002) and 2005 data are from the Institute of Philippine Culture (2005), as cited by Batangan and Juban (2009). Figure 1. Ratio of Philippine price to India price for selected medicines, 2004 and 2010
Source: Lavado (2011)
Gains have been achieved in the production and consumption of generic drugs,
following the enactment of the Generics Act in 1988. In the first-ever Generics Summit held
in September 2008, as many as 28 generic-drug companies were given quality seals for good
manufacturing practices; the number of Good Manufacturing Practice (GMP) compliant firms
has since increased to 53, though a larger number continues to operate without having yet
complied with GMP standards. Nonetheless, the larger firms manufacturing prescription
drugs now meet GMP standards.
3.8
7.5
25
19.7
8.2 8.7
30.232.4
0
5
10
15
20
25
30
35
Buscopan, 10 mg tab Ponstan, 500 mg tab Adalat Retard, 20 mg tab
Bactrim, 400 mg tab
2004
2010
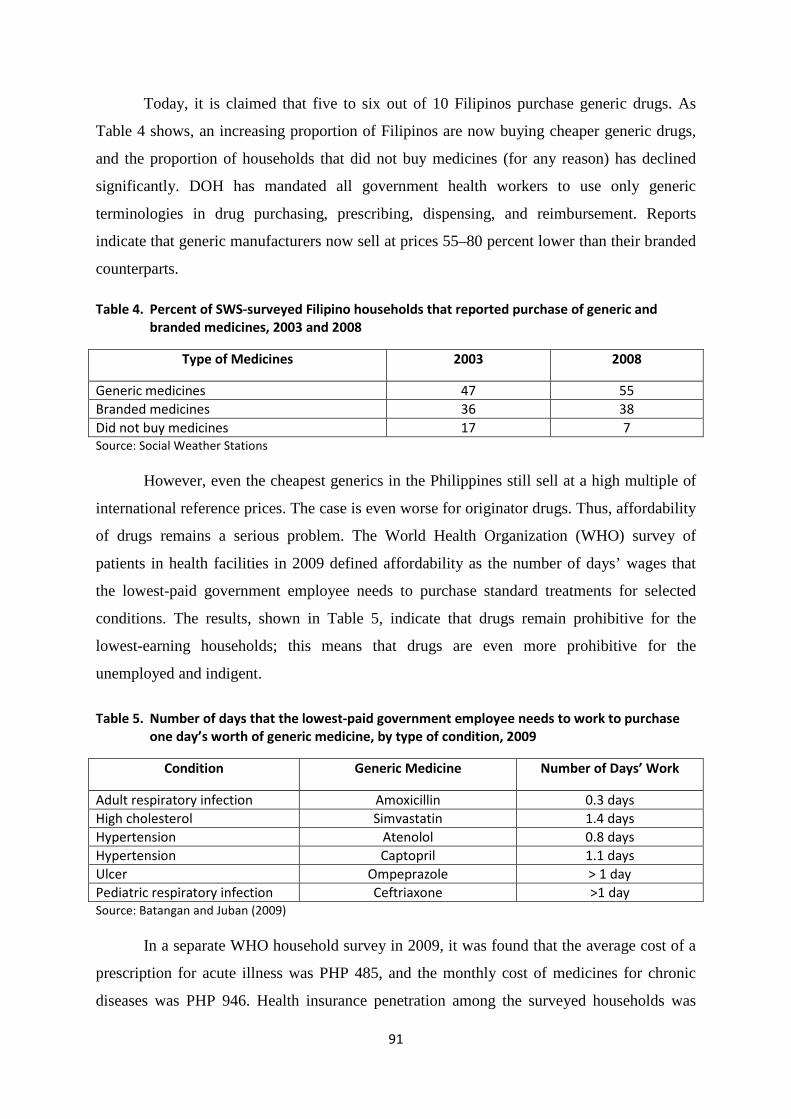
91
Today, it is claimed that five to six out of 10 Filipinos purchase generic drugs. As
Table 4 shows, an increasing proportion of Filipinos are now buying cheaper generic drugs,
and the proportion of households that did not buy medicines (for any reason) has declined
significantly. DOH has mandated all government health workers to use only generic
terminologies in drug purchasing, prescribing, dispensing, and reimbursement. Reports
indicate that generic manufacturers now sell at prices 55–80 percent lower than their branded
counterparts.
Table 4. Percent of SWS-surveyed Filipino households that reported purchase of generic and branded medicines, 2003 and 2008
Type of Medicines 2003 2008
Generic medicines 47 55 Branded medicines 36 38 Did not buy medicines 17 7 Source: Social Weather Stations
However, even the cheapest generics in the Philippines still sell at a high multiple of
international reference prices. The case is even worse for originator drugs. Thus, affordability
of drugs remains a serious problem. The World Health Organization (WHO) survey of
patients in health facilities in 2009 defined affordability as the number of days’ wages that
the lowest-paid government employee needs to purchase standard treatments for selected
conditions. The results, shown in Table 5, indicate that drugs remain prohibitive for the
lowest-earning households; this means that drugs are even more prohibitive for the
unemployed and indigent.
Table 5. Number of days that the lowest-paid government employee needs to work to purchase
one day’s worth of generic medicine, by type of condition, 2009
Condition Generic Medicine Number of Days’ Work
Adult respiratory infection Amoxicillin 0.3 days High cholesterol Simvastatin 1.4 days Hypertension Atenolol 0.8 days Hypertension Captopril 1.1 days Ulcer Ompeprazole > 1 day Pediatric respiratory infection Ceftriaxone >1 day Source: Batangan and Juban (2009)
In a separate WHO household survey in 2009, it was found that the average cost of a
prescription for acute illness was PHP 485, and the monthly cost of medicines for chronic
diseases was PHP 946. Health insurance penetration among the surveyed households was
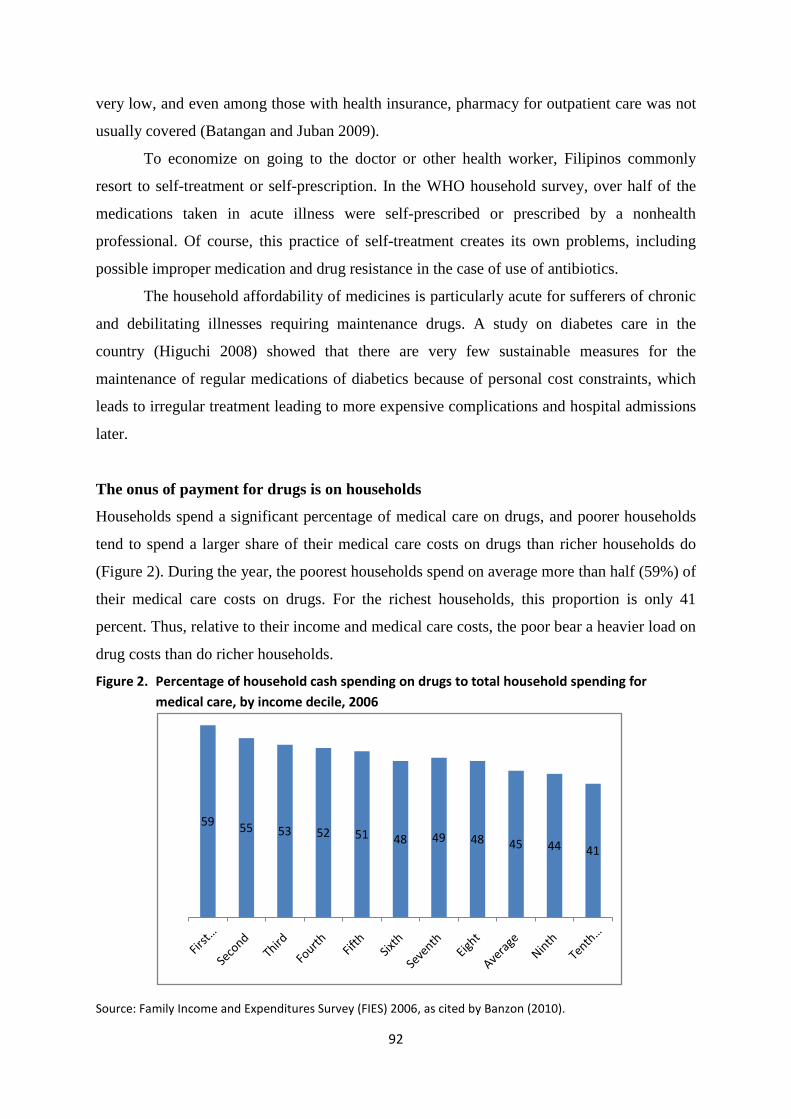
92
very low, and even among those with health insurance, pharmacy for outpatient care was not
usually covered (Batangan and Juban 2009).
To economize on going to the doctor or other health worker, Filipinos commonly
resort to self-treatment or self-prescription. In the WHO household survey, over half of the
medications taken in acute illness were self-prescribed or prescribed by a nonhealth
professional. Of course, this practice of self-treatment creates its own problems, including
possible improper medication and drug resistance in the case of use of antibiotics.
The household affordability of medicines is particularly acute for sufferers of chronic
and debilitating illnesses requiring maintenance drugs. A study on diabetes care in the
country (Higuchi 2008) showed that there are very few sustainable measures for the
maintenance of regular medications of diabetics because of personal cost constraints, which
leads to irregular treatment leading to more expensive complications and hospital admissions
later.
The onus of payment for drugs is on households
Households spend a significant percentage of medical care on drugs, and poorer households
tend to spend a larger share of their medical care costs on drugs than richer households do
(Figure 2). During the year, the poorest households spend on average more than half (59%) of
their medical care costs on drugs. For the richest households, this proportion is only 41
percent. Thus, relative to their income and medical care costs, the poor bear a heavier load on
drug costs than do richer households.
Figure 2. Percentage of household cash spending on drugs to total household spending for medical care, by income decile, 2006
Source: Family Income and Expenditures Survey (FIES) 2006, as cited by Banzon (2010).
59 55 53 52 51 48 49 48 45 44 41
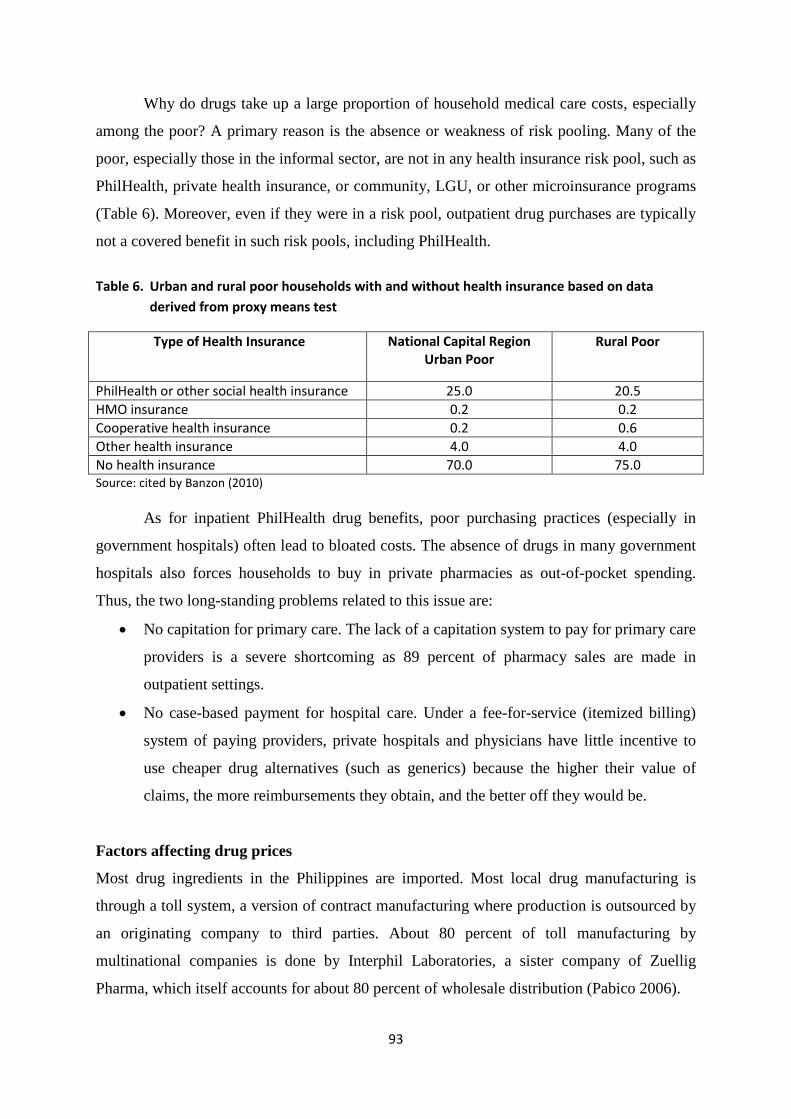
93
Why do drugs take up a large proportion of household medical care costs, especially
among the poor? A primary reason is the absence or weakness of risk pooling. Many of the
poor, especially those in the informal sector, are not in any health insurance risk pool, such as
PhilHealth, private health insurance, or community, LGU, or other microinsurance programs
(Table 6). Moreover, even if they were in a risk pool, outpatient drug purchases are typically
not a covered benefit in such risk pools, including PhilHealth.
Table 6. Urban and rural poor households with and without health insurance based on data
derived from proxy means test
Type of Health Insurance National Capital Region Urban Poor
Rural Poor
PhilHealth or other social health insurance 25.0 20.5 HMO insurance 0.2 0.2 Cooperative health insurance 0.2 0.6 Other health insurance 4.0 4.0 No health insurance 70.0 75.0 Source: cited by Banzon (2010)
As for inpatient PhilHealth drug benefits, poor purchasing practices (especially in
government hospitals) often lead to bloated costs. The absence of drugs in many government
hospitals also forces households to buy in private pharmacies as out-of-pocket spending.
Thus, the two long-standing problems related to this issue are:
• No capitation for primary care. The lack of a capitation system to pay for primary care
providers is a severe shortcoming as 89 percent of pharmacy sales are made in
outpatient settings.
• No case-based payment for hospital care. Under a fee-for-service (itemized billing)
system of paying providers, private hospitals and physicians have little incentive to
use cheaper drug alternatives (such as generics) because the higher their value of
claims, the more reimbursements they obtain, and the better off they would be.
Factors affecting drug prices
Most drug ingredients in the Philippines are imported. Most local drug manufacturing is
through a toll system, a version of contract manufacturing where production is outsourced by
an originating company to third parties. About 80 percent of toll manufacturing by
multinational companies is done by Interphil Laboratories, a sister company of Zuellig
Pharma, which itself accounts for about 80 percent of wholesale distribution (Pabico 2006).
94
Another key factor in the local pharmaceutical market is the overwhelming share of
branded medicines. Before the end of the previous decade, the overwhelming demand for
drugs was for originator brands and “branded generics”; true generics accounted for a very
small percentage (about 3%) of sales, whereas it accounted for as much as 50 percent of the
US market (Pabico 2006). This is counter-intuitive in light of the already off-patent status of
many of the essential drugs in the Philippines.
Lack of household knowledge of drugs, pervasive marketing and advertising, the
strong role of medical representation in the sale of drugs, and the incentives given to
prescribing doctors have been frequently cited as contributing to the persistence of high drug
prices and the high consumption of branded drugs in the country. But perhaps the most
important factor is the sheer lack of supply of generic alternatives to households wanting
them, a situation that persisted until past the middle part of 2000s when generics finally
emerged on their own, thanks in part to the initiatives that will be reviewed in this report
(parallel drug importation, village pharmacies, drug franchises, drug treatment packs, and the
like).
Ball and Tisocki (2009) undertook a study in three regions of the country to examine
the price components for originator brands and a generic version of six medicines, namely:
cotrimoxazole, coamoxiclav, atenolol, glibenclamide, amlodipine, and atorvastatin. The study
covered public hospital pharmacies, chain and independent retail pharmacies, and village
pharmacies (BnB) in three regions. The selling price to patients was determined at each outlet
and then the price was traced back through the supply chain through distributors to
manufacturers or importers, using invoices and/or other documents from which validated data
could be obtained. The results of the study indicate the following:
(1) Highly concentrated market structure and product segmentation. Richer Filipinos
tend to use originator brands and “branded generics” sourced from private drugstores and
hospitals, while poorer Filipinos rely to a greater extent on lower-priced generics sourced
from public facilities and community outlets. Middle-class Filipinos tend to follow richer
Filipinos’ use of originator brands and “branded generics” but with greater use of public
facilities.
The dominance of expensive originator brands and “branded generics” among upper-
class Filipinos is due to a number of factors including strong marketing by dominant
manufacturers and support for their products by prescribing physicians incentivized by
medical representatives; lack of competition from public and nongovernment organization
(NGO) outlets that concentrate on the provision of lower-priced generics to the poor;
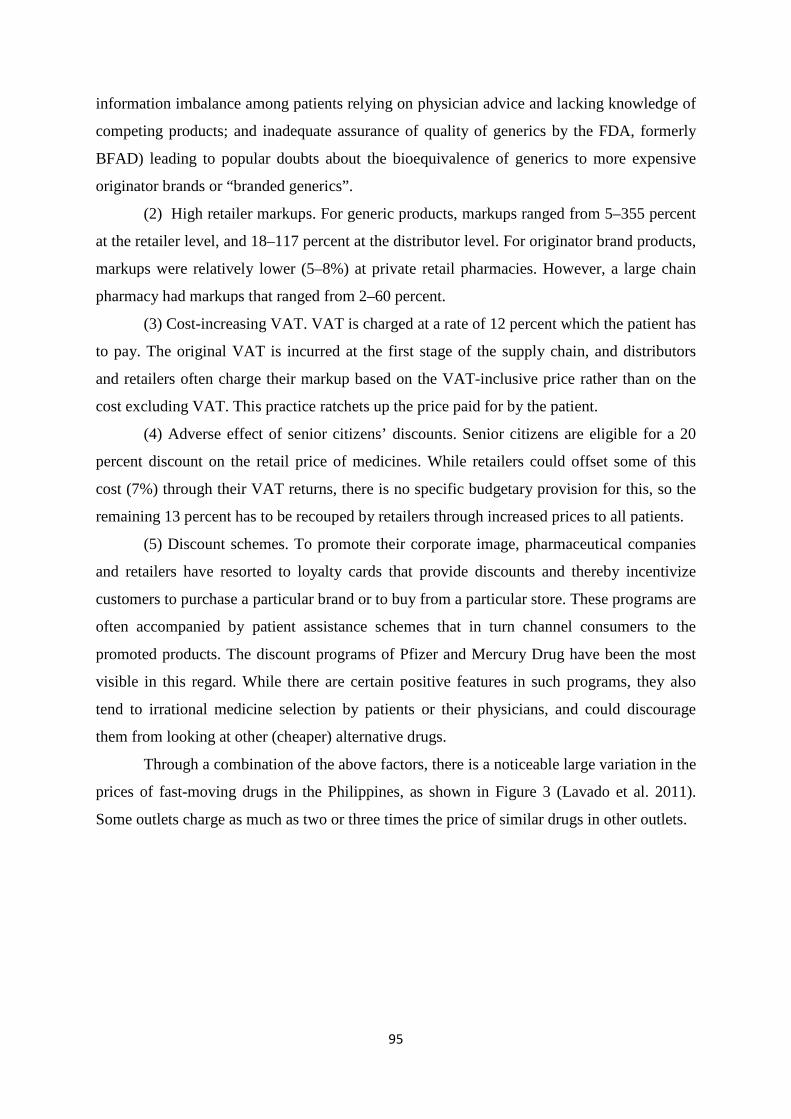
95
information imbalance among patients relying on physician advice and lacking knowledge of
competing products; and inadequate assurance of quality of generics by the FDA, formerly
BFAD) leading to popular doubts about the bioequivalence of generics to more expensive
originator brands or “branded generics”.
(2) High retailer markups. For generic products, markups ranged from 5–355 percent
at the retailer level, and 18–117 percent at the distributor level. For originator brand products,
markups were relatively lower (5–8%) at private retail pharmacies. However, a large chain
pharmacy had markups that ranged from 2–60 percent.
(3) Cost-increasing VAT. VAT is charged at a rate of 12 percent which the patient has
to pay. The original VAT is incurred at the first stage of the supply chain, and distributors
and retailers often charge their markup based on the VAT-inclusive price rather than on the
cost excluding VAT. This practice ratchets up the price paid for by the patient.
(4) Adverse effect of senior citizens’ discounts. Senior citizens are eligible for a 20
percent discount on the retail price of medicines. While retailers could offset some of this
cost (7%) through their VAT returns, there is no specific budgetary provision for this, so the
remaining 13 percent has to be recouped by retailers through increased prices to all patients.
(5) Discount schemes. To promote their corporate image, pharmaceutical companies
and retailers have resorted to loyalty cards that provide discounts and thereby incentivize
customers to purchase a particular brand or to buy from a particular store. These programs are
often accompanied by patient assistance schemes that in turn channel consumers to the
promoted products. The discount programs of Pfizer and Mercury Drug have been the most
visible in this regard. While there are certain positive features in such programs, they also
tend to irrational medicine selection by patients or their physicians, and could discourage
them from looking at other (cheaper) alternative drugs.
Through a combination of the above factors, there is a noticeable large variation in the
prices of fast-moving drugs in the Philippines, as shown in Figure 3 (Lavado et al. 2011).
Some outlets charge as much as two or three times the price of similar drugs in other outlets.
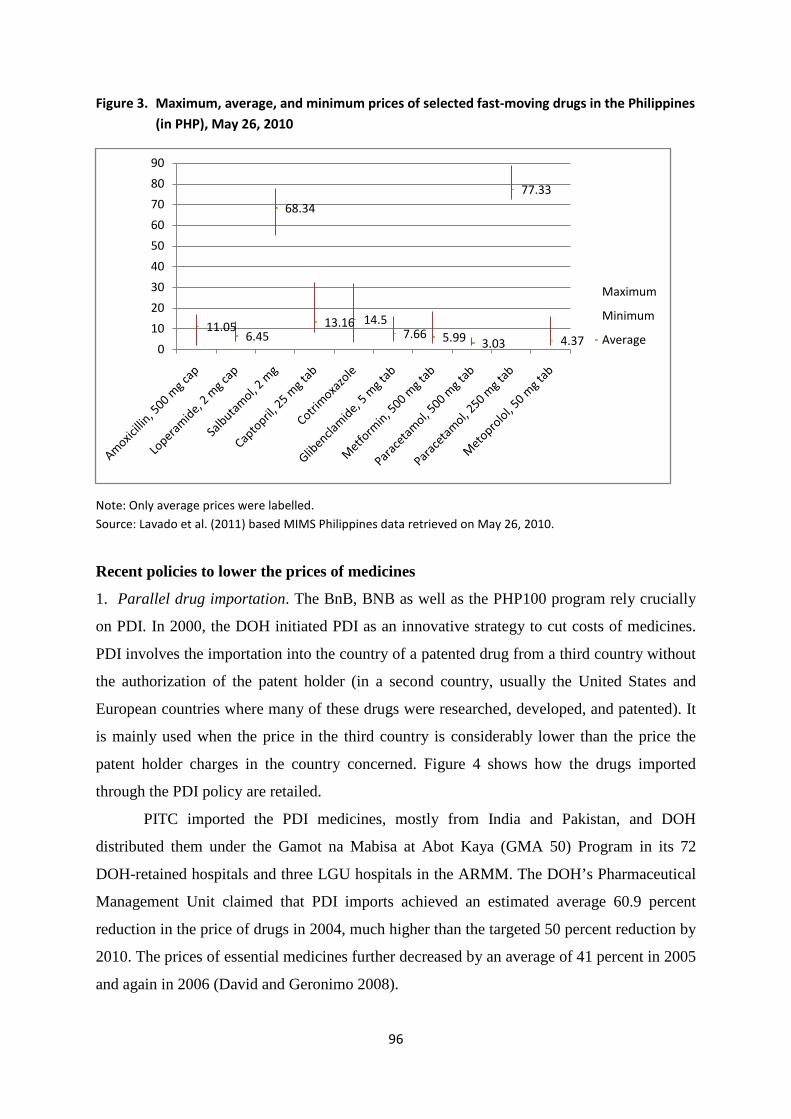
96
Figure 3. Maximum, average, and minimum prices of selected fast-moving drugs in the Philippines (in PHP), May 26, 2010
Note: Only average prices were labelled. Source: Lavado et al. (2011) based MIMS Philippines data retrieved on May 26, 2010.
Recent policies to lower the prices of medicines
1. Parallel drug importation. The BnB, BNB as well as the PHP100 program rely crucially
on PDI. In 2000, the DOH initiated PDI as an innovative strategy to cut costs of medicines.
PDI involves the importation into the country of a patented drug from a third country without
the authorization of the patent holder (in a second country, usually the United States and
European countries where many of these drugs were researched, developed, and patented). It
is mainly used when the price in the third country is considerably lower than the price the
patent holder charges in the country concerned. Figure 4 shows how the drugs imported
through the PDI policy are retailed.
PITC imported the PDI medicines, mostly from India and Pakistan, and DOH
distributed them under the Gamot na Mabisa at Abot Kaya (GMA 50) Program in its 72
DOH-retained hospitals and three LGU hospitals in the ARMM. The DOH’s Pharmaceutical
Management Unit claimed that PDI imports achieved an estimated average 60.9 percent
reduction in the price of drugs in 2004, much higher than the targeted 50 percent reduction by
2010. The prices of essential medicines further decreased by an average of 41 percent in 2005
and again in 2006 (David and Geronimo 2008).
11.056.45
68.34
13.16 14.57.66 5.99 3.03
77.33
4.370
10
20
30
40
50
60
70
80
90
Maximum
Minimum
Average
97
Figure 4. Retailing of parallel drug imports in the Philippines
LGUs can also directly purchase PDIs. Indeed, in the early 2000s, the provinces of
Capiz and Negros Oriental placed orders for PDIs. In the case of Capiz, the provincial
government even became the market leader, forcing private drugstores to reduce their prices
(MSH n.d.).
When the BnB and BNB emerged in the mid-2000s, they became the primary retailers
of PDI drugs. The Cheaper Medicines Act also allows the retailing of PDI drugs to the
private sector, but in an assessment of the business climate in the health sector, BIZCLIR
(2009) pointed out that PDI drugs are retailed only in BnB, BNB (and subsequently the
PHP100 programs), not in private outlets. At that time, most BNBs were still NGO
(nonprofit) operations. Lately, however, there has been interest among for-profit business
enterprises to become BNBs, and most BNBs are now for-profit private enterprises.
However, in hindsight, the overall size of PDI procurement has been very small
relative to total pharmaceutical sales in the Philippines. In the decade between 2000 and
March 2010, the Philippine government imported only USD 8.789 million of PDI drugs (or
PHP 377.9 million in today’s current exchange rate of USD 1.00: PHP 43.00) [Table 7]. This
translates to a measly average yearly importation of USD 799,000 (or PHP 34.4 million).
PDI Imports
PITC Pharma
PITC and DOH
Logistics
BnB Program
BNB Program
P100 Program DOH
Hospital
LGU Hospital
Outlets
Outlets
DOH Procurement
LGU Procurement
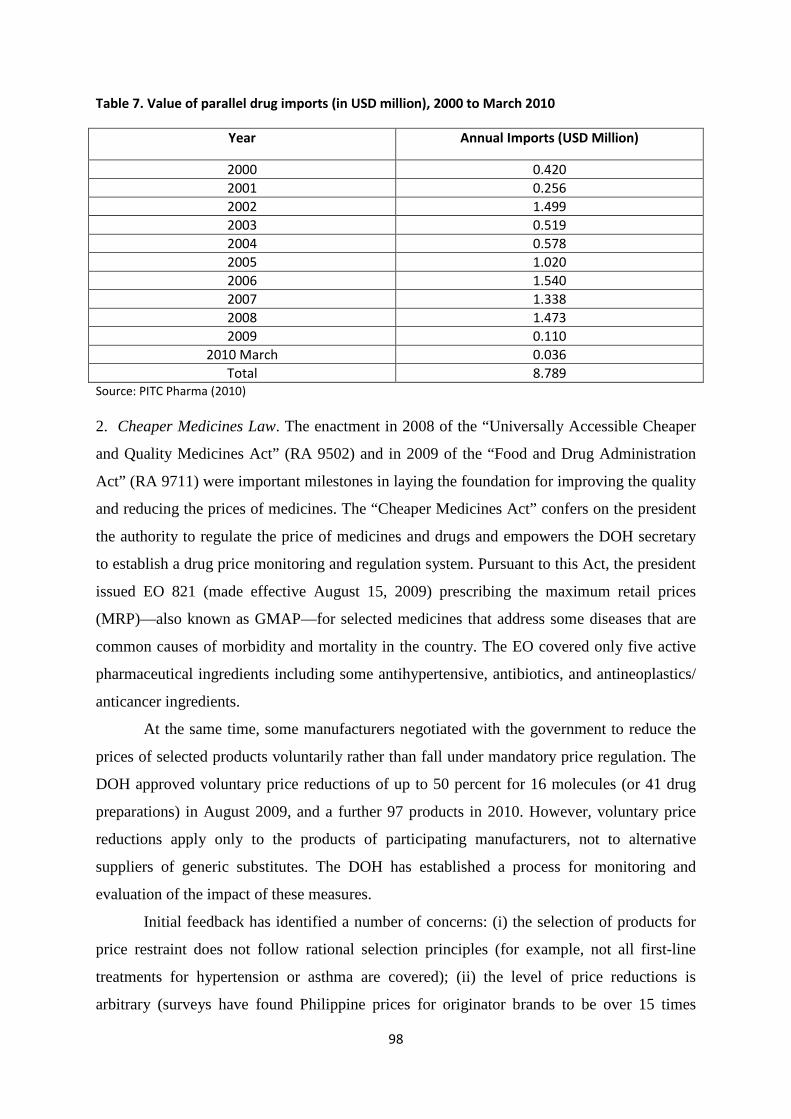
98
Table 7. Value of parallel drug imports (in USD million), 2000 to March 2010
Year Annual Imports (USD Million)
2000 0.420 2001 0.256 2002 1.499 2003 0.519 2004 0.578 2005 1.020 2006 1.540 2007 1.338 2008 1.473 2009 0.110
2010 March 0.036 Total 8.789
Source: PITC Pharma (2010) 2. Cheaper Medicines Law. The enactment in 2008 of the “Universally Accessible Cheaper
and Quality Medicines Act” (RA 9502) and in 2009 of the “Food and Drug Administration
Act” (RA 9711) were important milestones in laying the foundation for improving the quality
and reducing the prices of medicines. The “Cheaper Medicines Act” confers on the president
the authority to regulate the price of medicines and drugs and empowers the DOH secretary
to establish a drug price monitoring and regulation system. Pursuant to this Act, the president
issued EO 821 (made effective August 15, 2009) prescribing the maximum retail prices
(MRP)—also known as GMAP—for selected medicines that address some diseases that are
common causes of morbidity and mortality in the country. The EO covered only five active
pharmaceutical ingredients including some antihypertensive, antibiotics, and antineoplastics/
anticancer ingredients.
At the same time, some manufacturers negotiated with the government to reduce the
prices of selected products voluntarily rather than fall under mandatory price regulation. The
DOH approved voluntary price reductions of up to 50 percent for 16 molecules (or 41 drug
preparations) in August 2009, and a further 97 products in 2010. However, voluntary price
reductions apply only to the products of participating manufacturers, not to alternative
suppliers of generic substitutes. The DOH has established a process for monitoring and
evaluation of the impact of these measures.
Initial feedback has identified a number of concerns: (i) the selection of products for
price restraint does not follow rational selection principles (for example, not all first-line
treatments for hypertension or asthma are covered); (ii) the level of price reductions is
arbitrary (surveys have found Philippine prices for originator brands to be over 15 times
99
higher than international reference prices, and even lowest-cost generics five to six times
international reference prices); (iii) the scheme may reduce generic competition and publicize
brand-name medicines (for many of the products there is a much cheaper, quality generic
substitute available); (iv) PhilHealth cannot use voluntary price reductions in its
reimbursement of medicines because they apply to specific manufacturers only, and in
aggregate, the medicines falling under the scheme account for a relatively limited share of the
market.
Review of the Botika ng Barangay Program
Program description
The village drug outlet has had a checkered history in the Philippines. It was known as
“Botika sa Barangay” in the 1970s; faded out of the scene in the 1980s and 1990s (Flores et
al. 2001); and was revived during the 12th Congress when President Gloria Macapagal-
Arroyo pledged in her state of the nation address (SONA) in July 2000 to lower the prices of
drugs and medicines frequently bought by the poor by 50 percent during her administration
(DOH 2003). This was part of her 10-Point Legacy Program.
Following this presidential pledge, the DOH entered into a memorandum of
agreement with the Philippine Charity Sweepstakes Office (PCSO) and the PITC to purchase
and distribute the drugs and medicines through the DOH networks of the renamed Botika ng
Barangay (BnB) and, later, the larger Botika ng Bayan (BNB). PCSO earmarked PHP 20
million to be transferred to PITC for the procurement of BnB drugs. The initial target was
800 BnB, which will each be seeded with PHP 25,000 worth of drugs. To operationalize this
program, the DOH issued AO 64, s. 2003, which contained the policy guidelines for the
operationalization of BnBs by the regional CHDs.
The AO defined a BnB as a drug outlet of a proponent LGU2; selected by the CHD
concerned; approved by the Pharma 50 Project which was purposely set up to manage the
SONA pledge; and licensed by the BFAD, now known as the FDA. All BnB drugs pass
through the quality control and product registration standards of the FDA.
The BnBs were mandated to sell low-priced generic over-the-counter (OTC) drugs
and, originally, two prescription drugs (amoxicillin and cotrimoxazole). Later, the number of
2This was the original intention, but as will be shown below, the BnBs have evolved such that most of the sponsoring organizations now are actually private entities.
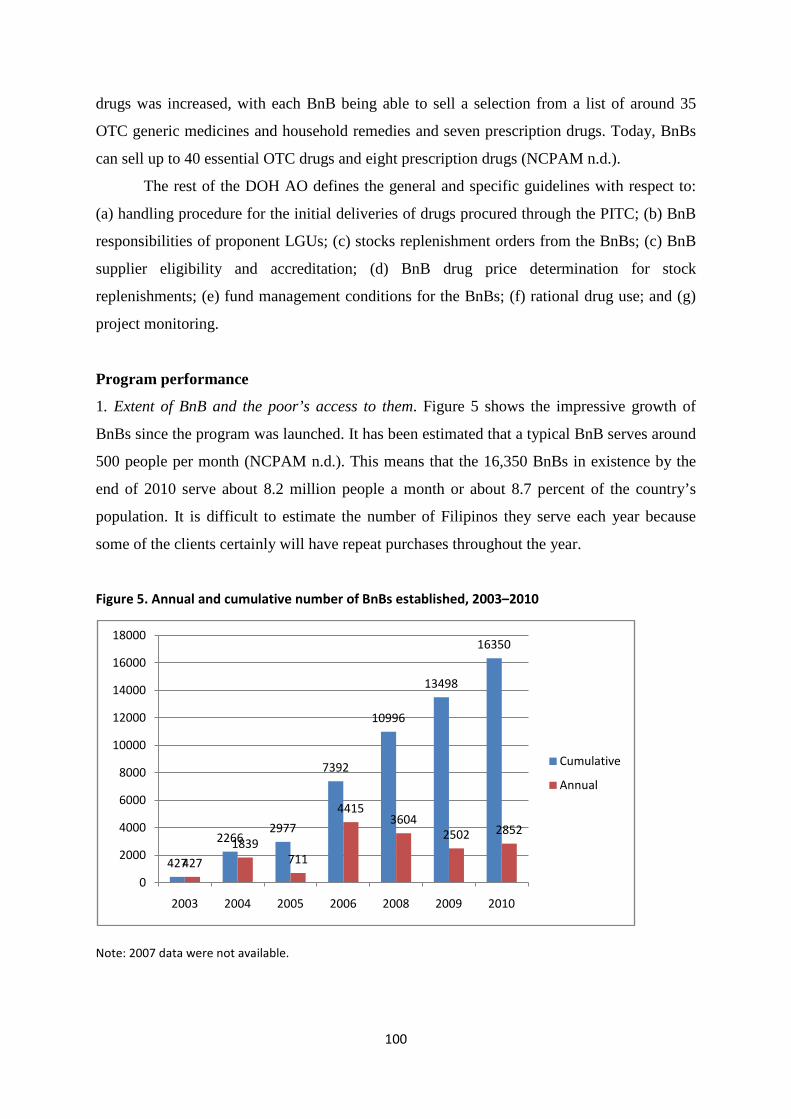
100
drugs was increased, with each BnB being able to sell a selection from a list of around 35
OTC generic medicines and household remedies and seven prescription drugs. Today, BnBs
can sell up to 40 essential OTC drugs and eight prescription drugs (NCPAM n.d.).
The rest of the DOH AO defines the general and specific guidelines with respect to:
(a) handling procedure for the initial deliveries of drugs procured through the PITC; (b) BnB
responsibilities of proponent LGUs; (c) stocks replenishment orders from the BnBs; (c) BnB
supplier eligibility and accreditation; (d) BnB drug price determination for stock
replenishments; (e) fund management conditions for the BnBs; (f) rational drug use; and (g)
project monitoring.
Program performance
1. Extent of BnB and the poor’s access to them. Figure 5 shows the impressive growth of
BnBs since the program was launched. It has been estimated that a typical BnB serves around
500 people per month (NCPAM n.d.). This means that the 16,350 BnBs in existence by the
end of 2010 serve about 8.2 million people a month or about 8.7 percent of the country’s
population. It is difficult to estimate the number of Filipinos they serve each year because
some of the clients certainly will have repeat purchases throughout the year.
Figure 5. Annual and cumulative number of BnBs established, 2003–2010
Note: 2007 data were not available.
427
22662977
7392
10996
13498
16350
427
1839711
44153604
2502 2852
0
2000
4000
6000
8000
10000
12000
14000
16000
18000
2003 2004 2005 2006 2008 2009 2010
Cumulative
Annual
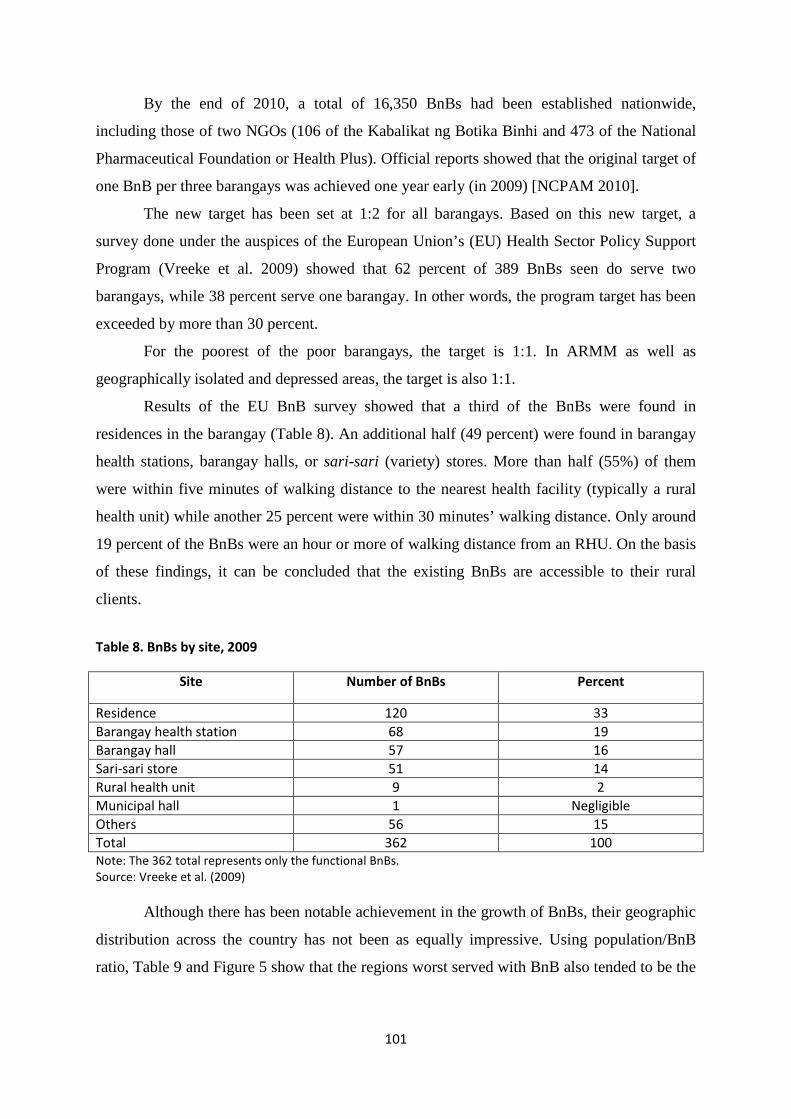
101
By the end of 2010, a total of 16,350 BnBs had been established nationwide,
including those of two NGOs (106 of the Kabalikat ng Botika Binhi and 473 of the National
Pharmaceutical Foundation or Health Plus). Official reports showed that the original target of
one BnB per three barangays was achieved one year early (in 2009) [NCPAM 2010].
The new target has been set at 1:2 for all barangays. Based on this new target, a
survey done under the auspices of the European Union’s (EU) Health Sector Policy Support
Program (Vreeke et al. 2009) showed that 62 percent of 389 BnBs seen do serve two
barangays, while 38 percent serve one barangay. In other words, the program target has been
exceeded by more than 30 percent.
For the poorest of the poor barangays, the target is 1:1. In ARMM as well as
geographically isolated and depressed areas, the target is also 1:1.
Results of the EU BnB survey showed that a third of the BnBs were found in
residences in the barangay (Table 8). An additional half (49 percent) were found in barangay
health stations, barangay halls, or sari-sari (variety) stores. More than half (55%) of them
were within five minutes of walking distance to the nearest health facility (typically a rural
health unit) while another 25 percent were within 30 minutes’ walking distance. Only around
19 percent of the BnBs were an hour or more of walking distance from an RHU. On the basis
of these findings, it can be concluded that the existing BnBs are accessible to their rural
clients.
Table 8. BnBs by site, 2009
Site Number of BnBs Percent
Residence 120 33 Barangay health station 68 19 Barangay hall 57 16 Sari-sari store 51 14 Rural health unit 9 2 Municipal hall 1 Negligible Others 56 15 Total 362 100 Note: The 362 total represents only the functional BnBs. Source: Vreeke et al. (2009)
Although there has been notable achievement in the growth of BnBs, their geographic
distribution across the country has not been as equally impressive. Using population/BnB
ratio, Table 9 and Figure 5 show that the regions worst served with BnB also tended to be the
102
poorer ones, e.g., ARMM (one per 14,900), Bicol (one per 14,000), Soccsksargen (one per
10,700), and Mimaropa (one per 9,000).
Provincial distribution is even more striking, with the poorest provinces such as
Basilan, Sulu, Lanao del Sur, Tawi-tawi, Compostela Valley, Suquijor, Batanes, and
Marinduque without BnBs as late as 2009. The other poorly served provinces were Nueva
Vizcaya (with only 12% of its barangays having a BnB), Albay (10%), Sorsogon (5%),
Siquijor (4%), and Catanduanes (3%) [Lavado et al. 2011]. Seven years after the program
was initiated in 2001, 15 of the 40 poorest towns still do not have BnBs (Ragaza and Morales
2009).
BnBs’ inability to penetrate the poorest areas quickly, which was the original
intention of the program, is due to the fact that DOH is not directly involved in determining
and setting up BnB outlets. BnBs are largely a local initiative of the LGUs and community
organizations with support from the DOH’s regional CHD.
The absence of BnB in a poor locality may also be due to the lack of a supervising
pharmacist who wants to work in the area. According to DOH rules, only a supervising
pharmacist is authorized to dispense prescription drugs. The Pharmacy Law also requires the
presence of a pharmacist in a drugstore or retail outlet.
The continued supply of drugs after the initial stock has run out has been a major
problem. CHD interviews indicate that while the BnBs were originally conceived to operate
as drug-revolving funds, with the funds managed at their respective CHDs, this business
format has not been followed. Thus, there has been a weak reflow of funds. Moreover, each
BnB has been left to itself to locate its own source of supply. In some instances, the BnBs
have sourced their drugs from private distributors and retailers (even for-profit sources), thus
increasing their costs and the prices faced by consumers. The problem seems to be of
economies of scale, i.e., individually, each BnB is too small to warrant a regular visit from a
supplier, especially if the BnB is in a far-flung area.
A system of pooling drug requirements to achieve economies of scale remains to be
worked out. However, DOH-NCPAM staff opine that central-pooled procurement will be
difficult for the reorders because of (a) the large numbers of BnB and communication
challenges; (b) the different procurement cycles of BnBs because of their variations in
demand and sale patterns; and (c) the so-far nonexistent IT technology needed to respond
quickly to the requirements of BnBs, secure orders, and deliver the products to them.
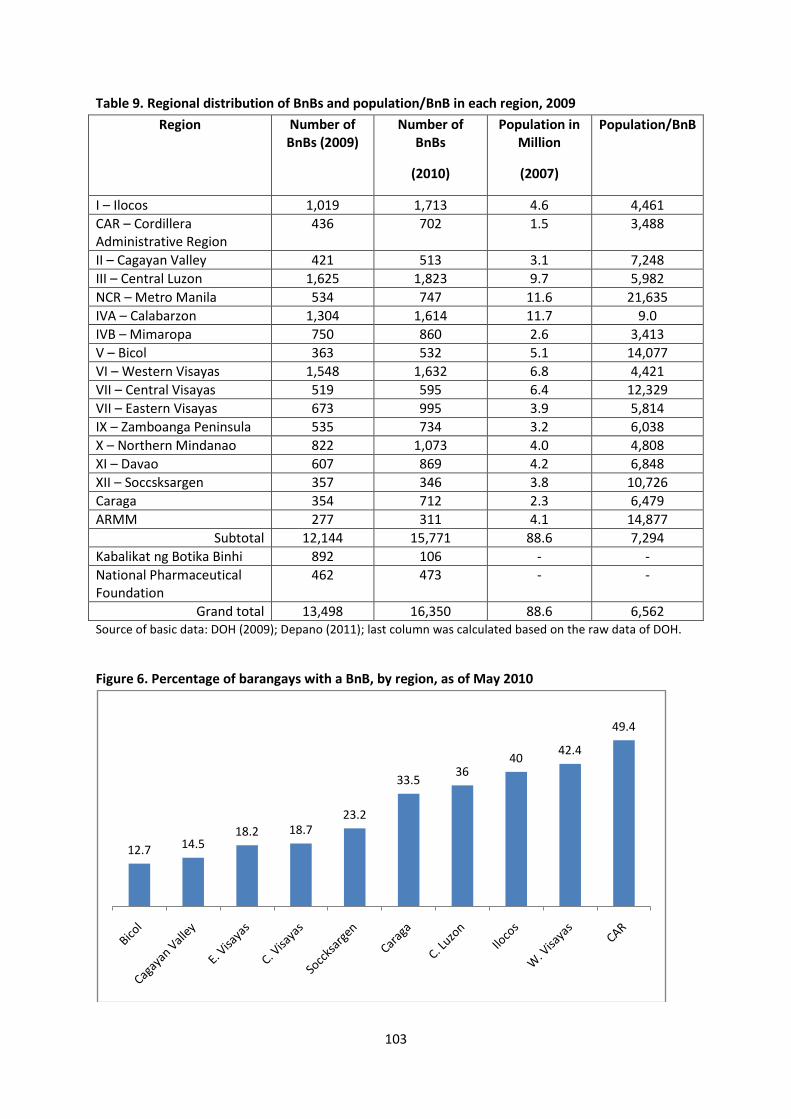
103
Table 9. Regional distribution of BnBs and population/BnB in each region, 2009
Region Number of BnBs (2009)
Number of BnBs
(2010)
Population in Million
(2007)
Population/BnB
I – Ilocos 1,019 1,713 4.6 4,461 CAR – Cordillera Administrative Region
436 702 1.5 3,488
II – Cagayan Valley 421 513 3.1 7,248 III – Central Luzon 1,625 1,823 9.7 5,982 NCR – Metro Manila 534 747 11.6 21,635 IVA – Calabarzon 1,304 1,614 11.7 9.0 IVB – Mimaropa 750 860 2.6 3,413 V – Bicol 363 532 5.1 14,077 VI – Western Visayas 1,548 1,632 6.8 4,421 VII – Central Visayas 519 595 6.4 12,329 VII – Eastern Visayas 673 995 3.9 5,814 IX – Zamboanga Peninsula 535 734 3.2 6,038 X – Northern Mindanao 822 1,073 4.0 4,808 XI – Davao 607 869 4.2 6,848 XII – Soccsksargen 357 346 3.8 10,726 Caraga 354 712 2.3 6,479 ARMM 277 311 4.1 14,877
Subtotal 12,144 15,771 88.6 7,294 Kabalikat ng Botika Binhi 892 106 - - National Pharmaceutical Foundation
462 473 - -
Grand total 13,498 16,350 88.6 6,562 Source of basic data: DOH (2009); Depano (2011); last column was calculated based on the raw data of DOH. Figure 6. Percentage of barangays with a BnB, by region, as of May 2010
12.7 14.518.2 18.7
23.2
33.536
4042.4
49.4
104
Note: This figure does not contain data for seven regions as they are not available in the level of disaggregation (per barangay) needed. Source: Lavado (2011)
2. Rational drug use. One BnB analyst has taken issue with the choice of drugs included in
the BnB in relation to the burden of disease in the country. DOH uses the top causes of
mortality and morbidity as basis for the choice of drugs. While this may seem acceptable at
first blush, it does not have sound technical mooring as disease burden should be calculated
based on disability-adjusted life years (DALY), which is the globally accepted methodology.
DALYs take account of the number of people who died or got sick of the disease (the usual
mortality and morbidity data), as well as the period of time that people got sick (standardized
in a year) and the severity of the disease. Very few DALY studies have been done in the
Philippines, mostly as graduate theses. The DOH is just beginning to get into this type of
analysis. In any case, while the burden of disease averted by BnB drugs looks large from a
simple mortality and morbidity reckoning, it may not be so if reckoned in terms of DALYs.
Drugs sold by BnBs are all approved by FDA, but they stock only a small number of
the list of products needed for public health. These include OTC medications for minor
illnesses such as diarrhea, dehydration, stomach acidity, coughs, and dizziness. Two
antibiotics were included when the program started (cotrimoxazole and amoxicillin). Five
prescription drugs for chronic diseases were added in 2005: metformin and glibenclamide for
diabetes; metropolol and captropil for cardiovascular diseases; and salbutamol for respiratory
illnesses.
However, BnBs do not carry drugs for common diseases such as malaria and TB.
These conditions are deemed more complicated and require professional consultation; the
noninclusion in the BnB drug list implies that self-treatment is not encouraged.
BnBs ought to be monitored regularly by a licensed pharmacist, but the lack of
available pharmacy staff has turned this into a major problem (MeTA 2010). The EU BnB
survey noted that regulatory supervision by a supervising pharmacist is hardly taking place
(Vreeke et al. 2009). Some deem the lack of regular pharmacist supervision and lack of
linkage to primary care facilities as limiting most BnBs’ potential to provide access to
prescription medicines for chronic conditions. The linkage to an RHU, however, is not a
physical-distance problem as they are close to most BnBs, but rather a coordination problem.
In any case, a significant proportion of BnBs (35%, according to the EU survey) had
expired medicines on the day of the visit, indicating the gravity of the supervision and related
problems. Moreover, the lack of control and information on prescribing behavior arising from
105
the lack of supervising pharmacists (and the lack of up-to-date prescription registers) poses a
serious public health risk because of potential overuse of antibiotics.
A few BnBs have gone beyond their mandate by procuring their own stocks of
prescription drugs that the DOH prohibits them to sell. Ragaza and Morales (2009) reported
that a 2006 Commission on Audit (COA) team had discovered several BnB outlets in Caraga
and Metro Manila selling unauthorized medicines—Alexan and Ambroxol, among others,
because they were being demanded by patients suffering from bronchitis. As this is a COA
report on a specific location, however, it cannot be ascertained whether the practice is
widespread nationwide or not.
The biggest challenge that the BnB program has to face is how to situate the BnBs
within the overall framework of the health care system. The BnB program appears to have
started as a coping mechanism for the shortage of drugs in the late 1990s and early 2000s. It
has succeeded in getting supplies to many areas that did not have access to drugs before, but
certain poor areas remain without them. Moreover, supervision has loomed as a major
problem. With the sudden upsurge of private generic pharmacy outlets everywhere, the BnB
program certainly needs to be re-examined.
3. Cost efficiency vis-à-vis the private sector. Comparing the efficiency of BnBs vis-à-vis
alternative sources of retail drugs is fraught with difficulty. First, the institutional structures
and ownership of retail suppliers differ. Second, the importation modes vary: while BnBs rely
on parallel drug importation with its inherent subsidy, others do not. Third, BnBs also rely on
the distribution system of DOH and CHDs, which is another form of subsidy; alternative
suppliers do not. BnBs are also farther out in rural areas, with their attendant higher transport
costs. For these reasons, suppliers are not directly comparable, even if they may be selling
similar pharmaceutical product lines. (There are also issues about bioequivalence between
BnB drugs and private sector alternatives, which is a separate issue.) Despite these
difficulties, it is important to compare BnB prices with those of alternative suppliers.
In mid-2000s prior to the rapid emergence of private retail pharmacies selling generic
drugs, and prior to the implementation of the Maximum Retail Price Law, Ramos (2006)
compared the selling price of selected drugs between a BnB and a leading private drugstore
chain. The results, shown in Table 10, indicated that BnB prices were consistently lower than
the comparator-supplier across all the drugs considered. The price reduction varied from 38
percent to 90 percent; on average, drugs were 62 percent cheaper than the alternative.
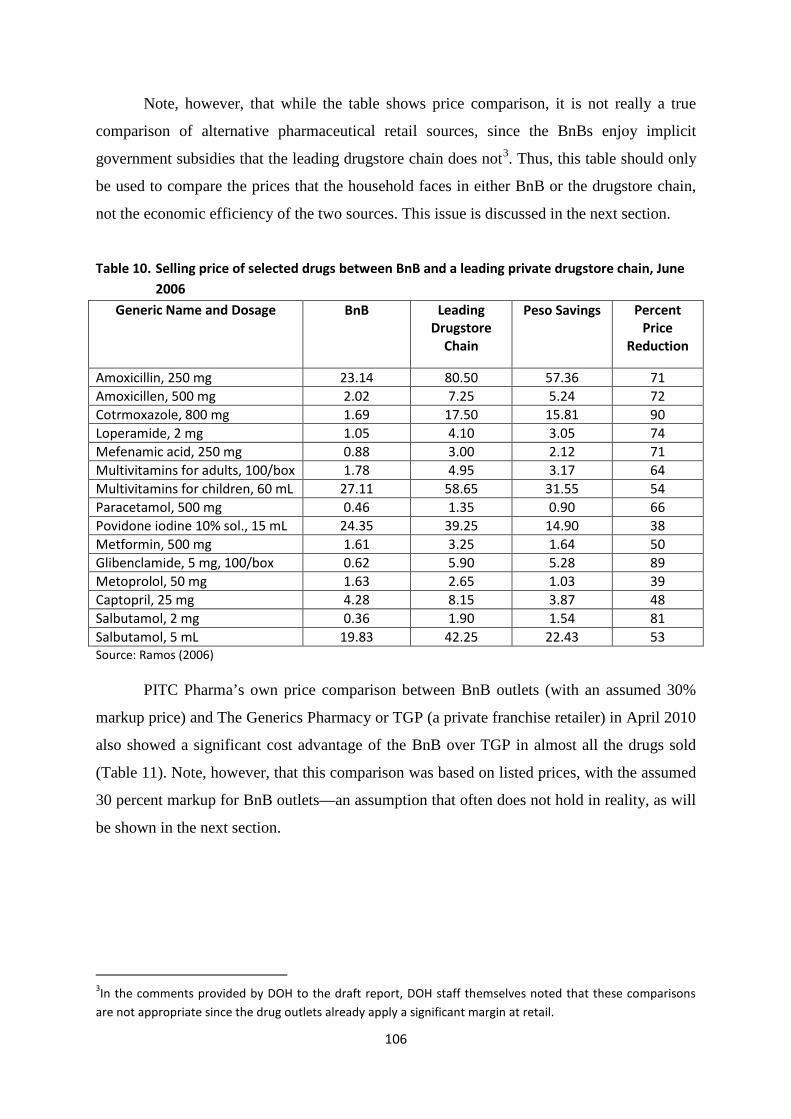
106
Note, however, that while the table shows price comparison, it is not really a true
comparison of alternative pharmaceutical retail sources, since the BnBs enjoy implicit
government subsidies that the leading drugstore chain does not3. Thus, this table should only
be used to compare the prices that the household faces in either BnB or the drugstore chain,
not the economic efficiency of the two sources. This issue is discussed in the next section.
Table 10. Selling price of selected drugs between BnB and a leading private drugstore chain, June 2006
Generic Name and Dosage BnB Leading Drugstore
Chain
Peso Savings Percent Price
Reduction
Amoxicillin, 250 mg 23.14 80.50 57.36 71 Amoxicillen, 500 mg 2.02 7.25 5.24 72 Cotrmoxazole, 800 mg 1.69 17.50 15.81 90 Loperamide, 2 mg 1.05 4.10 3.05 74 Mefenamic acid, 250 mg 0.88 3.00 2.12 71 Multivitamins for adults, 100/box 1.78 4.95 3.17 64 Multivitamins for children, 60 mL 27.11 58.65 31.55 54 Paracetamol, 500 mg 0.46 1.35 0.90 66 Povidone iodine 10% sol., 15 mL 24.35 39.25 14.90 38 Metformin, 500 mg 1.61 3.25 1.64 50 Glibenclamide, 5 mg, 100/box 0.62 5.90 5.28 89 Metoprolol, 50 mg 1.63 2.65 1.03 39 Captopril, 25 mg 4.28 8.15 3.87 48 Salbutamol, 2 mg 0.36 1.90 1.54 81 Salbutamol, 5 mL 19.83 42.25 22.43 53 Source: Ramos (2006)
PITC Pharma’s own price comparison between BnB outlets (with an assumed 30%
markup price) and The Generics Pharmacy or TGP (a private franchise retailer) in April 2010
also showed a significant cost advantage of the BnB over TGP in almost all the drugs sold
(Table 11). Note, however, that this comparison was based on listed prices, with the assumed
30 percent markup for BnB outlets—an assumption that often does not hold in reality, as will
be shown in the next section.
3In the comments provided by DOH to the draft report, DOH staff themselves noted that these comparisons are not appropriate since the drug outlets already apply a significant margin at retail.
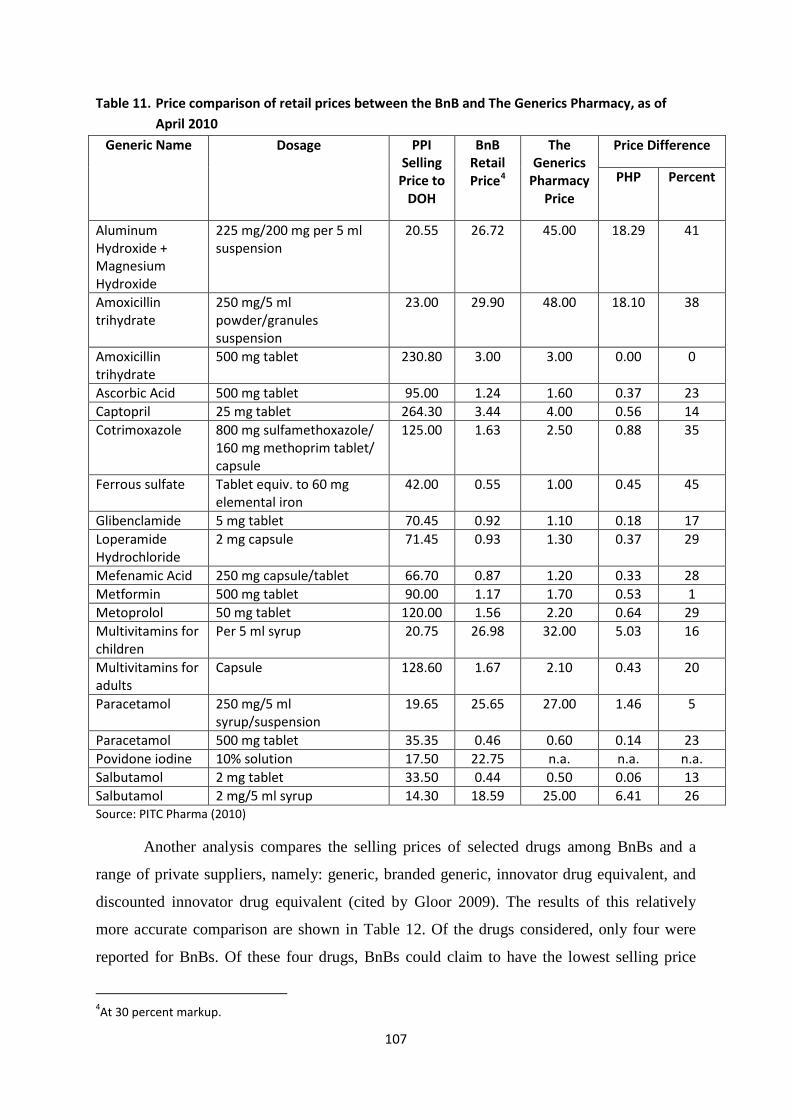
107
Table 11. Price comparison of retail prices between the BnB and The Generics Pharmacy, as of April 2010
Generic Name Dosage PPI Selling
Price to DOH
BnB Retail Price4
The Generics
Pharmacy Price
Price Difference
PHP Percent
Aluminum Hydroxide + Magnesium Hydroxide
225 mg/200 mg per 5 ml suspension
20.55 26.72 45.00 18.29 41
Amoxicillin trihydrate
250 mg/5 ml powder/granules suspension
23.00 29.90 48.00 18.10 38
Amoxicillin trihydrate
500 mg tablet 230.80 3.00 3.00 0.00 0
Ascorbic Acid 500 mg tablet 95.00 1.24 1.60 0.37 23 Captopril 25 mg tablet 264.30 3.44 4.00 0.56 14 Cotrimoxazole 800 mg sulfamethoxazole/
160 mg methoprim tablet/ capsule
125.00 1.63 2.50 0.88 35
Ferrous sulfate Tablet equiv. to 60 mg elemental iron
42.00 0.55 1.00 0.45 45
Glibenclamide 5 mg tablet 70.45 0.92 1.10 0.18 17 Loperamide Hydrochloride
2 mg capsule 71.45 0.93 1.30 0.37 29
Mefenamic Acid 250 mg capsule/tablet 66.70 0.87 1.20 0.33 28 Metformin 500 mg tablet 90.00 1.17 1.70 0.53 1 Metoprolol 50 mg tablet 120.00 1.56 2.20 0.64 29 Multivitamins for children
Per 5 ml syrup 20.75 26.98 32.00 5.03 16
Multivitamins for adults
Capsule 128.60 1.67 2.10 0.43 20
Paracetamol 250 mg/5 ml syrup/suspension
19.65 25.65 27.00 1.46 5
Paracetamol 500 mg tablet 35.35 0.46 0.60 0.14 23 Povidone iodine 10% solution 17.50 22.75 n.a. n.a. n.a. Salbutamol 2 mg tablet 33.50 0.44 0.50 0.06 13 Salbutamol 2 mg/5 ml syrup 14.30 18.59 25.00 6.41 26 Source: PITC Pharma (2010)
Another analysis compares the selling prices of selected drugs among BnBs and a
range of private suppliers, namely: generic, branded generic, innovator drug equivalent, and
discounted innovator drug equivalent (cited by Gloor 2009). The results of this relatively
more accurate comparison are shown in Table 12. Of the drugs considered, only four were
reported for BnBs. Of these four drugs, BnBs could claim to have the lowest selling price
4At 30 percent markup.
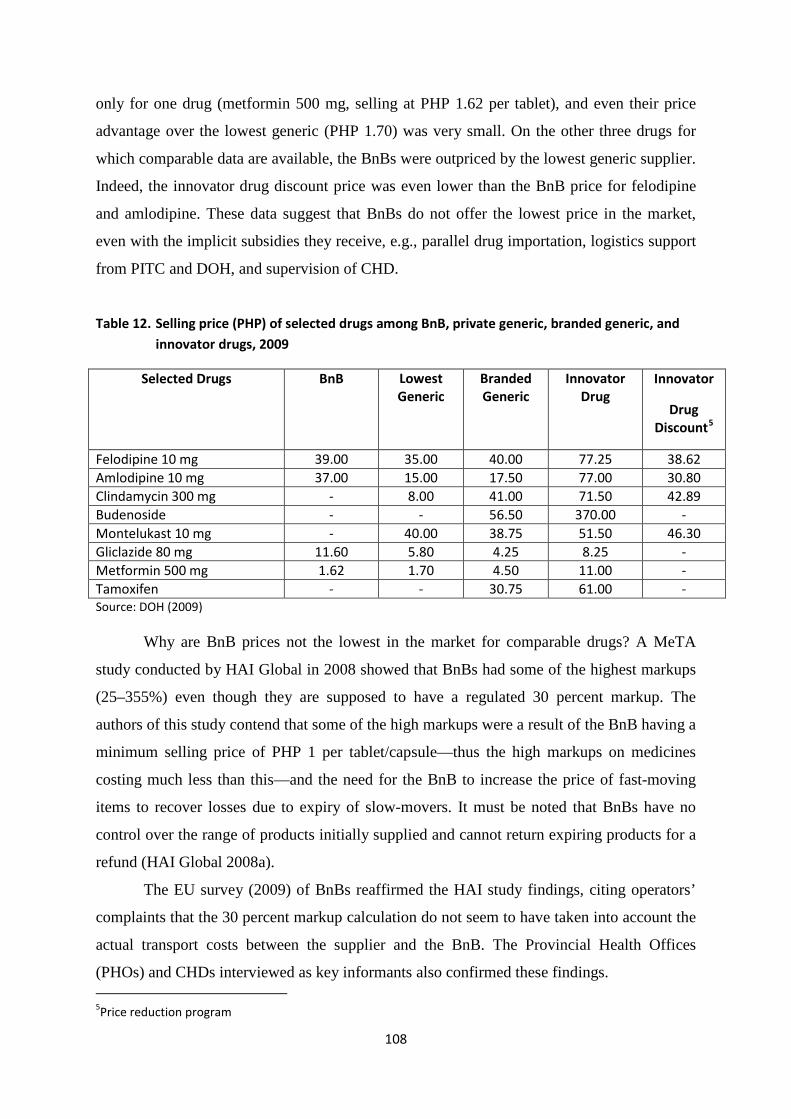
108
only for one drug (metformin 500 mg, selling at PHP 1.62 per tablet), and even their price
advantage over the lowest generic (PHP 1.70) was very small. On the other three drugs for
which comparable data are available, the BnBs were outpriced by the lowest generic supplier.
Indeed, the innovator drug discount price was even lower than the BnB price for felodipine
and amlodipine. These data suggest that BnBs do not offer the lowest price in the market,
even with the implicit subsidies they receive, e.g., parallel drug importation, logistics support
from PITC and DOH, and supervision of CHD.
Table 12. Selling price (PHP) of selected drugs among BnB, private generic, branded generic, and innovator drugs, 2009
Selected Drugs BnB Lowest Generic
Branded Generic
Innovator Drug
Innovator
Drug Discount5
Felodipine 10 mg 39.00 35.00 40.00 77.25 38.62 Amlodipine 10 mg 37.00 15.00 17.50 77.00 30.80 Clindamycin 300 mg - 8.00 41.00 71.50 42.89 Budenoside - - 56.50 370.00 - Montelukast 10 mg - 40.00 38.75 51.50 46.30 Gliclazide 80 mg 11.60 5.80 4.25 8.25 - Metformin 500 mg 1.62 1.70 4.50 11.00 - Tamoxifen - - 30.75 61.00 - Source: DOH (2009)
Why are BnB prices not the lowest in the market for comparable drugs? A MeTA
study conducted by HAI Global in 2008 showed that BnBs had some of the highest markups
(25–355%) even though they are supposed to have a regulated 30 percent markup. The
authors of this study contend that some of the high markups were a result of the BnB having a
minimum selling price of PHP 1 per tablet/capsule—thus the high markups on medicines
costing much less than this—and the need for the BnB to increase the price of fast-moving
items to recover losses due to expiry of slow-movers. It must be noted that BnBs have no
control over the range of products initially supplied and cannot return expiring products for a
refund (HAI Global 2008a).
The EU survey (2009) of BnBs reaffirmed the HAI study findings, citing operators’
complaints that the 30 percent markup calculation do not seem to have taken into account the
actual transport costs between the supplier and the BnB. The Provincial Health Offices
(PHOs) and CHDs interviewed as key informants also confirmed these findings. 5Price reduction program
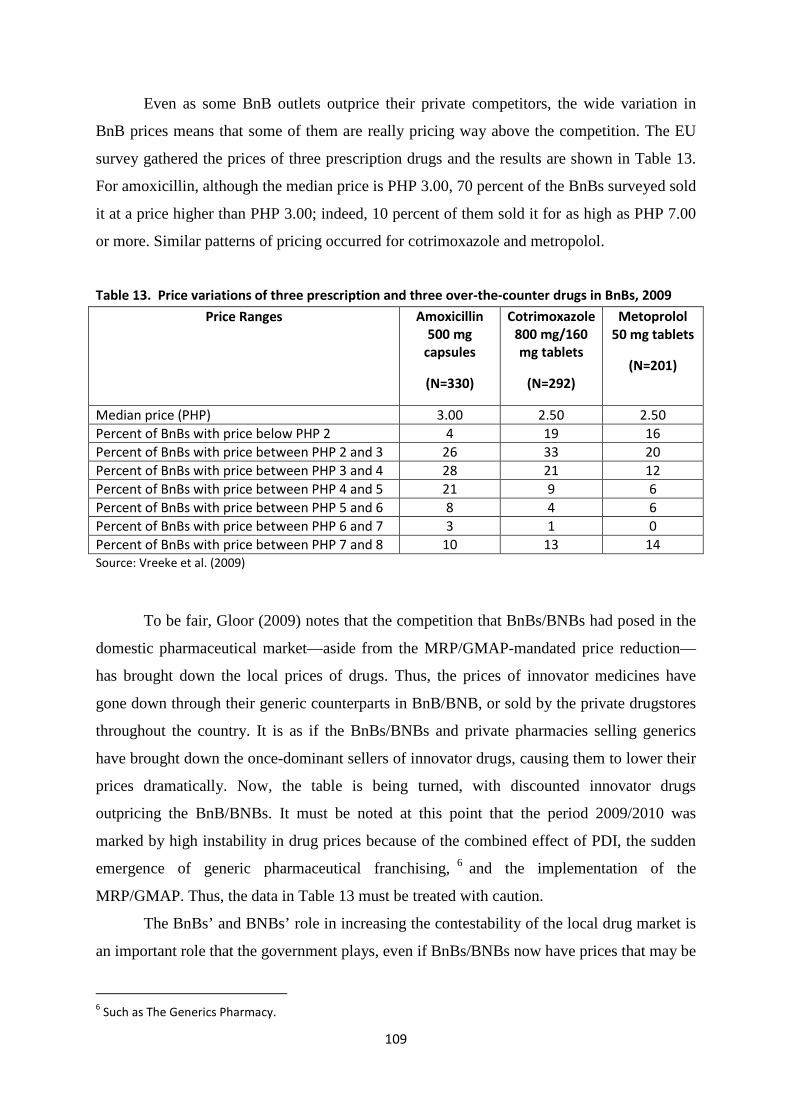
109
Even as some BnB outlets outprice their private competitors, the wide variation in
BnB prices means that some of them are really pricing way above the competition. The EU
survey gathered the prices of three prescription drugs and the results are shown in Table 13.
For amoxicillin, although the median price is PHP 3.00, 70 percent of the BnBs surveyed sold
it at a price higher than PHP 3.00; indeed, 10 percent of them sold it for as high as PHP 7.00
or more. Similar patterns of pricing occurred for cotrimoxazole and metropolol.
Table 13. Price variations of three prescription and three over-the-counter drugs in BnBs, 2009
Price Ranges Amoxicillin 500 mg
capsules
(N=330)
Cotrimoxazole 800 mg/160 mg tablets
(N=292)
Metoprolol 50 mg tablets
(N=201)
Median price (PHP) 3.00 2.50 2.50 Percent of BnBs with price below PHP 2 4 19 16 Percent of BnBs with price between PHP 2 and 3 26 33 20 Percent of BnBs with price between PHP 3 and 4 28 21 12 Percent of BnBs with price between PHP 4 and 5 21 9 6 Percent of BnBs with price between PHP 5 and 6 8 4 6 Percent of BnBs with price between PHP 6 and 7 3 1 0 Percent of BnBs with price between PHP 7 and 8 10 13 14 Source: Vreeke et al. (2009)
To be fair, Gloor (2009) notes that the competition that BnBs/BNBs had posed in the
domestic pharmaceutical market—aside from the MRP/GMAP-mandated price reduction—
has brought down the local prices of drugs. Thus, the prices of innovator medicines have
gone down through their generic counterparts in BnB/BNB, or sold by the private drugstores
throughout the country. It is as if the BnBs/BNBs and private pharmacies selling generics
have brought down the once-dominant sellers of innovator drugs, causing them to lower their
prices dramatically. Now, the table is being turned, with discounted innovator drugs
outpricing the BnB/BNBs. It must be noted at this point that the period 2009/2010 was
marked by high instability in drug prices because of the combined effect of PDI, the sudden
emergence of generic pharmaceutical franchising, 6 and the implementation of the
MRP/GMAP. Thus, the data in Table 13 must be treated with caution.
The BnBs’ and BNBs’ role in increasing the contestability of the local drug market is
an important role that the government plays, even if BnBs/BNBs now have prices that may be
6 Such as The Generics Pharmacy.
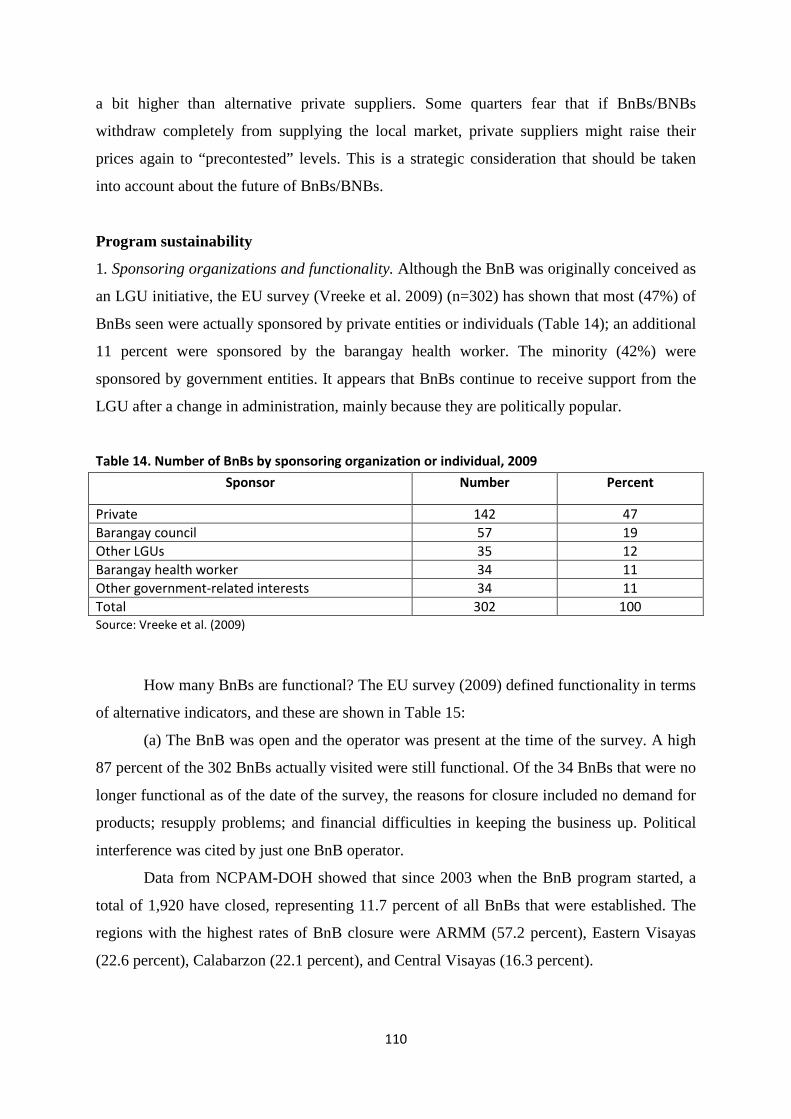
110
a bit higher than alternative private suppliers. Some quarters fear that if BnBs/BNBs
withdraw completely from supplying the local market, private suppliers might raise their
prices again to “precontested” levels. This is a strategic consideration that should be taken
into account about the future of BnBs/BNBs.
Program sustainability
1. Sponsoring organizations and functionality. Although the BnB was originally conceived as
an LGU initiative, the EU survey (Vreeke et al. 2009) (n=302) has shown that most (47%) of
BnBs seen were actually sponsored by private entities or individuals (Table 14); an additional
11 percent were sponsored by the barangay health worker. The minority (42%) were
sponsored by government entities. It appears that BnBs continue to receive support from the
LGU after a change in administration, mainly because they are politically popular.
Table 14. Number of BnBs by sponsoring organization or individual, 2009
Sponsor Number Percent
Private 142 47 Barangay council 57 19 Other LGUs 35 12 Barangay health worker 34 11 Other government-related interests 34 11 Total 302 100 Source: Vreeke et al. (2009)
How many BnBs are functional? The EU survey (2009) defined functionality in terms
of alternative indicators, and these are shown in Table 15:
(a) The BnB was open and the operator was present at the time of the survey. A high
87 percent of the 302 BnBs actually visited were still functional. Of the 34 BnBs that were no
longer functional as of the date of the survey, the reasons for closure included no demand for
products; resupply problems; and financial difficulties in keeping the business up. Political
interference was cited by just one BnB operator.
Data from NCPAM-DOH showed that since 2003 when the BnB program started, a
total of 1,920 have closed, representing 11.7 percent of all BnBs that were established. The
regions with the highest rates of BnB closure were ARMM (57.2 percent), Eastern Visayas
(22.6 percent), Calabarzon (22.1 percent), and Central Visayas (16.3 percent).
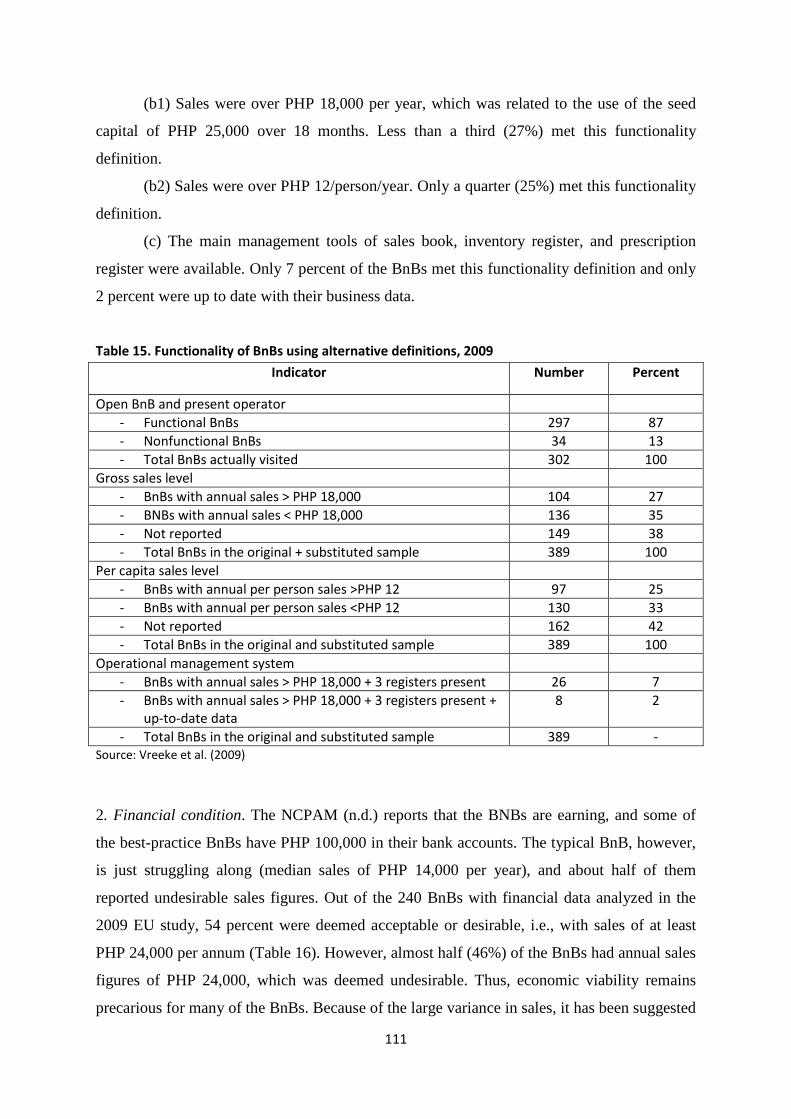
111
(b1) Sales were over PHP 18,000 per year, which was related to the use of the seed
capital of PHP 25,000 over 18 months. Less than a third (27%) met this functionality
definition.
(b2) Sales were over PHP 12/person/year. Only a quarter (25%) met this functionality
definition.
(c) The main management tools of sales book, inventory register, and prescription
register were available. Only 7 percent of the BnBs met this functionality definition and only
2 percent were up to date with their business data.
Table 15. Functionality of BnBs using alternative definitions, 2009
Indicator Number Percent
Open BnB and present operator - Functional BnBs 297 87 - Nonfunctional BnBs 34 13 - Total BnBs actually visited 302 100
Gross sales level - BnBs with annual sales > PHP 18,000 104 27 - BNBs with annual sales < PHP 18,000 136 35 - Not reported 149 38 - Total BnBs in the original + substituted sample 389 100
Per capita sales level - BnBs with annual per person sales >PHP 12 97 25 - BnBs with annual per person sales <PHP 12 130 33 - Not reported 162 42 - Total BnBs in the original and substituted sample 389 100
Operational management system - BnBs with annual sales > PHP 18,000 + 3 registers present 26 7 - BnBs with annual sales > PHP 18,000 + 3 registers present +
up-to-date data 8 2
- Total BnBs in the original and substituted sample 389 - Source: Vreeke et al. (2009)
2. Financial condition. The NCPAM (n.d.) reports that the BNBs are earning, and some of
the best-practice BnBs have PHP 100,000 in their bank accounts. The typical BnB, however,
is just struggling along (median sales of PHP 14,000 per year), and about half of them
reported undesirable sales figures. Out of the 240 BnBs with financial data analyzed in the
2009 EU study, 54 percent were deemed acceptable or desirable, i.e., with sales of at least
PHP 24,000 per annum (Table 16). However, almost half (46%) of the BnBs had annual sales
figures of PHP 24,000, which was deemed undesirable. Thus, economic viability remains
precarious for many of the BnBs. Because of the large variance in sales, it has been suggested
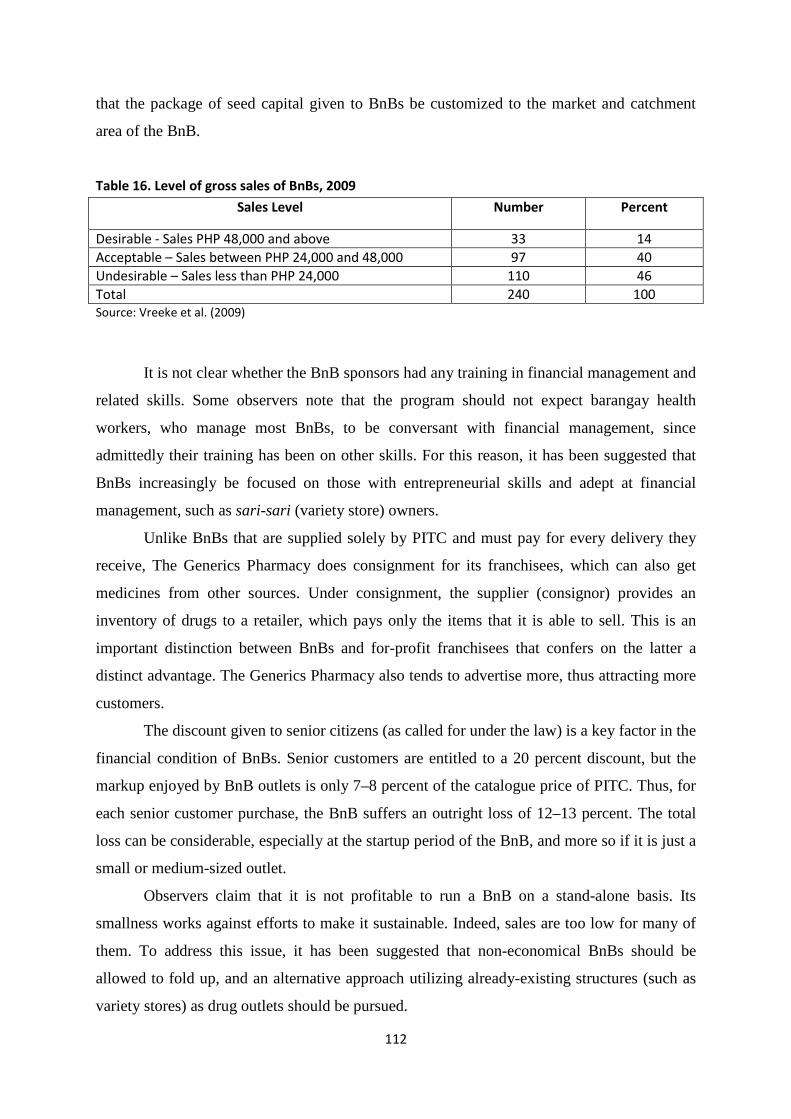
112
that the package of seed capital given to BnBs be customized to the market and catchment
area of the BnB.
Table 16. Level of gross sales of BnBs, 2009
Sales Level Number Percent
Desirable - Sales PHP 48,000 and above 33 14 Acceptable – Sales between PHP 24,000 and 48,000 97 40 Undesirable – Sales less than PHP 24,000 110 46 Total 240 100 Source: Vreeke et al. (2009)
It is not clear whether the BnB sponsors had any training in financial management and
related skills. Some observers note that the program should not expect barangay health
workers, who manage most BnBs, to be conversant with financial management, since
admittedly their training has been on other skills. For this reason, it has been suggested that
BnBs increasingly be focused on those with entrepreneurial skills and adept at financial
management, such as sari-sari (variety store) owners.
Unlike BnBs that are supplied solely by PITC and must pay for every delivery they
receive, The Generics Pharmacy does consignment for its franchisees, which can also get
medicines from other sources. Under consignment, the supplier (consignor) provides an
inventory of drugs to a retailer, which pays only the items that it is able to sell. This is an
important distinction between BnBs and for-profit franchisees that confers on the latter a
distinct advantage. The Generics Pharmacy also tends to advertise more, thus attracting more
customers.
The discount given to senior citizens (as called for under the law) is a key factor in the
financial condition of BnBs. Senior customers are entitled to a 20 percent discount, but the
markup enjoyed by BnB outlets is only 7–8 percent of the catalogue price of PITC. Thus, for
each senior customer purchase, the BnB suffers an outright loss of 12–13 percent. The total
loss can be considerable, especially at the startup period of the BnB, and more so if it is just a
small or medium-sized outlet.
Observers claim that it is not profitable to run a BnB on a stand-alone basis. Its
smallness works against efforts to make it sustainable. Indeed, sales are too low for many of
them. To address this issue, it has been suggested that non-economical BnBs should be
allowed to fold up, and an alternative approach utilizing already-existing structures (such as
variety stores) as drug outlets should be pursued.
113
3. Market competition. The BnBs have had important demonstration effects. Realizing that
low-cost retail of drugs can be profitable (as shown by the best BnBs), for-profit drug
franchise operations have mushroomed quickly, most notably The Generics Pharmacy, the
first generics retail pharmacy to franchise in the Philippines. It is now reputed to have 1,100
franchisees nationwide (as of June 2011) and is the fastest-growing drugstore in the country.
For-profit franchise upstarts that followed in its wake include K2 Drugs, Pharmaquick 24,
Emmaflor, and Johnston Drugs. The Watsons Drugstore chain has also branched out rapidly,
with 247 pharmacies nationwide. The BnB idea itself branched out to the larger Botika ng
Bayan (BNB), which operates on the same franchise format as its private sector counterparts.
Despite the still precarious situation of BnBs, the Drugstore Association of the Philippines
now views them as undue competition.
Overall assessment and operational recommendations
The BnB program has rapidly grown in terms of number, but the systems requirements to
make the BnBs effective, efficient, and sustainable have lagged behind. In January 2011, the
DOH placed a moratorium on additional BnBs, until the systems problems are fixed. The
following problem areas need particular attention:
(a) To stabilize the supply and prices of drugs in BnBs, the DOH is considering
alternative options to pool procurements, impose order, and monitor drug quality. The
National Center for Pharmaceutical Access and Management (NCPAM), working in tandem
with the CHDs, plans to identify and formulate a list of legitimate drug suppliers that will be
allowed to supply quality drugs to BnBs at the prices set by DOH. BnB operators will not be
allowed to obtain supplies outside of those on the list.
(b) New location strategies need to be formulated on account of emerging competition
from the private sector. The BnBs should focus on really poor but viable areas, and the
budget request for additional BnBs should reflect these concerns. Moreover, a new set of
criteria should be set to determine the location of new BnBs, including the distance of the
closest BnB, the location of other (private) retail outlets, population size in the catchment
area of the BnB, and economic and poverty conditions in the area.
(c) Capacity building of BnB operators need to be given more prominence. Skills in
basic drug retail management, pharmaceutical operations, stock and inventory management,
and accounting and record-keeping should be given priority. DOH is partnering with the
Philippine Pharmacists Association to provide training on “pharma-preneurship” and good
114
pharmaceutical practices. NCPAM plans to come up with a standard training manual for BnB
operators.
(d) CHD supervision is key to ensuring the viability of BnBs. Toward this end, the
supervising pharmacists shall be required to monitor the income of the BnBs to help the
regional CHDs target their assistance.
(e) The AO establishing the BnB program has to be revamped. NCPAM is now
finalizing the revised guidelines for the BnB program, addressing such issues as drug re-
supply, the need for pharmacist services, and other operational issues. NCPAM also needs to
rethink the overall strategy for the BnBs given the changed market for pharmaceuticals with
the recent entry of private local suppliers, the viability and long-term sustainability of BnBs,
the cost-effectiveness of the traditional village pharmacy model, and alternative models that
could be considered.
(f) For BnBs that have matured beyond their original mandate, and have good
financial and operational management practices, NCPAM intends to assist them become
licensed as regular pharmacies. The benchmark is that they should reach an income level
close to the average income of a small private retail outlet.
Despite the current problems, the BnB program provides a strong signal from
government of its commitment to promote affordable and quality drugs. The role of BnBs
and BNBs in reducing prices through competition is an important consideration. These
outlets have helped ease the contestability of the local drug market, which used to be
dominated by one large chain store. There are well-founded fears that the drastic reduction, if
not complete stoppage, of the BnB program could signal to the private sector to resume high-
price regimes since there is no longer competition.
The smallness of the BnB as an economic enterprise can be addressed if it is allowed
to operate also as a sari-sari (variety) store. More to the point, rural drug distribution should
be restrategized to tap already-existing rural stores, which can then sell OTC drugs on the
side. Along this thrust, a pooling or aggregator mechanism can be more easily employed to
join together the resupply mechanisms of a group of sari-sari stores, following the logistics
mechanism of the other products that they sell.
Proposal for program impact evaluation
With existing data, it is impossible to isolate the impact of the parallel drug importation and
the involvement of PITC in logistics on BnB operations, costs, and effectiveness. Current
comparisons between BnB and alternative (private) retail sources of drugs are erroneous
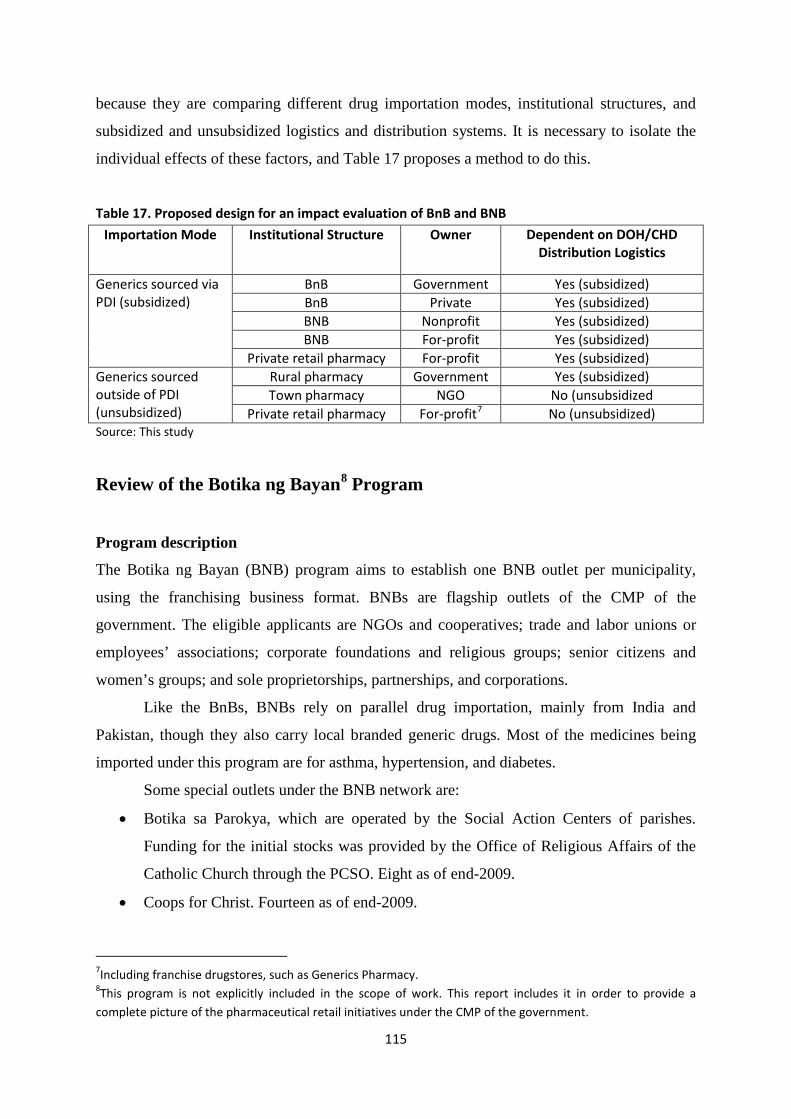
115
because they are comparing different drug importation modes, institutional structures, and
subsidized and unsubsidized logistics and distribution systems. It is necessary to isolate the
individual effects of these factors, and Table 17 proposes a method to do this.
Table 17. Proposed design for an impact evaluation of BnB and BNB
Importation Mode Institutional Structure Owner Dependent on DOH/CHD Distribution Logistics
Generics sourced via PDI (subsidized)
BnB Government Yes (subsidized) BnB Private Yes (subsidized) BNB Nonprofit Yes (subsidized) BNB For-profit Yes (subsidized)
Private retail pharmacy For-profit Yes (subsidized) Generics sourced outside of PDI (unsubsidized)
Rural pharmacy Government Yes (subsidized) Town pharmacy NGO No (unsubsidized
Private retail pharmacy For-profit7 No (unsubsidized) Source: This study
Review of the Botika ng Bayan8 Program
Program description
The Botika ng Bayan (BNB) program aims to establish one BNB outlet per municipality,
using the franchising business format. BNBs are flagship outlets of the CMP of the
government. The eligible applicants are NGOs and cooperatives; trade and labor unions or
employees’ associations; corporate foundations and religious groups; senior citizens and
women’s groups; and sole proprietorships, partnerships, and corporations.
Like the BnBs, BNBs rely on parallel drug importation, mainly from India and
Pakistan, though they also carry local branded generic drugs. Most of the medicines being
imported under this program are for asthma, hypertension, and diabetes.
Some special outlets under the BNB network are:
• Botika sa Parokya, which are operated by the Social Action Centers of parishes.
Funding for the initial stocks was provided by the Office of Religious Affairs of the
Catholic Church through the PCSO. Eight as of end-2009.
• Coops for Christ. Fourteen as of end-2009.
7Including franchise drugstores, such as Generics Pharmacy. 8This program is not explicitly included in the scope of work. This report includes it in order to provide a complete picture of the pharmaceutical retail initiatives under the CMP of the government.
116
• Military and police outlets, which are operated respectively by the Armed Forces of
the Philippines Commissary and the Philippine National Police Service Stores. Six as
of end-2009.
• Philippine Government Employees Association outlets. Nine as of end-2009.
• State colleges and universities outlet. One in Cavite as of end-2009.
• LGU outlets. Six as of end-2009, in the provinces of Cavite, Mindoro Oriental,
Zamboanga Sibugay, and Sulu; and in the cities of Malolos (Bulacan) and Ozamis
(Misamis Occidental).
The requirements for prequalification are: valid and current registration as an
institution (Securities and Exchange Commission, Cooperative Development Authority,
Department of Labor, or other relevant agency); minimum revolving capital of PHP 500,0009
for the project as evidenced by a certification issued by an authorized bank; proposed location
plan (floor area of at least 15 sq m) and vicinity map; and capability to comply with the
documentation, technical and other requirements of FDA in the filing of application for a
license to operate as a drugstore, including the availability of the services of a licensed
pharmacist.
The BNB proponent signs a memorandum of agreement with the PITC stipulating the
following key terms and conditions:
• PITC will supply all drugs and medicines and other consumer products, which will be
sold in the BNB outlet. No other products will be sold by the BNB. The BNB outlet
must maintain the following monthly purchase of drugs from PITC:
o PHP 10,000 for BNBs in 1st–5th class cities or 1st class municipalities;
o PHP 7,500 for BNBs in 6th class cities or 2nd– 4th class municipalities; and
o PHP 5,000 for BNBs in 5th– 6th class municipalities.
• The BNB will sell the drugs at no more than the prescribed MRP (or GMAP).
Violation of this condition will allow PITC to revoke the accreditation of the BNB as
participant in the program. BNB outlets will be required to provide qualified senior
citizens with the standard price discount in accordance with existing laws.
• PITC will arrange training support to the supervising pharmacist and other BNB
personnel.
9Minimum initial capital was originally set at PHP 300,000 for 1st–5th class cities or 1st class municipalities; PHP 200,000 for 6th class cities or 2nd–4th class municipalities; and PHP 100,000 for 5th–6th class municipalities.
117
• PITC will arrange for standard signages, collaterals, and product lists in the retail
outlets.
• PITC will provide BNB outlets with certificates of product registration as well as
BFAD/FDA reports of analysis for all batches of drug supplies delivered.
• For all deliveries from PITC or its designated distributor, the BNB will pay in full
through a thirty-day postdated check. Late payments are subject to an interest rate of 2
percent per month. Failure to remit payments for previous deliveries will allow PITC
to withhold processing of follow-up orders.
• Returns or exchanges of products delivered by PITC are allowed only within seven
working days from the date of the delivery. Returns are accepted only in cases of
defective or tampered packaging; inability of PITC to provide the required certificate
or product registration or report of analysis of the batches or lots delivered; and when
the remaining shelf or usable life of the product is less than six months.
In turn, the BNB operator agrees to (a) provide the initial capitalization of the outlet
and the inventory of medicines to be sold; (b) shoulder the overhead, manpower, legal, and
other expenses required to operate the outlet; (c) purchase the standard program signage and
other collaterals from PITC for use in the outlet; (d) display, in a prominent location and
within sight of consumers, the product list and MRPs, the license to operate, and the
certificate of accreditation; (e) when requested, and subject to further negotiation, share in the
expenses for marketing and advertising support for the program; and (f) comply with the
reporting and monitoring requirements which may be instituted by PITC and DOH/FDA in
connection with the program. Following the issuance of BFAD/FDA of the license to operate,
the operator posts a surety bond of PHP 500,000 in favor of PITC to guarantee faithful
compliance with the terms and conditions of the program.
The BNB idea itself has evolved into a derivative format called BNB Express, which
requires a smaller investment (PHP 30,000) for the initial set of medical stocks. BNB
Expresses are also privately run outlets. They are supervised by an institutional pharmacist or
a territorial one who goes around similar BNBs.
Program performance
1. Extent of BNBs. Since the program started in 2005, the cumulative number of BNBs has
continued to rise, peaking at 2,256 in 2010 (Figure 7). However, the annual addition to BNBs
has declined from a peak of 347 in 2007 to only 61 in 2010.
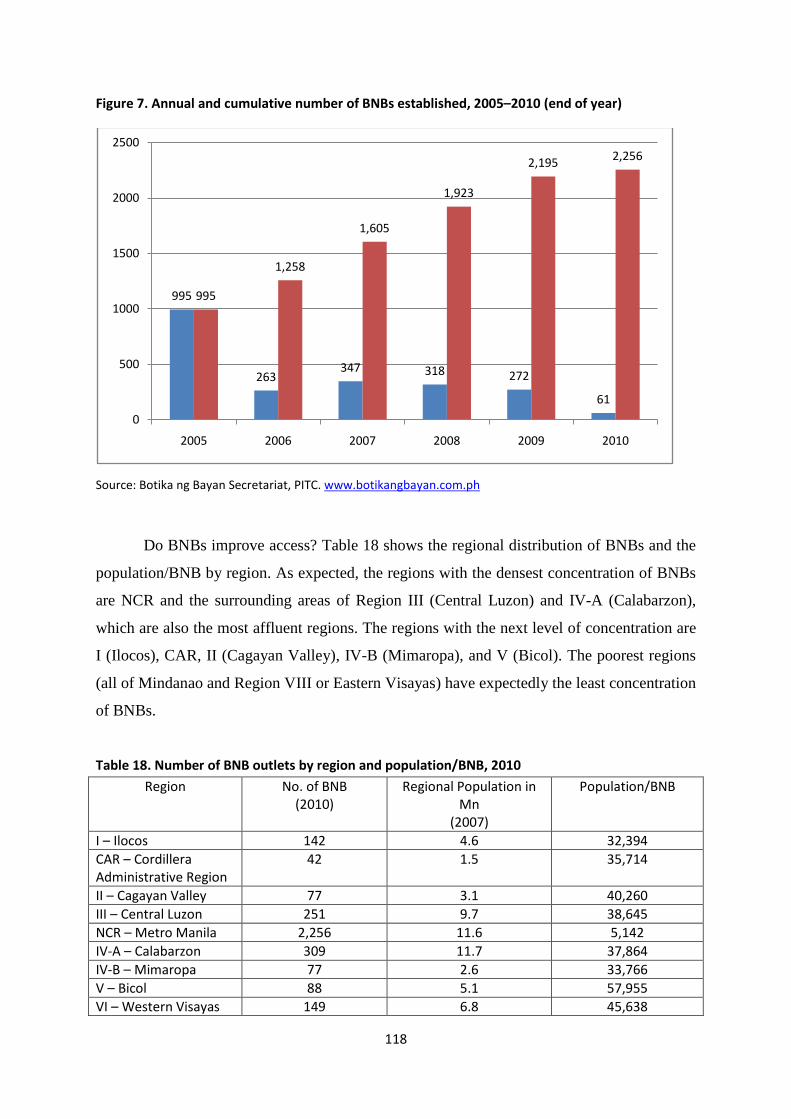
118
Figure 7. Annual and cumulative number of BNBs established, 2005–2010 (end of year)
Source: Botika ng Bayan Secretariat, PITC. www.botikangbayan.com.ph
Do BNBs improve access? Table 18 shows the regional distribution of BNBs and the
population/BNB by region. As expected, the regions with the densest concentration of BNBs
are NCR and the surrounding areas of Region III (Central Luzon) and IV-A (Calabarzon),
which are also the most affluent regions. The regions with the next level of concentration are
I (Ilocos), CAR, II (Cagayan Valley), IV-B (Mimaropa), and V (Bicol). The poorest regions
(all of Mindanao and Region VIII or Eastern Visayas) have expectedly the least concentration
of BNBs.
Table 18. Number of BNB outlets by region and population/BNB, 2010
Region No. of BNB (2010)
Regional Population in Mn
(2007)
Population/BNB
I – Ilocos 142 4.6 32,394 CAR – Cordillera Administrative Region
42 1.5 35,714
II – Cagayan Valley 77 3.1 40,260 III – Central Luzon 251 9.7 38,645 NCR – Metro Manila 2,256 11.6 5,142 IV-A – Calabarzon 309 11.7 37,864 IV-B – Mimaropa 77 2.6 33,766 V – Bicol 88 5.1 57,955 VI – Western Visayas 149 6.8 45,638
995
263347 318 272
61
995
1,258
1,605
1,923
2,195 2,256
0
500
1000
1500
2000
2500
2005 2006 2007 2008 2009 2010

119
VII – Central Visayas 101 6.4 63,366 VIII – Eastern Visayas 42 3.9 92,857 IX – Zamboanga Peninsula
41 3.2 78,049
X – Northern Mindanao
35 4.0 114,286
XI – Davao 53 4.2 79,245 XII – Soccsksargen 44 3.8 86,364 Caraga 22 2.3 104,545 ARMM 10 4.1 410,000 Total 2,256 88.6 39,273 Source of basic data: BNB Secretariat; Philippine Statistical Yearbook (2010)
The BNB target is to have one BNB for each city or municipality. Given this program
target, Figure 8 shows the percentage of cities and municipalities in each region with a BNB.
At end-2010, it was estimated that around 1,000 municipalities were not yet served by a
BNB.
Figure 8. Percentage of cities and municipalities with BNB, by region, as of May 2010
Source: Lavado (2011)
2. Rational drug use. The BNB drugs were also selected based on the most prevalent causes
of mortality and morbidity, not on DALYs, which are the more accurate and appropriate basis
for drug selection. Nevertheless, because BNBs offer a wider selection of drugs (including
6.8 9.1 1115.1 16.1
26.5 29.2 31.838.6 39.1 40 41.6 43 43.8
60 63.4
100
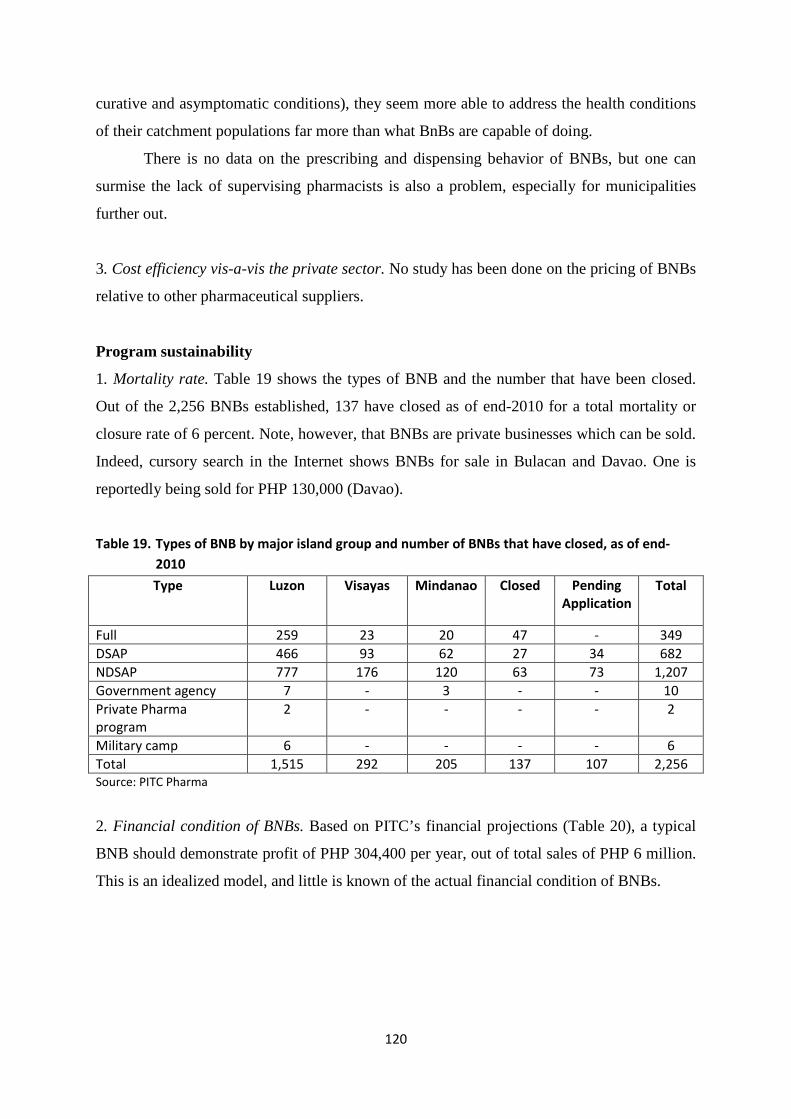
120
curative and asymptomatic conditions), they seem more able to address the health conditions
of their catchment populations far more than what BnBs are capable of doing.
There is no data on the prescribing and dispensing behavior of BNBs, but one can
surmise the lack of supervising pharmacists is also a problem, especially for municipalities
further out.
3. Cost efficiency vis-a-vis the private sector. No study has been done on the pricing of BNBs
relative to other pharmaceutical suppliers.
Program sustainability
1. Mortality rate. Table 19 shows the types of BNB and the number that have been closed.
Out of the 2,256 BNBs established, 137 have closed as of end-2010 for a total mortality or
closure rate of 6 percent. Note, however, that BNBs are private businesses which can be sold.
Indeed, cursory search in the Internet shows BNBs for sale in Bulacan and Davao. One is
reportedly being sold for PHP 130,000 (Davao).
Table 19. Types of BNB by major island group and number of BNBs that have closed, as of end-2010
Type Luzon Visayas Mindanao Closed Pending Application
Total
Full 259 23 20 47 - 349 DSAP 466 93 62 27 34 682 NDSAP 777 176 120 63 73 1,207 Government agency 7 - 3 - - 10 Private Pharma program
2 - - - - 2
Military camp 6 - - - - 6 Total 1,515 292 205 137 107 2,256 Source: PITC Pharma
2. Financial condition of BNBs. Based on PITC’s financial projections (Table 20), a typical
BNB should demonstrate profit of PHP 304,400 per year, out of total sales of PHP 6 million.
This is an idealized model, and little is known of the actual financial condition of BNBs.
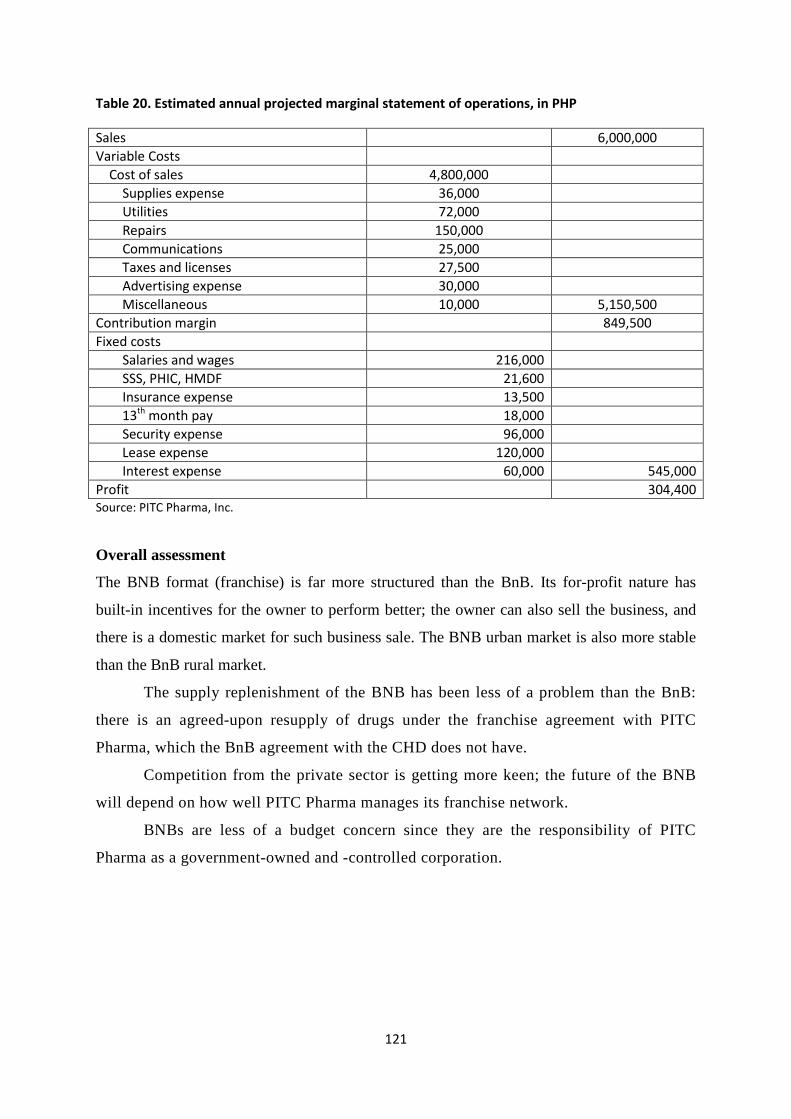
121
Table 20. Estimated annual projected marginal statement of operations, in PHP
Sales 6,000,000 Variable Costs Cost of sales 4,800,000 Supplies expense 36,000 Utilities 72,000 Repairs 150,000 Communications 25,000 Taxes and licenses 27,500 Advertising expense 30,000 Miscellaneous 10,000 5,150,500 Contribution margin 849,500 Fixed costs Salaries and wages 216,000 SSS, PHIC, HMDF 21,600 Insurance expense 13,500 13th month pay 18,000 Security expense 96,000 Lease expense 120,000 Interest expense 60,000 545,000 Profit 304,400 Source: PITC Pharma, Inc.
Overall assessment
The BNB format (franchise) is far more structured than the BnB. Its for-profit nature has
built-in incentives for the owner to perform better; the owner can also sell the business, and
there is a domestic market for such business sale. The BNB urban market is also more stable
than the BnB rural market.
The supply replenishment of the BNB has been less of a problem than the BnB:
there is an agreed-upon resupply of drugs under the franchise agreement with PITC
Pharma, which the BnB agreement with the CHD does not have.
Competition from the private sector is getting more keen; the future of the BNB
will depend on how well PITC Pharma manages its franchise network.
BNBs are less of a budget concern since they are the responsibility of PITC
Pharma as a government-owned and -controlled corporation.
122
Review of the PHP100 Treatment Pack Program
Program description
The PHP100 treatment pack program solves two constraints in pharmacy prescription at the
same time. On the one hand, compliance packaging helps address the need for patients to
adhere to their medication schedule. This is a practice that has been in place in long-term care
pharmacies in developed countries for years. On the other hand, “tipid” (thrift) packs have
increasingly been used in the Philippines for the marketing of products such as shampoo,
detergents, cooking oil, cell phone load, cigarettes, and alcoholic drinks. Thus, the PHP100
treatment pack combines these two concepts in an innovative marketing approach that takes
into cognizance both the medical necessity of drug compliance as well as households’ ability
to pay for drugs.
The PHP100 treatment pack was patterned after the Walmart USD4 Prescription
Program for Americans without health insurance. This program now has 300 drugs.
The DOH initiated the PHP100 Treatment Pack10 ( PHP100 for short, and also known
as the “Tipid” or Thrift Pack) Program in December 2008 to widen people’s access to
prepackaged generic drugs with an affordability limit of PHP100 or lower. The intention is
to encourage patients to take the full course of their drug treatment regimen (i.e., improve
compliance), instead of patients buying them in individual tablets or capsules that end up
being more expensive and often leads to discontinuance once the patient feels well enough.
The drugs are packaged in a full set. Thus, the program meets two key pharmaceutical
objectives at once: (a) improving the availability of quality-assured drugs at affordable prices,
and (b) promoting the rational use of medicines. The program was piloted in 72 DOH-
retained hospitals and 28 LGU hospitals.
The program includes 24 drugs most commonly used, including antibiotics,
antihypercholesterolemia, antiarthritis, antiasthma, antidiabetes, and Vitamin C. Table 21
shows these medicines, their dosages and treatment course, and the common brand. Of the 17
brands on the PHP100 list, five are in the Essential Drug List, the prices of which have gone
down dramatically following the implementation of the MRP/GMAP. In addition, seven
other drugs have since been included in the PHP100 list after the MRP/GMAP was
implemented.
10It is now rebranded as the DOH Complete Treatment Pack Program, to take account of some drug packages that are priced higher or lower than PHP100 per pack.
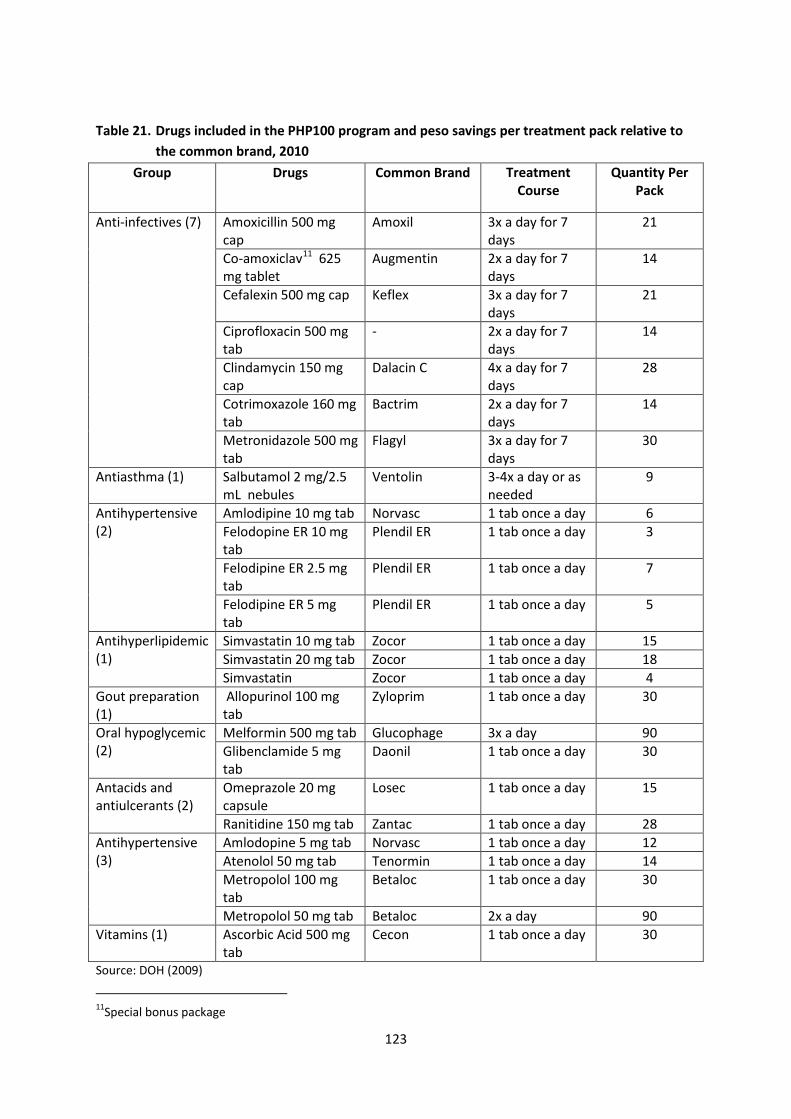
123
Table 21. Drugs included in the PHP100 program and peso savings per treatment pack relative to the common brand, 2010
Group Drugs Common Brand Treatment Course
Quantity Per Pack
Anti-infectives (7) Amoxicillin 500 mg cap
Amoxil 3x a day for 7 days
21
Co-amoxiclav11 625 mg tablet
Augmentin 2x a day for 7 days
14
Cefalexin 500 mg cap Keflex 3x a day for 7 days
21
Ciprofloxacin 500 mg tab
- 2x a day for 7 days
14
Clindamycin 150 mg cap
Dalacin C 4x a day for 7 days
28
Cotrimoxazole 160 mg tab
Bactrim 2x a day for 7 days
14
Metronidazole 500 mg tab
Flagyl 3x a day for 7 days
30
Antiasthma (1) Salbutamol 2 mg/2.5 mL nebules
Ventolin 3-4x a day or as needed
9
Antihypertensive (2)
Amlodipine 10 mg tab Norvasc 1 tab once a day 6 Felodopine ER 10 mg tab
Plendil ER 1 tab once a day 3
Felodipine ER 2.5 mg tab
Plendil ER 1 tab once a day 7
Felodipine ER 5 mg tab
Plendil ER 1 tab once a day 5
Antihyperlipidemic (1)
Simvastatin 10 mg tab Zocor 1 tab once a day 15 Simvastatin 20 mg tab Zocor 1 tab once a day 18 Simvastatin Zocor 1 tab once a day 4
Gout preparation (1)
Allopurinol 100 mg tab
Zyloprim 1 tab once a day 30
Oral hypoglycemic (2)
Melformin 500 mg tab Glucophage 3x a day 90 Glibenclamide 5 mg tab
Daonil 1 tab once a day 30
Antacids and antiulcerants (2)
Omeprazole 20 mg capsule
Losec 1 tab once a day 15
Ranitidine 150 mg tab Zantac 1 tab once a day 28 Antihypertensive (3)
Amlodopine 5 mg tab Norvasc 1 tab once a day 12 Atenolol 50 mg tab Tenormin 1 tab once a day 14 Metropolol 100 mg tab
Betaloc 1 tab once a day 30
Metropolol 50 mg tab Betaloc 2x a day 90 Vitamins (1) Ascorbic Acid 500 mg
tab Cecon 1 tab once a day 30
Source: DOH (2009)
11Special bonus package
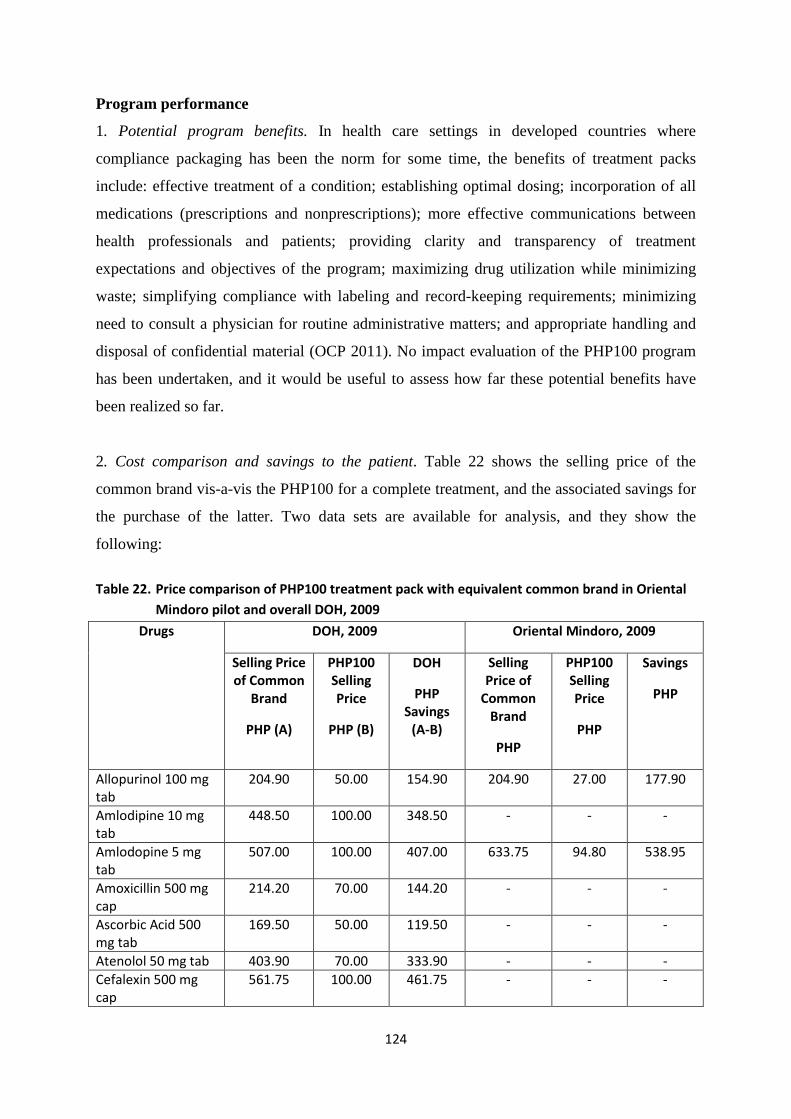
124
Program performance
1. Potential program benefits. In health care settings in developed countries where
compliance packaging has been the norm for some time, the benefits of treatment packs
include: effective treatment of a condition; establishing optimal dosing; incorporation of all
medications (prescriptions and nonprescriptions); more effective communications between
health professionals and patients; providing clarity and transparency of treatment
expectations and objectives of the program; maximizing drug utilization while minimizing
waste; simplifying compliance with labeling and record-keeping requirements; minimizing
need to consult a physician for routine administrative matters; and appropriate handling and
disposal of confidential material (OCP 2011). No impact evaluation of the PHP100 program
has been undertaken, and it would be useful to assess how far these potential benefits have
been realized so far.
2. Cost comparison and savings to the patient. Table 22 shows the selling price of the
common brand vis-a-vis the PHP100 for a complete treatment, and the associated savings for
the purchase of the latter. Two data sets are available for analysis, and they show the
following:
Table 22. Price comparison of PHP100 treatment pack with equivalent common brand in Oriental
Mindoro pilot and overall DOH, 2009
Drugs DOH, 2009 Oriental Mindoro, 2009
Selling Price of Common
Brand
PHP (A)
PHP100 Selling Price
PHP (B)
DOH
PHP Savings
(A-B)
Selling Price of
Common Brand
PHP
PHP100 Selling Price
PHP
Savings
PHP
Allopurinol 100 mg tab
204.90 50.00 154.90 204.90 27.00 177.90
Amlodipine 10 mg tab
448.50 100.00 348.50 - - -
Amlodopine 5 mg tab
507.00 100.00 407.00 633.75 94.80 538.95
Amoxicillin 500 mg cap
214.20 70.00 144.20 - - -
Ascorbic Acid 500 mg tab
169.50 50.00 119.50 - - -
Atenolol 50 mg tab 403.90 70.00 333.90 - - - Cefalexin 500 mg cap
561.75 100.00 461.75 - - -
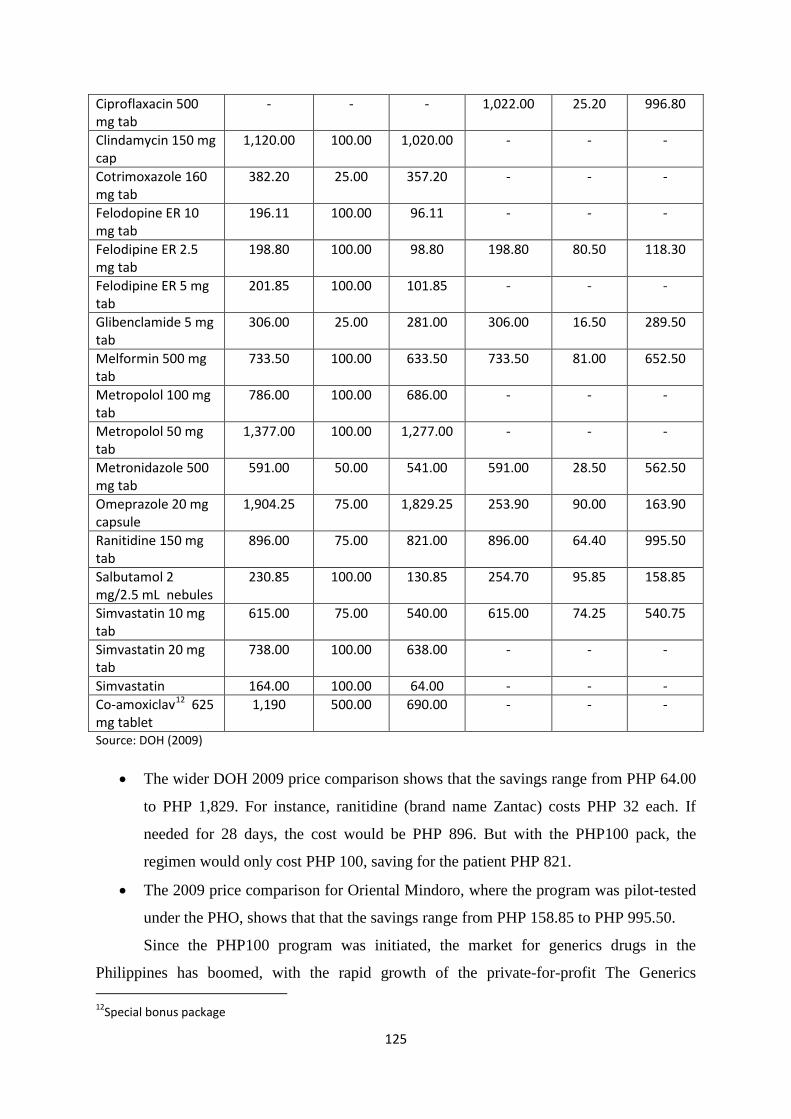
125
Ciproflaxacin 500 mg tab
- - - 1,022.00 25.20 996.80
Clindamycin 150 mg cap
1,120.00 100.00 1,020.00 - - -
Cotrimoxazole 160 mg tab
382.20 25.00 357.20 - - -
Felodopine ER 10 mg tab
196.11 100.00 96.11 - - -
Felodipine ER 2.5 mg tab
198.80 100.00 98.80 198.80 80.50 118.30
Felodipine ER 5 mg tab
201.85 100.00 101.85 - - -
Glibenclamide 5 mg tab
306.00 25.00 281.00 306.00 16.50 289.50
Melformin 500 mg tab
733.50 100.00 633.50 733.50 81.00 652.50
Metropolol 100 mg tab
786.00 100.00 686.00 - - -
Metropolol 50 mg tab
1,377.00 100.00 1,277.00 - - -
Metronidazole 500 mg tab
591.00 50.00 541.00 591.00 28.50 562.50
Omeprazole 20 mg capsule
1,904.25 75.00 1,829.25 253.90 90.00 163.90
Ranitidine 150 mg tab
896.00 75.00 821.00 896.00 64.40 995.50
Salbutamol 2 mg/2.5 mL nebules
230.85 100.00 130.85 254.70 95.85 158.85
Simvastatin 10 mg tab
615.00 75.00 540.00 615.00 74.25 540.75
Simvastatin 20 mg tab
738.00 100.00 638.00 - - -
Simvastatin 164.00 100.00 64.00 - - - Co-amoxiclav12 625 mg tablet
1,190 500.00 690.00 - - -
Source: DOH (2009)
• The wider DOH 2009 price comparison shows that the savings range from PHP 64.00
to PHP 1,829. For instance, ranitidine (brand name Zantac) costs PHP 32 each. If
needed for 28 days, the cost would be PHP 896. But with the PHP100 pack, the
regimen would only cost PHP 100, saving for the patient PHP 821.
• The 2009 price comparison for Oriental Mindoro, where the program was pilot-tested
under the PHO, shows that that the savings range from PHP 158.85 to PHP 995.50.
Since the PHP100 program was initiated, the market for generics drugs in the
Philippines has boomed, with the rapid growth of the private-for-profit The Generics 12Special bonus package
126
Pharmacy as well as similar generic compliance-pack initiatives of the private pharmacy
chain Watsons (using Pharex products) and Rite-Med branded generics (using Unilab
products). Thus, price comparison of the PHP100 treatment pack should also be made with
these newer initiatives.
3. Beneficiaries. The PHP100 packs are dispensed at DOH-retained and selected LGU
hospitals, which are mostly patronized by the poor and lower middle class. However, there
has been poor record-keeping of those who had actually obtained these treatment packs. If the
program is to be targeted better, a tracking system needs to be put in place.
There have been allegations of leakage, with sporadic anecdotal accounts of
“balikbayans” (returning Filipino expatriates) purchasing large volumes of PHP100 packs to
be brought home. There is no available data on the volume of this leakage.
This program was rebranded as the DOH Complete Treatment Pack Program, and
beginning 2011, was to branch out into three subprograms with different sets of beneficiaries
as explained below.
4. Rational drug use. The PHP100 treatment pack program was intended to improve
adherence to medication. With its rebranding and relaunch as the DOH Complete Treatment
Pack program, it is envisioned to be offered more widely to indigent Filipinos. Thus,
medications for common acute infections and maintenance drugs for hypertension, diabetes,
and high cholesterol will be provided for free to the poor CCT recipients, on the following
conditions: (a) the patient consults with the RHU physician; (b) the patient has a DSWD ID
number and/or PhilHealth number as being covered under the PHIC Sponsored Program; and
(c) the patient adheres to the regimen prescribed by the RHU doctor and constantly does
follow-up.
5. Delivery challenges. A major criticism of this program is the limited number of access
points. So far, only DOH hospitals and a limited number of LGU hospitals are dispensing
with PHP100 packs. Region VII is considering expansion of this program beyond the existing
access points; other regions may follow suit. However, with the expansion of the delivery
network, stock availability needs to be improved. DOH and regional PHP100 coordinators
will also be necessary. Stock inventory and delivery remain major problems for this program.
Good PHP100 practices have been culled from the experience of Oriental Mindoro,
and these may be worth disseminating. In this province, the PHP100 stocks are delivered
127
through the Regional Store, using the Provincial Hospital Depot. The distribution outlets
include all the government hospitals; the RHUs and BnBs are being eyed as potential outlets.
Promotion is done through trimedia (print, TV, and radio). Support is obtained from all
government health personnel in hospitals, RHUs, and the interlocal health zones.
Finally, the drug list in the PHP100, so far, has been very limited. There is certainly
scope for adding more drugs to this list.
DOH rebranded and relaunched the program in late 2011 to deal with these delivery
challenges. As has been mentioned, the intention is to scale up the program in three ways:
• Providing the treatment packs for free to poor, CCT-receiving families and/or families
deemed indigent and enrolled under the PhilHealth Sponsored Program. DOH will
provide these as a grant to the DSWD-identified 1,021 poor municipalities as part of
the 4Ps/CCT Program. The municipalities’ RHUs will be the program’s access points.
• Selling the treatment packs in participating DOH and LGU hospitals, at allowed
margins inclusive of all applicable discounts. This will ensure the availability of these
drugs to nonpoor patients. Government hospitals may stock these treatment packs in
their pharmacies on a consignment basis. The program could be run as drug revolving
funds at the respective government hospitals.
• Selling the treatment packs in private retail outlets. The NCPAM shall secure
approval from the Department of Finance to allow these sales, exempting the
treatment packs from special discounts and VAT. Private hospitals may also stock
these treatment packs in their pharmacies on a consignment basis.
6. Procurement of treatment packs. The initial supply system was limited to PITC Pharma.
Restocking the hospitals was difficult because of variations in demand/consumption patterns.
PITC Pharma was also beset with operational issues and financial liabilities, which affected
its performance as a procuring agency. With the relaunched treatment pack program,
procurement will be done centrally at DOH-Central Office Bids and Awards Committee
(COBAC) through one-time bidding.
Program sustainability
1. Funding. The DOH initially funded the program with PHP 50 million. Additional technical
and other support was initially provided by WHO, EU, and GTZ. In Oriental Mindoro, the
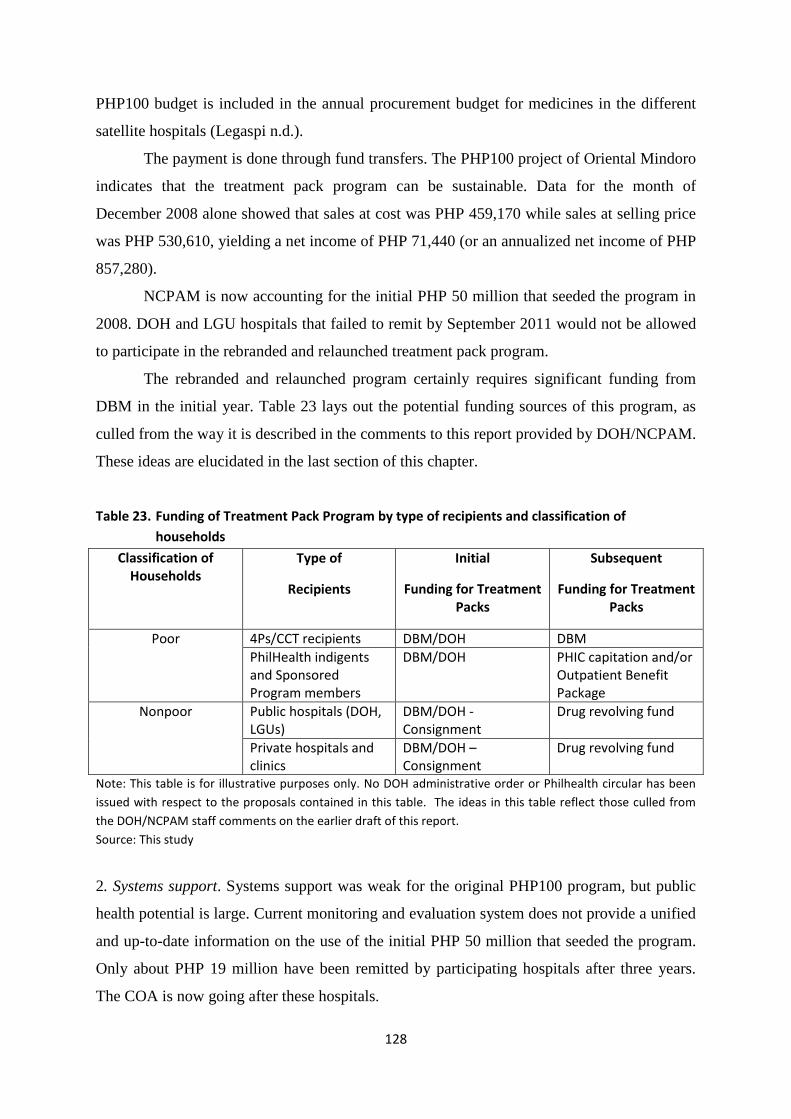
128
PHP100 budget is included in the annual procurement budget for medicines in the different
satellite hospitals (Legaspi n.d.).
The payment is done through fund transfers. The PHP100 project of Oriental Mindoro
indicates that the treatment pack program can be sustainable. Data for the month of
December 2008 alone showed that sales at cost was PHP 459,170 while sales at selling price
was PHP 530,610, yielding a net income of PHP 71,440 (or an annualized net income of PHP
857,280).
NCPAM is now accounting for the initial PHP 50 million that seeded the program in
2008. DOH and LGU hospitals that failed to remit by September 2011 would not be allowed
to participate in the rebranded and relaunched treatment pack program.
The rebranded and relaunched program certainly requires significant funding from
DBM in the initial year. Table 23 lays out the potential funding sources of this program, as
culled from the way it is described in the comments to this report provided by DOH/NCPAM.
These ideas are elucidated in the last section of this chapter.
Table 23. Funding of Treatment Pack Program by type of recipients and classification of households
Classification of Households
Type of
Recipients
Initial
Funding for Treatment Packs
Subsequent
Funding for Treatment Packs
Poor 4Ps/CCT recipients DBM/DOH DBM PhilHealth indigents and Sponsored Program members
DBM/DOH PHIC capitation and/or Outpatient Benefit Package
Nonpoor Public hospitals (DOH, LGUs)
DBM/DOH - Consignment
Drug revolving fund
Private hospitals and clinics
DBM/DOH – Consignment
Drug revolving fund
Note: This table is for illustrative purposes only. No DOH administrative order or Philhealth circular has been issued with respect to the proposals contained in this table. The ideas in this table reflect those culled from the DOH/NCPAM staff comments on the earlier draft of this report. Source: This study
2. Systems support. Systems support was weak for the original PHP100 program, but public
health potential is large. Current monitoring and evaluation system does not provide a unified
and up-to-date information on the use of the initial PHP 50 million that seeded the program.
Only about PHP 19 million have been remitted by participating hospitals after three years.
The COA is now going after these hospitals.
129
Supply replenishment by PITC Pharma also remains a major problem. Part of this
problem is the challenge of pooling the demand requirements among DOH and LGU
hospitals for procurement purposes.
Under the new, rebranded treatment pack program, NCPAM plans to computerize the
reporting and monitoring system from the RHUs by 2012. The program will be designed with
clear reporting, monitoring, and accounting procedures. The RHU physicians will be required
to submit quarterly reports to the CHDs on their distribution and utilization of treatment pack
medicines, as well as their inventory levels. A patient registry will be required to provide
information on patient name, DSWD and/or PhilHealth numbers, diagnosis, and medications
given.
3. Need for drug revolving funds. While the PHP100 program can be sustainable, it requires
drug revolving funds (DRFs) in health facilities for the program (and related fee-generating
schemes such as PhilHealth reimbursements, private health insurance reimbursements, and
user fees) to be truly institutionalized. Without such DRFs and an accompanying fee-
retention policy at the local level, health staff would not be as encouraged to offer PHP100
treatment packs for sale. The problem is that not all LGU health facilities have established
DRFs, and revenues for the PHP100 program are usually plowed back to the local treasury,
reducing the incentive of health staff to collect payments.
This is an area that NCPAM and the CHDs need to focus on. Technical assistance,
capacity building, IT hardware and software support, and training are needed to see this
through. As the relaunched treatment pack program is going to be nationwide, the scale of
this effort is going to be large.
4. Use of treatment pack in PhilHealth capitation. In 2009, PhilHealth, in its Circular No. 20,
extended the coverage of the PHP100 program for its Sponsored Members (indigents) to
include their drug consumption outside the hospital (take-home drugs) so that the patient can
complete the full course of treatment. For chronic illness, this often extends to a maximum of
two weeks’ supply of the appropriate PHP100 pack.
PhilHealth is also considering including the treatment pack as an outpatient benefit
package that can be used by patients of outpatient departments, not only patients who were
admitted. Indeed, PhilHealth should seriously plan for the roll-out of its capitation program,
which should involve both government and private physicians as primary care providers
(PCPs). This capitated PCP program could start with the planned roll-out of the rebranded
130
treatment pack as its outpatient pharmacy benefit, both for one-off treatment and for chronic
care patients. The initial funding is expected to be provided by DBM, but PhilHealth
capitation and outpatient benefit package reimbursements should kick in subsequent years.
A major issue that PhilHealth needs to resolve is the very limited amount that it pays
government RHUs for patients under the Sponsored Program. While the program is deemed
operating on a capitation basis, the current level of PHP 300 is pitifully low that policy
analysts have deemed it a “rebate” or “discount”. This is because it is nowhere near the full
amount of a capitated system, estimated to be around PHP 1,200. PhilHealth needs to
accurately calculate this amount, taking into account the need to cover the cost of the
treatment packs that will be provided as a benefit under its Sponsored Program (for indigents)
and for regular members (if and when it decides to extend the OPB to all its members under a
capitation system).
5. Demonstration effects. Despite problems in the PHP100 program, the model has caused
ripple effects in the private sector. Compliance pack marketing programs have been
established by Unilab’s Rite-Med and Watson’s Pharex. Both of these private sector
programs, however, are still focused on the rich and middle class.
Overall assessment and operational recommendations
The PHP100 program is highly innovative in the Philippine context, with a large potential for
reducing out-of-pocket spending, especially on those drugs dealing with chronic care.
However, the program needs to be redesigned and funded adequately from the government
budget (pump-priming) and the PhilHealth capitation program (sustaining). Moreover,
procurement of drugs should be open to the private sector (under COBAC) and not limited to
PITC Pharma. DOH’s Materials Management Division can be the lead unit as it is doing
outsourcing.
Following the above parameters, the new, rebranded DOH complete treatment pack
program is expected to be the main pharmaceutical procurement activity in government, even
as the BnB program is expected to slow down. The treatment pack program will have the
following main features:
(1) Three separate subprograms can be considered, as explained above:
• Treatment packs to be provided for free to poor, CCT-receiving families and families
deemed indigent and enrolled under the PhilHealth Sponsored Program (Subprogram
1).
131
• Treatment packs to be provided to nonpoor families in participating DOH and LGU
hospitals, at allowed margins inclusive of all applicable discounts (Subprogram 2).
• Treatment packs to be provided to patients in private retail outlets (Subprogram 3).
(2) The supply of treatment pack drugs will be open to bidders (private suppliers + PITC
Pharma), since a healthy market for generic drugs has made this possible. Procurement of
these treatment packs will be done centrally through open bidding. The annual needs of
municipalities have been forecasted based on population and epidemiology. This should be
reconciled with what would be made available by DBM as budget in 2012 and subsequent
years.
The availability of budget will also determine whether the program can expand to
include other chronic diseases (asthma, chronic obstructive pulmonary diseases, and insulin
for diabetes).
(3) DOH and LGU facilities will be provided with the treatment packs as grants under
Subprogram 1 described above. Only facilities that have remitted the sales revenues from the
original PHP100 treatment pack program will be eligible.
DBM will be asked to fund the “pump-priming” program, but PhilHealth should be
asked to roll out its capitation scheme under the Sponsored Program for indigents, with the
treatment pack as centerpiece benefit for about eight million primary members. PhilHealth
and DSWD targeting systems are being harmonized for this purpose.
(4) DOH and LGU hospitals will also be provided with treatment packs under consignment
basis to be used for nonpoor patients, under Subprogram 2 described above. The supply for
this subprogram could similarly be contracted out to the private sector under a bidding
arrangement (for non-PDI drugs). If local generics prices rise, the government has the option
to go back to PDI as an emergency measure. The initial year’s requirements should be funded
by DBM, with the expectation that the subsequent years’ funding should come increasingly
from PhilHealth’s Outpatient Benefit Package, for PhilHealth members.
(5) Finally, private hospitals and clinics could also be provided with treatment packs under a
consignment basis, under Subprogram 3 described above.
132
Review of the Drug Inventory Management System Supporting the
Government Pharmaceutical Programs
Advantages of PITC Pharma procurement
Are PDI medicines procured by PITC Pharma of good quality? According to an assessment
done by the Management Sciences for Health or MHS (n.d.), three factors guarantee the
quality of PDI medicines (MSH n.d.): (a) the drugs are purchased only from the largest and
most reputable distributors in the country where they are imported from; (b) among branded
imports, only branded products manufactured by reputable multinational companies are
procured; and (c) BFAD/FDA and DOH perform laboratory testing on each batch of PDI
drugs using standards stricter than those used for locally made drugs (MSH n.d.). Despite
these assurances, a few key informants for this study raised the issue of bioequivalence in
PDI drugs. This is a technical issue that is beyond the scope of this review.
Aside from low price and assured quality, the other advantages of LGU and DOH
health facilities buying PDIs from PITC Pharma are as follow (MSH n.d.):
(1) No need for bidding. Since PITC Pharma is a government agency, LGUs and DOH can
simply enter into a negotiated contract with PITC.
(2) Value for money. Because of lower prices offered by PITC Pharma, LGUs can maximize
their drug budgets.
(3) Reasonable payment terms. The PITC is prepared to extend credit within a reasonable
time from the date of delivery. In addition, payment is in pesos, not dollars.
The process through which the medicines procured by PITC Pharma are distributed to
the existing government programs is above board. According to an assessment of LGU
procurements done by Wong and Deluna (2001a), the process involves not only PITC
Pharma but hospital retailers as well. Although this assessment is dated, there is little reason
to suppose the process has changed dramatically since 2001:
- Drug selection. LGU and participating hospitals selects drugs it needs from among the
products available through PITC.
- Quantification. LGU and participating hospitals then estimate the quantities of the
drugs needed, taking into account their available funds (allocation).
- Each LGU and participating hospital submit requirements to the Provincial Health
Officer who will consolidate all the purchase requests (PRs) and then forward the
consolidated PR to the Provincial General Services Office (PGSO).
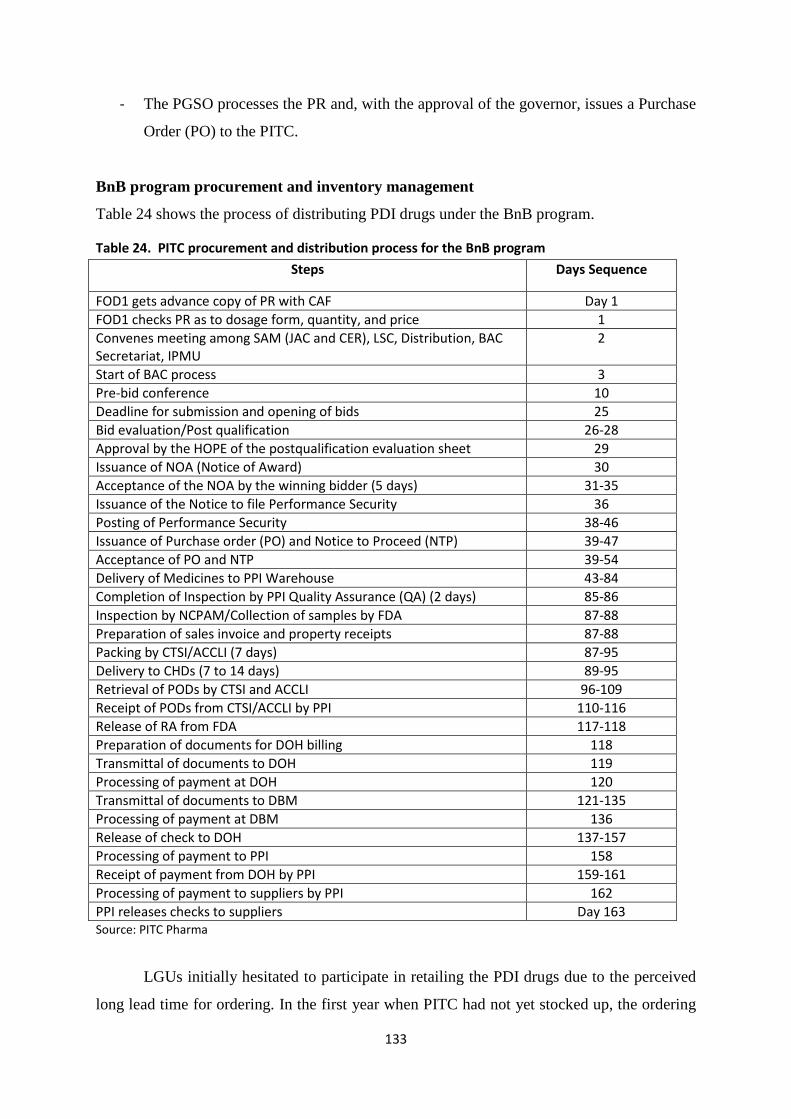
133
- The PGSO processes the PR and, with the approval of the governor, issues a Purchase
Order (PO) to the PITC.
BnB program procurement and inventory management
Table 24 shows the process of distributing PDI drugs under the BnB program.
Table 24. PITC procurement and distribution process for the BnB program
Steps Days Sequence
FOD1 gets advance copy of PR with CAF Day 1 FOD1 checks PR as to dosage form, quantity, and price 1 Convenes meeting among SAM (JAC and CER), LSC, Distribution, BAC Secretariat, IPMU
2
Start of BAC process 3 Pre-bid conference 10 Deadline for submission and opening of bids 25 Bid evaluation/Post qualification 26-28 Approval by the HOPE of the postqualification evaluation sheet 29 Issuance of NOA (Notice of Award) 30 Acceptance of the NOA by the winning bidder (5 days) 31-35 Issuance of the Notice to file Performance Security 36 Posting of Performance Security 38-46 Issuance of Purchase order (PO) and Notice to Proceed (NTP) 39-47 Acceptance of PO and NTP 39-54 Delivery of Medicines to PPI Warehouse 43-84 Completion of Inspection by PPI Quality Assurance (QA) (2 days) 85-86 Inspection by NCPAM/Collection of samples by FDA 87-88 Preparation of sales invoice and property receipts 87-88 Packing by CTSI/ACCLI (7 days) 87-95 Delivery to CHDs (7 to 14 days) 89-95 Retrieval of PODs by CTSI and ACCLI 96-109 Receipt of PODs from CTSI/ACCLI by PPI 110-116 Release of RA from FDA 117-118 Preparation of documents for DOH billing 118 Transmittal of documents to DOH 119 Processing of payment at DOH 120 Transmittal of documents to DBM 121-135 Processing of payment at DBM 136 Release of check to DOH 137-157 Processing of payment to PPI 158 Receipt of payment from DOH by PPI 159-161 Processing of payment to suppliers by PPI 162 PPI releases checks to suppliers Day 163 Source: PITC Pharma
LGUs initially hesitated to participate in retailing the PDI drugs due to the perceived
long lead time for ordering. In the first year when PITC had not yet stocked up, the ordering
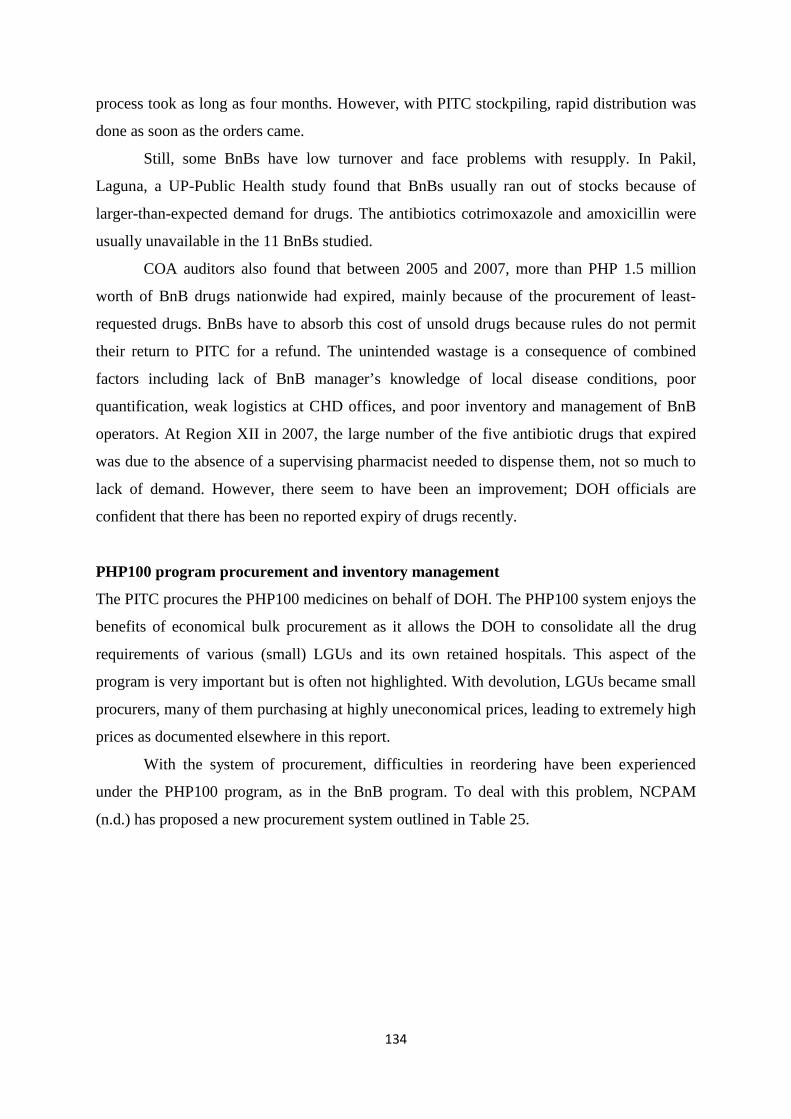
134
process took as long as four months. However, with PITC stockpiling, rapid distribution was
done as soon as the orders came.
Still, some BnBs have low turnover and face problems with resupply. In Pakil,
Laguna, a UP-Public Health study found that BnBs usually ran out of stocks because of
larger-than-expected demand for drugs. The antibiotics cotrimoxazole and amoxicillin were
usually unavailable in the 11 BnBs studied.
COA auditors also found that between 2005 and 2007, more than PHP 1.5 million
worth of BnB drugs nationwide had expired, mainly because of the procurement of least-
requested drugs. BnBs have to absorb this cost of unsold drugs because rules do not permit
their return to PITC for a refund. The unintended wastage is a consequence of combined
factors including lack of BnB manager’s knowledge of local disease conditions, poor
quantification, weak logistics at CHD offices, and poor inventory and management of BnB
operators. At Region XII in 2007, the large number of the five antibiotic drugs that expired
was due to the absence of a supervising pharmacist needed to dispense them, not so much to
lack of demand. However, there seem to have been an improvement; DOH officials are
confident that there has been no reported expiry of drugs recently.
PHP100 program procurement and inventory management
The PITC procures the PHP100 medicines on behalf of DOH. The PHP100 system enjoys the
benefits of economical bulk procurement as it allows the DOH to consolidate all the drug
requirements of various (small) LGUs and its own retained hospitals. This aspect of the
program is very important but is often not highlighted. With devolution, LGUs became small
procurers, many of them purchasing at highly uneconomical prices, leading to extremely high
prices as documented elsewhere in this report.
With the system of procurement, difficulties in reordering have been experienced
under the PHP100 program, as in the BnB program. To deal with this problem, NCPAM
(n.d.) has proposed a new procurement system outlined in Table 25.
135
Table 25. Proposed new procurement system for the PHP100 program
Unit Tasks
CHD Identify one DOH-retained hospital as central processing and distribution agency in each region Through the provincial health offices, identify LGU hospitals in the region who are interested in participating in the PHP100 program Quantify and consolidate the demand volumes for PHP100 within the region Submit the consolidated summary of demand volumes and submit to DOH central office
DOH Central Office
Suballot the budget to the DOH-retained hospital identified in each region as the central processing and distribution agency Identify the approved budget ceiling/allocation for each recipient LGU hospital
DOH hospital
Decide on the appropriate option whether (a) to procure from PITC Pharma, or (b) bid out the d/m competitively to private suppliers (as per RA 9184), inclusive of packaging and labeling Provide the allocation for each recipient hospital Apply for license to operate as distributor/repacker Repack and distribute PHP100 d/m to recipient hospitals
Recipient hospital
Receive PHP100 supplies and sell them What to do with the proceeds of sales and fund management is still to be determined. Discussions with DOF, DBM, DOH, and each LGU to be held
Source: NCPAM n.d.
Review of PITC Mandate and Performance
PITC mandate
PITC is a government-owned and -controlled corporation established by virtue of Presidential
Decree 1071 as amended, under the Department of Trade and Industry. It has over 30 years’
experience in the export, import, and marketing of a wide range of commodities, industrial
products, and consumer goods. It was established in 1973 to take the lead in the Philippine
trade with socialist and other centrally planned economies then in existence.
In August 2004, PITC was designated as the key agency in the implementation of
President Gloria Macapagal Arroyo’s 10-Point Legacy Program, one thrust of which is to
lower the price of essential medicines by 50 percent by 2010. PITC Pharma, Inc. was formed
as a subsidiary to procure the required drugs internationally and distribute them locally.
Under the approved arrangement, PCSO earmarks the money for PITC to procure the drugs,
PITC distributes the purchased drugs to the CHDs, the CHDs will sell to the BnBs within the
respective catchment areas, and the selling price (including markup) will be determined by
the 50 Pharma Project Management Unit.
136
Performance of PITC vis-a-vis DOH and LGUs
Ball and Tisocki (2009) assessed the public procurement prices of medicines in the
Philippines based on a survey of DOH-retained, provincial and municipal hospitals in six
regions as well as PITC. The study covered a basket of 50 medicines (originator brands as
well as generics) and compared local prices with the corresponding international reference
prices usually of not-for-profit suppliers. The median price ratio (MPR) indicates how the
local unit price compares with the international reference price. The study (Table 26) finds
the following:
(1) DOH-retained, provincial and municipal hospitals procured generic medicines at
2.9 times the international reference price. When originator brands were procured, they were
on average 15.7 times more than the international reference prices.
(2) For generic procurement, DOH-retained hospitals (MPR 2.2) were generally more
efficient than provincial hospitals (MPR 3.2), and provincial hospitals were more efficient
than municipal hospitals (MPR 3.9).
(3) PITC Pharma was able to procure low-cost generic essential medicines using its
current structures, procuring generics on average at levels similar to the international
reference prices (median MPR 1.0).
(4) PITC parallel-imported originator brands were cheaper than locally available
originator brands and, in some cases, cheaper than publicly procured generic equivalents.
However, PITC Pharma was able to procure generic captopril at prices lower than that of the
parallel-imported originator brand (unit costs PHP 2.4 and 6.7, respectively). Procuring
generics is thus more advantageous for patients although probably less lucrative for PITC
Pharma (HAI Global 2008b).
(5) The overall conclusion is that PITC is more efficient than DOH and LGUs in drug
procurement. Because of this comparative advantage, Ball and Tisocki (2009) recommended
that PITC concentrate on procuring quality generic medicines for the public sector.
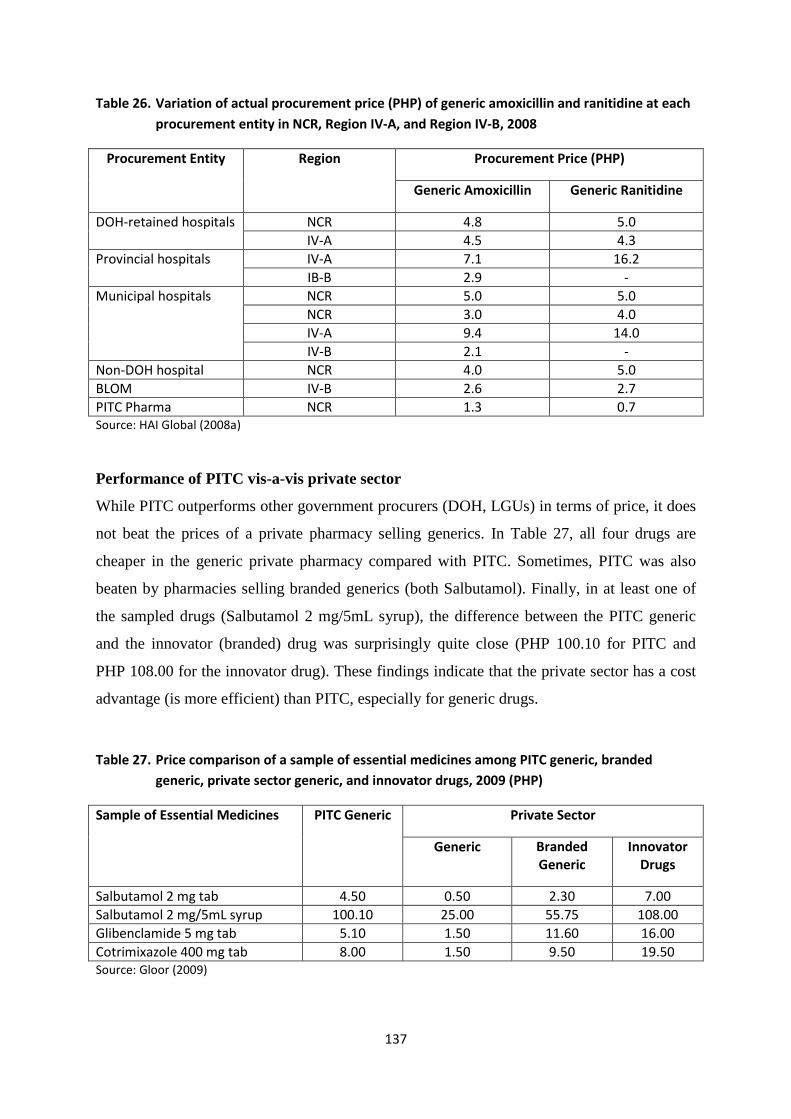
137
Table 26. Variation of actual procurement price (PHP) of generic amoxicillin and ranitidine at each procurement entity in NCR, Region IV-A, and Region IV-B, 2008
Procurement Entity Region Procurement Price (PHP)
Generic Amoxicillin Generic Ranitidine
DOH-retained hospitals NCR 4.8 5.0 IV-A 4.5 4.3
Provincial hospitals IV-A 7.1 16.2 IB-B 2.9 -
Municipal hospitals NCR 5.0 5.0 NCR 3.0 4.0 IV-A 9.4 14.0 IV-B 2.1 -
Non-DOH hospital NCR 4.0 5.0 BLOM IV-B 2.6 2.7 PITC Pharma NCR 1.3 0.7 Source: HAI Global (2008a)
Performance of PITC vis-a-vis private sector
While PITC outperforms other government procurers (DOH, LGUs) in terms of price, it does
not beat the prices of a private pharmacy selling generics. In Table 27, all four drugs are
cheaper in the generic private pharmacy compared with PITC. Sometimes, PITC was also
beaten by pharmacies selling branded generics (both Salbutamol). Finally, in at least one of
the sampled drugs (Salbutamol 2 mg/5mL syrup), the difference between the PITC generic
and the innovator (branded) drug was surprisingly quite close (PHP 100.10 for PITC and
PHP 108.00 for the innovator drug). These findings indicate that the private sector has a cost
advantage (is more efficient) than PITC, especially for generic drugs.
Table 27. Price comparison of a sample of essential medicines among PITC generic, branded generic, private sector generic, and innovator drugs, 2009 (PHP)
Sample of Essential Medicines PITC Generic Private Sector
Generic Branded Generic
Innovator Drugs
Salbutamol 2 mg tab 4.50 0.50 2.30 7.00 Salbutamol 2 mg/5mL syrup 100.10 25.00 55.75 108.00 Glibenclamide 5 mg tab 5.10 1.50 11.60 16.00 Cotrimixazole 400 mg tab 8.00 1.50 9.50 19.50 Source: Gloor (2009)
138
PITC challenges
While PITC outperforms DOH and LGUs in drug procurement, the private sector
outperforms PITC. An assessment done by BIZCLIR (2009) cites some of the reasons for
PITC’s cost disadvantage. These are the remaining challenges it needs to face:
(1) Sustainability. PITC Pharma is funded by the DOH, and its expansion is limited
by the availability of DOH funds. Other non-DOH sources of government funds (PhilHealth,
DRFs of government hospitals) have not evolved in the Philippines to an extent that they
could be tapped by PITC Pharma for financing. Because of these developmental issues,
funding for PITC Pharma has been low and erratic.
(2) Shortcomings in information technology (IT). PITC Pharma has severe
weaknesses in IT and inventory management. It will be challenged to manage the distribution
of drugs even if the money is found. According to an interviewee in the BIZCLIR (2009)
report, “It is 1980 at PITC Pharma, Inc. There are computers, but they’re used as typewriters.
There are spreadsheets, but no database. Information is all entered by hand, and nothing
connects to anything else.”
(3) PITC Pharma has not been able to send a purchasing agent abroad to Southeast
Asia or India. Instead, it is forced to rely on local interlocutors, contacted by phone and e-
mail. It is receiving technical assistance from the European Union, but this consists of a
single embedded technical expert (BIZCLIR 2009).
(4) Competition. Theoretically, there are clear benefits of a large procurement agency
like PITC as it is able to consolidate the individual procurements of each DOH and LGU
health facility and BnB/BNB outlets, thus conferring on it economies of scale to undertake
bulk procurement and negotiate better prices. However, it needs to upgrade its institutional
capacity to do so.
Strategic considerations
Charting the future of PITC Pharma needs to be taken in the context of the overall
government strategy in lowering the price of drugs and oligopolistic elements in the
distribution and retail of drugs. Overall, there has been progress over the past four to five
years, mainly because of the push for PDI and generic drugs, and the emergence of
alternative private sources of drugs, mainly through franchising arrangements.
However, there continues to be serious capacity constraints all over the supply chain:
PITC Pharma lacks more efficient procurement systems and skills training; BnBs remain
fragile enterprises and need institutional support; BNB performance is unknown although
139
they are growing and facing healthy competition from the non-PITC-supported private sector;
and the PHP100 treatment pack program remains very limited in reach, despite its popularity
and rapid expansion.
A major part of the problem is the very small scale of government budget financing
for pharmaceuticals, compared with total pharmaceutical sales in the country. (Added to this
is the huge underutilized potential of PhilHealth to be the main source of pharmaceutical
reimbursement and financing, both for inpatient and outpatient care.) Despite these
limitations, government has been able to make a significant dent on the reduction of
pharmaceutical prices in recent years. Given the structure of the private pharmaceutical sector
in the Philippines, as well as the level of poverty that requires pharmaceutical financing
subsidy, what needs to be highlighted is the importance of the countervailing power of
government in pharmaceutical procurement and distribution.
Thus, existing opportunities to enlarge government financing of pharmaceuticals must
be exploited, including increasing DOH appropriation (e.g., through annual commitment to
finance essential drugs); pooling LGU procurements; persuading PhilHealth management to
expedite and massively increase pharmaceutical benefits, both for inpatient and outpatient
care; and strengthening BnBs and the PHP100 programs so that reflows of pharmaceutical
funds are assured. These external problems must be sorted out, even as PITC Pharma sorts
out its own internal problems.
Alternative options for government drug procurement
Given the large number of Filipinos who remain poor and who rely primarily on government
health services and commodities, there is strong economic basis for government involvement
in the financing of drugs. Indeed, government health financing under the previous
administration fell or remained stagnant, and this trend needs to be arrested. However, there
is no ex-ante basis for government procurement of the drugs and related commodities,
especially if it can be shown that the private sector can do it better at a lower cost.
It must be mentioned parenthetically that controlling the prices of the private sector,
as was done in the GMAP, is politically risky, painful to producers, expensive to monitor,
and engenders unintended consequences such as hoarding and artificial shortages, and
dampening longer-term investments in the sector. Key informants for this study unanimously
endorsed the need for government to increase the financing and improve the procurement and
distribution of medicines for the poor, rather than trying to control prices across the board.
140
The options to dramatically increase pharmaceutical financing cover a much broader
topic than what could be dealt with in this report, e.g., universal health care, PhilHealth
reforms, LGU financing and DOH financing, and potential public-private partnerships. Thus,
the options to be dealt with in this section only cover alternative procurement arrangements.
The following options, not necessarily mutually exclusive, can be considered:
(1) Option 1: Contracting out procurement to international agencies (International
Dispensary Association, UNICEF/Copenhagen, Crown Agents, and others). Key informants
noted that any of these arrangements could be more expensive than the status quo, since they
involve foreign exchange costs and expatriate management.
(2) Option 2: Contracting out procurement to local GMP-certified pharmaceutical
firms. For generics, this is possible since the market has become competitive; local
procurement would hasten the process and ensure an uninterrupted flow of supply (WHO
2009). WHO is providing technical assistance for defining the strategies under this option.
DOH prefers this route using COBAC procedures and the Materials Management Department
as lead unit. However, this requires pooling of procurements at the national level for
economies of scale to be gained.
(3) Option 3: Expand the drug consignment system now in place in certain
government health facilities. Under this system, the private supplier places its drugs in a
government health facility, and the latter pays as it consumes the stocks. Thus, the
problematic areas of inventory and logistics management is “privatized” as these risks are
turned over to the private supplier and not internalized by the government health facility. For
instance, expired drugs will not be used and paid. This consignment system was pioneered in
the Southern Philippines Medical Center (PIDS 2011), and has since been adopted in other
government (LGU) hospitals as well, e.g., Negros Oriental Province.
(4) Option 4: Central purchasing via a Public/Private Partnership “Service Access
Program” of the PHAP. This idea was broached by PHAP representatives, but the concept
note is still being finalized.
(5) Option 5: Strengthen PITC Pharma. The capacity-building program should
address the logistics, information technology, staff skills, and management gaps already
identified earlier. In addition, greater attention should be placed toward developing a more
transparent, open, and competitive procurement system.
Note that the overall problem in this area is rooted in poor government financing of
drugs and the fragmented drug procurements (arising from the devolution of health services)
141
that need to be pooled through some mechanism. The procurement agency problem, which is
the focus of this section, is secondary.
References Afinidad, D.R.M. 2010. “Cheapest” maintenance medicines. The Daily Tribune, September
18. www.tribune.net.ph.
Ball, D. 2010. Public procurement prices of medicines in the Philippines. PowerPoint slide
presentation for the Third MeTA Forum, Manila.
Ball, D. and K. Tisocki. 2009. Public procurement prices of medicines in the Philippines.
Health Action International. www.haiweb.org.
———. 2008. Medicines price components in the Philippines. Health Action International.
www.haiweb.org.
Batangan, D.B. and N. Juban. 2009a. Philippines pharmaceutical situation: 2009 WHO
household survey on medicines. WHO, DFID, and MeTA Philippines.
———. 2009b. Philippines pharmaceutical situation: 2009 WHO health facility survey on
medicines. WHO, DFID, and MeTA Philippines.
Business Climate, Legal and Institutional Reform (BIZCLIR). 2009. Philippines HealthCLIR
pilot diagnostic: Health Business Climate Legal and Institutional Reform. USAID
Business Climate, Legal and Institutional Reform (CLIR) Project.
Cameron, A., D. Ball, M. Ewen, R. Laing, and D. Ross-Degnan. 2008. Medicine prices,
availability, and affordability in 36 developing and middle-income countries: A
secondary analysis. The Lancet (December 1).
Commission on Audit (COA). 2005. Government-wide Performance Audit Report on the
Procurement System of the Department of Health CY 2005. Quezon City: COA.
David, L.C. and M.A.B. Geronimo. 2008. Sector performance review: Performance
assessment of FOURmula One for Health, 2007. Report submitted to the DOH under
the auspices of the Health Policy Development Program.
Depano, F.E. n.d. Botika ng Barangay Updates. PowerPoint presentation. NCPAM, DOH.
Department of Health (DOH). 2009. Health Sector Bridge Plan. 2nd draft dated 2 September.
———. 2005. Procedural guidelines on the procurement, inspection, and distribution of
various drugs and medicines under the Low-Cost Medicine Program. Administrative
Order No. 3, s. 2005.
142
———. 2004. Guidelines for the establishment and operations of Botika ng Barangay and
Pharmaceutical Distribution Networks. Administrative Order No. 144, s. 2004.
———. 2003. Policy guidelines on the operationalization of Botika ng Barangays by the
Centers for Health Development. Administrative Order No. 64, s. 2003.
Flores, F.P., T. Umenai, and S. Wakal. 2001. Should community-managed drugstores be
phased out? Asia Pacific Journal of Public Health 13(1):9–12.
Gloor, R.W. 2009. Maximum retail price and quality medicines through postmarketing
surveillance. PowerPoint presentation for the 10th National Health Sector Meeting, 5
March, Tagbilaran City, Bohol.
HAI Global. 2008a. Components of medicine price. www.haiweb.org.
———. 2008b. Public Procurement prices of pedicines. www.haiweb.org.
Higuchi, M. 2008. Costs, availability, and affordability of diabetes care. Foundation for
Advanced Studies in International Development. FASID Research Fellow Program.
Kanavos, P.G., J.Y. Lim, and C.S. Pascual. 2002. On improving the poor’s access to
affordable drugs. Philippine Health Policy Note. The World Bank, Human
Development Unit, East Asia and the Pacific Region.
Lavado, R. et al. 2011. Improving access to affordable medicines: An examination of
prevailing prices and distribution of village drugstores in the Philippines. Draft Report.
Philippine Institute of Development Studies.
Legaspi, N. n.d. Making medicines accessible thru P100 Project in Oriental Mindoro.
PowerPoint presentation slides. Provincial Health Office, Oriental Mindoro.
Magkilat, B.C. 2009. Phaseout of parallel drug importation seen. Manila Bulletin, August 31.
Management Sciences for Health (MSH). n.d. Handugan ng abot-kaya, mahusay na gamot
ang bawa’t Pilipino. Drug Management Systems. www.erc.msh.org.
MeTA Philippines. 2010. Data Disclosure Survey: Final Report. 10 July.
Manongdo, J.F. 2009. DOH to list more drugs under P100 per treatment pack. Manila
Bulletin, February 24.
Miranda, M.F. 2010. Survey of health financing mechanisms for access to medicines by the
poor in rural and urban Philippines. PowerPoint presentation for the National Summit
on Transparency and Governance in Universal Health Care, 16–17 September, Asian
Institute of Management.
National Center for Pharmaceutical_Access and_Management (NCPAM). 2010. PowerPoint
presentation for the National Summit on Transparency and Governance in Universal
Health Care, 16–17 September, NCPAM.
143
National Economic and Development Authority (NEDA). 2008. Universally Accessible
Cheaper and Quality Medicines Act of 2008: Binging cheaper medicines to Filipinos.
NEDA DevPulse.
National Statistical Coordination Board (NSCB). 2010. Philippine Statistical Yearbook.
Makati City: NSCB.
Ontario College of Pharmacy (OCP). 2011. Compliance packaging. Ontario College of
Pharmacy. www.ocpinfo.com.
Oplas, B. 2010. Access to medicines via competition, not protectionism and price regulation.
Minimal Government Thinkers, Inc.
Pabico, A. 2006. The state of the nation’s health: Of patent maladies and public remedies.
The Daily PCIJ. Philippine Center for Investigative Journalism.
pcij.org/blog/2006/05/29/the-state-of-the-nations-health-of-patent-maladies-and-public
-remedies.
Parafina, R., D. Lijauco, and E. Gacusana. 2009. Assessment of public sector capacity to
undertake procurement of drugs and medicines. Quezon City.
Pedron, D.G.E. 2009. Breaking up cartels: The Cheaper Medicines Act 2008. Business
Mirror, July 14.
Philippine Institute for Development Studies (PIDS). 2011. Health market innovations in the
Philippines. Second National Roundtable Discussion, 22–23 June, InterContinental
Hotel Manila.
PITC Pharma. 2010. Importation of low-priced quality medicines. PowerPoint presentation,
6–7 May, Cloud 9 Resort and Leisure Club, Antipolo City.
———. n.d. Accomplishment Report for CY 2006–2009.
———. n.d. Brief on subsidies for the Half-Priced Medicines Program.
———. n.d. Ongoing programs and projects. www.pitcpharma.com.ph/programs.html.
———. n.d. PITC procurement and distribution process for Botika ng Barangay.
———. n.d. Price comparison of retail prices: Botika ng Barangay vs. The Generics
Pharmacy. PowerPoint presentation.
Ragaza, J.M. and A. Morales. 2009. Botika ng Barangay not in poorest places.
www.gmanews.tv. April 4.
Ramos, J.G. 2006. Pharmaceutical policies for affordable access. PowerPoint presentation, 24
August, Asian Institute of Management, Makati City.
Subido, J.A. 2011. Compliance made easier. The Philippine Star, March 10
www.philstar.com/health-and-family/607257/compliance-made-easier.
144
Vego, H. 2010. Congress should now amend Cheaper Medicines Act. Iloilo Views,
November 17.
Vreeke, E., E. Ricalde, and J. Wong. 2009. Botika ng Barangay: Survey results, cost
description and monitoring system. Report submitted to the Health Sector Policy
Support Programme, European Commission, 25 September.
WikiPilipinas. 2010. Philippine International Trading Corp. www.wikipilipinas.org.
Wong, J.Q. and L. Deluna. 2001a. Reforming the Philippine drug management system.
Management Sciences for Health.
———. 2001b. Status report on the procurement of parallel drug imports by the eight
HSRTAP convergence sites. Management Sciences for Health.
World Health Organization (WHO). 2009. The Philippines launches the P100 programme.
Essential Drug Medicine Policy (IX):2. WHO Western Pacific Region.
Zamboanga Today. 2010. Botika ng Barangay struggles to provide health for all.
www.zamboanga today.ph. October 10.


![National Tax Research Centerntrc.gov.ph/images/journal/j20140910b.pdf · RA 10351] REVENUE PERFORMANCE OF RA 10351 A. Overall Performance Upon the implementation of RA 10351 in 2013,](https://img.pdfslide.net/doc/110x75/5f1c348bee4629070e039ba1/national-tax-research-ra-10351-revenue-performance-of-ra-10351-a-overall-performance.jpg)