Embed Size (px)
Citation preview
ANALYSIS OF THE RELATION BETWEEN MARKET
CAPITALIZATION AND STOCK MARKET INDICES AT THE NSE
BY
Kamunde Lawrence Kaburu
A RESEARCH PROJECT PRESENTED IN PARTIAL
FULFILLMENT OF THE REQUIREMENT FOR THE AWARD OF
THE DEGREE OF MASTER OF BUSINESS ADMINISTRATION,
SCHOOL OF BUSINESS, UNIVERSITY OF NAIROBI
OCTOBER 2012

ii
DECLARATION
I declare that this is my original work and has not been presented for award of any degree
in any university.
Signed: ………………………… Date: ………………………
Lawrence Kaburu
D61/73548/2009
This proposal has been submitted for examination with my approval as the University
Supervisor.
Signed: ………………………… Date: ……………………….
Mr. Peter Opande
Lecturer, Department of Business Administration
School of Business
University of Nairobi

iii
DEDICATION
I dedicate this project to my parents Alfred Kamundi and Silveria Mwaria for their care,
support and moral upbringing. To my fiancée Purity for her care, understanding, concern
and enthusiasm that inspired me to achieve this goal.
God Bless you all abundantly.

iv
ACKNOWLEDGEMENTS
This study would not have been possible without the support and assistance of a number
of people. First, I give thanks to the Almighty God for giving me the strength and
knowledge to carry out the study.
Special thanks go to my Supervisor, Mr. Peter Opande, who provided critical assistance
and critique to me during the entire project period. Indeed his insights and diligent
support helped in shaping the study.
Special thanks go to my family for their support, encouragement and love during the
research project writing process.
I equally place on record my study colleagues particularly Dennis, Mbithi, Noel and Jesse
whose valuable contribution enabled me to sail through the course.

v
TABLE OF CONTENTS
DECLARATION .......................................................................................................... ii
DEDICATION ............................................................................................................. iii
ACKNOWLEDGEMENTS .......................................................................................... iv
LIST OF TABLES .......................................................................................................vii
ABBREVIATIONS .................................................................................................... viii
ABSTRACT .................................................................................................................. ix
CHAPTER ONE: INTRODUCTION ........................................................................... 1
1.1 Background of the study....................................................................................1
1.2 Problem Statement ............................................................................................6
1.3 Objectives .........................................................................................................7
1.4 Value of the Study.............................................................................................8
CHAPTER TWO: LITERATURE REVIEW ............................................................ 10
2.1 Introduction .................................................................................................... 10
2.1.1 Utilization/ Functions of stock indices ........................................................ 10
2.3 Stock Market Index Theories........................................................................... 12
2.3 Factors influencing share prices in the stock markets ....................................... 16
2.4 Indicators of stock market performance ........................................................... 17
2.5 Types of stock market indices ......................................................................... 18
2.6 Methods of computing stock market indices .................................................... 20
2.7 Nairobi Stock Exchange Indices ...................................................................... 21

vi
2.9 Problems with stock market indices ................................................................ 23
2.10 Empirical Review ......................................................................................... 25
2.11 Overview on Literature Review ..................................................................... 29
CHAPTER THREE: RESEARCH METHODOLOGY ............................................ 31
3.1 Introduction .................................................................................................... 31
3.2 Research Design.............................................................................................. 31
3.3 Population and Sample .................................................................................... 31
3.4 Data Sources and Collection............................................................................ 31
CHAPTER FOUR: DATA ANALYSIS AND INTERPRETATION OF RESULTS 33
4.1 Introduction .................................................................................................... 33
4.2 Correlation Test .............................................................................................. 33
4.3 Unit Root Tests ............................................................................................... 34
4.4 Regression results ........................................................................................... 36
CHAPTER FIVE: SUMMARY, CONCLUSION AND RECOMMENDATIONS 38
5.1 Summary and Conclusions .............................................................................. 38
5.2 Recommendation ............................................................................................ 39
5.3 Limitations of the Study .................................................................................. 39
5.4 Areas of Further Research ............................................................................... 40
REFERENCES ............................................................................................................ 41
APPENDICES ............................................................................................................. 45
Appendix 1: Market Capitalization, NSE 20 Share index and NASI Data .............. 45

vii
LIST OF TABLES
Table 4.1: Correlation matrix ……………………………………….…………………33
Table 4.2: Unit root tests at levels………... ………………………………………….. 35
Table 4.3: Unit root test at second difference…………………………………………36
Table 4.4: Regression results for the variables under study……………….…………..36

viii
ABBREVIATIONS
ADF Augmented Dicky Fuller
ASE Athens Stock Exchange
CAPM Capital Asset Pricing Model
CI Co-integration
CMA Capital Market Authority
DAX Deutscher Aktien Index
DJIA Dow Jones Industrial Average
EG Engle & Granger
EGARCH Exponential Autoregressive Conditional Heteroskedascity
GDP Gross Domestic Product
IFC International Finance Corporation
MCAP Market Capitalization
ML Maximum Likelihood
MVA Market Value Added
NASI NSE All Share Index
NSE Nairobi Securities Exchange
OLS Ordinary Least Square
S&P Standard and Poor
TOR Turnover Ratio
UK United Kingdom
USA United States of America

ix
ABSTRACT
The objective of this study was to analyze the relation between market capitalization and
stock market indices at Nairobi Stock Exchange (NSE). The various functions fulfilled by
market indices make it important to assess their suitability as indicators of market
performance alongside the market capitalization.The Nairobi Stock Exchange was used
as the case study. The study employed time series analysis where E-views software was
used to analyze the data to assess the relation among the variables. The study established
that there exists a strong positive relationship between market capitalization and the NSE
indices. However, the NSE-20-share index was found to be more significant in explaining
most of the changes in the market capitalization than the NASI. This was mainly due to
the nature and composition of the indices. Within that period of study, it was determined
there was a very strong positive correlation between market capitalization and NASI and
a rather moderate positive relationship between market capitalization and NSE 20 share
index.
1
CHAPTER ONE: INTRODUCTION
1.1 Background of the study
Stock markets have existed for a number of centuries and have historically played a
significant role in economic development by facilitating mobilization of long term capital
(Ngugi, 2003). They do so by providing liquidity to various market players. Stock
markets also provide investors with a platform for investing in various financial
instruments (both underlying assets and derivatives). Key drivers in these markets are the
returns and capital gains from respective securities. As a result, accurate measurement of
the stock market performance is critical to information users as it helps to understand the
demand, liquidity and return levels as well as the ease with which investors can mobilize
capital.
1.1.1 The Concept of Market Capitalization and Stock Market Index
Olson (2005) defines market capitalization as the price of a stock at any given time
multiplied by the amount of shares outstanding. From a market perspective, market
capitalization comprises the sum of individual outstanding shares by their prices for all
the companies listed in a given stock market. According to Olson market capitalization
can be classified as follows; one, large –cap ranging from $10 – 100 billion; mid-cap ($ 1
– 10 billion); Small-cap ($100 million – 1 billion) and micro-cap ($10 - $ 100 million).
Olson notes that there is no clear consensus or roles governing on the exact cut of values
and whether categorization should be dollar denominated or percentiles. However,
categorization cut of need to be adjusted over time due to inflation, population change

2
and overall market valuation. Normally, this varies on a daily basis depending on changes
in prices of the respective shares hence the need to identify appropriate indicators that
will help players in the stock market to monitor the changes. Through this, the players are
able to make informed investment decisions. Stock market indices are the commonly
used indicators employed to monitor and report changes in market capitalization and
market performance.
Simply defined, a stock market index is a measure of changes in the stocks markets and
mostly presumed to be reasonably representative of the market performance as a whole
(Olson, 2005). According to Olson, indices only make sense in the percentage change of
their numerical values than the absolute values. Major indices around the world include;
the NASDAQ, Dow Jones, S&P Global 100 and NYSE indices in USA; FTSE 100 in
UK; Nikkei 225 in Japan; FTSE SGX in Singapore; SSE Composite index in China;
S&P/ASX 200 in Australia, among others. These indices are a better indicator of stock
market performance. Computation of these indices varies in one way or the other
depending on the composite, selection criteria and assumptions therein.
Koller et al (2010) defined stock market performance as a measure of returns on shares
over a period of time. The period over which stock returns are measured is based on
personal preferences though portfolio managers usually measure stock market
performance on daily, weekly, monthly and yearly basis. Measurement of stock market
performance is done using various ways where common measures include use of market
capitalization figures and stock indices computed daily based on individual stock prices.

3
The market performance determines whether investors are making positive or negative
returns on their portfolio.
Given the complexity of following daily price movements, most individuals prefer
looking at changes in market capitalization and indices. Reliability of stock indices in
showing market performance have gained more significance in their use as basis for the
derivatives markets. Portfolio managers use derivatives as tools for their portfolio
strategies to mitigate risks where they are used for hedging and arbitrage purposes. As a
result, for a stock index to perform this function it has to fulfill both statistical and
economic requirements, Fisher (1992).
1.1.2 The Nairobi Securities Exchange
In Kenya, both the market capitalization and stock indices are significant performance
indicators and are used to inform investment decisions. The stock market in the country
has come a long way given that dealing in stocks started in the 1920s. However, at this
time there were no formal rules and regulation governing stock broking activities. Prices
were normally exchanged over a cup of tea or coffee and clients were obligated to honour
their contractual commitments by making delivery and paying the relevant costs (Nairobi
Stock Exchange, 2011).
In 1954 The Nairobi Stock Exchange (NSE) was established as a voluntary association of
stockbrokers registered under the Societies Act that trade become formalized.Since then
the exchange has undergone numerous institutional and policy transformations. Key
among these transformations includes; tightening of disclosure rules, rationalization of
tax policy favourable to both local and foreign investors and regulatory changes (Ngugi,
4
2003). The establishment of the Capital Market Authority under the CMA Act of 1989 is
probably one of the remarkable regulatory and policy reforms that have taken place in the
exchange as it resulted in a shift from self regulatory to statutory-regulatory framework.
These reforms saw the exchange grow significantly and in 1994, International Finance
Corporation (IFC) rated the NSE as the best performing market in the world with a return
of 179% in dollar terms. The hull mark of these transformations was witnessed in
September 2006 when NSE trading switched from floor trading to live trading on the
automated trading system (NSE, 2011).
The NSE just like other established stock exchanges in the world plays an important role
in promoting economic development in the country. Key among these roles include;
promoting savings; providing a platform for investing in productive enterprises;
facilitating rational and efficient allocation of capital; enhancing access to finance by
providing flexibility for customization; and providing investors with an efficient
mechanism to liquidate their securities (NSE home page, 2011). To perform these vital
roles, dissemination of correct information on market performance and the relationship
between market capitalization and stock indices is paramount.
Within the NSE, the NSE 20-Share Index and Nairobi All Share Index (NASI) are used
to indicate market performance. The NSE 20-Share Index was introduced in 1964, a year
after Africans were first allowed to trade on the NSE. On February 2008 the NSE All
Share Index (NASI) was introduced and aimed at reflecting the total market value of all
stocks traded on the NSE in one day as opposed to just the price changes of the 20 best
performers captured by the NSE 20 index (NSE Press Release, 2008). The two indices
5
are price weighted and are based on geometric mean of average mean prices of
constituent companies which are equally weighted. The NSE – 20 Share index consists
mainly of blue chip firms that have already established a strong hold on their market
shares in the sectors they operate in and have a clear dividend pay-out policy. Firms
currently comprising the index include; Rea Vipingo, Sasini, Kenya Airways, Centum,
Nation Media Group, Safaricom, Barclays, Equity, KCB, Stanchart, Co-operative,
EABL, Athi River Mining, Mumias, Bamburi, BAT, KenGen, KPLC, Kenol Kobil,
Express and CMC Motors (NSE Press Release, September, 2010).
According to NSE 20-Share Index Manual, the NSE 20 share index is an equi-weighed
geometric mean of 20 large companies’ ordinary stocks traded on the bourse. The index
measures price movement in selected, relatively stable and best performing 20 listed
companies.
On the other hand, NASI was introduced to complement and address the shortcomings of
NSE 20 share. NASI incorporates all listed companies irrespective of their performance
and their time of listing as opposed to the 20 Share Index which measures price
movement in the best performing 20 companies amongst the listed ones.Basically the
shortcomings of the NSE 20 share index include; one, the NSE 20 Share index measures
the average performance of 20 large capitalized stocks drawn from different industries
(NSE Press Release, 2008). In contrast, experience indicates that most large cap stocks do
not record a high performance as compared to low cap stocks. At times small cap
counters have potential to record growth averaging at 50% which is unlikely for large cap
stocks. This makes the 20 Share index to be biased towards a large cap counters and thus
6
fails to reflect the right signals on the entire market performance to potential investors.
Second, susceptibility to volatility in one or more of the constituents counters thereby
resulting to biasness of the index.
1.2 Problem Statement
Moles, Parrino and Kidwell (2011) note that to disseminate the performance of the stock
markets to stakeholders, stock exchanges use different ways. Key among these ways is
the computation of stock indices and tracking their changes between each computation.
Stock indices often influence investment decisions in the stock markets. Investors use
stock indices to track overall performance of the stock markets where some benchmark
their portfolios to the index with most preferring to hold portfolios comprising index
constituent counters (Business Daily, 2011).
Given that Kenya’s capital market is registering rapid growth with the intention of
introduction of derivatives market, there is need to analyse the relation between the NSE
indices and market capitalization. This is critical in that one premise of efficient capital
markets hypothesis is accuracy and timely availability of market information to various
users. In fact the NASI was introduced in 2008 to ensure a comprehensive dissemination
of market information to investors (NSE Press Release, 2008).
Various studies have been carried on stock market indices and market capitalization in
the NSE. For example Odera (1999) carried out a study on determining the accuracy of
the NSE 20 share index by addressing its weaknesses and proposed a composite index.
Ngugi and Njiru (2005) carried out a study on growth of NSE primary stock market
mainly focusing on policy and regulatory framework. Ngugi (2003) carried out at study

7
on determinants of liquidity of stock markets with NSE as the case study. Kibuthu (2005)
carried out a study on capital markets in emerging economies focusing on structure,
organization, regulation and performance trends. Whereas there are various studies
carried out at the NSE stock market,no study as been done to analyse the relation between
market capitalization and stock indices.Given that investors need easy and accurate
indicators of stock market performance, determination of the relationship between the
two variables under study will help to create a better understanding of the market and
utilization of the information disseminated. This study, therefore, seeks to determine the
relationship between market capitalization and stock market indices that investors can
monitor to make informed investment decisions?
1.3 Objectives
The general objective of this study is to determine the relationship between market
capitalization and NSE share indices.
Specific objectives guiding the study include;
i. To determine the strength of the relationship between market capitalization and
NSE 20 share index as indicators of stock market performance.
ii. To determine the strength of the relationship between market capitalization and
NASI as indicators of stock market performance.
iii. To determine the extent of the relationship between market capitalization and
NSE share indices.k

8
1.4 Value of the Study
This study will provide important information regarding the relationship between market
capitalization and NSE stock indices. From the evaluation, it will be possible to
understand implications on various stakeholders in their decision making process in
regard to the stock market as a result of the relationship. In particular, the study will be of
critical importance to the following groups;
Portfolio managers are bestowed with maximization of investors’ wealth by investing
wisely in the stock market. To do so, they employ various tools and stock market
performance indicators where indices are given key consideration. As a result, portfolio
managers will utilize the findings of this study to identify potentials ways through which
they can maximize their return and mitigate market related risks. The information
provided will also help to enhance their precision in day to day decision making within
emerging markets like Kenya’s capital market.
Researchers interested in carrying out related studies or issues raised in this study will use
the findings of this study as secondary data. Emerging findings will help to reinforce
existing stock indices theories by providing a clear direction and magnitude of the
relationship. The findings will be utilized to contextualize their studies and guide them
into areas that require further inquiry. In particular, researchers interested in studying
efficiencies in emerging markets in Africa will find information in this study resourceful.
Capital Market Authority (CMA) which is mandated to regulate the operations of the
NSE as wells as NSE executives will utilize the findings of this study to refine their

9
policies to enhance market efficiency in dissemination of accurate market performance.
Strong market efficiency is critical in winning investor confidence which in return
enhances liquidity and reputation of the stock market. Improved market efficiency will
help to benchmark Kenya’s stock market among other major world stock markets. In
addition, given that CMA intends to start derivatives markets where indices are
frequently utilized by players in this market, their effectiveness in indicating stock market
performance should not be biased.
Other market players especially the retail investors in stocks and derivatives markets will
utilize information in this study to make more informed decisions. Understanding the
nature of relationship will enhance returns for investors who rely on such market
performance indicators to make their investment decisions regardless of whether they are
driven by speculative/ arbitrage, capital gain, risk management (hedging).
The findings of this will contribute to the body of knowledge at the university and
beyond. Students and other scholars will seek the findings of this study to gain more
insights on market capitalization, stock indices and their influence on stock and
derivatives market investment decisions.
10
CHAPTER TWO: LITERATURE REVIEW
2.1 Introduction
This chapter attempts to give both the theoretical and empirical review related to the
study topic. In this regard, sections 2.2 to section 2.9 focuses on theoretical review which
includes; stock market theories, stock market performance indicators, types of stock
market indices, methods of computing stock market indices, function of stock market
indices and their shortcomings. On the other hand section 2.10 deals with empirical
studies as presented by various scholars on stock market performance indicators.
2.1.1 Utilization/ Functions of stock indices
Stock market indices measure the value of a portfolio of average of stock prices (Cary
and Chris, 1998). According to them, the stock indices perform two important functions,
that is, descriptive and operative functions. Under the descriptive function, stock markets
as aggregate measures are instruments to meet the information requirements of investors
by characterizing the development of markets and specific market segments. Stock
market indices fulfill the operative function by acting as a basis of derivatives
instruments by facilitating application of certain portfolio management strategies such as
hedging and arbitrage trading. Richard & Tierney (2004) pointed out that a valid
benchmark should have the following properties; appropriate, measurable, investable,
reflective of current investment opinion, unambiguous and specified in advance – AIMR
US.
11
According to Moles, Parrino and Kidwell (2011) stock market indices are used to
measure stock market performance regardless of whether share prices are moving up or
down. Some stock indices provide an international benchmark for global investment.
They argue that players in the stock market watch stock indices closely to track down the
economic activity as well as to measure the performance of specific type of firms. In
most cases, stock market indices are designed to indicate the performance of a given
market, a sector of the overall market or a particular type of investment. The purposes for
which indices are used vary considerably and as such, price, value and total return based
indices are computed to indicate specific information to various users.
Sutcliffe, M. S. (2006) notes that various stock market indices have been developed to
meet the strong demand for aggregate measures of stock market performance. Normally
indices are designed to quantify wide spread movement in stock prices. These indices
only gain their significance if there is generally a positive correlation between the price
changes of different shares. He notes that the stock market indices are constructed for
various reasons that includes; providing a historical comparison of money invested in the
stock market against those invested in some other assets; used as a simple standard
measure to compare the performance of investment fund managers and they are also used
as lead indicators on national economic performance in that share prices are a measure of
market’s expectations of cash flow.
Furthermore, stock market indices provide investors with the possibility of estimating not
only the state of separate stocks but the state of the entire market, sector or region. Stock
12
market indices in the countries of the world reflect the general fluctuations of the market
of those companies’ stock which are quoted in the country (Pilinkus, D. 2010).
2.3 Stock Market Index Theories
Various scholars have developed numerous theories explaining the investors’ behaviors,
price trends, stock performance and relationship of indicators among others
.
2.2.1 Dow Theory
Chen (2010) discusses the Dow Theory which was developed by Charles Dow. The
theory illustrates price trends in the stock market. According to Dow Theory there are
several primary principles of market price action which include; one, that the market
discounts everything, that is, all news and fundamental information are always priced or
reflected in the market prices of stock. Two, the average stock market indexes are
comprised of three trends, that is primary, secondary and minor. Primary trends are major
price directional move; secondary trends are counter trends which don’t last long while
minor trends occur within the secondary trends lasting only a few hours. Three, the
theory point that primary trend is the most important trend where three phases occur, that
is, accumulation or distribution, public participation and excess. Four, confirmation,
whereby according to Dow two indexes have to confirm each other in either an uptrend
or downtrend, normally, a price trend will be confirmed where there is a complete
reversal. Five, volume confirms trends, whereby a change in price direction should be
accompanied by large trends. Finally, price trends are valid until reversed, that is trends
continue until there is a clear evidence that a bona fide reversal has occurred.

13
2.2.2 Veblen’s theory of discrepancy between market prospective profit and
current capitalization
According to Mitchell (1970) prosperity, crises and depression are business phenomena
and are behind increases or decline in prices and profits. Generally a period of prosperity
is ushered in by price rises due to high government and industry purchases as well as
increased consumer purchasing power. As demand for goods and services increases,
aggressive business enterprises expand its ventures. It is this rise in demand, prices and
expansions that increase the prospective profits. By extension, larger business profits lead
to higher market capitalization. The theory asserts that this sequence of growing demand,
price increases, rising profit expectations, swelling capitalization and expanding credits
run cumulatively as long as they are higher than anticipated costs. However, in the long
run this process reverses and costs rise more than anticipated profits bringing down
demand, prices and eventual profit margins. Stock indices for the enterprises also move
in tandem with price trend or the business cycle.
2.2.3 Discounted cash flow valuation theory
The theory is as discussed Lee, John and Alice (2010) is the basic tool for establishing
the theoretical price of a corporate security. According to the theory, the price of a
security (share) is equal to the present value and future benefit of ownership. In case of a
common stock, these benefits include dividend paid and gain during the ownership
period. The theory notes that pricing or valuation of common stock is more complicated
than in fixed security due to uncertainty of future cash flows. As a result, dividends

14
expected may change based on management decision while prices may rise or fall
depending on the business lifecycle resulting losses or gain when the stock is sold.
Therefore, pricing of common stock require forecasting expected capital gains and the
stream of expected dividend at a required rate of return.
2.2.4 The Efficient Market Hypothesis (EMH)
Oblienugh (2010) notes that those in support of the efficient market hypothesis argue that
only changes in fundamental factors of a company such as earning outlook or profit
margins ought to affect share prices beyond the short term where random ‘noise’ in the
stock market may prevail. The theory is based on the assumption that little or no trading
takes place given that prices are at or near equilibrium having priced all the public
knowledge. Efficient market reflects true stock market performance to the investors. All
news or any other information is always reflected in the market prices of stock.
2.2.5 The Greater Fool Theory
The greater fools theory is premised on the belief held by an individual investor who
makes a questionable stock purchase in the stock market with the assumption that he will
pass it on to ‘a greater fool’ at a higher price. Such a purchase is more often than not
informed by fundamentals but rather by speculation expectation of selling the shares to a
greater fool at higher price. The theory originates from the idea that if an investor makes
a foolish decision to purchase an expensive stock, the investor is expected to find a
greater fool who offload the stock in the near future. For this theory to hold certain
assumptions must exist; one, that irrational market optimism with high upside momentum
15
over a particular stock or the entire market exists. Two, irrational exuberance among
market player must remain high (Oblienugh, 2010).
2.2.6 The Keynesian Beauty Contest Theory
The theory was developed by John Maynard Keynes who used the hypothetical
newspaper beauty contest to explain the behaviour of investors in the stock market.
Oblienugh (2010) Keynes argued that much of the investments in the stock market are
driven by expectations about what the other investors think, rather than rational
expectation about the fundamental viability of a particular share investment. He explains
that stock market volatility occur because investments are determined by the herd-like
‘animal spirits’ of the investors. Keynes illustrated this herd mentality of investor with
the analogy of a beauty contest that featured in a newspaper picture of a number of young
women. The contest will be won on popular vote and readers are expected to vote for
their favorite contestants. Entrants are asked to choose a set of six faces from the
photographs of women that are ‘the most beautiful’ and those who pick the most popular
face are eligible to contest for the prize.
As a result, a contestant is supposed to rely on his or her own concept of beauty. But to
win the prize, s/he must do a second guess on other contests’ picks in order to make a
selection that wins popular vote. In so doing the contestant disregards his own concept of
beauty and picks the faces based on perceived beauty standards. Similarly, in the stock
market Keynes explained that investors exemplify the same behaviour by pricing shares
not based on their fundamental value but on what everyone else thinks is the true value.
16
He asserts that to thrive in this market phenomenon one must a great mastery in
understanding mob psychology.
2.3 Factors influencing share prices in the stock markets
Roche (2005) noted that Ernst & Young conducted internationally a series of studies
called ‘Measures that Matter’ into the key factors influencing share prices. The studies
established that a significant proportion of the share price (and investors return) is
attributable to qualitative activities which cannot be objectively measured. These
activities or attributes include quality of management, quality of strategy, innovations,
human capital and strength of customer relationships among others. For example, in
1988, Ernst & Young in their research identified that at least 35% of the fund managers’
investments decisions were highly influenced by a company’s non-financial performance
especially in times of uncertainty.
Ranganatham and Madhumathi (2006) argued that irrespective of the economic situation,
some industries will be expected to perform better and share prices for companies in
these industries may not decline as much as those in other industries. They, therefore,
point out that proper identification of economic and industry specific factors influencing
share prices helps investors to identify shares that suit their expectations or investment
strategies. In relation to economic situation, they assert that it is important to understand
the stage at which an economy is in the business cycle.
According to Babu (2007) the market price of a given share is dependent on the demand
and supply forces of the share. However, there are a number of factors influencing share
17
prices/ market behaviour in the stock market which includes; external factors (economic,
political and environmental development); internal factors (financial performance of the
company); capital structure; investment habit (psychological and emotional elements) of
the public; foreign exchange rate and interest rates. Factors like rumours, inside
information, cornering, price rigging and other malpractices can also greatly affect share
prices. According to him low interest rates may encourage investors towards the stock
market in that availability of funds at low interest rates propels lenders and speculative
investors to invest more in stocks than in other investments options especially the fixed
income assets. This case is more pronounced when the stock markets are vibrant as they
guarantee better overall returns.
2.4 Indicators of stock market performance
Koller et al (2010) outlined a number of measures that indicate the stock market
performance. One is the total returns to shareholders which they defined as share
appreciation plus dividends. However, they observed that this method has limitations in
that it does not measure actual performance, but rather performance against expectations,
which can severely penalize the best performing companies. To mitigate this, the scholars
suggested that companies use Market Value Added (MVA) and market Value to Capital
methods.
Grant (2009) pointed out that for investors interested in making profit over the lifetime of
a given firm, there is need to evaluate the performance of a firm by looking at its stream
of profit (or cash flows) over the rest of its life. According to Mckinsey et al (2010),
stock market performance can be measured using market value to invested capital;
18
market value to invested capital compares a company’s market value (both debt and
equity) to the amount of capital that has been invested in the company (fixed assets,
working capital and investments in intangibles from acquisitions).
Levine and Zervos (1996) outlined six stock market performance indictors that includes;
stock market size; two measures of stock market liquidity, stock market volatility, and
two measures of stock market integration with world capital markets. However, they
acknowledge that each of these indicators has shortcomings, but using a variety of these
measures provides a better picture of the stock market performance and the link with
economic growth than if only a single indicator was used. Market capitalization is also
used as an indicator of market development. George and Gentile (2001) pointed out that
market capitalization as one indicator of stock market performance. They pointed out that
knowledge of a company’s size is useful in that it helps to compare a given company to
those of similar size.
2.5 Types of stock market indices
According to Cary and Chris (1998) there are three categories of stock indices; average,
capitalization weighted and performance based indices where a given index will fall
under one of the three indices. Sutcliffe (2006) classifies stock indices into two
categories, that is, the weighting system (market value weighted, price weighted or
equally weighted) and the averaging procedure (arithmetic or geometric).
2.5.1 Weighted System
For the weighted system, the simplest way to construct an index is by simply applying the
share prices without giving any weights. Under the equally weighted index, the price of
each share in the index is given an equal weight in the calculation of the index (achieved

19
by considering the proportionate change in the price of each share relative to a base date
e.g. price relatives). Weighting under this case gives more weights to share prices of
companies that constitute a large proportion of the value to the shares held by the
shareholders and vice versa. As a result, these indices are often referred to as market
capitalization indices and normally computed as the number of shares issued by a
company multiplied by the share price at a specified time. A capitalization weighted
index has numerous advantages: one, each share price is weighted in accordance with its
importance in the average portfolio of shares. As such, with proper averaging method,
changes in the index measure changes in the value of the average portfolio and by
extension changes in the market as whole. Two, capitalization weighted index is harder to
manipulate than most of the other weighted schemes given that the more liquid shares
tend to get more weights.
2.5.2 Average system
This method involves aggregating the prices (or price relatives) of individual shares to
obtain the value of the index. This is either done using arithmetic or geometric method.
Arithmetic weighting often denoted as AU involves multiplying each share price with its
weight and aggregating the products to produce the index, that is, AU = (w1x + w2x +
w3x + …..wnx). Where x is the individual share price and (w) are weights and add up to
one. The geometric weighted average (GW) is computed as follows; GW = (x1w
1)x
(x2w
2)x (x3w
3). Under this case the weights differ from one share price to another for the
constituent counters. For the equally weighted (or un-weighted) geometric mean (GU)
becomes the nth
root of the product of the numbers, that is, GU = [x1 x2 x3]1/3
. This
20
category of indices has its own advantages and disadvantages as discussed later in section
2.6 of this chapter.
2.6 Methods of computing stock market indices
The methods of computing stock market indices are largely influenced by the purpose
they are intended to achieve. Moles, Parrino and Kidwell (2011) outline four major stock
market indices depending on their mode of computation which includes; price, value and
total return based indices as well as specialized indices. According to them, price based
index is one of the oldest stock indices and measures how the price of its constituents
changes between each computation. Examples of this index include the Dow Jones
Industrial Average (DJIA) in US and NSE 20 share index in Kenya. Most indices are
value indices and track the portfolio of shares that make up the index changes in value
over time. Common examples of these indices include the French market CAC-40, made
up of the 40 leading French listed companies; the FTSE 100 index in UK of the top 100
companies in value. Total return indices include the effects of dividends paid by
companies. An example of this is the German market’s DAX (Deutscher Aktien Index).
Specialized type of indices include indices such as the Amex Oil Index that measures the
performance of the major international energy companies or the FTSE4Good set of
indices that measure the performance of companies based on internationally recognized
corporate responsibility standards.
Sutcliffe (2006) noted that all market weighted and equally weighted have a base date i.e.
time when the value of the index is set to unity. He notes that while any date can be
chosen as the base, for market indices the first date the index is computed is taken as the

21
base. According to him the formula for computing the arithmetic price weighted index at
time t is as follows;
n
APt = ∑ Pit where j = 0 and t
j= 1
To compute the arithmetic weighted index at time t when the base is time 0, denoted as
AW0
t can be expressed as the arithmetic average of the relative prices, i.e.
n
AW0
t = ∑ wi Rt where Ri = Pit/Pi0 and ∑ wi = 1
j= 1
To compute the geometrically equally weighted stock market index at time t when the
base time is 0, denoted as GU0
t, you proceed as follows:-
GU0
t = (Zt/Z0) l/n
; Zj = P1j x P2j x P3j x …Pnj where j = 0 and t
It should also be noted that the rate of return computed under the geometric index is
independent of the base date as there exists a reciprocal relationship, that is, the rate of
return calculated using different base dates must be equal. On the converse, changing the
base dates for the arithmetic index changes the rates of return. This implies that changing
the base date also changes the historic rates of return for all the previous periods.
2.7 Nairobi Stock Exchange Indices
Nairobi Stock Exchange has two stock indices namely; the NSE 20 Share Index and the
NSE All Share Index (NASI).

22
2.7.1The NSE 20 Share Index
The NSE 20 Share Index is price weighted based on a geometric mean of average prices
of the constituent companies which are equally weighted. In line with best practice, the
NSE 20-Share index is reviewed periodically to ensure that it reflects an accurate picture
of market performance. To ensure that the index reflects market performance, the
following criteria is used in selecting the companies that constitute the index: one, trading
activity measures i.e. market capitalization, shares traded, deals/liquidity, and turnover
during the period under review are weighed in the ratio of 4:3:2:1 respectively. Two, a
company must have at least 20% of its shares quoted at the NSE. Three, a company must
have a minimum market capitalization of Kshs. 20 million. Four, a company should
ideally be a “blue chip” with superior profitability and dividend record. The index need to
be accurate and a true representative of the stock market performance in order to enable
the investors make informed investment decisions. The index should not be looked at as
figure by itself but instead, as a percentage change in order to make meaning out of it.
2.7.2 The NSE All Share Index (NASI)
NASI which is a market capitalization weighted index. It was introduced to complement
and address the shortcomings of NSE 20 share. The index incorporates all listed
companies irrespective of their performance and their time of listing. The NASI therefore
differs from the 20 Share Index which measures price movement in best performing 20
listed companies. As a result, NASI reflects the total value of all listed companies at the
NSE and better reflects the market performance (NSE Press Release, 2008).

23
2.9 Problems with stock market indices
According to Sutcliffe (2006) all stock market indices have problems but the magnitude
of the problems differs from one index to another. Therefore one index may excel in
some situations and fail in other circumstances where different indexes are preferred. He
argues that numerous ways of constructing to stock indices are used and such
computations have their advantages and disadvantages. Precisely, since an index number
summarizes hundreds of price movements, it is common for much information to be lost.
For example, where price of each share in the index is given an equal weight in the
calculation of the index, companies with high share prices do not have a disproportionate
effect on the index. However, this method does not reflect the differences in sizes
between companies. In addition, where construction of an index simply involves using
the share prices without applying any weights, in such a price weighted index movements
in share prices of companies with a high share price are likely to dominate since they will
tend to change by large absolute figures. For the capitalization weighted indices, there is
a likely tendency for the index to be dominated by few large firms. For example, Sutcliffe
notes that on 1st August 1995, 46.3% of the value the Finnish Fox index was accounted
for by Nokia alone. In move to avoid this bias (where the index is dominated by a few
large firms), some stock market regulatory authorities have resorting putting an upper
bound on the weight which can be given to any single company. In the recent past, some
major indices have switching to using free float weights to their market capitalization
indices. For indices that include both the parent and the subsidiary, Kobayashi and
Yamada 2000 argue that including the two amounts to double counting. Furthermore,
Arnott, Hsu and Moore (2005) argue that market cap weights give extra weights to

24
overpriced stocks and vice versa. They therefore propose use of fundamental weight such
as sales, book value, cash flow, dividends or total employment.
On the other hand, average system method of computing indices also has its own
shortcomings. Under the geometric index, Sutcliffe (2006) points about three
disadvantages as follows ; one, the index underestimates price increases, that is, if the
prices of all the shares in the index rise or fall by x% percentage, equally weighted
geometric index will rise or fall by the same proportion. Contrary to this where the
individual share prices don’t change by the same proportion, the index will underestimate
price rises and overstate absolute size of a fall in share prices. Two, zero value index is a
possible outcome. Computation of geometric index involves the product of all current
share prices and it therefore follows that if the share price of any of the constituent share
collapses towards zero, the index value will be zero. Three, the index suffers from non-
normality bias in that if individual arithmetic returns are used to compute geometric
index, the returns from that index will not be normal. Under arithmetic index, returns on
the index are also normally distributed. Four, long term downward bias. While various
studies show that share prices tend to rise in the long run by differing amounts, the value
of the rise under the equally geometric weighted index is always low compared to that of
the arithmetic equivalent index. This represents a serious understatement and renders
geometric indices unsuitable for measuring long term price movements.
Selection bias, where some indices are not representative of the universe of shares based
on the selection criteria. Selection bias can occur for two reasons; one, is due to the fact
25
that most indices largely comprise of leading companies in the stock market while there
are several small companies on the same market. Secondly, due to the way the identity of
the companies that constitute the index changes over time. Averaging bias exists in some
of the indices due to first order serial correlation and some aspects of non-synchronous
trading.
2.10 Empirical Review
Odera (1999) carried out a study on the accuracy of the NSE stock index and established
major weaknesses in the index that included lack of a clear portfolio selection and
revision policy, geometric index underestimates price rises and overstates price falls and
that depending on the base chosen, the percentage change in the index can be larger or
smaller than the geometric index. He therefore suggested introduction of another index
and careful interpretation of the NSE 20 share index.
Branch (1976) in his study on predictive power of some market indicators established
that in the past there was a significant relationship between some market indicators and
subsequent stock market performance. According to his study, the most successful
indicators appeared to be cash position of the mutual funds and the Treasury Bill Rate.
Other indicators with forecasting ability included confidence index and inflation rate.
However, he cautioned that forecasting ability of one indicator is subject to changes from
one period to another.
Adjasi, Harvey and Agyapong (2008) carried out a study on effects of exchange rate
volatility on the Ghana stock exchange. They used secondary data on the two variables

26
establish the relationship between exchange rate volatility and stock market volatility.
They established that there exists an inverse/ negative relationship between exchange rate
volatility and stock market returns, that is, depreciation in the local currency leads to
increased stock market returns in the long run and vice versa. However, in the short run it
reduces the stock market returns. The study also revealed that the stock market should
perform well under strong economic growth with relatively stable price levels.
McMillan and Thupayagale (2011) carried out a study on measuring the volatility in
African stock markets taking into account the periodic shifts in mean level of volatility
where regime shifts are determined endogenously. The study found that indeed there was
persistence and long memory in volatility are overestimated when regimes shifts are not
accounted for. As such, they proposed that when estimating volatility among African
stock markets its important to consider the effects of regime changes as this would
generate an improved volatility forecasting performance for some African stock markets.
Ngugi (2003) carried out on determinants of liquidity in stock markets with Nairobi stock
exchange as the case study. The study established that, one, stock market returns heavily
influenced the volume of trading activities; two, taxation policy aimed at lowering costs
influences share trading while those involving taxation of dividend work against and that
concentration of shares among a few shareholders reduce market liquidity.
Various macroeconomic indicators exhibit varying impacts on the stock market
performance both in the short run and long run (Pilinkus, 2010). In his study comprising
27
the Baltic states (Lithuania, Latvia and Estonia) he established the following; one, that
the impact of macroeconomic indicators on stock market index in the short and long run
is different even in countries with analogous level of economic development; two, during
the short run in stock market of small open speculative attacks are expected that restrict
the possibilities to determine the relationship between the macroeconomic indicators and
stock market index in the countries; three, in the long run the significance of dependence
of the relationship between macroeconomic indicators and the stock market index
increases to 99%; and finally determining the direction of the macroeconomic indicators
compared with the stock market index enables to forecast the tendencies of variation of
the macroeconomic environment of a country and their impact on the stock market also
contributes to the formation of investors’ decisions.
Price discovery for cross listed companies show that information accrued during trading
in the domestic market is effectively transmitted in into the trading of the market where
that share is cross listed. As a result, the domestic market plays a significant and
consistent role in both price discovery and volatility spillover for a cross listed company.
Information originating from the country where is cross listed tends to be temporal and
short lived. The home market business environment has an overbearing effect over
superior market quality in price discovery for cross listed stocks (Cheng, Guangzhong
and Wu, 2010).
Chiou (2011) assessed the volatility transmission of the stock returns in Asia, Europe and
North America by investigating the lead lag relationship between major stock markets.
The study used Japan, UK and USA as representatives of the three continents. Key inices

28
in each continent were used and included Nikkei 225, FTSE 100 and S&P 500. An
assessment of how intraday return behavior in one market affects intraday in another
market located in a different time zone established a strong evidence that the 3 stock
markets are significantly interdependent; Tokyo leads London and New York; London
leads New York and Tokyo; and New York leads Tokyo and London. The study further
revealed that London and New York have strong ties.
While carrying out a study on short run and long term relationship among six sectoral
indices at Athens Stock Exchange (ASE) Patra and Poshakwale (2008) found out that
though major sectors do not show strong and consistent long term relationship, the
banking sector seems to have a strong influence on returns and volatility of other sectors
at least in the short run. Decomposition analysis of the variance confirms that although
the variance of returns for most sectors is influenced by their own innovations, the
banking sector is able to explain about 25% of the various in other major sectors like
construction and insurance and 15% of industrial, investment and holding sectors. Given
the critical role of the banking sector in the economy, changes in the sector’s index can
be used in predicting short term movement in other indexes.
Nishimura and Men (2010) assessed the daily and overnight spillover effect in common
stock prices between China and G5 countries. The study established a strong evidence of
short-run one-way volatility spillover effects from China to the US, UK, Germany, and
France stock markets. Contrary to the widespread belief, the empirical results suggested
that a small (China) stock market has significant influence on a large (G5) stock market
29
but not vice versa. The paradox was explained by the rapid growth and economic
development and severe capital regulation in China.
Kithinji and Ngugi (2009) studied the stock market performance before and after general
elections at NSE and they discovered that there is a significant difference in market
performance for the year before and after the general elections. Volatility also appears to
be lowest in the years before the elections and during the election year. Finally, they
found that market performance appeared to be strongly linked to political regimes and
prevailing political events. They concluded that election years should not have a major
impact on the investment decisions.
2.11 Overview on Literature Review
It is evident from both the theoretical and empirical review that stock indices are key
indicators of a stock market performance. This has made many market players to pay
keen interest on the movement of the indices. In addition to following the changes in
indices, they also pay attention to market capitalization to have a feel of the actual market
performance. This, therefore, implies that stock indices must be a good indicator of
market performance at any given time; failure to which their relevance would disappear.
From Adjasi, Harvey and Agyapong (2008) and McMillan and Thupayagale (2011)
studies it is important to understand macro economic variables that affect volatility in the
stock market as this will have an impact on market capitalization and resultant stock
indices. It is also important to note that information given by such indices could be on the
general stock market or sector based market information. Sutcliffe (2006) and Arnott,
Hsu and Moore (2005) have pointed out that all stock market indices have problems

30
though the magnitude vary from one index to another. As a result, different indices can
reinforce each other thereby giving market players finer details about a given stock
market.
31
CHAPTER THREE: RESEARCH METHODOLOGY
3.1 Introduction
This chapter outlines the research design, study population, data collection methods and
sources, the empirical model and measurement of variables.
3.2 Research Design
The study employs a correlation research design to determine the relationship between
market capitalization and NSE stock indices. A correlation establishes whether a change
(increase or decrease) in one market variable corresponds to a change (increase or
decrease) in one or more variables (Mugenda and Mugenda, 2003). This relationship was
done through the use of tools of regression and correlation.
3.3 Population and Sample
The study used historical (secondary data) on market capitalization, the NASI and the
NSE-20-Share Index obtained from the NSE quarterly publications for the period January
2008 – June 2011.The horizon of 42 months was used because it constitutes the period
immediately after inception of NASI into the NSE market and is adequate sample for
analysis. The population and sample comprised all the companies whose ordinary shares
were quoted on the Nairobi Stock Exchange for the period under consideration.
3.4 Data Sources and Collection
Data collection involved obtaining monthly secondary data on market capitalization, the
NSE 20 Share Index and the NASI Index from the NSE quarterly bulletins for the period
January 2008- June 2011.Monthly market capitalization data was the sum of all the
counters in the NSE calculated as outstanding shares per counter multiplied by the

32
monthly average price. NSE 20 share index was the monthly average as computed by the
formula applied by the NSE for the 20 companies that constitute the index.
Finally, the NASI monthly data incorporated all listed companies irrespective of their
performance and their time of listing computed as a market capitalization weighted index.
33
CHAPTER FOUR: DATA ANALYSIS AND INTERPRETATION OF
RESULTS
4.1 Introduction
This chapter presents the regression analysis results of NSE 20 Share Index, NASI
(independent Variables) and Market Capitalization (dependent) which will help in
answering the research questions. Data was analyzed using vector auto-regressive (VAR)
analysis model which was developed by Christopher A. Sims (1980). The model
specification had market capitalization and the NSE share indices as variables.
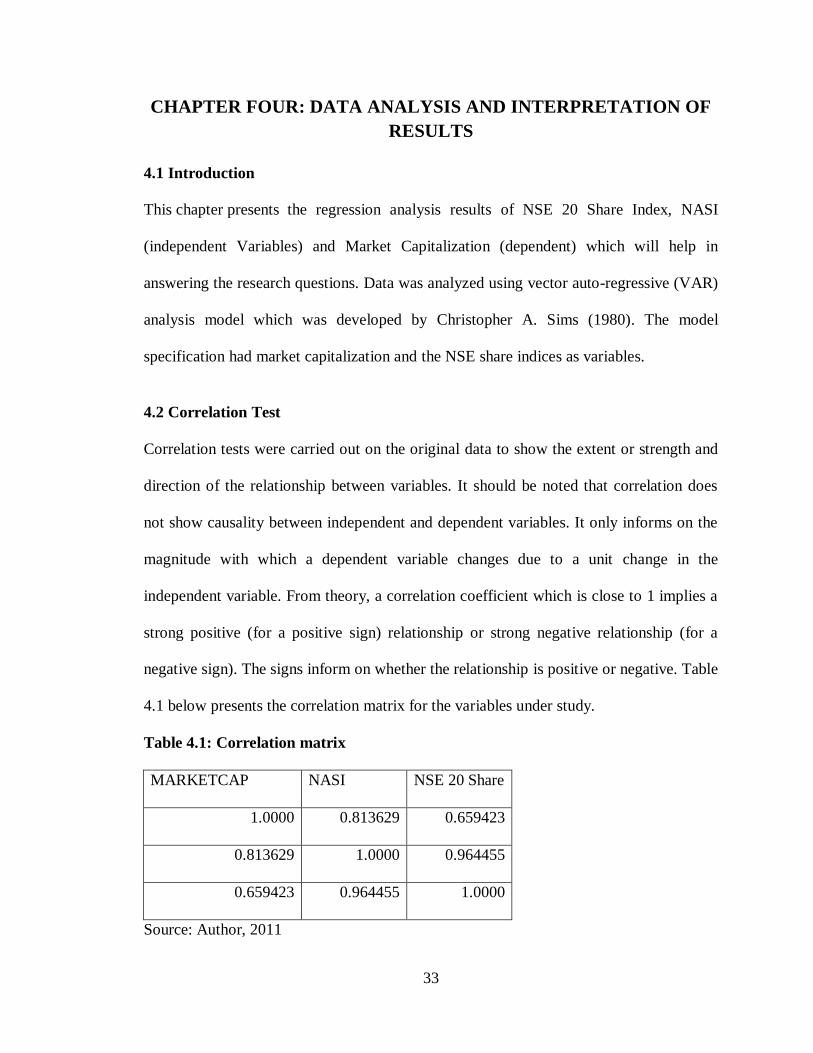
4.2 Correlation Test
Correlation tests were carried out on the original data to show the extent or strength and
direction of the relationship between variables. It should be noted that correlation does
not show causality between independent and dependent variables. It only informs on the
magnitude with which a dependent variable changes due to a unit change in the
independent variable. From theory, a correlation coefficient which is close to 1 implies a
strong positive (for a positive sign) relationship or strong negative relationship (for a
negative sign). The signs inform on whether the relationship is positive or negative. Table
4.1 below presents the correlation matrix for the variables under study.
Table 4.1: Correlation matrix
MARKETCAP NASI NSE 20 Share
1.0000 0.813629 0.659423
0.813629 1.0000 0.964455
0.659423 0.964455 1.0000
Source: Author, 2011

34
From table 4.1 above, there is a very strong positive correlation (0.813629) between
market capitalization and NASI and a rather strong positive relationship (0.659423)
between market capitalization and the NSE. The 0.964455 correlation coefficient
indicates that there was a mutually causality relationship between NSE 20 share index
and NASI
The implication of these results is that, market capitalization and the NASI will more
often than not move in the same direction than with the NSE 20 share index. This
situation is best explained by the constituent stock counters factored in the construction
of the two indices. As earlier mentioned, in the introduction chapter, NASI factors all the
stocks in the NSE while NSE 20 share index only comprises the 20 blue chip stocks. As a
result, NASI reflects the entire changes in stock prices. It is the respective stock price in
any given day and the outstanding ordinary shares that are used to calculate the market
capitalization. Therefore, NSE 20 share index maybe more volatile than the market
capitalization and the NASI due to these exclusion hence the low strength of the
relationship.
4.3 Unit Root Tests
Time series data are often assumed to be non-stationary and it is, therefore, necessary to
perform a pre-test to ensure there is a stationary-co-integrating relationship among the
variables to avoid spurious regression. The standard practice in time series literature,
therefore, obliges a check for unit roots in each series before estimating any equation.
35
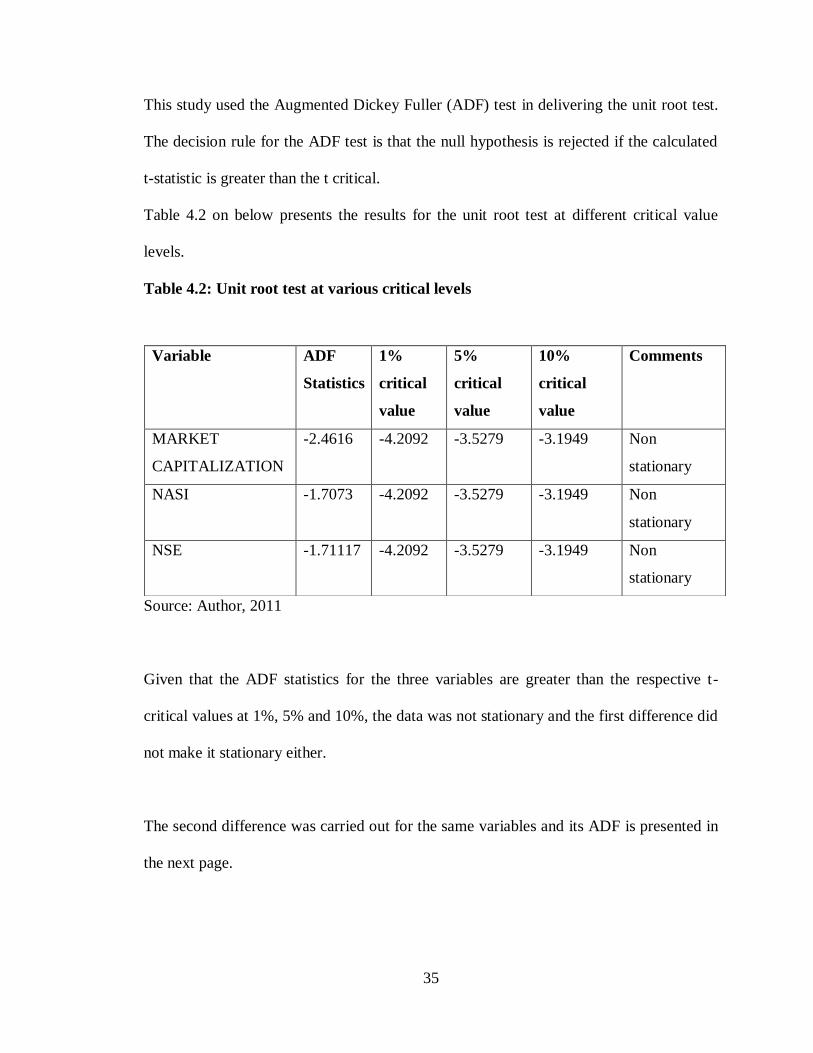
This study used the Augmented Dickey Fuller (ADF) test in delivering the unit root test.
The decision rule for the ADF test is that the null hypothesis is rejected if the calculated
t-statistic is greater than the t critical.
Table 4.2 on below presents the results for the unit root test at different critical value
levels.
Table 4.2: Unit root test at various critical levels
Source: Author, 2011
Given that the ADF statistics for the three variables are greater than the respective t-
critical values at 1%, 5% and 10%, the data was not stationary and the first difference did
not make it stationary either.
The second difference was carried out for the same variables and its ADF is presented in
the next page.
Variable ADF
Statistics
1%
critical
value
5%
critical
value
10%
critical
value
Comments
MARKET
CAPITALIZATION
-2.4616
-4.2092
-3.5279
-3.1949
Non
stationary
NASI -1.7073 -4.2092 -3.5279 -3.1949 Non
stationary
NSE -1.71117 -4.2092 -3.5279 -3.1949 Non
stationary

36
Table 4.3: Unit root test at second difference
Source: Author, 2011
All the variables are stationary after second difference given that ADF statistics is smaller
than the respective t-critical values. Regression results from such stationary data have
economic meaning and can be used to inform policy making and analysis.
Once stationality of the variables was established, regression was carried out to analyze
the relationship and significance of the independent variables in explaining variations in
dependent variables.
4.4 Regression results
Table 4.4 below presents the regression results for the variables under study.
Dependent Variable: DLOGMKTCAP
Method: Least Squares
Date: 10/02/11 Time: 21:35
Sample(adjusted): 2008:02 2011:06
Included observations: 41 after adjusting endpoints
Variable Coefficient Std. Error t-Statistic Prob.
DLNNSE 1.210531 0.13085 9.251295 0
DLNNASI 0.007471 0.006498 1.149675 0.2575
C -0.0311 0.028758 -1.08127 0.2864
R-squared 0.694538 F-statistic 43.20082
Adjusted R-squared 0.678461
Source: Author, 2011
Variable ADF
Statistics
1% critical
value
5% critical
value
10% critical
value
Comments
MARKET
CAPITALIZATION
-5.31225
-4.2242
-3.5348
-3.1988
Stationary
NASI -5.69111
-4.2242
-3.5348
-3.1988
Stationary
NSE -6.18614
-4.2242
-3.5348
-3.1988
Stationary
37
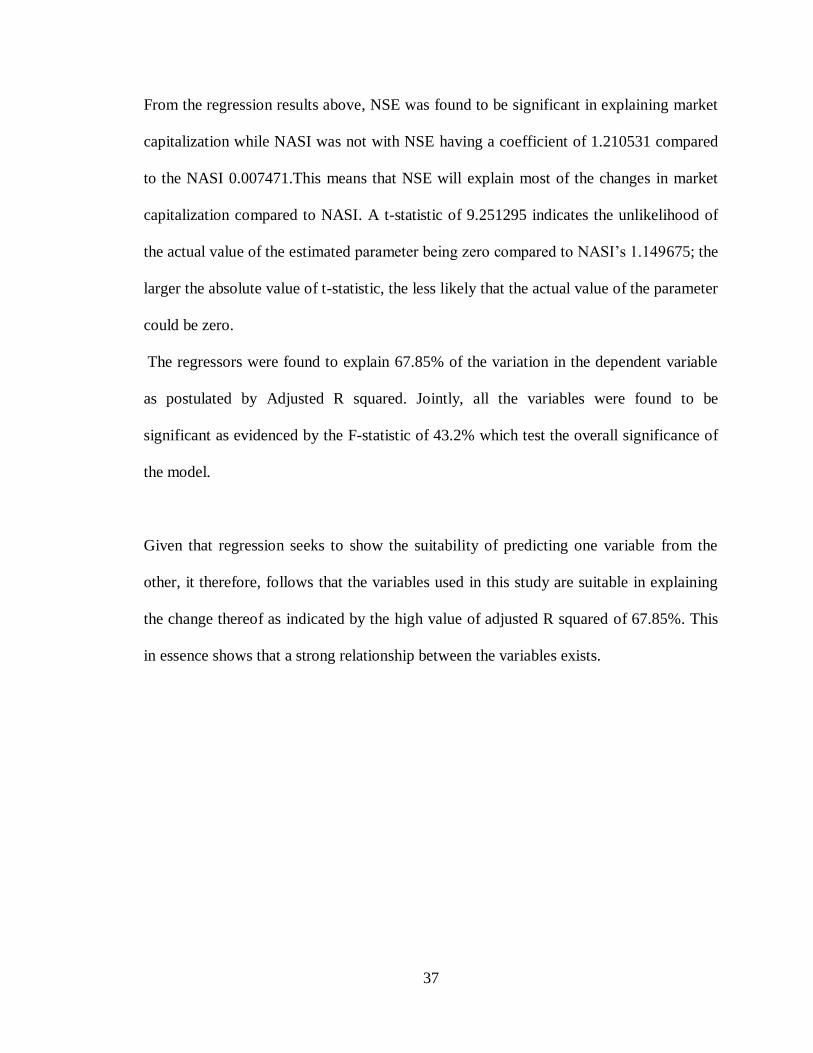
From the regression results above, NSE was found to be significant in explaining market
capitalization while NASI was not with NSE having a coefficient of 1.210531 compared
to the NASI 0.007471.This means that NSE will explain most of the changes in market
capitalization compared to NASI. A t-statistic of 9.251295 indicates the unlikelihood of
the actual value of the estimated parameter being zero compared to NASI’s 1.149675; the
larger the absolute value of t-statistic, the less likely that the actual value of the parameter
could be zero.
The regressors were found to explain 67.85% of the variation in the dependent variable
as postulated by Adjusted R squared. Jointly, all the variables were found to be
significant as evidenced by the F-statistic of 43.2% which test the overall significance of
the model.
Given that regression seeks to show the suitability of predicting one variable from the
other, it therefore, follows that the variables used in this study are suitable in explaining
the change thereof as indicated by the high value of adjusted R squared of 67.85%. This
in essence shows that a strong relationship between the variables exists.
38
CHAPTER FIVE: SUMMARY, CONCLUSION AND RECOMMENDATIONS
5.1 Summary and Conclusions
The study examined the relationship between market capitalization and stock indices at
Nairobi Stock Exchange. Regression analysis was used to establish the nature of
relationships of variables under the study. The study was motivated by the need to
establish how the two stock indices and NSE relate with market capitalization, especially
after the late introduction of the second index, that is, NASI. These indices are intended
to improve efficiency in dissemination of stock market information as well as gauging
investors’ sentiments at NSE from time to time. Historical data on market capitalization,
NSE 20 Share Index and NASI was obtained from the CMA annual reports and quarterly
statistical bulletins for the period January 2008 – June 2011.
Correlation matrix for the three variables shows that there is a very strong positive
correlation between market capitalization and NASI of 0.813629 (correlation coefficient)
and a strong positive relationship between market capitalization and the NSE of
0.659423. On the other hand, correlation coefficient between NASI and the NSE 20 share
index indicates a very strong positive correlation meaning that they move together in the
same direction.
Unit root test for the data revealed presence of unit root at levels by giving ADF statistics
for the three variables (market capitalization, NASI and NSE) greater than their
respective t critical values at various levels (see table 4.1 and 4.2) while the second
difference established stationarity on the data by having their ADF statistics smaller than
the respective t critical values (see table 4.3). From the regression results, NSE was found
to be significant in explaining market capitalization while NASI was not. The

39
explanatory variable was found to explain 67.85% of the variation in the dependent
variable. Jointly, all the variables were found to be significant as postulated by the F-
statistic where about 43% of the regressors explain variations in the dependent variable.
5.2 Recommendation
From the research findings, it is evident that stock market indices play an important role
in explaining variations on market capitalization. From the analysis made in the previous
chapter, various recommendations can be made. Their is need for users of stock indices to
understand their computations and constituent counters in any given stock exchange. For
example, the NSE 20 share index appears to be more significant in explaining variations
in market capitalization which could be attributed to the fact that the 20 counters that
constituent the index account for over 80% of the total turnover at the exchange on any
given day. This has the likelihood to present a strong co-movement between the market
capitalization and the NSE 20 share index as opposed to NASI which involves all the
counters including the least traded. Inclusion of the least traded counters in the
computation of the index results in smoothening out of the variations or the volatility of
the stock market. As a result, NSE needs to address that selection bias and related
anomalies in the indices.
5.3 Limitations of the Study
The study only concentrated on the relationship between market capitalization and stock
indices at NSE. As such, accuracy and reliability of the historical data used to generate
results for the study is only correct as captured in the data sources as any rounding off is
known to greatly affect the outcome of the indices. The data used was only for the period

40
January 2008 to June 2011. It is possible that data for the three variables for different
time periods may give slightly differing results especially where business cycles vary
from the one in the period under study.
5.4 Areas of Further Research
The findings of this study are only confined to the relationship between market
capitalization and stock market indices. Based on these findings further research can be
done to determine that relationship between the variables under different business cycles.
This study examined the relationship and the extent of the relationship of the variables
under study for a period of three and half years only; A further study can be done to
determine whether such relationship will hold in longer period. In addition, effects of
equity turnover on market capitalization can also be studied and its impact on the indices
established.

41
REFERENCES
Adjasi, C., Harvey, S.K. & Agyapong, D. (2008). Effects of exchange rate volatility on
the Ghana stock exchange. African Journal of Accounting, Economics, Finance
and Banking Research, 3(3), 32 - 40. Retrieved from
http://www.emeraldinsight.com
Branch, B. (1976). The predictive power of stock market indicators. Journal of Financial
and Quantitative Techniques, 11(2), 269 – 285. Retrieved from
http://web.ebscohost.com
Cary, L. C. & Chris, A. (1998). The concise Blackwell encyclopedia of management.
Massachusetts, MA: Blackwell Business Publishers Ltd
Chen, J. (2010). Essentials of technical analysis for financial markets. New Jersey, NJ:
John Wiley & Sons.
Chen, K.C., Guangzhong, L., & Wu, L. (2010). Price discovery for segmented US listed
China stocks: Location or market quality? Journal of Business Finance &
Accounting, 37(2), 242 – 269. Retrieved from http://search.ebscohost.com/
Chiou, I. (2011). The volatility transmission of stock returns in Asia, Europe and North
America. Managerial Finance, 37(5), 442 – 450. Retrieved from
http://www.emeraldinsight.com/search.htm
Engle R.E and Granger C.W.J. 1987. Cointegration and Error Correction-Representation,
Estimation and Testing. Econometrica. 55: 251-276.
Grant, R.M. (2009). Contemporary strategy analysis. 7th edition: West Sussex, WS: John
Wiley Higher Ed. publishers

42
Johansen, S., 1988. Statistical Analysis of Cointegration Vectors. Journal of Economic
Dynamics and Control. 12: 231-254.
Koller, Mckinsey, Goedhart, Wessels and Lastmckinsey (2010). Valuation: Measuring
and managing the value of companies. 4th
edition: West Sussex, WS: John
Wiley & Sons Ltd.
Lee, C.F., John L., and Alice, C.L. (2009). Handbook of quantitative finance and risk
management. New Jersey, NJ: Springer
Levine, R. & Zervos, S. (1996). Stock market, banks and economic growth. A policy
working paper. New York: World Bank WPS1690/ 1996
McMillan, D., & Thupayagale, P. (2011). Measuring volatility persistence and long
memory in presence of structural breaks: Evidence from African stock markets.
Managerial Finance, 37(3), 219 – 241. Retrieved from
http://www.emeraldinsight.com/search.htm
Mitchell, W.C. (1970). Business cycles. New York: Burt Franklin
Moles, P., Parrino, R., & Kidwell, D. (2011). Corporate finance. European edition: West
Sussex: John Wiley & Sons Ltd.
Mureithi, A. (2011, April 6). NSE 20 Share firms pay investors record dividends.
Business Daily. Retrieved from http://businessdaily.com
Ngugi, R.W. (2003). What defines liquidity of stock market? The case of Nairobi stock
exchange. Nairobi: Kippra DPP/29/2003.
Kithinji,N & Ngugi(2009).Stock Market Performance before and after general
election.Nairobi:Kippra DPP/32/2009.
43
Nishimura, Y., & Men, M. (2010). The paradox of China’s International stock market co-
movement: Evidence from volatility spillover effects between China and G5 stock
markets, Journal of Chinese and Foreign Trade, 3(3), 235 – 253. Retrieved from
http://www.emeraldinsight.com
Ngugi, R.W. and Njiru, R. (2005). Growth of the Nairobi Stock Exchange primary
Market. Nairobi: Kippra DPP/47/2005.
Oblienugh, J.P. (2010). Jonbull’s stock guide: How to invest profitably in a volatile stock
market. Victoria, BC: Trafford Publishing.
Olson, R.L. (2005). The handbook for investment committee members: How to make
prudent investment decisions for your organization. New Jersey, NJ: John
Wiley & Sons
Patra, T. and Poshakwale, S.S (2008). Long-run and short-run relationship between the
main stock indexes: Evidence from the Athens stock exchange, Journal of
Applied Financial Economics 18, 1401 – 1410.
Prof. Kirchgassner, G. & Wolters, J. (2007). Introduction to modern time series. Berlin:
Springer Publishers.
Pilinkus, D. (2010). Macroeconomic indicators and their impact on stock market
performance in the short run and long run: the case of Baltic States,
Technological and Economic Development of Economy 16(2), 291 – 304.
Retrieved from http://search.ebscohost.com/
Ranganatham, M. & Madhumathi, R. (2006). Investment analysis and portfolio
management. New Delhi, ND: Pearson Education Publishers
44
Richard & Tierney Inc. (2004). 602 Regents’s Investment consultant asset allocation
study. Presentation to the investment committee of the regents of university of
California on August 17, 2004. Retrieved from www.universityofcalifornia.edu
Roche, J. (2005). The value of nothing: Mastering business valuations. London: Les50ns
Financial Publishing Ltd.
Sims, C.A (1972). Money income and causality. American Economic Review 62, 540 –
652.
Sutcliffe, C.M. (2006). Stock index futures (3rd
ed). Hampshire: Ashgate Publishing
Company

45
APPENDICES
Appendix 1: Market Capitalization, NSE 20 Share index and NASI Data
Year/ Month
Market Cap
In Billions
NSE 20 SHARE
INDEX NASI
2008
JAN 777.10 4712.71 90.55
FEB 830.60 5072.41 98.6
MAR 781.70 4843.17 94.64
APR 908.20 5336.03 107.78
MAY 916.80 5175.83 108.82
JUN 1,230.70 5185.56 112.11
JUL 1,122.20 4868.27 101.74
AUG 1,102.00 4648.78 97.54
SEPT 972.30 4180.40 87.75
OCT 764.76 3386.65 68.84
NOV 791.41 3341.47 71.28
DEC 853.67 3521.18 73.37
2009
JAN 777.50 3198.90 67.17
FEB 611.50 2474.75 52.82
MAR 688.70 2805.03 59.49
APR 683.00 2800.10 58.86
MAY 693.40 2852.57 59.75
JUN 821.80 3294.56 70.96
JUL 826.80 3273.10 71.43
AUG 785.30 3102.68 67.79
SEPT 771.60 3005.41 66.73
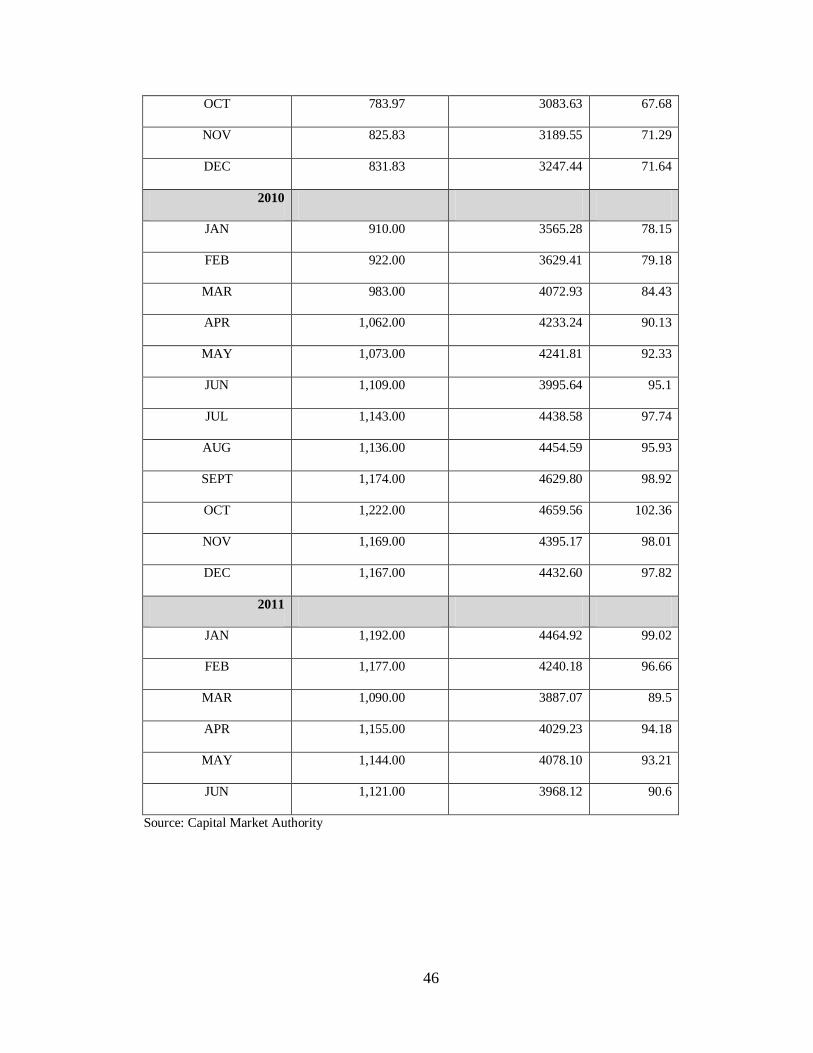
46
OCT 783.97 3083.63 67.68
NOV 825.83 3189.55 71.29
DEC 831.83 3247.44 71.64
2010
JAN 910.00 3565.28 78.15
FEB 922.00 3629.41 79.18
MAR 983.00 4072.93 84.43
APR 1,062.00 4233.24 90.13
MAY 1,073.00 4241.81 92.33
JUN 1,109.00 3995.64 95.1
JUL 1,143.00 4438.58 97.74
AUG 1,136.00 4454.59 95.93
SEPT 1,174.00 4629.80 98.92
OCT 1,222.00 4659.56 102.36
NOV 1,169.00 4395.17 98.01
DEC 1,167.00 4432.60 97.82
2011
JAN 1,192.00 4464.92 99.02
FEB 1,177.00 4240.18 96.66
MAR 1,090.00 3887.07 89.5
APR 1,155.00 4029.23 94.18
MAY 1,144.00 4078.10 93.21
JUN 1,121.00 3968.12 90.6
Source: Capital Market Authority

47
Appendix 2: NSE 20 Share Index Firms
1. Rea Vipingo
2. Sasini
3. Kenya Airways
4. Centum
5. Nation Media Group
6. Safaricom
7. Barclays
8. Equity
9. Kenya Commercial Bank
10. Standard Chartered Bank
11. Co-operative Bank
12. East African Breweries Ltd
13. Athi River Mining
14. Mumias Sugar
15. Bamburi Cement
16. British American Tobacco
17. Kengen
18. Kenya Power
19. Kenol Kobil
20. Express & CMC Motors
Source: Capital Market Authority