Embed Size (px)
Citation preview

Analysis of the sliding process
of restriction enzymes
Inauguraldissertation
zur Erlangung des Grades
Doktor der Naturwissenschaften
Dr. rer. nat.
Im Fachbereich Biologie und Chemie
der Justus-Liebig-Universität Gießen
vorgelegt von
Apothekerin
Carolin Menges
Gießen, 2015

Die vorliegende Arbeit wurde im Rahmen des Graduiertenkollegs „Enzymes and Mul-
tienzyme Complexes Acting on Nucleic Acids“ (GRK 1384) am Institut für Biochemie
des Fachbereichs 08 der Justus-Liebig-Universität in Gießen in der Zeit von Februar 2010
bis Oktober 2013 unter der Leitung von Prof. Dr. Alfred Pingoud durchgeführt.
Erstgutachter: Apl. Prof. Dr. Peter Friedhoff
Institut für Biochemie
Fachbereich Biologie und Chemie
Heinrich-Buff-Ring 58
35392 Gießen
Zweitgutachter: Prof. Dr. Reinhard Dammann
Institut für Genetik
Fachbereich Biologie und Chemie
Heinrich-Buff-Ring 58-62
35392 Gießen

Erklärung
Hiermit versichere ich, die vorliegende Dissertation selbständig und ohne fremde Hilfe
verfasst zu haben und keine anderen als die hier angegebenen Hilfsmittel benutzt zu ha-
ben. Alle Textstellen, die wörtlich oder sinngemäß aus veröffentlichten Schriften entnom-
men sind, und alle Angaben, die auf mündlichen Auskünften beruhen, sind als solche
kenntlich gemacht.
Gießen, den 23. Juni 2015
_______________________________________
(Carolin Menges)

Danksagung
Als aller erstes möchte ich mich sehr herzlich bei Prof. Dr. Alfred Pingoud bedanken,
dafür dass er mich als „fachfremde“ Pharmazeutin in seine Arbeitsgruppe aufgenommen
und mir dadurch die Möglichkeit zur Erstellung dieser Dissertation gegeben hat. Lieber
Ping, ich danke Ihnen für Ihre engagierte und liebevolle Betreuung, für die vielen hilfrei-
chen Ratschläge und natürlich für die unzähligen Fotos Ihrer Blümchen aus dem Garten,
mit denen Sie mir immer eine Freue bereitet haben. Vielen Dank für Ihr Vertrauen in
mich und meine Arbeit. Ich hätte mir keinen besseren Doktorvater vorstellen können.
Prof. Dr. Reinhard Dammann danke ich für die Übernahme des Zweitgutachtens.
Ich danke Dr. Wolfgang Wende für die hervorragend wissenschaftliche und liebevolle
Betreuung meiner Arbeit. Wolle, Danke für Deine große Geduld und Dein immer offenes
Ohr, für die stetige Motivation und Unterstützung und ganz besonders für die Momente
in denen Du mit Deinen „Zauberhänden“ die Dinge wieder zum Laufen gebracht hast.
Ich danke Prof. Dr. Peter Friedhoff für die zahlreichen wissenschaftlichen Diskussionen
(ob auf dem Flur oder vor dem Kaffeeautomaten), für die genialen Ideen und hilfreichen
Ratschläge, für die konstruktive Kritik und natürlich für die Aufnahme ins IRTG.
Ein riesen Dank geht an das Sekretariat. Ina und Karina, Danke dass ihr euch um alle
bürokratischen Belange gekümmert und zudem auch immer ein offenes Ohr für Probleme
jeglicher Art gehabt habt. Anja, danke für die tolle Organisation aller IRTG Aktivitäten.
Ich danke Ines und Jasmina für die schöne und lustige Zeit im Labor 1. Danke, dass ich
euren großen Schreibtisch bekommen habe nachdem ihr fertig wart . Ines, Dir danke
ich ganz besonders für die seelische und moralische Unterstützung, für die vielen Gesprä-
che und hilfreichen Diskussion und für die lustigen Dart und Billardabende zusammen
mit Roger. Von Dir kann man echt viel lernen!
Ich danke Sabrina, Betty und Heike für die technische Unterstützung im Labor. Sabrina,
danke, dass Du mich an Anfang meiner Arbeit in alles eingewiesen und begleitet hast und
dass man auch sonst mit Dir immer über alles quatschen konnte.
Darüber hinaus möchte ich mich beim Rest meiner Arbeitsgruppe am Institut für Bioche-
mie bedanken. Mert, Andi, Lilly, Laura, Fabian und Ping Ping, Danke für die tolle
Arbeitsatmosphäre und die lustigen Weihnachtsfeiern. Ich hatte mit euch eine wunder-
schöne und unvergessliche Zeit.

Ich danke allen Mitgliedern des IRTG’s und des GGL’s für die gute Zusammenarbeit
und die angenehme Arbeitsatmosphäre, für die zahlreichen Diskussionen in Seminaren
und für die interessanten Konferenzen.
Ich möchte ich mich bei meinen beiden Kollaborationspartnern aus Würzburg (Markus
Sauer, Sören Doose und Sebastian Letschert) und Paris (Pierre Desbiolles und Jasmina
Dikic) für die gute Zusammenarbeit, freundliche Aufnahme und Betreuung und vor allem
für die Einweisung in Fluoreszenzmikroskopie und Einzelmolekülstudien bedanken.
Mein Dank gilt zudem allen Studenten, die mich im Rahmen meiner Arbeit unterstützt
haben. Besonders zu nennen ist hier Bianca, die für mich unzählige Anisotropie Messun-
gen durchgeführt hat.
Ich danke meinen liebsten Freundinnen Isa, Romy und Elena für ihr Interesse an meiner
wissenschaftlichen Arbeit, auch wenn es manchmal über ihre Vorstellungskraft hinaus
ging (nein Romy, die Proteine kann man nicht im Eppi sehen… ) Danke für eure auf-
bauenden Worte und dafür, dass ihr immer an mich geglaubt habt.
Ganz besonders möchte ich mich aber bei meiner Familie und meinem Freund bedan-
ken. Danke für eure grenzenlose Unterstützung, für euer Verständnis und Vertrauen in
allem was ich mache, für die vielen hilfreichen Ratschläge fernab der Wissenschaft und
für die aufmunternden Worte, wenn’s mal nicht so gut lief. Ohne euch wäre das alles
nicht möglich gewesen. Danke, dass ihr immer für mich da seid. Ich liebe euch von gan-
zem Herzen!!!

Meinem Doktorvater
Prof. Dr. Alfred Pingoud
gewidmet

Publications
Dikić J., Menges C., Clarke S., Kokkinidis M., Pingoud A., Wende W., Desbiolles P. The
rotation-coupled sliding of EcoRV. Nucleic Acids Res. 2012 May; 40 (9):4064-70
Heller I., Sitters G., Broekmans O.D., Farge G., Menges C., Wende W., Hell S.W., Pe-
terman E.J.G., Wuite G.J.L. STED nanoscopy combined with optical tweezers reveals
protein dynamics on densely covered DNA. Nature Methods. 2013 Sep; 10 (9):910-6
Menges C., Dikić J., Friedhoff P., Wende W., Pingoud A. Facilitated diffusion of Type
II restriction endonucleases depends on size, conformation and salt concentration. In
preparation.
Oral presentations
June 2010, Moscow (Russia)
Off-Spring Meeting IRTG 1384
“Analysis of protein DNA interactions by single molecule experiments”
September 2011, Gießen (Germany)
4th GGL Annual Conference
„Analysis of the sliding process of restriction enzymes“
GGL Presentation Award for the best talk
June 2012, Bochum (Germany)
19. Arbeitstagung “Mikromethoden in der Proteinchemie”
„Untersuchung des Sliding Prozesses von Restriktionsenzymen unter Verwendung von
Einzelmolekültechniken“
Thermo Fisher Scientific Price for the best talk

Poster presentations
May 2010, Vilnius (Lithuania)
Workshop IRTG 1384 “Enzymes and multienzyme complexes acting on nucleic acids”
„Analysis of the sliding process of restriction enzymes by single molecule techniques“
August 2010, Bremen (Germany)
6th NEB Meeting on DNA Restriction and Modification
„Analysis of the sliding process of restriction enzymes by single molecule techniques“
September 2010, Gießen (Germany)
3th GGL Annual Conference
„Analysis of the sliding process of restriction enzymes by single molecule techniques“
September 2011, Frankfurt am Main (Germany)
GBM Tagung „Molecular Life Sciences“
„Analysis of the sliding process of restriction enzymes by single molecule techniques“
August 2012, Oxford (England)
73rd Harden Conference „Machines on genes II - The central dogma at the interface of
biology, chemistry and physics“
„Analysis of the sliding process of restriction enzymes by single molecule techniques“
September 2012, Gießen (Germany)
5th GGL Annual Conference
„Analysis of the sliding process of restriction enzymes by single molecule techniques“

Abbreviations 9
Abbreviations
α alpha
aa Amino acids
AdoMet Adenosyl methionine
APS Ammonium peroxide sulfate
ATP Adenosine triphosphate
bp Base pair
BHQ Black hole quencher
BSA Bovine serum albumin
CCD Charge coupled device
CF Correction factor
CIAP Calf intenstinal alkaline phosphatase
Δ delta
D1 one-dimensional diffusion coefficient
Da Dalton
DMSO Dimethylsulfoxid
DNA Deoxyribonucleic acid
dNTP Deoxyribonucleic triphosphate
DOL Degree of labeling
DTT 1,4-Dithiotreitol
ε Extinction coefficient
E FRET efficiency
E. coli Escherichia coli
e.g. Exampli gratia (for example)
EDTA Ethylenediaminetetraacetic acid
ξ Friction coefficient
FCS Fluorescence correlation spectroscopy
FP Fusion protein scRM6 D54C – EcoRV C21S
FRET Förster resonance energy transfer
g gram
HEX Hexachloro fluorescein
His Histidin
HPLC High performance liquid chromatography
i.e. It est (such as)
IPTG Isopropyl-β-D-1-thiogalactopyranoside
k kilo
kcat turnover number
KD equilibrium dissociation constant
kdiff diffusion constant
KM Michaelis-Menten constant
kon association rate constant
koff dissociation rate constant
KGB Potassium glutamate buffer

Abbreviations 10
λ lambda (wavelength or sliding length)
l liter
LB Luria bertani
LEW Lysis-, equilibration- and wash
lin linear
µ micro
m milli
M Molar
min minute
MSD Mean squared displacement
MT Methyl transferase
MW Molecular weight
n nano
NTA Nitrilotriacetic acid
o/n over night
oc open circle
OD Optical density
p pico
PAGE Polyacrylamide gel electrophoresis
PBS Phosphate buffered saline
PCR Polymerase chain reaction
PEG Polyethylene glycol
r anisotropy
RE Restriction endonuclease
rpm rotations per minute
RT Room temperature
s second
sc supercoiled or single chain
SDS Sodium dodecyl sulfate
STE Sodium-tris-EDTA
t time
τ dwell time
TBE Tris-borate-EDTA
TCA Trichlor acidic acid
TCEP Tris(2-chlorethyl)phosphate
TEMED N,N,N’,N’-tetramethylethylendiamin
TIRFM Total internal reflection fluorescence microscopy
TM Temperature
TPE Tris-phosphate-EDTA
Tris Tris-(hydroxymethyl)-aminomethan
UV ultraviolett
V volume
vs. versus
wt wild type
Table of content 11
Table of content
Abbreviations .................................................................................................................. 9
Table of content ............................................................................................................. 11
1 Introduction ........................................................................................................... 14
1.1 Restriction enzymes ......................................................................................... 14
1.1.1 Type II restriction enzymes ........................................................................ 15
1.1.1.1 Three dimensional structure of Type II restriction enzymes .............. 16
1.1.1.2 Target site location of Type II restriction enzymes ............................ 24
1.2 Single-molecule experiments .......................................................................... 28
1.2.1 Studying rotational motion by single-molecule experiments ..................... 33
1.3 Aim .................................................................................................................. 35
2 Material and methods ........................................................................................... 37
2.1 Material .......................................................................................................... 37
2.1.1 Chemicals .................................................................................................... 37
2.1.2 Buffers ........................................................................................................ 38
2.1.3 Bacterial strains ........................................................................................... 40
2.1.4 Plasmids ...................................................................................................... 41
2.1.5 Oligonucleotides ......................................................................................... 42
2.1.6 Enzymes and proteins ................................................................................. 45
2.1.7 Markers ....................................................................................................... 46
2.1.8 Fluorophores ............................................................................................... 46
2.2 Methods ........................................................................................................... 48
2.2.1 Microbiological methods ............................................................................ 48
2.2.1.1 Preparation of electro-competent cells ............................................... 48
2.2.1.2 Electroporation .................................................................................... 48
2.2.2 Molecular biology methods ........................................................................ 49
2.2.2.1 Electrophoresis .................................................................................... 49
2.2.2.2 Polymerase chain reaction (PCR) ....................................................... 50
2.2.2.3 Isolation of DNA ................................................................................ 51
2.2.2.4 Ethanol precipitation ........................................................................... 51

Table of content 12
2.2.2.5 Determination of DNA concentration ................................................. 52
2.2.2.6 Site-directed mutagenesis ................................................................... 52
2.2.2.7 Cloning ................................................................................................ 53
2.2.2.8 Screening ............................................................................................ 54
2.2.2.9 Protein overexpression ........................................................................ 54
2.2.2.10 Protein purification ......................................................................... 55
2.2.2.11 TCA precipitation ........................................................................... 57
2.2.2.12 Determination of protein concentration .......................................... 57
2.2.2.13 Determination of protein cleavage activity ..................................... 57
2.2.2.14 PEG modification ........................................................................... 58
2.2.3 Fluorescence spectroscopy based methods ................................................. 58
2.2.3.1 Binding activity studied by fluorescence anisotropy .......................... 58
2.2.3.2 Michaelis-Menten kinetics .................................................................. 60
2.2.3.3 Competitive cleavage assay ................................................................ 62
2.2.3.4 Fluorescent labeling ............................................................................ 63
2.2.3.5 Determination of the degree of labeling (DOL) ................................. 65
2.2.3.6 FRET measurements ........................................................................... 65
2.2.3.7 Single-molecule experiments .............................................................. 70
3 Results .................................................................................................................... 71
3.1 Preparation of an elongated restriction enzyme to study rotational motion .. 71
3.1.1 Preparation of the scRM6-EcoRV fusion protein ....................................... 73
3.1.1.1 Purification of the scRM6-EcoRV fusion protein .............................. 75
3.1.2 Biochemical characterization of the scRM6-EcoRV fusion protein .......... 77
3.1.2.1 Determination of cleavage activity ..................................................... 77
3.1.2.2 Determination of binding activity ....................................................... 78
3.1.2.3 Michaelis-Menten kinetics .................................................................. 80
3.1.3 Studying the spatial expansion via FRET ................................................... 81
3.1.4 Single-molecule experiments ...................................................................... 85
3.2 Comparison of structurally different restriction enzymes .............................. 88
3.2.1 Preparation of single-cysteine variants ....................................................... 88
3.2.1.1 Determination of binding and cleavage activity ................................. 89
3.2.1.2 Testing the accessibility of single-cysteine residues .......................... 90
3.2.1.3 Site-specific labeling of single-cysteine variants ................................ 91

Table of content 13
3.2.2 Studying the conformation of structurally different restriction enzymes ... 93
3.2.3 Studying linear diffusion of structurally different restriction enzymes .... 104
3.2.3.1 Substrate length dependence of linear diffusion ............................... 105
3.2.3.2 Salt dependence of linear diffusion .................................................. 112
3.2.3.3 Structure dependence of linear diffusion .......................................... 117
4 Discussion ............................................................................................................ 120
4.1 Preparation of an elongated restriction enzyme to study rotational motion 120
4.1.1 Preparation of the scRM6-EcoRV fusion protein ..................................... 121
4.1.2 Biochemical characterization of the scRM6-EcoRV fusion protein ........ 123
4.1.3 Studying the spatial expansion via FRET ................................................. 125
4.1.4 Single-molecule experiments .................................................................... 127
4.2 Comparison of structurally different restriction enzymes ............................ 132
4.2.1 Preparation of single-cysteine variants ..................................................... 132
4.2.2 Studying the conformation of structurally different restriction enzymes . 134
4.2.3 Studying linear diffusion of structurally different restriction enzymes .... 144
5 Summary .............................................................................................................. 152
6 Zusammenfassung .............................................................................................. 154
7 References ............................................................................................................ 156
1 Introduction 14
1 Introduction
1.1 Restriction enzymes
Restriction enzymes are specific endonucleases and components of restriction modifica-
tion (RM) systems that can be found among bacteria [1], archaea [2] and in certain viruses
[3]. Their main function in vivo is the protection of their host against foreign DNA, e.g.
phage DNA. However, restriction enzymes are also important in vitro tools for recombi-
nant DNA work and widely-used in molecular biological and biochemical laboratories.
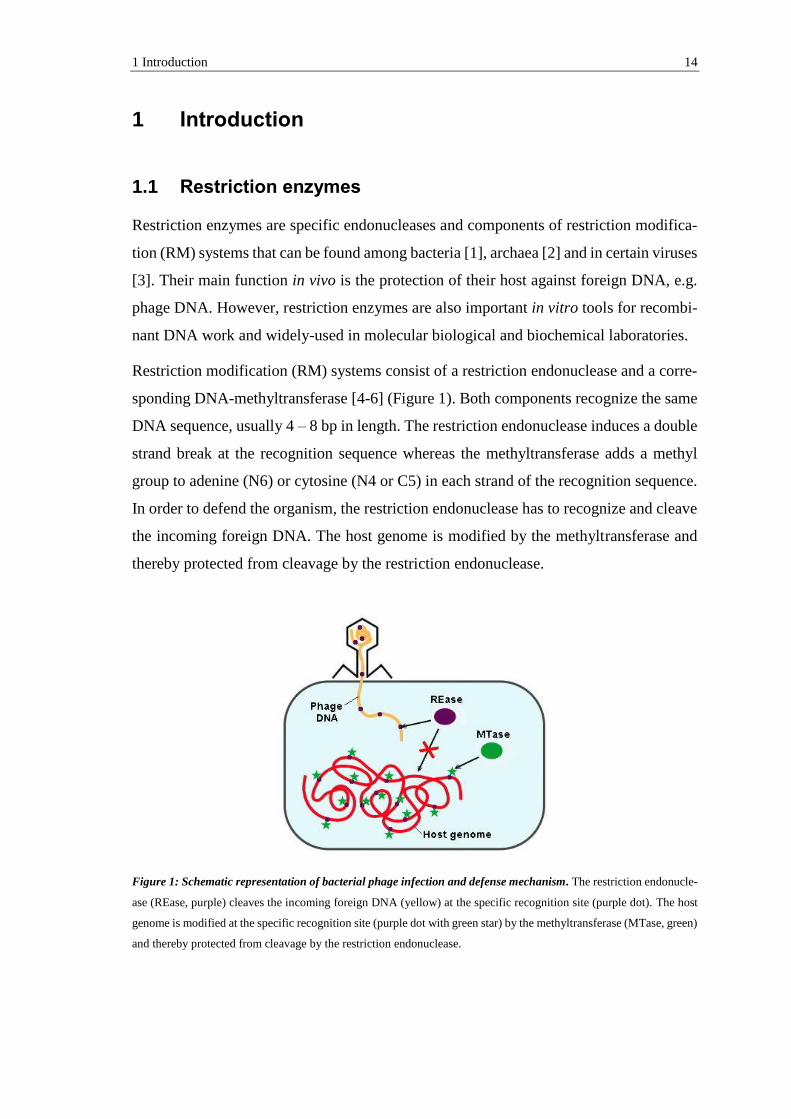
Restriction modification (RM) systems consist of a restriction endonuclease and a corre-
sponding DNA-methyltransferase [4-6] (Figure 1). Both components recognize the same
DNA sequence, usually 4 – 8 bp in length. The restriction endonuclease induces a double
strand break at the recognition sequence whereas the methyltransferase adds a methyl
group to adenine (N6) or cytosine (N4 or C5) in each strand of the recognition sequence.
In order to defend the organism, the restriction endonuclease has to recognize and cleave
the incoming foreign DNA. The host genome is modified by the methyltransferase and
thereby protected from cleavage by the restriction endonuclease.
Figure 1: Schematic representation of bacterial phage infection and defense mechanism. The restriction endonucle-
ase (REase, purple) cleaves the incoming foreign DNA (yellow) at the specific recognition site (purple dot). The host
genome is modified at the specific recognition site (purple dot with green star) by the methyltransferase (MTase, green)
and thereby protected from cleavage by the restriction endonuclease.

1 Introduction 15
Bacteria and archaea exhibit numerous restriction modification (RM) systems. As a re-
sult, several different restriction enzymes were discovered over the years. Generally, four
types of restriction endonucleases can be distinguished [7-9], based on their subunit com-
position, cofactor requirement and cleavage mechanism.
Type I restriction endonucleases consist of three different subunits, which are responsible
for modification (HsdM), restriction (HsdR) and recognition (HsdS), respectively. Type
I restriction endonucleases require ATP, Mg2+ and S-adenosyl methionine (AdoMet) for
their activity and interact with two asymmetrical bi-partite recognition sites. The DNA is
cleaved distal to the recognition site, approximately half-way between two sites [10,11].
Type II restriction endonucleases are the most frequently found enzymes and can be fur-
ther divided into different subtypes [12]. Enzymes belonging to this type are used as pow-
erful tools for genetic engineering processes. All restriction enzymes used in this work
(EcoRV, PvuII and BsoBI) belong to this type and are further described in chapter 1.1.1.
Type III restriction endonucleases consist of two different subunits, which are responsi-
ble for recognition / modification (Mod) and cleavage (Res). Type III restriction endonu-
cleases require ATP and Mg2+ for their activity and are stimulated by AdoMet. They in-
teract with two asymmetrical head-to-head recognition sites and cleave the DNA close to
one recognition site [13,14].
Type IV restriction endonucleases consist of two different subunits, which are responsi-
ble for recognition and cleavage. Type IV enzymes cleave methylated DNA, hence they
are not part of a RM system. They require GTP and Mg2+ for their activity and interact
with at least two recognition sequences at a variable distance. Cleavage of the DNA oc-
curs close to one recognition site [15].
1.1.1 Type II restriction enzymes
Type II restriction enzymes are the biochemically and structurally best characterized spe-
cific nucleases [12,16-18]. In comparison to other types, Type II restriction endonucleases
have a more simplified subunit organization, being usually homodimeric or homotetram-
eric. Cleavage of the DNA occurs within or close to their recognition site. Type II re-
striction endonucleases do not require ATP or GTP, but still require Mg2+ as cofactor.
Because of their great diversity, they are further divided into 11 different subtypes, based
on their properties.

1 Introduction 16
Type IIA enzymes (e.g. Bpu10I) are dimers of non-identical subunits and recognize
asymmetric sequences. Each subunit cleaves one strand of the DNA. Type IIB enzymes
(e.g. BpII) cleave the DNA at both sides of the recognition sequence. Type IIC enzymes
(e.g. BcgI) possess both cleavage and modification domains within one polypeptide. Type
IIE enzymes (e.g. EcoRII, NaeI) interact with two copies of their recognition sequence,
one being the target, the other being an allosteric effector. Type IIF enzymes (e.g. Cfr10I,
SfiI) are homotetrameric, interact with two copies of their recognition sequence and
cleave both of them. Type IIG enzymes (e.g. Eco57I) have both cleavage and modifica-
tion domains within one polypeptide and are a subgroup of Type IIC enzymes. Most of
them are also Type IIS enzymes. Type IIH enzymes (e.g. AhdI) behave like Type II en-
zymes but are genetically organized like Type I enzymes. Type IIM enzymes (e.g. DpnI)
recognize a specific methylated sequence and cleave the DNA at a fixed site. Type IIP
enzymes are homodimers, recognize palindromic sequences of 4 – 8 bp in length and
cleave both strands within the recognition sequence producing 3’-hydroxyl and 5’-phos-
phate ends. Most enzymes used for genetic engineering processes are Type IIP enzymes.
Some of the best-studied restriction endonucleases, as EcoRI and EcoRV, belong to this
subtype. Type IIS enzymes (e.g. FokI, BfiI) recognize asymmetric sequences and cleave
at least one strand of the DNA outside of the recognition site (cleavage site is shifted from
the recognition site). Type IIT enzymes (e.g. BsII) are heterodimers with two different
subunits.
1.1.1.1 Three dimensional structure of Type II restriction enzymes
Orthodox Type II restriction enzymes are homodimers of identical subunits. Each subunit
consists of one domain (exceptions are Type IIE and IIS enzymes, which harbor two do-
mains) which is again composed of three subdomains, each responsible for recognition,
cleavage and dimerization. Although type II restriction enzymes exhibit low sequence
similarity, they share common structural properties. All type II restriction enzymes pos-
sess a common core motif (CCM), which is highly conserved [17] (Figure 2). The core
consists of a five-stranded mixed β-sheet, which is surrounded by two α-helices [19]. The
catalytic residues of the PD…(D/E)xK motif (x represents a hydrophobic residue) are
located on the second and third strand [20]. The fourth and the fifth strand can be either
parallel (EcoRI) or antiparallel (EcoRV) to each other. Based on this, Type II restriction
enzymes can be further divided into two different structural families, namely the EcoRI
and the EcoRV family [1,21].

1 Introduction 17
Enzymes belonging to the EcoRI family approach the DNA from the major groove and
recognize the DNA via an α-helix and an α-loop. The resulting fragments have ‘sticky
ends’ with 5’-overhangs. Well-known representatives of this family are FokI, BamHI and
BsoBI. Enzymes from the EcoRV family attack the DNA from the minor groove, recog-
nize the DNA via a β-strand and a β-turn and produce fragments with ‘blunt’ or 3’-stag-
gered ‘sticky ends’. Representatives of this family are for example PvuII, BglI and NaeI.
Figure 2: Topology of the Type II restriction endonuclease EcoRV. α-helices are indicated in light yellow, β-strands
are indicated in light blue. The central five-stranded β-sheet is shaded grey. The location of the PD…D/ExK motif in
the second and third strand is indicated in red. Note, that the fourth and fifth strand are antiparallel. C = C-terminal end
of the polypeptide chain, N = N-terminal end of the polypeptide chain.
Several crystal and co-crystal structures of Type II restriction endonucleases are available
in the protein data bank [22], most of them representing the free enzyme or the specific
enzyme-DNA complex [18]. By comparing these two kind of structures, one can realize
that restriction enzymes have to undergo large conformational changes in order to bind
to DNA. And indeed, many studies revealed that binding to the specific recognition se-
quence is coupled to extensive changes in the conformation of the enzyme [23] (as well
as changes in the conformation of the DNA). Two different types of conformational
changes can be distinguished: On the one hand local conformational changes, like the
structuring of regions, which are unstructured before (e.g. unfolding of α-helices to form
“arms” [24], folding of disordered regions [25], ordering of disordered loops [25]) and on
the other hand quaternary conformational changes, like the repositioning or the rotation
of subunits and subdomains. This repositioning can be achieved in a tongue-like move-
ment [26], which means opening of the DNA-binding cleft by a motion of the two subu-
nits perpendicular to the DNA-axis (e.g. BamHI and PvuII) or in a scissor-like movement,
which means opening of the DNA-binding cleft by a motion of the subunits parallel to

1 Introduction 18
the DNA-axis (e.g. EcoRV [27], BsoBI [27] and BglII [28]). Both types of conforma-
tional changes are interrelated, since local changes of flexible regions can trigger large
quaternary changes of rigid regions.
As mentioned above, most structures are available for the free enzyme or the specific
enzyme-DNA complex. However, the non-specific enzyme-DNA complex is an im-
portant intermediate step and it represents the structure of an enzyme diffusing along the
DNA [29]. For this reason, the structure of the non-specific complex can provide im-
portant information on how the enzyme switches from non-specific to specific binding
and it can give insight into what the structural basis for linear diffusion is. So far, struc-
tural information on the non-specific enzyme-DNA complex is available for two re-
striction enzymes only (EcoRV [30], BamHI [29]). Because of the similarities found in
both systems, some general statements about the non-specific complex in comparison to
the specific complex could be made: Nonspecific complexes are more hydrated at the
protein-DNA interface, thus have a smaller protein-DNA contact surface and are less
compact [29,30]. The DNA-binding cleft is more open and the catalytic centers are posi-
tioned far away from the phosphodiester backbone. A closing around the non-specific
DNA would lead to sterical clashes, because of the non-complementarity. Additionally,
a more open complex allows for more flexibility of some segments in order to scan the
DNA for specific elements. The DNA is accommodated only loosely, no interactions with
the bases can be observed [31]. Instead all contacts are formed to the phosphodiester
backbone and are mainly electrostatic interactions and hydrogen bonds. A balance of at-
tractive and repulsive forces holds the protein and the DNA together. In summary, the
arrangement of enzyme and DNA in the non-specific complex shows up to be appropriate
for preventing catalysis while allowing for sliding.
In addition to the similarities found in both systems, there is also one major difference.
The crystal structure of the non-specific BamHI-DNA complex showed that the confor-
mation was extensively rearranged compared to the specific complex [29]. For EcoRV,
the non-specific complex instead revealed that the overall conformation is very similar to
that of the specific complex [32]. This demonstrates, that large conformational adaptions
are not necessarily required and that also small changes in the conformation are sufficient
for the recognition process. The three dimensional structures of the restriction enzymes
used in this study (EcoRV, PvuII and BsoBI) are described in more detail in the following
section.

1 Introduction 19
EcoRV restriction enzyme
EcoRV is one of the best characterized Type IIP restriction endonucleases. The name
‘Eco’ is derived from the gram-negative bacterium Escherichia Coli (E. coli), the organ-
ism from which the enzyme was firstly isolated. EcoRV forms a homodimer of two iden-
tical subunits. Each subunit contains 244 amino acids and has a molecular weight of 29.5
kDa. The enzyme recognizes the palindromic sequence 5’-GAT↓ATC-3’ and cleaves
within the central TA step, leaving ‘blunt ends’. Thus, it is numbered among the EcoRV
family. For its activity, EcoRV requires Mg2+-ions. EcoRV is one of a few restriction
enzymes, for which all relevant crystal structures are available. The free enzyme (1RVE),
the non-specific complex (2RVE) and the specific complex (4RVE). Each subunit of the
enzyme is organized into three different subdomains, the dimerization, the catalytic and
the recognition subdomain (see Figure 3). The dimerization subdomain consists of a short
α-helix and a two-stranded antiparallel β-sheet, followed by a long α-helix, which is al-
ready part of the catalytic subdomain. The catalytic subdomain consists of the common
five-stranded β-sheet (two short and three long β-strands), two α-helices and a glutamine-
rich-loop (Q-loop). The catalytic residues D74, D90 and K92 are located in the Q-loop
and on the third β-strand, respectively and make contacts to the bases in the minor groove
of the DNA. The recognition domain consists of two α-helices and two short β-strands
which are connected by a loop (recognition-loop, R-loop). Residues located in the R-loop
are responsible for all base-specific contacts in the major groove and contacts to the phos-
phodiester backbone.
Figure 3: Crystal structures of the EcoRV restriction endonuclease. (a) Crystal structure of the free enzyme (1RVE),
(b) Co-crystal structure of the non-specific EcoRV-DNA complex (2RVE), (c) Co-crystal structure of the specific
EcoRV-DNA complex (4RVE). The different subdomains are marked in one subunit: blue = dimerization subdomain,
purple = catalytic subdomain, cyan = recognition subdomain. The two loops (Q-loop and R-loop) are located in the
catalytic and recognition subdomain, respectively. The DNA is shown in red.

1 Introduction 20
The free EcoRV enzyme forms a U-shaped dimer whose cleft seems to be too narrow to
accommodate DNA. The R- and the Q-loops are disordered and occupy the space in the
cleft. Thus, the enzyme has to open the DNA-binding cleft to allow DNA entry. It was
hypothesized, that the free restriction enzyme oscillates between an open and a closed
state and that the opening is triggered by the association of the outer sides of the C-termi-
nal arms of EcoRV with the DNA molecule [33]. The conformation of the non-specific
complex seems to be more open in comparison to the free enzyme. The Q-loops, which
are located at the bottom of the DNA-binding cleft become ordered [30], the R-loops
instead, which are located at the top of the DNA-binding cleft stay partly disordered. They
wrap over the DNA molecule, which allows them to make van der Waal’s contacts with
each other [30] but no contacts with the DNA bases. It was assumed, that the flexible R-
loops can probe the local DNA sequence during linear diffusion [30]. The orientation of
the subunits changes only slightly in the non-specific complex. The DNA is embedded in
DNA-binding cleft with the minor groove facing the floor and the major groove facing
the top of the cleft. It is close to B-form and no central bend of the DNA can be observed.
The specific complex seems to be more closed compared to the non-specific complex.
The R-loops become ordered and make contacts to the outer bases in the major groove of
the DNA. The orientation of the subunits changes in a mainly scissor-like movement,
which brings the two subunits closer together and allows EcoRV to embrace the DNA. In
the specific complex also the conformation of the DNA changes. It becomes sharply bent
by an angle of 55°, which locally unwinds the DNA, unstacks the central two base pairs
of the recognition sequence and brings the scissile phosphate close to the active site. The
major groove becomes narrower and deeper and the minor groove wider and shallower.
PvuII restriction enzyme
PvuII is a Type IIP restriction endonuclease and belongs to the EcoRV family. The en-
zyme was firstly isolated from the gram-negative bacterium Proteus vulgaris and is one
of the smallest known restriction enzymes. It consists of two identical subunits with a
molecular weight of 18.5 kDa and 157 amino acids. PvuII recognizes the palindromic
sequence 5’-CAG↓CTG-3’ and produces ‘blunt ends’ after the Mg2+ dependent hydroly-
sis. For PvuII, only the crystal structure of the free enzyme (1PVU) and the specific com-
plex (1PVI) are available. Each subunit of the enzyme is organized into three different
subdomains, the dimerization, the catalytic and the recognition subdomain (see Figure 4).

1 Introduction 21
The dimerization subdomain consists of a long α-helix and a loop (L-AB loop), followed
by a short α-helix, which is already part of the catalytic subdomain. Residues located in
the L-AB loop make contacts in the minor groove of the DNA. The catalytic subdomain
consists of the common five-stranded β-sheet (two short and three long β-strands), an
additional short β-strands, two α-helices and a loop (L-12). The catalytic residues D58,
E68 and K70 are located in the L-12 loop and on the third β-strand, respectively and make
contacts to the bases in the minor groove of the DNA. The recognition subdomain is
formed by two α-helices and two antiparallel β-strands. Each α-helix-β-strand pair is con-
nected by a loop, which contains on the one hand a histidine-triplet (L-4C loop) and on
the other hand an asparagine-duplet (L-7D loop), both being responsible for the specific
interactions with the bases in the major groove and contacts to the phosphodiester back-
bone. PvuII shows an extensive structural homology to EcoRV regarding the catalytic
and the recognition subdomain. The L-12 loop for example is equivalent to the Q-loop,
the histidine-triplet and the asparagine-duplet (located in the L-4C and L7D loops) can
also be found in the R-loop of EcoRV. The dimerization subdomains of both enzymes are
instead unrelated [34].
Figure 4: Crystal structures of the PvuII restriction endonuclease. (a) Crystal structure of the free enzyme (1PVU),
(b) Co-crystal structure of the specific PvuII-DNA complex (1PVI). The different subdomains are marked in one sub-
unit: blue = dimerization subdomain, purple = catalytic subdomain, cyan = recognition subdomain. The three loops (L-
AB, L-12 and L-4C) are located in the dimerization, catalytic and recognition subdomain, respectively. The DNA is
shown in red.
The free PvuII enzyme forms a U-shaped dimer, whose cleft is considerably more open
than it could be found in other crystal structures of restriction enzymes [34]. This open
conformation does not allow a complete binding to the DNA with both subunits. Only a
small region at the bottom of the DNA-binding cleft (L-AB loop) could contact the DNA
with both subunits simultaneously.

1 Introduction 22
Since the L-AB loop is positioned at the interface between the dimerization and catalytic
subdomain, it was assumed that interactions of the L-AB loop with the DNA induce mo-
tions of the subdomains, thereby bringing the enzyme in a more closed conformation [34].
Indeed, in the specific complex the two subunits approach each other, thereby closing the
DNA-binding cleft in a tongue-like movement [35]. The protein wraps around the central
G-C base pairs and an additional hydrogen bond is formed between the side chains of
His85, which is located in the L-4C loop in the recognition subdomain of each subunit.
The distance between these two histidine residues decreases by more than 20 Å during
the transition from the free enzyme to the specific complex [35]. So far, it is unclear
whether this hydrogen bond is also formed in the non-specific complex in order to keep
the protein on the DNA while scanning for the specific recognition sequence. The DNA
is located in the cleft between the two subunits with the minor groove facing the bottom
and the major groove facing the top of the cleft. It retains its characteristic B-form.
BsoBI restriction enzyme
BsoBI is a thermostable Type IIP restriction endonuclease, which belongs in contrast to
EcoRV and PvuII to the EcoRI family. It was isolated from the thermophilic gram-posi-
tive bacterium Bacillus stearothermophilus and has therefore a temperature optimum of
65°C. Each subunit of the homodimer has a molecular weight of 36.7 kDa and contains
323 amino acids. The enzyme recognizes the palindromic sequence 5’- C↓YCGRG -3’ (Y
represents a pyrimidine, and R represents a purine) and cleaves between the first and second
base, leaving ‘sticky ends’ with 5’-overhangs. Like EcoRV and PvuII, it requires Mg2+-
ions for DNA cleavage. For BsoBI only the crystal structure of the specific complex
(1DC1) is available, which revealed that the enzyme forms a tunnel around the DNA [36].
Each subunit of the enzyme is organized into two different subdomains, the helical and
the catalytic subdomain (see Figure 5). The helical subdomain consists of a total of five
α-helices, beginning and ending with two very long α-helices, which cross each other and
form the side walls of the tunnel. Residues located in this domain mainly form hydrogen-
bonds to bases in the minor groove of the DNA. The catalytic subdomain consists of the
common five-stranded β-sheet, which harbors the catalytic residues D212, E240 and K242
and is enlarged by three additional β-strands. Residues located in this domain make con-
tacts to the bases in the major groove. Both subdomains are associated and partially
wrapped around each other, resulting in the largest subunit-subunit interface among the
dimeric enzymes.

1 Introduction 23
Figure 5: Crystal structure of the BsoBI restriction endonuclease. Co-crystal structure of the specific BsoBI-DNA
complex (1DC1). The different subdomains are marked in one subunit: blue = helical subdomain, purple = catalytic
subdomain. The DNA is shown in red.
The tunnel around the DNA has a length of ~ 20 Å and is formed by only α-helices from
both subdomains. It has a close steric complementarity to the BsoBI recognition site, al-
lowing a perfect alignment of enzyme and DNA. Also the electrostatic field inside the
tunnel, which is positive, enhances the binding to the phosphodiester backbone. Since the
gap between the two subunits is too small to allow DNA entry, it was hypothesized, that
BsoBI has to undergo large conformational changes to bind to the DNA [36]. Because
the interface of the catalytic domain is weaker than that of the helical domain, it is likely,
that the catalytic subdomain moves apart, while the helical subdomain stays fixed. The
residues Arg131 and Asn132, which are located in the helical subdomain, are supposed
to be involved in the closing of the catalytic subdomain around the DNA [36]. The for-
mation of a tunnel around the DNA could be a strategy to promote linear diffusion, be-
cause it prevents the protein from falling off the DNA. Otherwise, such a close position
of enzyme and DNA and the numerous H-bonds would not favor a rapid movement along
the DNA. It was therefore postulated that the enzyme forms a more open complex with
non-specific DNA [36]. The DNA itself is located in the tunnel with the major groove
facing the bottom and the minor groove facing the top. It shows only slight deviations
from the canonical B-form. No bending is observed but the DNA is somehow extended
and undertwisted, which makes the major groove wider and the minor groove shallower.
1 Introduction 24
1.1.1.2 Target site location of Type II restriction enzymes
To fulfil their biological function, restriction endonucleases must locate their target site
on the foreign DNA before it becomes methylated by the corresponding methyltransfer-
ase and before it is transcribed or replicated. This is a challenging task, since the enzyme
has to find the specific site within a large excess of non-specific sites. A normal three-
dimensional (3D) diffusion in solution, that involves association and dissociation events
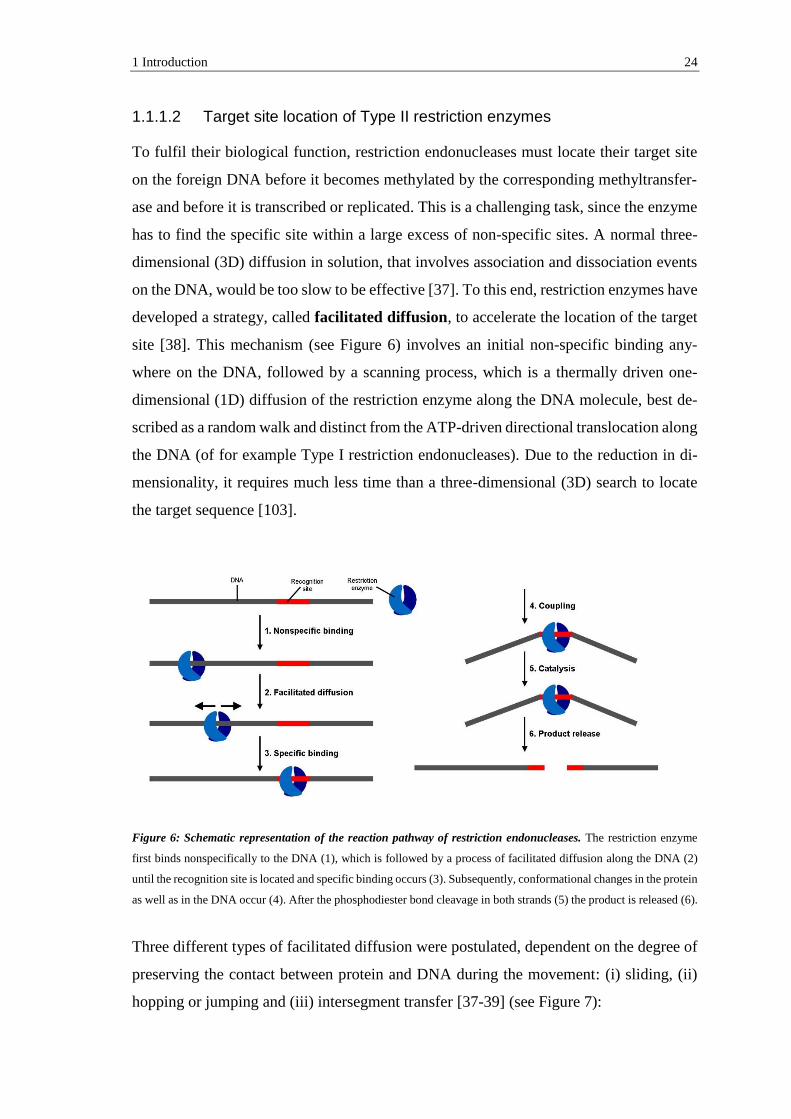
on the DNA, would be too slow to be effective [37]. To this end, restriction enzymes have
developed a strategy, called facilitated diffusion, to accelerate the location of the target
site [38]. This mechanism (see Figure 6) involves an initial non-specific binding any-
where on the DNA, followed by a scanning process, which is a thermally driven one-
dimensional (1D) diffusion of the restriction enzyme along the DNA molecule, best de-
scribed as a random walk and distinct from the ATP-driven directional translocation along
the DNA (of for example Type I restriction endonucleases). Due to the reduction in di-
mensionality, it requires much less time than a three-dimensional (3D) search to locate
the target sequence [103].
Figure 6: Schematic representation of the reaction pathway of restriction endonucleases. The restriction enzyme
first binds nonspecifically to the DNA (1), which is followed by a process of facilitated diffusion along the DNA (2)
until the recognition site is located and specific binding occurs (3). Subsequently, conformational changes in the protein
as well as in the DNA occur (4). After the phosphodiester bond cleavage in both strands (5) the product is released (6).
Three different types of facilitated diffusion were postulated, dependent on the degree of
preserving the contact between protein and DNA during the movement: (i) sliding, (ii)
hopping or jumping and (iii) intersegment transfer [37-39] (see Figure 7):

1 Introduction 25
Sliding, is a one-dimensional (1D) diffusion (it is 2-3 orders of magnitude slower than
three-dimensional (3D) diffusion) and is also called linear diffusion. During sliding, the
enzyme remains bound to the DNA, which implies that the non-specific binding mode
persists during linear diffusion and that the water layer around DNA and protein remains
intact. Sliding has the advantage that it prevents the enzyme from potentially missing a
target site in case of following the helical pitch of the DNA. A disadvantage of sliding is
that small ligands bound to the major or minor groove of the DNA represent obstacles for
linear diffusion [40].
Hopping or jumping is a three-dimensional (3D) diffusion, during which the enzyme
first dissociates from the DNA molecule and subsequently re-associates. The difference
between hopping and jumping is based on the location of the re-association site, which
can be either close to the dissociation site (hopping) or far from it (jumping). In contrast
to sliding, the non-specific binding mode is transiently given up, which means that each
component can associate with water molecules and counter ions. Hopping or jumping is
well-suited to rapidly reach DNA sites which are far away from the initial binding site or
to bypass obstacles bound to the DNA. A disadvantage is that specific sites can be over-
looked, since the enzyme does not stay in continuous contact with the DNA.
Intersegment transfer takes place when an enzyme (often a tetramer), which is bound
to a DNA molecule by one DNA-binding site, binds simultaneously to the same DNA
molecule at a distant location via another DNA-binding site. This double binding will
produce loops in the DNA. Consequently, intersegment transfer is only possible for en-
zymes which possess two DNA-binding sites. Intersegment transfer is well-suited to
cover large distances on the DNA and is unlikely to be inhibited by obstacles.
Figure 7: Schematic illustration of different types of facilitated diffusion. (1) Intersegment transfer, which involves
simultaneous binding of the DNA molecule via two DNA-binding sites, (2) hopping or jumping, which involves dis-
sociation and re-association events and (3) sliding, during which the enzyme remains bound to the DNA. The DNA
molecule is indicated in grey, the two subunits of the homodimeric protein are indicated in light and dark blue.
1 Introduction 26
The concept of facilitated diffusion was originally proposed in 1968 by Adam and
Delbrück in order to describe the interactions between membrane receptors and their lig-
ands [103]. In 1974, Richter and Eigen transferred the concept to specific DNA-binding
proteins, which have to locate their target site on a DNA molecule [104]. The first exper-
imental evidence of facilitated diffusion was presented in the early 1980s for the lac re-
pressor [41] and for the restriction enzyme EcoRI [40,42,43]. It could be shown that fa-
cilitated diffusion speeds up target site location by a factor of > 10 compared to a three-
dimensional (3D) diffusion [40] and that restriction endonucleases scan ≈ 106 bp in one
binding event, which results in an effective scanning distance of ≈ 1000 bp [40]. In the
following years, facilitated diffusion was extensively examined by conventional kinetic
methods [31,38,44-47], which are based on the measurement of the cleavage rate as a
function of the DNA length. The experiments focused mainly on sliding (linear diffusion)
rather than on hopping/jumping or intersegment transfer. It could be shown that several
other type II restriction enzymes make use of facilitated diffusion for target site location
[39]. The most detailed kinetic studies have been carried out with the restriction endonu-
cleases EcoRI and EcoRV. The following observations could be made:
Dependency on the DNA length. Long DNA substrates are cleaved much faster than
short DNA substrates [45], which can be easily explained by the fact that long DNA sub-
strates can be explored not only by three-dimensional diffusion but additionally by one-
dimensional diffusion.
Dependency on the Mg2+- and the salt-concentration. Since linear diffusion takes place
on non-specific DNA it should be dependent on the concentration of mono- and divalent
metal ions. Whereas in the presence of high Mg2+-concentrations (10 mM) linear diffu-
sion was decreased for EcoRI [40], linear diffusion was increased for EcoRV [45]. The
contrary behavior could be explained by the fact that EcoRI needs Mg-ions only for ca-
talysis but EcoRV for catalysis and recognition, thus the specific sites could be better
recognized at high Mg2+-concentrations. Regarding the salt concentration, linear diffu-
sion showed a maximum at 50 mM NaCl for EcoRV [45]. Higher as well as lower con-
centrations of NaCl decreased linear diffusion, which perfectly correlated with the ten-
dency of the non-specific binding affinity. At high salt concentrations non-specific DNA
binding is too weak, at low salt concentrations non-specific DNA binding is too tight,
both prevents linear diffusion.

1 Introduction 27
Overlooking of specific sites. Specific sites are not overlooked by EcoRI [44] and
EcoRV [45], which means that there is a high probability that a specific site is recognized
and cleaved after binding to it. This suggested that restriction enzymes stay in close con-
tact to the DNA and scan continuously the major groove, thereby following the helical
pitch [44] and that sliding is the major process of facilitated diffusion rather than hopping
or jumping. Overlooking was found to be dependent on mono- and divalent metal ions.
With higher concentrations of both, NaCl and Mg2+-ions, the specific site was more effi-
ciently recognized than with lower concentrations [45].
Pausing at star sites. EcoRI pauses at star sites, which means that linear diffusion is
slowed down when the enzyme encounters a site on the DNA which resembles the recog-
nition site [44]. The higher the binding affinity to the star site, the longer the pausing time
and the bigger the inhibitory effect on linear diffusion [44]. This can be explained by the
fact that, in contrast to non-specific sites, with star sites some base-specific contacts can
be formed, as it could be demonstrated for BstYI [48]. These stronger probing interactions
must be loosened again before linear diffusion can continue. The inhibitory effect of one
star site could be amplified by a second star site [44]. The data suggested that restriction
enzymes can adopt two different binding modes: (i) a specific binding mode, which is
tight and dominated by many specific contacts between the enzyme and the bases of the
DNA. The friction coefficient for linear diffusion is high, therefore the enzyme is immo-
bile, (ii) a non-specific binding mode, which is loose and dominated by electrostatic in-
teractions between the enzyme and the phosphodiester backbone of the DNA. The friction
coefficient for linear diffusion is low and allows for sliding [44].
Influence of obstacles on the DNA. Obstacles on the DNA slow down or block linear
diffusion. This could be demonstrated for obstacles in the major groove (e.g. triple helix
forming oligonucleotides [44]) and in the minor groove (e.g. intercalating drugs like dis-
tamycin or netropsin [40]) as well as for non-specific [40] and specific binding proteins
[44]. The question arose whether facilitated diffusion takes place also in vivo, since the
DNA in a cell is usually associated with a variety of different proteins. It was shown that
the efficiency of linear diffusion is strongly correlated with the ability to protect the cell
against phage infection [31]. Thus it was assumed that linear diffusion indeed is of im-
portance also in vivo. Additionally, one has to keep in mind that the biological target of
restriction endonucleases is phage DNA which isn’t supposed to be occupied by many
proteins.

1 Introduction 28
Reflection at the ends of linear DNA. It could be shown that EcoRV is reflected at the
ends of a linear DNA rather than falling off from it [45]. The electrostatic potential at the
ends of a linear DNA is different from that in the middle. Since linear diffusion strongly
depends on the electrostatic interaction between the protein and the DNA [31], it might
be difficult for the protein to approach the end by linear diffusion.
Mechanism of product dissociation. For EcoRI it could be shown that it leaves the
cleavage site by linear diffusion before it dissociates from the cleavage products [42].
EcoRV instead directly dissociates from the cleavage products without using linear dif-
fusion [45]. The different behavior was attributed to the different cleavage modes. EcoRV
produces blunt ends, whereas EcoRI produces sticky ends. Blunt ends produce two addi-
tional negative charges at the 5’-phosphates, thereby pushing the cleavage products di-
rectly out of the DNA-binding tunnel of the enzyme due to electrostatic repulsion. Sticky
ends remain temporary double-stranded, allowing the enzyme to diffuse to non-specific
DNA.
Facilitated diffusion is a general phenomenon that could be observed not only for re-
striction enzymes but also for many other proteins that interact with DNA. Examples are
the RNA polymerase [49,50], DNA-methyltransferases [51,52], the lac repressor [41,53]
and transcription factors [54,55].
1.2 Single-molecule experiments
The target search mechanism of specific DNA-binding proteins was studied intensively
by conventional kinetic methods (see 1.1.1.2). However, these bulk ensemble measure-
ments have some major disadvantages, since they represent only an average of all differ-
ent subpopulations present in the ensemble. Consequently, they cannot provide any dy-
namic information and therefore tend to mask rare but potentially important molecular
trajectories in a given process. Regarding the target search mechanism of type II re-
striction enzymes, bulk ensemble methods could only show whether or not facilitated
diffusion contributed to the searching process, but they could not provide detailed infor-
mation regarding the mechanism itself. It became obvious that new experimental methods
are required to characterize the dynamics of structures in general and specifically to elu-
cidate the mechanism of facilitated diffusion.

1 Introduction 29
A few decades ago, single-molecule methods were introduced in biochemical research
[56-58]. These methods are based on optical (microscopic) techniques, which allow the
direct time-resolved visualization of proteins interacting with DNA molecules. The term
single-molecule experiments covers numerous different techniques, which are often com-
bined. There are for example fluorescence spectroscopic detection methods [59], which
can be further divided into FRET-based methods [60,61] that can probe the dynamic intra-
and intermolecular interactions of proteins and nucleic acids and single-molecule tracking
methods [62] that can measure the molecular position (translocation) and molecular ori-
entation (rotational motion, see also 1.2.1). Another example are mechanical manipula-
tion methods in which a defined force is applied in order to affect the dynamics of a
molecule or to induce conformational changes. Examples are optical tweezers [63,64],
magnetic tweezers [65,66] and laminar flow [67]. Single-molecule experiments necessi-
tate extremely low concentrations of the interacting components (in the pM range) in
order to observe only a single molecule at a given time.
To study the mechanism of facilitated diffusion of various DNA-binding proteins, single-
molecule tracking is the method of choice, because it allows tracking the protein over
many microns along the DNA molecule. To visualize the protein it has to be modified
with a fluorophore (2.2.3.4). To optically resolve the motion of the labeled protein along
the DNA molecule, the DNA has to be converted from the naturally occurring supercoiled
into an elongated conformation. For this purpose a long DNA fragment is needed whose
both ends are modified with biotin. Two different mechanical manipulation methods can
be used for ‘DNA stretching’. The first approach comprises the attachment of the DNA
molecule to a streptavidin-coated microscope slide (or coverslip) with the aid of a laminar
flow (see Figure 8) [67]. After the attachment by both ends, the DNA should retain a
transversal movability so that protein binding is still possible. Also the surface of the
microscope slide should not allow non-specific protein binding. The stretched DNA mol-
ecule is visualized by incubating it with a DNA groove binding dye (e.g. SYBR®gold).

1 Introduction 30
Figure 8: Elongation of DNA molecules. (a) The incubation of a streptavidin-coated microscope slide with biotinyl-
ated DNA molecules leads to the attachment of the DNA molecule by one end. (b) The application of a fast buffer flow
elongates the DNA molecule and (c) leads to the attachment of the second end of the DNA molecule.
An alternative approach for ‘DNA stretching’ is the use of optical tweezers [64]. In this
case both biotinylated ends of the DNA molecule are attached to streptavidin-coated pol-
ystyrol beads, which are held in position in solution by optical tweezers. This system has
some advantages over the previous mentioned method. The stretching of the DNA mole-
cule can be easily adjusted, the distance between surface and DNA is much larger (> 3µm
compared to < 100 nm) and the position of the DNA can be located without the use of
DNA groove binding dyes.
The interaction of the labeled protein with the stretched DNA molecule is visualized by
total internal reflection fluorescence microscopy (TIRFM, see Figure 9). In this tech-
nique, the excitation light is reflected off the interface between the microscope slide and
the aqueous sample. Due to this special illumination geometry only a small part of the
excitation light is able to enter the sample. Consequently, only proteins which are close
to the surface are illuminated. This spatially limited excitation allows the detection of
single fluorophores. The interaction of the protein with the DNA molecule can be seen as
a short fluorescent signal within the coordinates of the stretched DNA.
Figure 9: Total internal reflection fluorescence microscopy (TIRFM). A laser beam used for excitation of the labeled
proteins is reflected off the interface between the microscope slide and the aqueous sample. The reflection generates
an evanescent field, which decays exponentially into the aqueous sample. Only labeled proteins with a distance of a
few hundred nanometer to the surface are illuminated.

1 Introduction 31
The fluorescent signal is imaged using a charge-coupled device (CCD) camera and mov-
ies of the interaction can be recorded. One movie usually contains several interaction
events between the protein and the DNA molecule. To further analyze the interaction, all
images that belong to one interaction event are identified (Figure 10A). For each image,
the longitudinal and transversal position of the protein on the DNA molecule has to be
determined (Figure 10B). This can be done with the aid of a computer program, which
fits the point spread function of the fluorophore emission with a two dimensional Gauss-
ian function. The localization accuracy of the fluorescent spot is limited by the number
of photons accumulated during the exposure time of the CCD camera. Taking all images
of one interaction event together, the protein trajectory on the DNA molecule can be re-
constructed. Typical protein trajectories display both the longitudinal and transversal po-
sition of the protein as a function of time (Figure 10C). From the protein trajectories the
mean squared displacement (MSD) can be derived (Figure 10D).
Figure 10: Analysis of the protein-DNA interaction. (A) Example of three consecutive fluorescent images. The posi-
tion of the DNA is indicated by the red dashed line, the ends of the DNA are indicated by yellow dashed circles. The
white spot corresponds to the fluorescent signal of the labeled protein. (B) For each fluorescent image, the transversal
(y) and the longitudinal (x) position of the protein (blue spot) on the DNA (grey line) has to be determined. (C) Example
of a typical trajectory of a diffusing protein. The transversal (black) and the longitudinal (red) position is plotted against
the time. (D) Example of a typical MSD of a diffusing protein. The transversal (black) and the longitudinal (red) MSD
is plotted against the time. Note: Figures 10C and 10D are adopted from [67].

1 Introduction 32
The transversal MSD function is approximately constant, since the transversal motion of
the protein is restricted. Fluctuations of the signal are only attributed to the thermal fluc-
tuations of the DNA molecule. For diffusive motion, the longitudinal MSD function is
expected to yield a linear graph, displaying sliding movement of the protein. The slope
of the graph can be used to calculate the one-dimensional diffusion coefficient (D1) which
resembles the velocity of the protein on the DNA molecule.
𝐷1 = 𝑀𝑆𝐷𝑥(𝑡)
2 ∙ 𝑡
By using single-molecule tracking techniques, facilitated diffusion has been visualized
for various DNA-binding proteins, like T7 RNA polymerase [68], the lac repressor [69],
Rad51 [70], the human oxoguanine DNA-glycosylase I [71], Msh2-Msh6 [72], tumor
suppressor p53 [73] and the type II restriction endonuclease EcoRV [64,67]. In case of
EcoRV it has been shown that the restriction enzyme slides along the DNA with a one-
dimensional diffusion coefficient of D1 = 0.01 µm2s-1 and that the sliding motion was
interrupted by occasional jumps (translocations > 200 nm) of the enzyme [67]. This led
to the conclusion that an optimal searching process consists of a balanced combination of
both, sliding and jumping [67]. It has further been shown that sliding was not influenced
by a buffer flow whereas the number of large jumps was reduced [67]. Increasing salt
concentrations (up to 60 mM NaCl) strongly reduced the interaction time of the protein
with the DNA molecule whereas the mean one-dimensional diffusion coefficient (D1)
increased with increasing salt concentration [67]. In another study it was possible to di-
rectly visualize the cleavage of a specific recognition site on the DNA by EcoRV [64].
The experimental setup, based on optical tweezers, also allowed the adjustment of the
DNA length. It was shown that under-stretching of the DNA (< 100 % compared to the
contour length of the DNA) did not influence D1, whereas only 5 % overstretching of the
DNA led to a decrease in D1 by 30 %. This observation was attributed to a changed energy
landscape of the DNA molecule. The one-dimensional diffusion coefficient of EcoRV
was found to be D1 = 0.003 µm2s-1, which was one order of magnitude smaller than esti-
mated by Bonnet et al. [67]. The difference was ascribed to the larger hydrodynamic ra-
dius due to labeling with quantum dots instead of organic fluorophores [64].

1 Introduction 33
1.2.1 Studying rotational motion by single-molecule experiments
Because of the helical nature of DNA, specific DNA-binding proteins are supposed to
rotate around the DNA double helix during linear diffusion. This makes sense, since many
proteins make non-specific contacts with the DNA backbone through electrostatic inter-
actions [29]. In order to maintain correct register with the DNA and to sense directly the
base pair sequence, translational diffusion would require a 360° rotation per helical turn.
A first theoretical analysis of such a ‘rotation-coupled diffusion’ was made already in the
1970s by Schurr [74]. The one-dimensional diffusion coefficient (D1) of a sliding protein
is strongly dependent on the friction between the protein and the DNA molecule and is
related to the friction coefficient (ξ) by Einstein’s equation:
𝐷1 =𝑘𝐵𝑇
𝜉
where kB is the Boltzmann constant and T the temperature. Dependent on the type of
motion, friction can be translational (ξtrans) or rotational (ξrot) and depends on the viscosity
η of the medium and the hydrodynamic radius r of the protein (Stoke’s equation):
𝜉𝑡𝑟𝑎𝑛𝑠 = 6𝜋𝜂𝑟 𝜉𝑟𝑜𝑡 = 8𝜋𝜂𝑟3 (2𝜋
10𝑏𝑝)
2
From these two equations it can be deduced that in a pure translational diffusion of the
protein along the DNA molecule (ξtrans), D1 decreases proportionally with increasing ra-
dius r of the protein. On the other hand, in a pure rotational diffusion of the protein around
the DNA molecule, ξ is much more affected by the radius of the protein and D1 decreases
to the power of three with increasing radius r of the protein. In a rotation-coupled trans-
lational diffusion, the total friction can be easily described by the sum of the translational
and the rotational friction (ξtotal = ξtrans + ξrot) [74]. Since the rotational contribution to the
total friction is 2 orders of magnitude larger than the translational contribution, rotation-
coupled translational diffusion is expected to be substantially slower than a pure transla-
tional diffusion. For this reason, the order of magnitude of the measured one-dimensional
diffusion coefficient in single-molecule experiments can provide information on whether
or not rotation is involved in the sliding mechanism [74].

1 Introduction 34
The Schurr rotational model has later been generalized by considering that the distance
between the protein center of mass and the DNA axis can be larger than zero [75]. This
so-called off-axis rotation generates slightly smaller diffusion coefficients than the on-
axis rotation of the Schurr model.
The dependency of the one-dimensional diffusion coefficient on the protein radius (trans-
lational diffusion depends on r-1, rotational diffusion depends on r-3) can serve as a tool
for identifying the basic mechanism of protein motion along a DNA molecule. Several
studies have been performed which either investigated the impact of the protein size (dif-
ferent proteins, same label) [76] or the impact of the label size (same protein, different
label) [77] on D1. The experimental results were compared to theoretical predictions for
pure translational and rotation-coupled translational diffusion. In both studies it could be
shown that D1 decreased with increasing size of the protein or label in a way which is
consistent with a rotation-coupled translational diffusion [76,77]. In addition to the veri-
fication of rotational motion by determining the one-dimensional diffusion coefficient
and comparing it to theoretical models, two methodologically different approaches have
been developed to determine the average orientation and thereby rotational motion of
individual biomolecules. The first approach uses fluorescence polarization, the second
approach is based on torque measurements.
Fluorescence polarization. Exciting a fluorophore with linear polarized light will result
in the emission of linear polarized light. The intensity of the emitted polarized light is
strongly dependent on the orientation of the fluorophore. If the fluorophore is coupled to
a macromolecule, changes in the orientation of the macromolecule (e.g. rotation) would
lead to changes in the orientation of the fluorophore and can be monitored via a change
of the fluorescence intensity over time. Fluorescence polarization was first applied to
study the axial rotation of myosin around the actin helix [78]. In this study the actin fila-
ment was sparsely labeled with a fluorophore and excited with linear polarized light. My-
osin was bound to the glass surface of a microscope slide. When the actin filament started
to slide on myosin, the orientation of labeled actin molecules was monitored via a change
in fluorescence intensity, which has been separated into vertically and horizontally polar-
ized components. The intensities of the vertically and horizontally polarized light alter-
nated periodically showing rotational movement of actin along myosin [78]. Combination
with single molecule tracking revealed that the actin filament completed a full rotation
after ~ 1 µm translocation.

1 Introduction 35
Since actin has a helical pitch of ~ 72 nm, it was concluded that myosin did not follow
the helical pitch but rather skipped many protomers [78]. In contrast, for the formin
mDia1, a protein which regulates the polymerization of actin filaments, it has been shown
that it completed a full rotation after ~ 72 nm, which is consistent with a rotational move-
ment that follows the helical pitch of actin filaments [79].
Torque measurements. By attaching to a biomolecule a labeled tag that is huge com-
pared to the size of the biomolecule, rotations of the biomolecule would lead to rotations
of the huge labeled tag which can be imaged in real time under an optical microscope.
With this technique rotational motion could be directly demonstrated for RNAP [80,81]
and F1-ATPase [82,83]. In the former studies, RNAP was attached to the surface of a
microscope slide and the DNA molecule was attached to a huge streptavidin-coated bead
(diameter ~ 900 nm), which was asymmetrically labeled with a fluorophore. The DNA
molecule was dragged towards the protein with the aid of optical [80] or magnetic [81]
tweezers. The interaction of RNAP with the DNA molecule lead to a rotation of the DNA
molecule and thereby to a rotation of the huge labeled bead. In the latter studies the con-
tinuous rotation of the central gamma subunit of the rotary motor protein F1-ATPase was
revealed under an optical microscope by attaching to the protein either an actin filament
[82] or a bead-duplex [83] as a huge labeled tag. Rotation of the protein led to rotation of
the huge tag and could be visualized directly.
1.3 Aim
The location of the specific recognition sequence by restriction endonucleases is a com-
plex process. Is has been studied intensively by bulk ensemble measurements (1.1.1.2) as
well as by single-molecule experiments (1.2). Nevertheless, there are still some open
questions which so far have not been investigated. Two of these questions, which are
related to the sliding mechanism of restriction enzymes, will be addressed in this work.
Is linear diffusion coupled to rotation?
Type II restriction enzymes slide along the DNA in the process of searching for their
recognition site [64,67]. Because of the helical nature of DNA, the question arises
whether sliding proteins follow the pitch of the DNA double helix or not. Several studies
exist which support the hypothesis of such a rotation-coupled sliding indirectly [74-77].
1 Introduction 36
However, rotational motion coupled to lateral sliding has not been directly visualized for
a diffusing restriction enzyme so far, because of the restricted spatial and temporal reso-
lution of single-molecule detection systems. To partially circumvent these limitations, an
elongated restriction enzyme will be produced by extending the homodimeric restriction
enzyme EcoRV with the quasi-linear protein scRM6. Initially, the prepared protein-pro-
tein fusions will be characterized extensively by biochemical and biophysical techniques.
Finally, the protein-protein fusions will be fluorescently labeled at their distal ends in
order to study the interaction with DNA using single-molecule techniques. On the one
hand, rotational movement will be shown indirectly by measuring the one-dimensional
diffusion coefficient of the fusion protein and comparing it to theoretical models. On the
other hand, rotational movement will be shown directly by following the movement of
the widely separated fluorescent labels by TIRFM with superior spatial resolution.
Does the structure of an enzyme influence the degree of linear diffusion?
The structure of the DNA-binding cleft and the degree of surrounding the DNA varies
among different restriction enzymes. By comparing the crystal structures of PvuII,
EcoRV and BsoBI (see 1.1.1.1), it can be seen that the DNA-binding cleft is open, half-
closed and fully-closed, respectively. The question arises whether enzymes with a differ-
ent structure of the DNA-binding cleft make use of linear diffusion to different extents,
for example more for enzymes with a closed DNA-binding cleft. In this context, the struc-
ture of the non-specific complex is of particular interest since it reflects the structure of
an enzyme that slides along the DNA [29]. Because structural information on the non-
specific complex is only available for EcoRV [30] a direct comparison of the three en-
zymes on the basis of their co-crystal structures has not been possible so far. To still
obtain an estimation which conformation the enzyme adopts in the non-specific complex,
a FRET analysis will be performed at first. This allows measuring the relative distance of
the two subunits and thereby to estimate the degree of DNA-binding cleft opening. Sub-
sequently, the three enzymes are subjected to a comparison of their sliding ability. This
can easily be tested with conventional kinetic methods by measuring the dependence of
the cleavage rate on the length of the DNA substrate [40,44,45]. It is to be found, whether
the above mentioned hypothesis, namely the more closed the complex the more sliding is
used, can be confirmed and thereby whether one can derive from the structure of an en-
zyme the degree of linear diffusion.

2 Material and methods 37
2 Material and methods
2.1 Material
2.1.1 Chemicals
All chemicals listed in Table 1 were of high purity grade.
Table 1: Chemicals
Name Company
2-Mercaptoethanol Merck
Acetic acid Merck
Acrylamide:bisacrylamide solution 19:1 (40 %) AppliChem
Acrylamide:bisacrylamide solution 29:1 (40 %) AppliChem
Agar AppliChem
Agarose Ultra Pure TM Invitrogen
Aluminiumsulfate AppliChem
Ammoniumsulfate AppliChem
Ampicillin AppliChem
Boric acid Merck
Bromphenol blue Merck
BSA NEB
Calcium chloride Merck
Chloramphenicol AppliChem
Coomassie® Brilliant blue G250 AppliChem
Disodium hydrogen phosphate Merck
dNTPs Fermentas
DTT AppliChem
EDTA AppliChem
Ethanol Merck
Ethidium bromide Roth
Formamide Merck
Glycerol AppliChem
Glycine Merck
HCl Merck
HEPES AppliChem

2 Material and methods 38
Imidazole Merck
IPTG AppliChem
Kanamycin Sulfate AppliChem
KOH Roth
Lubrol Sigma
Magnesium Acetate Merck
Magnesium Chloride Merck
Magnesium Sulfate Merck
NaOH Roth
Ni2+-NTA-agarose Qiagen
o- Phosphoric acid 87 % Roth
Potassium Chloride Merck
Potassium dihydrogen Phosphate Merck
Potassium Glutamate Merck
SDS AppliChem
Sodium Acetate AppliChem
Sodium Chloride Merck
TCEP Pierce
TEMED Merck
Trichloracetic acid Roth
Tris Merck
Triton X-100 Merck
Tryptone AppliChem
Tween20 Merck
Urea AppliChem
Xylene cyanol Merck
Yeast extract AppliChem
2.1.2 Buffers
All buffers were prepared with water from the Milli-Q Synthesis (Millipore) water puri-
fication system. Buffers listed in Table 2 – 4 were used for protein purification (2.2.2.10).
The buffer listed in Table 5 was used for all kinds of assays. The buffer was supplemented
with either 10 mM MgCl2, 5 mM CaCl2 or 1 mM EDTA, when indicated. Also the NaCl
concentration was altered to 20, 100 and 200 mM for the competitive cleavage assay
(2.2.3.3). The buffer listed in Table 6 was used for single-molecule experiments (2.2.3.7).
Buffers listed in Table 7 were used for modification reactions (2.2.2.14 and 2.2.3.4).

2 Material and methods 39
The high salt PBS buffer was used for the fusion protein variants only. The composition
of all other buffers is directly indicated in the chapter of the corresponding method.
Table 2: Purification buffers (EcoRV variants, PvuII variants, scPvuII)
Name Components
Lysis, Equilibration
buffer
30 mM KH2PO4-KOH pH 7.2, 800 mM NaCl, 0.5 mM EDTA, 1 mM DTT,
0.01 % (v/v) Lubrol, 10 mM Imidazole
Wash buffer 30 mM KH2PO4-KOH pH 7.2, 500 mM NaCl, 0.5 mM EDTA, 1 mM DTT,
0.01 % (v/v) Lubrol, 15 mM Imidazole
Elution buffer 30 mM KH2PO4-KOH pH 7.2, 0.5 mM EDTA, 1 mM DTT, 0.01 % (v/v)
Lubrol, 250 mM Imidazole
Dialysis buffer 30 mM KH2PO4-KOH pH 7.4, 100 mM NaCl, 0.5 mM EDTA, 1 mM DTT,
0.01 % (v/v) Lubrol, 60 % (v/v) glycerol
Low-salt buffer 20 mM KH2PO4-KOH pH 7.4, 0.5 mM EDTA
High-salt buffer 20 mM KH2PO4-KOH pH 7.4, 0.5 mM EDTA, 1 M KCl
Table 3: Purification buffers (scRM6 D54C-L(x)-EcoRV C21S, scRM6 D54C)
Name Components
Lysis, Equilibration,
Wash buffer
20 mM Hepes pH 8.0, 0.1 mM DTT, 10% (v/v) glycerol, 500 mM NaCl, 10
mM Imidazole
Elution buffer 20 mM Hepes pH 8.0, 5 mM DTT, 10% (v/v) glycerol, 500 mM NaCl, 250
mM Imidazole, 0.5 mM EDTA
Dialysis buffer 20 mM Hepes pH 8.0, 5 mM DTT, 60% (v/v) glycerol, 400 mM NaCl, 0.5
mM EDTA
Low-salt buffer 20 mM Hepes pH 8.0, 5 mM DTT, 250 mM NaCl, 0.5 mM EDTA
High-salt buffer 20 mM Hepes pH 8.0, 5 mM DTT, 1 M NaCl, 0.5 mM EDTA

2 Material and methods 40
Table 4: Purification buffers (BsoBI)
Name Components
Lysis, Equilibration buffer 10 mM Tris-HCl pH 8.0, 500 mM NaCl, 15 mM Imidazole, 0.5 mM
EDTA
Wash buffer 10 mM Tris-HCl pH 8.0, 200 mM NaCl, 15 mM Imidazole, 0.5 mM
EDTA
Elution buffer 10 mM Tris-HCl pH 8.0, 200 mM NaCl, 200 mM Imidazole, 0.5 mM
EDTA
Dialysis buffer 30 mM KH2PO4-KOH pH 7.2, 300 mM NaCl, 0.1 mM 2-mercap-
toethanol, 0.01 % (v/v) Lubrol, 0.5 mM EDTA, 50 % Glycerol
Table 5: Reaction buffer
Name Components
Reaction buffer 20 mM Tris-HCl pH 7.5, 50 mM NaCl, 5 mM DTT, 0.1 mg/mL BSA
Table 6: Single-molecule buffer
Name Components
KGB 25 mM Tris-Acetate pH 7.4, 100 mM K-glutamate, 20 mM NaCl, 10 mM Mg-
Acetate, 1 mM DTT, 0.1 mg/mL BSA
Table 7: Modification buffers
Name Components
PBS 10 mM Na2HPO4*2 H2O, 1.7 mM KH2PO4, 137 mM NaCl, 2.7 mM KCl
PBS high salt 10 mM Na2HPO4*2 H2O, 1.7 mM KH2PO4, 1 M NaCl, 2.7 mM KCl
2.1.3 Bacterial strains
Different E. coli strains are listed in Table 8. The strains LK111λ and BL21DE3 contained
an additional plasmid coding for the EcoRV methyltransferase (pLBM), which protects
the genome from cleavage. The strain XL10 Gold contained the plasmid PLGM, which
encodes for the PvuII methyltransferase and the strain XL1-Blue contained the plasmid
pACYC, which encodes for the BsoBI methyltransferase. The indicated resistance refers
to the plasmids coding for the corresponding methyltransferase.
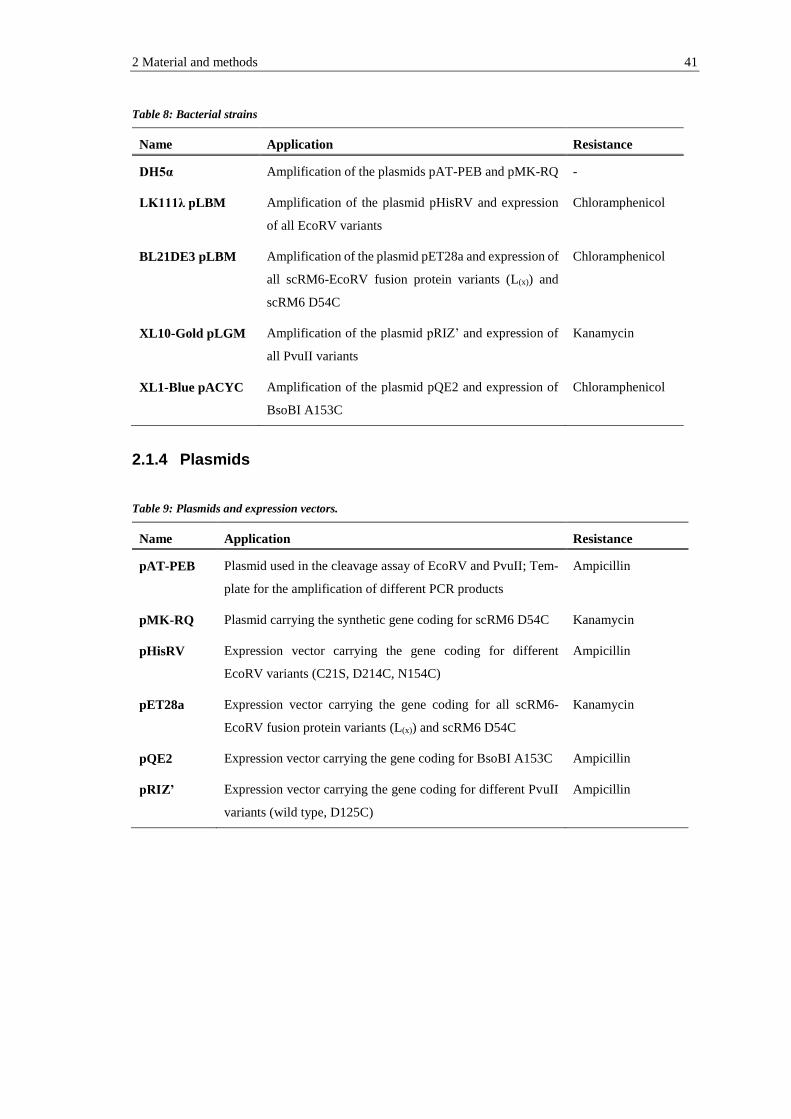
2 Material and methods 41
Table 8: Bacterial strains
Name Application Resistance
DH5α Amplification of the plasmids pAT-PEB and pMK-RQ -
LK111λ pLBM Amplification of the plasmid pHisRV and expression
of all EcoRV variants
Chloramphenicol
BL21DE3 pLBM Amplification of the plasmid pET28a and expression of
all scRM6-EcoRV fusion protein variants (L(x)) and
scRM6 D54C
Chloramphenicol
XL10-Gold pLGM Amplification of the plasmid pRIZ’ and expression of
all PvuII variants
Kanamycin
XL1-Blue pACYC Amplification of the plasmid pQE2 and expression of
BsoBI A153C
Chloramphenicol
2.1.4 Plasmids
Table 9: Plasmids and expression vectors.
Name Application Resistance
pAT-PEB Plasmid used in the cleavage assay of EcoRV and PvuII; Tem-
plate for the amplification of different PCR products
Ampicillin
pMK-RQ Plasmid carrying the synthetic gene coding for scRM6 D54C Kanamycin
pHisRV Expression vector carrying the gene coding for different
EcoRV variants (C21S, D214C, N154C)
Ampicillin
pET28a Expression vector carrying the gene coding for all scRM6-
EcoRV fusion protein variants (L(x)) and scRM6 D54C
Kanamycin
pQE2 Expression vector carrying the gene coding for BsoBI A153C Ampicillin
pRIZ’ Expression vector carrying the gene coding for different PvuII
variants (wild type, D125C)
Ampicillin

2 Material and methods 42
2.1.5 Oligonucleotides
Oligonucleotides listed in Table 10 were obtained from Biomers (Ulm, Germany) and
used for site directed mutagenesis (2.2.2.6).
Table 10: Oligonucleotides used for site-directed mutagenesis
Name Sequence (5’3’) Mutation REase site
Oligo_515 CTAGAATTCTACTATTGCAAATGGGAAAGG PvuII D125C + EcoRI
Oligo_464 GAGGATGAATTCTTATGCTATTGGAG EcoRV D214C + EcoRI
Oligo_386 GCTTTATCGTCCGCTCTCGCGAGGTTCCTTC
GAAGTGATTTAATTAATG
L(0) - HindIII
Oligo_387 CCGCTCTCGCGAGGTTCAATGCTCTTCGAA
GTGATTTAATTAATGC
L(NA) + EarI
Oligo_412 CGTTCCGCTCTCGCGCGTTTCG-
GACTTCGAAGTGATTTAATTAATGC
L(G) - HindIII
Oligo_413 CGTTCCGCTCTCGCGCGTTTCAAC-
CTTCGAAGTGATTTAATTAATGC
L(N) - HindIII
Oligo_414 CGTCCGCTCTCGCGCGTCCG-
CATCCCTTCGAAGGATTAATTAATGC
L(NAS) - HindIII
Oligonucleotides listed in Table 11 were obtained from Biomers (Ulm, Germany) and
used for cloning approaches (2.2.2.7).
Table 11: Oligonucleotides used for cloning approaches
Name Sequence (5’3’) Application Restriction site
Oligo_110 CCATCACGGGAGCTTCGAAGTGAT-
TTAATTAATG
EcoRV C21S insert + HindIII
Oligo_111 GGGATTAAACACTCGAGC-
TATTGCTTATTTTC
EcoRV C21S insert + XhoI
Oligonucleotides listed in Table 12 were obtained from Biomers (Ulm, Germany) and
used for screening (2.2.2.8).
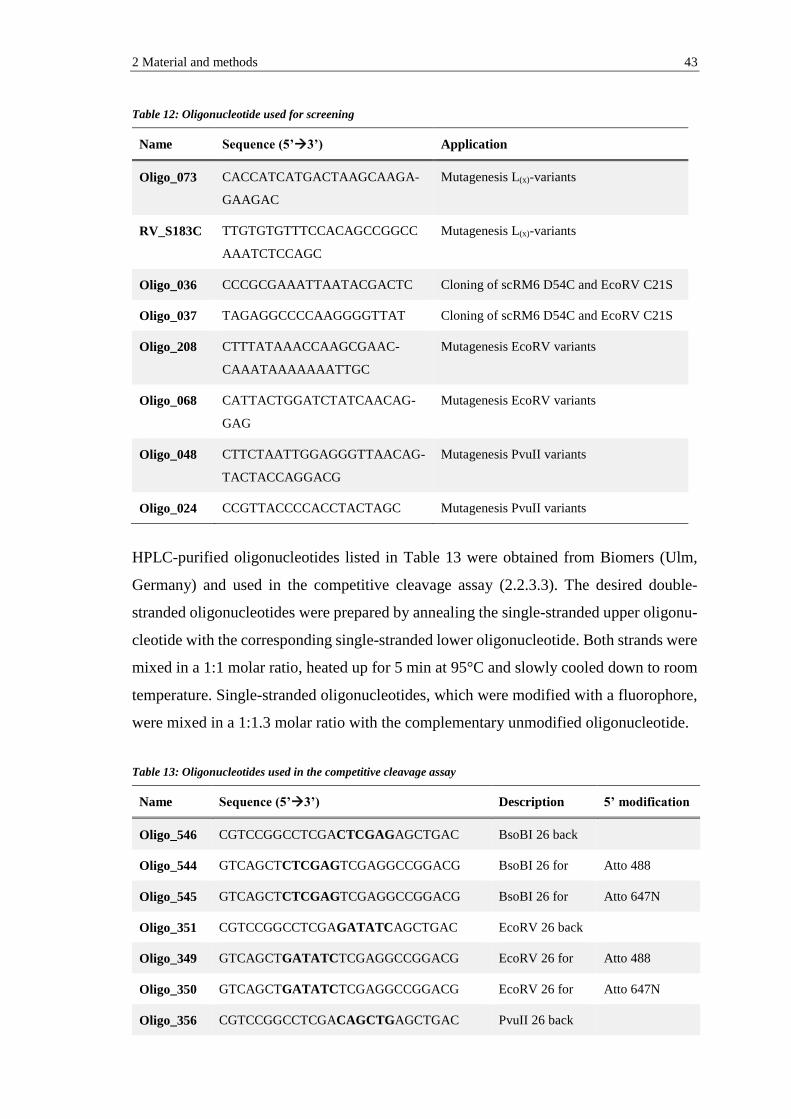
2 Material and methods 43
Table 12: Oligonucleotide used for screening
Name Sequence (5’3’) Application
Oligo_073 CACCATCATGACTAAGCAAGA-
GAAGAC
Mutagenesis L(x)-variants
RV_S183C TTGTGTGTTTCCACAGCCGGCC
AAATCTCCAGC
Mutagenesis L(x)-variants
Oligo_036 CCCGCGAAATTAATACGACTC Cloning of scRM6 D54C and EcoRV C21S
Oligo_037 TAGAGGCCCCAAGGGGTTAT Cloning of scRM6 D54C and EcoRV C21S
Oligo_208 CTTTATAAACCAAGCGAAC-
CAAATAAAAAAATTGC
Mutagenesis EcoRV variants
Oligo_068 CATTACTGGATCTATCAACAG-
GAG
Mutagenesis EcoRV variants
Oligo_048 CTTCTAATTGGAGGGTTAACAG-
TACTACCAGGACG
Mutagenesis PvuII variants
Oligo_024 CCGTTACCCCACCTACTAGC Mutagenesis PvuII variants
HPLC-purified oligonucleotides listed in Table 13 were obtained from Biomers (Ulm,
Germany) and used in the competitive cleavage assay (2.2.3.3). The desired double-
stranded oligonucleotides were prepared by annealing the single-stranded upper oligonu-
cleotide with the corresponding single-stranded lower oligonucleotide. Both strands were
mixed in a 1:1 molar ratio, heated up for 5 min at 95°C and slowly cooled down to room
temperature. Single-stranded oligonucleotides, which were modified with a fluorophore,
were mixed in a 1:1.3 molar ratio with the complementary unmodified oligonucleotide.
Table 13: Oligonucleotides used in the competitive cleavage assay
Name Sequence (5’3’) Description 5’ modification
Oligo_546 CGTCCGGCCTCGACTCGAGAGCTGAC BsoBI 26 back
Oligo_544 GTCAGCTCTCGAGTCGAGGCCGGACG BsoBI 26 for Atto 488
Oligo_545 GTCAGCTCTCGAGTCGAGGCCGGACG BsoBI 26 for Atto 647N
Oligo_351 CGTCCGGCCTCGAGATATCAGCTGAC EcoRV 26 back
Oligo_349 GTCAGCTGATATCTCGAGGCCGGACG EcoRV 26 for Atto 488
Oligo_350 GTCAGCTGATATCTCGAGGCCGGACG EcoRV 26 for Atto 647N
Oligo_356 CGTCCGGCCTCGACAGCTGAGCTGAC PvuII 26 back

2 Material and methods 44
Oligo_355 GTCAGCTCAGCTGTCGAGGCCGGACG PvuII 26 for Atto 488
Oligo_543 GTCAGCTCAGCTGTCGAGGCCGGACG PvuII 26 for Atto 647N
Oligo_352 CACCATACCCACGCCGAAACAAGCGC 153 back
Oligo_353 GGCGTGCAAGATTCCGAATACCGCAA 498 back
Oligo_354 CCAATTCTTGGAGTGGTGAATCCGTT 958 back
Oligo_562 GTCAGGGGGGCGGAGCCTATGGAAAAAC 1488 back
HPLC-purified oligonucleotides listed in Table 14 were obtained from Biomers (Ulm,
Germany) and used for fluorescence anisotropy measurements (2.2.3.1). The correspond-
ing unmodified oligonucleotides were used for FRET measurements (2.2.3.6).
Table 14: Oligonucleotides used for fluorescence anisotropy and FRET measurements
Name Sequence (5’3’) Description 5’ modification
Oligo_030 CAGACGATATCCGTAC EcoRV cognate upper HEX
Oligo_251 CAGACGATATCCGTAC EcoRV cognate upper
Oligo_548 CAGACCTATAGCGTAC EcoRV nonspecific upper HEX
Oligo_549 CAGACCTATAGCGTAC EcoRV nonspecific upper
Oligo_031 GTACGGATATCGTCTG EcoRV cognate lower
Oligo_550 GTACGCTATAGGTCTG EcoRV nonspecific lower
Oligo_163 GTCCGCAGCTGACCTA PvuII cognate upper HEX
Oligo_551 GTCCGCAGCTGACCTA PvuII cognate upper
Oligo_552 GTCCGGTCGACACCTA PvuII nonspecific upper HEX
Oligo_553 GTCCGGTCGACACCTA PvuII nonspecific upper
Oligo_164 TAGGTCAGCTGCGGAC PvuII cognate lower
Oligo_554 TAGGTGTCGACCGGAC PvuII nonspecific lower
Oligo_581 CGTTGCTCGAGACATC BsoBI cognate upper HEX
Oligo_582 CGTTGCTCGAGACATC BsoBI cognate upper
Oligo_583 CGTTGGAGCTCACATC BsoBI nonspecific upper HEX
Oligo_584 CGTTGGAGCTCACATC BsoBI nonspecific upper
Oligo_585 GATGTCTCGAGCAACG BsoBI cognate lower
Oligo_586 GATGTGAGCTCCAACG BsoBI nonspecific lower
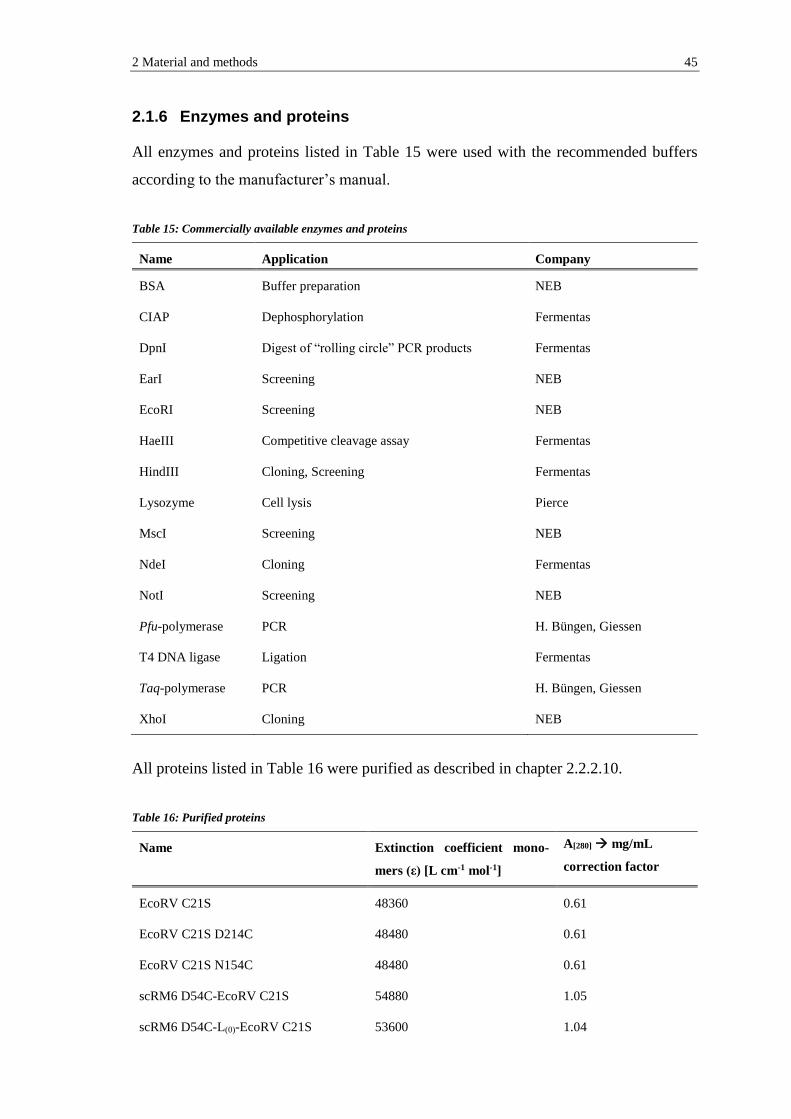
2 Material and methods 45
2.1.6 Enzymes and proteins
All enzymes and proteins listed in Table 15 were used with the recommended buffers
according to the manufacturer’s manual.
Table 15: Commercially available enzymes and proteins
Name Application Company
BSA Buffer preparation NEB
CIAP Dephosphorylation Fermentas
DpnI Digest of “rolling circle” PCR products Fermentas
EarI Screening NEB
EcoRI Screening NEB
HaeIII Competitive cleavage assay Fermentas
HindIII Cloning, Screening Fermentas
Lysozyme Cell lysis Pierce
MscI Screening NEB
NdeI Cloning Fermentas
NotI Screening NEB
Pfu-polymerase PCR H. Büngen, Giessen
T4 DNA ligase Ligation Fermentas
Taq-polymerase PCR H. Büngen, Giessen
XhoI Cloning NEB
All proteins listed in Table 16 were purified as described in chapter 2.2.2.10.
Table 16: Purified proteins
Name Extinction coefficient mono-
mers (ε) [L cm-1 mol-1]
A[280] mg/mL
correction factor
EcoRV C21S 48360 0.61
EcoRV C21S D214C 48480 0.61
EcoRV C21S N154C 48480 0.61
scRM6 D54C-EcoRV C21S 54880 1.05
scRM6 D54C-L(0)-EcoRV C21S 53600 1.04

2 Material and methods 46
scRM6 D54C-L(NA)-EcoRV C21S 53600 1.04
scRM6 D54C-L(G)-EcoRV C21S 53600 1.04
scRM6 D54C-L(N)-EcoRV C21S 53600 1.04
scRM6 D54C-L(NAS)-EcoRV C21S 53600 1.05
scRM6 D54C 6520 4.35
PvuII 35560 0.54
PvuII D125C 35680 0.54
scPvuII 71240 0.53
BsoBI A153C 49620 0.77
2.1.7 Markers
Markers listed in Table 17 were used for protein and DNA electrophoresis (2.2.2.1)
Table 17: Markers
Name Application Company
PageRulerTM Unstained Protein Ladder SDS-PAGE Fermentas
GeneRulerTM 1 kb Ladder Agarose gel electrophoresis Fermentas
pUC8 mix Marker PAGE Fermentas
2.1.8 Fluorophores
Fluorescent dyes were used for different purposes. Atto488- and Atto647N-5’-modified
oligonucleotides (Table 13) were used in the competitive cleavage assay (2.2.3.3). HEX
5’-modified oligonucleotides (Table 14) were used to determine the protein binding ac-
tivity by fluorescence anisotropy (2.2.3.1). Atto488- and Atto647N-maleimide (pur-
chased from AttoTEC) were used to label the single-cysteine variant EcoRV N154C and
all scRM6-EcoRV fusion protein variants (2.2.3.4). Cy3- and Cy5-maleimide (purchased
from GE healthcare) were used to label the single-cysteine variants EcoRV D214C, PvuII
D125C and BsoBI A153C (2.2.3.4). Cy3B-maleimide (purchased from GE healthcare)
was used to label the single-cysteine fusion protein variant scRM6 D54C-EcoRV C21S
for single-molecule experiments (2.2.3.4). The chemical structures of all fluorophores are
shown in Figure 11.

2 Material and methods 47
Figure 11: Chemical structures of used fluorophores. Cyanine dyes (a) Cy3-maleimide, (b) Cy5-maleimide and (c)
Cy3B-maleimide. Carborhodamine dyes (d) Atto647N and (e) Atto488. Fluorescein dye (f) HEX. (Structure of
Atto647N from Eggeling et al. 2008)
Spectral properties of the fluorophores are summarized in Table 18.
Table 18: Physical characteristics of used fluorophores. Absorption maximum (λabs), emission maximum (λem), ex-
tinction coefficient (ε) and correction factor for the absorbance at 260 nm (CF260) or 280 nm (CF280).
Name λabs (nm) λem (nm) ε (L cm-1 mol-1) CF260 CF280
Atto488 501 523 90,000 0.25 0.10
Atto647N 644 669 150,000 0.06 0.05
Cy3 550 570 150,000 0.08 0.08
Cy3B 559 570 130,000 0.08 0.08
Cy5 649 670 250,000 0.05 0.05
HEX 535 556 73,000 0.43 -

2 Material and methods 48
2.2 Methods
2.2.1 Microbiological methods
For bacterial cell growth, LB-medium (10 g/L tryptone, 5 g/L yeast extract, 5 g/L NaCl,
pH 7.5) or LB-agar plates (LB-medium supplemented with 1.5 % (w/v) agar) were used.
Corresponding antibiotics were added after sterilization, immediately before use.
2.2.1.1 Preparation of electro-competent cells
For the preparation of electro-competent E. coli cells (2.1.3), a 500 mL LB-medium cul-
ture was inoculated with 10 mL of a pre-culture of the desired cells and grown at 37°C
until the OD600 reached a value of 0.6 – 0.8. The culture was first stored on ice for 15 min
and then centrifuged for further 15 min at 4200 rpm and 4°C (Beckman, J6-HC). The
supernatant was discarded, the cell pellet was re-suspended in 250 mL cold and sterile 10
% (v/v) glycerol and centrifuged again. This step was repeated with 150 and 20 mL glyc-
erol. After the last centrifugation step, the pellet was re-suspended in 2 mL glycerol, and
separated in 80 µL aliquots. Aliquots were frozen in liquid nitrogen and stored at -80 °C.
2.2.1.2 Electroporation
Electro-competent cells (80 µL) (Table 8) were thawed on ice and mixed with 5 µL plas-
mid DNA, “rolling circle” PCR products or ligation products. The mixture was trans-
ferred into a cold electroporation cuvette and transformation was performed in an elec-
troporator (EasyjecT, EquiBio) at 1250 V, 25 mA and 25 Ω. The transfected cells were
re-suspended in 800 µL LB-medium, transferred into a micro-centrifuge tube and incu-
bated for 1 h at 37 °C. 50 µL of the cells were either spread on an LB-agar plate in order
to screen for positive clones (2.2.2.8) or directly used for inoculation of a pre-culture.

2 Material and methods 49
2.2.2 Molecular biology methods
2.2.2.1 Electrophoresis
Agarose gel electrophoresis
Agarose gel electrophoresis was used to analyze large DNA fragments from 800 - 10000
bp in size. The samples were mixed with 5x loading buffer (250 mM EDTA pH 8, 30 %
(v/v) glycerol, 1.2 % SDS, 0.3 mg/mL bromphenol blue, 0.3 mg/mL xylencyanol) and
loaded on the gel (0.8 % (w/v) agarose in 1x TPE buffer). The run was performed in 1x
TPE buffer (0.9 M Tris-H3PO4 pH 8.2, 2 mM EDTA) for 1 h at 90 V. The gel was stained
with ethidium bromide and the bands were visualized and documented using the BioDoc
Analyze (Biometra) gel documentation system.
Polyacrylamide gel electrophoresis (PAGE)
Polyacrylamide gel electrophoresis was used to analyze small DNA fragments up to 800
bp in size. The samples were mixed with 5x loading buffer and loaded on the gel (6 %
(v/v) polyacrylamide (29:1) in 1 x TPE buffer). The run was performed in 1x TPE buffer
for 1 h at 45 mA. The gel was stained with ethidium bromide and the bands were visual-
ized and documented using the BioDocAnalyze (Biometra) gel documentation system.
Denaturing PAGE
Denaturing polyacrylamide gel electrophoresis was used to analyze fluorescently labeled
DNA fragments, which were generated in the competitive cleavage assay (2.2.3.3). Sam-
ples were mixed with 2x Urea stop buffer (100 mM EDTA, 80 % (v/v) formamide) and
loaded onto the gel (20 % (v/v) polyacrylamide (19:1), 7 M urea in 1x TBE buffer). Prior
to the sample loading, the gel was pre-run for 1 h in 1x TBE buffer (100 mM Tris-H3BO3
pH 8.3, 2.5 mM EDTA) until the electric current stabilizes at a value of 15 mA. The main
run was performed under the same conditions for an additional hour. The fluorescent
bands were visualized using the VersaDocTM Imaging System (Bio-Rad) and quantita-
tively analyzed with the program GelAnalyzer.

2 Material and methods 50
SDS-PAGE
SDS polyacrylamide gel electrophoresis was used to analyze protein molecules. The
SDS-gel is composed of a stacking gel (6 % (v/v) polyacrylamide (29:1) in 130 mM Tris-
HCl pH 6.8, 0.1 % SDS) and a separating gel (10 - 15 % (v/v) polyacrylamide (29:1) in
420 mM Tris-HCl pH 8.8, 0.1 % SDS). The samples were mixed with 2x Laemmli load-
ing buffer (160 mM Tris-HCl pH 6.8, 2 % SDS, 5 % 2-mercaptoethanol, 40 % (v/v) glyc-
erol, 0.1 % bromphenol blue), loaded on the gel and separated for 1 h at 35 mA in 1x
Laemmli SDS-buffer (25 mM Tris, 0.19 M glycine, 0.1 % SDS). After the run, the gel
was washed with hot water (2 x 15 min) and stained with Colloidal Coomassie Staining
Solution (0.1 % Coomassie® Brilliant Blue G250, 2 % (v/v) H3PO4, 5 % aluminum sul-
fate, 10 % ethanol). The bands were documented using the BioDocAnalyze (Biometra)
gel documentation system.
2.2.2.2 Polymerase chain reaction (PCR)
The polymerase chain reaction was used for site directed mutagenesis (2.2.2.6), to am-
plify genes for cloning approaches (2.2.2.7), for screening (2.2.2.8) or for the amplifica-
tion of DNA fragments used in the competitive cleavage assay (2.2.3.3).
Two different types of polymerases were used: (i) The Pfu-polymerase possess proof-
reading activity and was used for all purposes where genetic integrity of the PCR-product
was important. (ii) The Taq-polymerase does not possess proof-reading activity and was
used for screening purposes only. The reaction profile for both polymerases is shown in
Table 19.
Table 19: PCR profile
Taq-polymerase Pfu-polymerase
1. Initial step 3 min at 95 °C 5 min at 93 °C
2. Denaturation 30 s at 95 °C 30 s at 93 °C
3. Primer annealing 45 s at 3 °C above TM of
primer with lowest TM
45 s at 3 °C above TM of
primer with lowest TM
4. Extension 1 min/1000 bp at 72 °C 1 min/500 bp at 68 °C
5. Final step 5 min at 72 °C 5 min at 68 °C
The steps 2 – 4 were repeated 29-times.

2 Material and methods 51
The reaction mixture for both polymerases is shown in Table 20. For screening purposes
also a single re-suspended colony has been used as template. The activity buffer of the
Taq polymerase contained 10 mM Tris-HCl pH 8.8, 50 mM KCl, 0.1 % Triton X-100 and
1.5 mM MgCl2, the activity buffer of the Pfu polymerase contained 20 mM Tris-HCl pH 9.0,
10 mM (NH4)SO4, 10 mM KCl, 0.1 % Triton X-100 and 2.5 mM MgSO4.
Table 20: PCR mixture
Taq-polymerase Pfu-polymerase
dNTPs 250 µM 250 µM
Buffer 1x Taq activity buffer 1x Pfu activity buffer
Forward primer 400 nM 400 nM
Backward primer 400 nM 400 nM
Template 10 – 50 ng DNA 10 – 50 ng DNA
Polymerase 3 U 10 U
Total volume 30 µL 100 µL
The resulting PCR-products were either purified using the Promega Wizard® SV Gel and
PCR Clean-Up System according to the manual or directly analyzed by gel electrophore-
sis (2.2.2.1).
2.2.2.3 Isolation of DNA
Isolation of plasmid-DNA was done either low-scale with the Promega PureYield™ Plas-
mid Miniprep System or high-scale with the Promega PureYield™ Plasmid Midiprep
System according to the manufacturer’s instruction.
2.2.2.4 Ethanol precipitation
Ethanol precipitation was used to purify digested plasmid-DNA or PCR products and
ligation products. The following protocol was used: the sample with the volume (vol.)
was mixed with 1/3 vol. of sodium acetate and 3 vol. of 100 % (v/v) ethanol and incubated
for 30 min on ice. Subsequently the sample was centrifuged for 30 min with 12000 rpm
at 4 °C. The supernatant was removed and the pellet was re-suspended with the same
volume of 70 % (v/v) ethanol. After a second centrifugation step and the removal of the
supernatant the pellet was dried for 15 min on a heating block and dissolved in 15 – 20
µL water.

2 Material and methods 52
2.2.2.5 Determination of DNA concentration
The concentration of single- and double-stranded oligonucleotides, PCR-fragments or
plasmid-DNA was determined using the spectrophotometer NanoDrop® 1000 (Thermo
Scientific) and the Lambert-Beer law 𝐴 = 𝜀 ∙ 𝑐 ∙ 𝑑, where A = absorption at 260 nm, ε =
molar extinction coefficient and d = optical path length. The molar extinction coefficient
was calculated on the webpage http://biophysics.idtdna.com.
2.2.2.6 Site-directed mutagenesis
Site-directed mutagenesis was used to substitute certain amino acids in a protein, espe-
cially to create single-cysteine variants (3.2.1) and the different linker variants of the fu-
sion protein scRM6-EcoRV (3.1.1). To this end, a PCR primer, carrying the desired mu-
tation and an additional restriction site for screening, was designed (Table 10). The sec-
ond primer was chosen in order to yield a fragment of approximately 300 bp in size. A
Pfu-PCR was performed with the plasmid coding for the protein to be mutated as template
(2.2.2.2). The PCR product, the so-called ‘megaprimer’, was purified and the correct size
was confirmed by PAGE. The generated megaprimer was used as primer together with
the same plasmid as template in a second PCR (so-called ‘rolling circle’ PCR [84]). The
reaction profile of the rolling circle PCR is shown in Table 21.
Table 21: Rolling circle PCR profile
Pfu-polymerase
1. Initial step 5 min at 93 °C
2. Denaturation 1 min at 93 °C
3. Primer annealing 50 s at 60 °C
4. Extension 15 min at 68 °C
5. Final step 20 min at 68 °C
The steps 2 – 4 were repeated 15-times.
The rolling circle PCR yielded a circular PCR product, which was incubated with DpnI
for 3 h at 37 °C. DpnI cleaves only methylated sites, thereby only the original plasmid
lacking the mutation was digested. After ethanol precipitation (2.2.2.4), appropriate elec-
tro-competent cells were transfected with the circular plasmid (2.2.1.2). The transfor-
mation was spread on an LB-agar plate and screened for positive clones (2.2.2.8).

2 Material and methods 53
2.2.2.7 Cloning
Cloning was used to generate the fusion protein consisting of scRM6 and EcoRV. To this
end, the gene coding for the single-cysteine variant scRM6 D54C and the gene coding for
the cysteine-free variant EcoRV C21S had to be transferred from their original plasmids
(pMK-RQ and pHisRV, respectively) to the expression vector pET28a, coding for an N-
terminal His6-Tag. The genes were cloned consecutively (see Figure 12).
Figure 12: Cloning strategy for the fusion protein scRM6-EcoRV. Cloning was performed in a 2-step reaction. First,
the gene coding for scRM6 D54C (red) was transferred to pET28a (blue) via NdeI and HindIII restriction sites. Second,
the gene coding for EcoRV C21S (green) was transferred to the plasmid pET28a_scRM6 D54C via HindIII and XhoI
restriction sites.
First, the plasmid pMK-RQ containing the synthetic gene coding for the single-cysteine
variant scRM6 D54C and the vector plasmid pET28a were digested with NdeI and
HindIII according to the company’s manual. The digests were purified (2.2.2.4) and the
concentration was determined (2.2.2.5). To prevent re-ligation of the vector plasmid
pET28a with the original insert, a dephosphorylation of DNA 5’-termini was performed.
Therefore, 1 µg of linearized vector DNA was mixed with 10x Dephosphorylation Buffer
(Fermentas) and 1 U CIAP (Calf Intestinal Alkaline Phosphatase) in a total reaction vol-
ume of 20 µL and incubated for 30 min at 37 °C. The dephosphorylated vector was puri-
fied again. In the following ligation, 100 ng of the vector plasmid and a 5-fold molar
excess of the insert were mixed with 10x T4 DNA Ligase Buffer (Fermentas) and 5 U T4
DNA Ligase in a total reaction volume of 20 µL and incubated overnight at 16 °C. The
ligation product was purified, transferred into electro-competent cells (BL21DE3 pLBM),
spread on an LB-agar plate and screened for positive clones (2.2.2.8).

2 Material and methods 54
Second, the gene coding for EcoRV C21S was amplified via Pfu-PCR using the plasmid
pHisRV as template and primers covering the 5’ and 3’ region of the gene and carrying
defined restriction sites (see Table 11). The PCR product was purified as describe before.
After this, the PCR product with the gene coding for EcoRV C21S and the vector plasmid
pET28a_scRM6 D54C were digested with HindIII and XhoI according to the company’s
manual. The digests were purified, the vector plasmid was dephosphorylated and vector
and insert were ligated as described above. The ligation product was purified and trans-
ferred into electro-competent cells (BL21DE3 pLBM), spread on an LB-agar plate and
screened for positive clones (2.2.2.8).
2.2.2.8 Screening
Screening was used to analyze the success of site-directed mutagenesis (2.2.2.6) or clon-
ing (2.2.2.7). Several colonies were picked from an LB-agar plate and served as a tem-
plate in a subsequent PCR performed with Taq-polymerase (2.2.2.2). The primers were
chosen in order to cover the region of interest and are shown in Table 12. The PCR prod-
ucts were separated on a polyacrylamide or agarose gel (depending on the size of the
DNA fragment) and analyzed either for the correct size of the fragment (successful inser-
tion increased the size of the fragment) or the presence or absence of a restriction site
after digesting the fragment with the desired enzyme. Positive clones were used for inoc-
ulation of a LB-medium culture. Plasmids were isolated low scale as described in 2.2.2.3
and sent for sequencing to confirm the correctness of the changed gene.
2.2.2.9 Protein overexpression
For the expression of proteins either a single colony from a LB-agar plate or freshly trans-
formed E. coli cells containing the plasmid coding for the protein were used to inoculate
a 50 mL pre-culture. After incubation overnight at 37 °C in an air shaker, 10 mL of the
pre-culture were used to inoculate a 500 mL main-culture. The cells were grown at 37 °C
until the OD600 reached a value of 0.8. Protein expression was induced by adding 5 mL
100 mM IPTG to give a final concentration of 1 mM. The cells were further grown for 2
h at 37°C (BsoBI), 3 h at 37°C (scPvuII), overnight at 30°C (PvuII) or overnight at 20 °C
(all other variants). To control the expression of the protein, samples were taken before
and after induction. The volume taken depended on the OD600 before and after induction
in order to load the same amount of cells, allowing for comparison of the expression.

2 Material and methods 55
The samples for the expression test were centrifuged for 1 min at 13400 rpm (BioFuge
Ependorf) and the pellet was re-suspended in 20 µL 2x Laemmli loading buffer. After
heating the samples at 95 °C for 5 min, they were loaded on an SDS gel and analyzed.
The cells containing the desired protein were harvested by centrifugation for 15 min at
4200 rpm (Beckman JC-H6). The cell pellet was washed with 40 mL 1x STE buffer (10
mM Tris/HCl pH 8, 100 mM NaCl, 0.1 mM EDTA) and centrifuged again under the same
conditions. The pellet was either stored at -20 °C or directly purified (2.2.2.10).
2.2.2.10 Protein purification
The buffers used for protein purification are listed in Table 2, Table 3 and Table 4.
Ni-NTA agarose purification. All protein variants carry an N-terminal Histidine-Tag
and were therefore well-suited for the purification via Ni-NTA agarose beads. The prin-
ciple is based on the binding to immobilized Ni2+-ions via the imidazole group of the
histidine residue. This process is reversible and the proteins can be eluted by addition of
free imidazole. The structure of NTA (nitrilotriacetic acid) in complex with Ni2+ is shown
in Figure 13.
Figure 13: Structure of NTA in complex with Ni2+: Ni-NTA agarose consists of the chelating ligand nitrilotriacetic
acid (NTA) immobilized on agarose beads. Binding of proteins is based on the interaction between the polyhistidine-
tag of the recombinant protein and the complexed Ni2+-ions (adopted from: User’s Manual Macherey-Nagel).
The cell pellet was thawed on ice and re-suspended in 30 mL LEW or LE buffer. The
cells were lysed by ultrasonification with the Branson sonifier (12 x 30 s with 15 s break,
duty cycle 50 %, output control 5). All fusion proteins were subjected to an additional
step prior to ultrasonification. They were incubated with 1 mg/mL lysozyme (Sigma Al-
drich) for 30 min at 4°C in order to decrease the amount of proteins stuck in the pellet.
Also the time for ultrasonification was duplicated.

2 Material and methods 56
The cell suspension was centrifuged for 30 min at 20000 rpm and 4 °C (Beckman, JA20)
to separate the soluble fraction containing the protein from the cell debris. 500 µL Ni-
NTA suspension (Quiagen) were equilibrated with 20 mL LEW or LE buffer for 15 min.
The soluble fraction was added to the Ni-beads and incubated for 2 h at 4 °C. After wash-
ing twice with 30 mL LEW or W buffer, the proteins were eluted with elution buffer and
3 fractions of 500 µL were collected. The purity and size of the proteins was analyzed by
SDS-PAGE (2.2.2.1). Fractions containing the protein were dialyzed overnight in dialysis
buffer or directly used for further purification steps.
Heparin purification. Heparin is a negatively charged macromolecule and has a high
structural similarity to DNA. Therefore it is well suited for the purification of DNA-bind-
ing proteins. The binding is reversible and the proteins can be eluted by increasing the
salt concentration of the buffer, thereby weakening electrostatic interactions. The struc-
ture of Heparin is shown in Figure 14.
Figure 14: Detail of the structure of Heparin. Heparin is a highly sulfated glucosaminoglycan. Because of the high
number of anionic sulfate groups it can be used either as a cation exchanger by capturing proteins with an overall
positive charge. On the other hand it is suited for the purification of DNA-binding proteins, such as restriction enzymes,
by taking advantage of the structural similarity to DNA being a negatively charged, sugar-containing macromolecule
(adopted from Wikipedia).
Purification via Heparin was done only for scRM6-EcoRV fusion protein variants to sep-
arate them from other proteins that could be found in the eluates of the Ni-NTA agarose
purification. Therefore, all eluates were pooled and reduced to a volume of 500 µL using
Vivaspin 500 (10K) columns (GE Healthcare). The concentrated proteins were mixed in
a 1:1 ratio with low-salt buffer and loaded onto a HiTrapTM Heparin HP column (GE
Healthcare) connected to the ÄKTApurifierTM (GE Healthcare). Elution of the proteins
was achieved by increasing the concentration of high-salt buffer by a linear gradient. The
elution fractions were collected in tubes and analyzed by SDS-PAGE (2.2.2.1). Fractions
containing the protein were dialyzed overnight in dialysis buffer.

2 Material and methods 57
2.2.2.11 TCA precipitation
TCA precipitation was applied after Heparin purification, if the protein concentration of
collected fractions was too low to load it directly on a SDS-gel. Depending on the size of
the peak in the chromatogram of the Heparin purification, a sample of the volume (vol.)
was taken, mixed with 1/10 vol. TCA and incubated for 15 min on ice. Subsequently the
sample was centrifuged for 15 min with 12000 rpm at 4 °C. The supernatant was dis-
carded and the pellet was re-suspended in 20 µL 2x Laemmli loading buffer resulting in
an orange color of the solution. After the addition of 1 µL 2M Tris the color of the solution
changed to blue and samples were heated to 95 °C for 5 min. Finally, the samples were
analyzed by SDS-PAGE (2.2.2.1).
2.2.2.12 Determination of protein concentration
The concentration of protein was determined using the spectrophotometer NanoDrop®
1000 (Thermo Scientific) and the Lambert-Beer law 𝐴 = 𝜀 ∙ 𝑐 ∙ 𝑑, where A = absorption
at 280 nm, ε = molar extinction coefficient (see Table 16) and d = optical path length.
The molar extinction coefficient ε was calculated based on the amino acid content [85]
and are summarized in Table 16.
2.2.2.13 Determination of protein cleavage activity
The activity assay was performed to compare the activity of wild type EcoRV and wild
type PvuII with the corresponding single-cysteine variants or fluorescently-labeled vari-
ants (3.2.1.1) and to compare wild type EcoRV with different scRM6-EcoRV fusion pro-
tein variants (3.1.2.1). In the activity assay, different concentrations of the protein were
mixed with 6 nM plasmid-DNA (pAT-PEB), containing only one recognition site for
PvuII and EcoRV, respectively. The samples were incubated for 1 h at 37 °C in reaction
buffer, supplemented with 10 mM MgCl2 (Table 5). The reaction was stopped by adding
5x loading buffer and fragments were analyzed on a 0.8 % agarose gel. The gel was
stained with ethidium bromide and bands were visualized using the BioDocAnalyze (Bi-
ometra) gel documentation system.
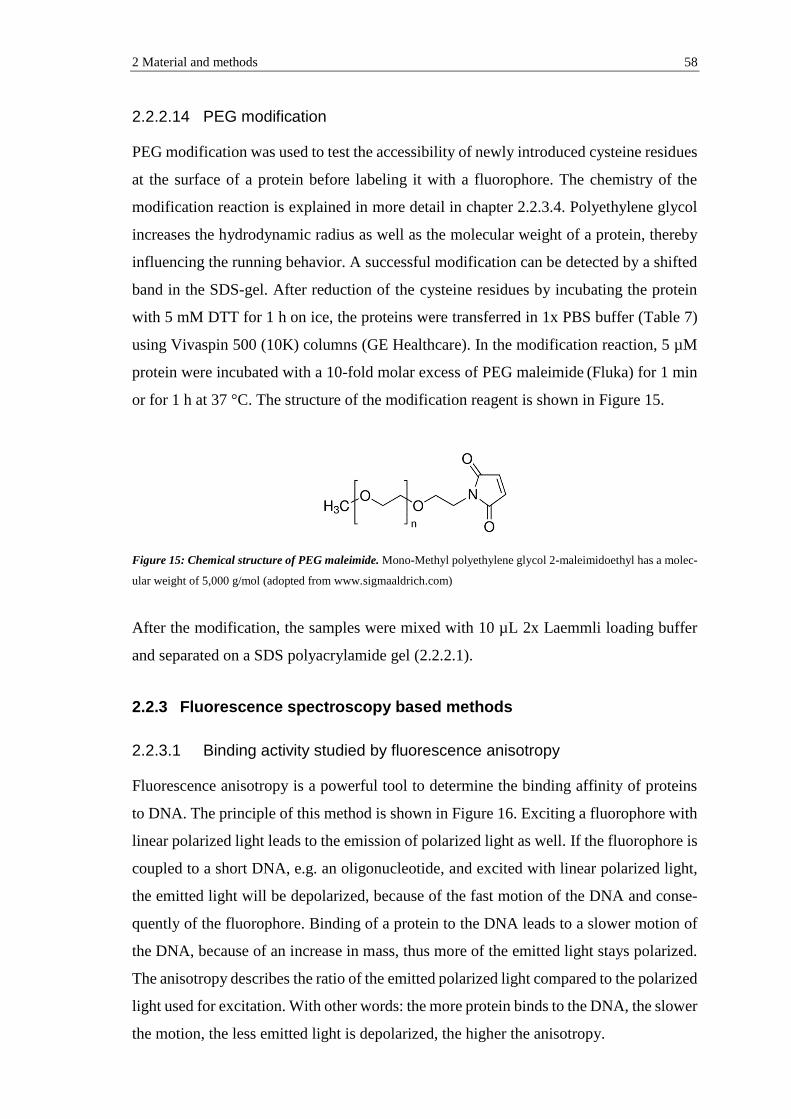
2 Material and methods 58
2.2.2.14 PEG modification
PEG modification was used to test the accessibility of newly introduced cysteine residues
at the surface of a protein before labeling it with a fluorophore. The chemistry of the
modification reaction is explained in more detail in chapter 2.2.3.4. Polyethylene glycol
increases the hydrodynamic radius as well as the molecular weight of a protein, thereby
influencing the running behavior. A successful modification can be detected by a shifted
band in the SDS-gel. After reduction of the cysteine residues by incubating the protein
with 5 mM DTT for 1 h on ice, the proteins were transferred in 1x PBS buffer (Table 7)
using Vivaspin 500 (10K) columns (GE Healthcare). In the modification reaction, 5 µM
protein were incubated with a 10-fold molar excess of PEG maleimide (Fluka) for 1 min
or for 1 h at 37 °C. The structure of the modification reagent is shown in Figure 15.
Figure 15: Chemical structure of PEG maleimide. Mono-Methyl polyethylene glycol 2-maleimidoethyl has a molec-
ular weight of 5,000 g/mol (adopted from www.sigmaaldrich.com)
After the modification, the samples were mixed with 10 µL 2x Laemmli loading buffer
and separated on a SDS polyacrylamide gel (2.2.2.1).
2.2.3 Fluorescence spectroscopy based methods
2.2.3.1 Binding activity studied by fluorescence anisotropy
Fluorescence anisotropy is a powerful tool to determine the binding affinity of proteins
to DNA. The principle of this method is shown in Figure 16. Exciting a fluorophore with
linear polarized light leads to the emission of polarized light as well. If the fluorophore is
coupled to a short DNA, e.g. an oligonucleotide, and excited with linear polarized light,
the emitted light will be depolarized, because of the fast motion of the DNA and conse-
quently of the fluorophore. Binding of a protein to the DNA leads to a slower motion of
the DNA, because of an increase in mass, thus more of the emitted light stays polarized.
The anisotropy describes the ratio of the emitted polarized light compared to the polarized
light used for excitation. With other words: the more protein binds to the DNA, the slower
the motion, the less emitted light is depolarized, the higher the anisotropy.

2 Material and methods 59
Figure 16: Principle of fluorescence anisotropy. A fluorophore (yellow star) coupled to a short DNA, is excited with
linear polarized light (left). The fluorophore coupled to free DNA (middle, upper) will emit depolarized light (right,
upper), because of the fast motion of the DNA. The fluorophore coupled to a protein-bound DNA (middle, lower) will
emit polarized light (right, lower) because of a slower motion of the DNA.
The DNA used for fluorescence anisotropy measurements was prepared by annealing the
5’-HEX labeled upper strand with the complementary lower strand (see Table 14). The
16 bp long oligonucleotide was either a specific one, with the recognition site located in
a central position (GAT↓ATC for EcoRV, CAG↓CTG for PvuII, and C↓TCGAG for
BsoBI) or a non-specific one with the corresponding recognition site in a reverse orien-
tation. The flanking base pairs were identical for each specific/non-specific DNA pair.
Fluorescence anisotropy measurements were used for two different purposes. In the first
set of experiments, the dissociation constant (KD) of six different scRM6-EcoRV fusion
protein variants (scRM6 D54C-L(x)-EcoRV C21S) was determined in comparison to the
wild type protein EcoRV C21S (3.1.2.2). In these experiments only the KD of the specific
oligonucleotide was determined in the presence of Ca2+-ions. In the second set of exper-
iments, the dissociation constant (KD) of EcoRV D214C, PvuII D125C and BsoBI A153C
was determined in the presence of either Ca2+-ions, Mg2+-ions or EDTA (3.2.2). The KD
was determined for the specific as well as for the non-specific oligonucleotide. All steady-
state ensemble anisotropy measurements were carried out at 24 °C using the Fluoro-
Max®4 spectrofluorimeter (HORIBA Jobin-Yvon).
In the first set of experiments the excitation wavelength was set at 535 nm (slit width 5
nm) and the emission was detected at 556 nm (slit width 5 nm). In the second set of
experiments the excitation wavelength was set at 530 nm (slit width 6 nm) and the emis-
sion was detected at 556 nm (slit width 6 nm). Initially, the cuvette (Quartz Ultra-Micro
Cell, Hellma) was filled with 99 µL reaction buffer (supplemented with either 5 mM
CaCl2, 10 mM MgCl2 or 1 mM EDTA) and the intensities of the emitted polarized light
were measured through vertical and horizontal polarization filters (IVV, IVH, IHV, IHH).

2 Material and methods 60
Next, 1 µL HEX-labeled oligonucleotide was added, resulting in a final concentration of
2 nM DNA (if not otherwise stated) and the intensities of the emitted polarized light were
measured again. Finally 1 µL aliquots of increasing concentrations of protein were added
to the cuvette, incubated for 1 min and the intensities of the emitted polarized light were
measured after each addition. Each protein concentration was measured 5-times and sub-
sequently averaged. The change of the volume due to the addition of protein never ex-
ceeded 8 % of the total binding reaction.
Afterwards, the respectively measured intensities of the emitted polarized light were cor-
rected by subtraction the intensities of the buffer from the intensities of the DNA and each
protein concentration. The anisotropy was recalculated using the following equation:
𝑎𝑛𝑖𝑠𝑜𝑡𝑟𝑜𝑝𝑦 =(
𝐼𝑉𝑉 ∙ 𝐼𝐻𝐻
𝐼𝑉𝐻 ∙ 𝐼𝐻𝑉) − 1
(𝐼𝑉𝑉 ∙ 𝐼𝐻𝐻
𝐼𝑉𝐻 ∙ 𝐼𝐻𝑉) + 2
where IVV and IVH are the intensities of the vertical and horizontal components of the emit-
ted light using vertical polarized excitation and IHV and IHH are the intensities of the vertical
and horizontal components of the emitted light using horizontal polarized excitation. The
anisotropy was then plotted against the protein concentration and a simple bimolecular
binding model was fitted by non-linear regression to the data.
2.2.3.2 Michaelis-Menten kinetics
The Michaelis-Menten theory is a mathematical model, which describes enzyme cata-
lyzed reactions. It is defined by the Michaelis-Menten equation (Figure 17, right), where
v0 is the initial velocity, vmax is the maximum velocity, [S] is the substrate concentration
and KM is the Michaelis-Menten constant, which represents the substrate concentration at
half maximum velocity (1/2 vmax).
𝑣0 =𝑣𝑚𝑎𝑥 ∙ [𝑆]
𝐾𝑀 + [𝑆]
Figure 17: Michaelis-Menten kinetics. (Left) Typical curve according to Michaelis-Menten. Plotted is the substrate
concentration ([S]) against the velocity (v). The characteristic kinetic parameters vmax and ½ vmax are marked on the y-
axis, KM is marked on the x-axis. (Right) Michaelis-Menten equation.

2 Material and methods 61
The KM is a measure of the affinity of an enzyme for its substrate. Dividing the maximum
velocity vmax by the enzyme concentration [E] yields kcat, which is also known as the
turnover number. The catalytic efficiency, given by the ratio kcat/KM, allows comparing
different enzymes. The resulting graph (Figure 17, left) is a hyperbola, which asymptoti-
cally reaches the maximum velocity.
Michaelis-Menten kinetics were performed with the molecular beacon assay [86]. A mo-
lecular beacon is a short oligonucleotide with a hairpin structure, which carries at one end
a fluorophore and at the other end a quencher. The principle of this assay is shown in
Figure 18.
Figure 18: Principle of the molecular beacon assay. The fluorescence of the HEX-fluorophore (green) is quenched
by the BHQ quencher (red) as long as the beacon is uncleaved. Cleavage of the beacon by a restriction endonuclease
leads to the dissociation of the terminal end and the subsequent melting of the strands, thereby fluorophore and quencher
get separated and an increase in fluorescence can be measured.
The molecular beacon 5’– (HEX) – CGGATATCGGACTTTTTTTTTTTTTTTT-
GTCCGATATCCG – (BHQ) – 3’ used in this assay was purchased from Biomers (Ol-
igo_006). It is composed of a T16-loop and a 12 bp duplex, which contains a specific
recognition site for EcoRV (GATATC). Steady-state measurements were carried out un-
der multiple turnover conditions at 37 °C with the InfiniteF200Pro plate-reader (Tecan).
The following filter set for the HEX fluorophore was used: excitation at 535 nm (25 nm
bandwidth), emission at 590 nm (20nm bandwidth). A mastermix, containing reaction
buffer and either 100 pM (EcoRV C21S), 500 pM (scRM6 D54C-EcoRV C21S) or 1 nM
(scRM6 D54C-L(x)-EcoRV C21S) protein, respectively, was prepared and 80 µL aliquots
were pipetted into eight wells of a microtiter plate. Immediately before measuring, 10 µL
molecular beacon with concentrations ranging from 1 – 50 nM (EcoRV C21S and scRM6
D54C-EcoRV C21S) or 6 – 300 nM (scRM6 D54C-L(x)-EcoRV C21S) were added to one
well of the microtiter plate, respectively. The reaction was started by the addition of 10
µL MgCl2 (via the inject function of the device), resulting in a final concentration of 10
mM. The increase in fluorescence was recorded over a period of 10 min every 3 s.

2 Material and methods 62
The gain was set at 90. The initial velocity was calculated by linear regression of the first
20 data points and plotted against the beacon concentration. From the resulting curve, KM
and vmax were determined by non-linear regression using the Michaelis-Menten equation.
2.2.3.3 Competitive cleavage assay
To investigate the influence of linear diffusion on the rate of cleavage, a competitive
cleavage assay was employed. A similar assay had been described in detail [87] and had
already been applied for EcoRI [44] and EcoRV [31,45]. In the assay, two DNA substrates
– a short oligonucleotide and a long PCR fragment – each containing one specific recog-
nition site for either BsoBI, EcoRV or PvuII, were cleaved in competition. The short oli-
gonucleotide was generated by annealing a 5’-Atto647N-labeled 26mer with the comple-
mentary oligonucleotide (see Table 13). To amplify the long PCR fragment, the same
26mer, but 5’-Atto488-labeled, was used as the upper PCR primer together with different
lower primers to amplify fragments of 158, 498, 958 and 1488 bp in length (see 2.2.2.2).
As PCR template the plasmid pAT-PEB was used. The correct size of the fragments was
confirmed by PAGE (see 2.2.2.1). This procedure ensured, that the specific recognition
site is embedded in an identical sequence context of 26 bp, flanked by a short arm of 7 bp
and a long arm comprising 145 – 1480 bp (Figure 19).
For control experiments, also a 5’-Atto488 26mer was generated by annealing. The label-
ing with different fluorophores allows determining the cleavage rate of the short and the
long substrate independently but in one reaction mixture.
Figure 19: Scheme of substrate design. Different PCR fragments were generated by PCR using the pAT-PEB plasmid
as template and a 5’-Atto488 (green) labeled 26mer oligonucleotide as upper primer. The lower primers were chosen
to amplify fragments of 153, 498, 958 and 1488 bp in length. The 26 bp oligonucleotide was generated by either
annealing the same 5’-Atto488 labeled upper primer or a 5’-Atto647N (red) labeled 26mer oligonucleotide with the
complementary strand (DNA fragments are not drawn to scale). Adopted from [45].

2 Material and methods 63
In the cleavage reaction, 20 nM of the short oligonucleotide and 20 nM of one of the long
PCR fragments were incubated with either 600 pM (BsoBI A153C, EcoRV D214C, PvuII
D125C, scPvuII) or 10 nM (scRM6 D54C-EcoRV) protein in reaction buffer (Table 5,
supplemented with 10 mM MgCl2) at 37°C. At defined time intervals, 10 µL aliquots
were withdrawn and mixed with 10 µL of 2x Urea stop buffer to stop the reaction. The
resulting fragments were separated by denaturing PAGE (2.2.2.1). The fluorescent bands
were visualized using the VersaDocTM Imaging System (Bio-Rad) and quantitatively an-
alyzed with the program GelAnalyzer. The amount of substrate cleavage was plotted
against the time and a single exponential function was fitted to the data points.
In experiments, in which the salt dependence was investigated, the NaCl concentration of
the reaction buffer was altered to 20, 100 and 200 mM, respectively. In order to test
whether the effect of linear diffusion can be abolished, experiments were carried out with
20 nM of the 26mer oligonucleotide and 20 nM of the 958mer PCR fragment predigested
with the 4 bp-cutter HaeIII for 2 h at 37 °C, similarly as described by Ehbrecht et al. [40].
The predigested substrates were used without further treatment as described above.
2.2.3.4 Fluorescent labeling
A wide commonly used technique to modify proteins at defined sites is the modification
via maleimide chemistry. The reactive maleimide group of the modification reagent (e.g.
a fluorophore or PEG) reacts specifically with the functional sulfhydryl group of the pro-
tein to form a stable covalent bond (see Figure 20). Since the sulfhydryl group is only
present in the side chain of the amino acid cysteine, the reaction is highly specific.
Figure 20: Reaction scheme for chemical conjugation. (R) represents a labeling reagent that carries the reactive ma-
leimide group, e.g. a fluorophore, (P) represents a protein that carries the functional sulfhydryl group. The maleimide
groups reacts with sulfhydryl group under formation of a stable covalent thioether bond (adopted from www.pierce-
net.com)
For site-specific labeling, cysteine residues located at the surface of the protein had to be
removed by mutagenesis and a single cysteine residue had to be introduced at the desired
position. For an efficient labeling the sulfhydryl group must be kept in a reduced state.

2 Material and methods 64
Thus, proteins were incubated with 5 mM reducing agent (e.g. DTT) prior to the labeling
reaction. The next step was a buffer exchange, on the one hand to create optimal buffer
conditions for the chemical reaction (e.g. pH value), on the other hand to remove sub-
stances that can disturb the reaction (e.g. DTT). For this purpose Vivaspin 500 (10K)
columns (GE Healthcare) were used following the manufacturer’s instruction to transfer
the protein in 1x PBS buffer (Table 7). For random double labeling reactions, 20 – 30 µM
protein were first mixed with a 1:1 molar ratio (over dimer protein concentration) of donor
fluorophore (Atto488, Cy3 or Cy3B) and shortly after a 10-fold molar excess (over dimer
protein concentration) of acceptor fluorophore (Atto647N or Cy5) was added. Protein and
fluorophores were incubated for 2 h at room temperature in 1x PBS buffer. For single
labeling reactions, 20 – 30 µM proteins were mixed with a 10-fold molar excess (over
dimer protein concentration) of either donor or acceptor fluorophore and also incubated
for 2 h at room temperature in 1x PBS buffer. Since the fluorophores were dissolved in
DMSO, the amount of the organic solvent never exceeded 10 % (v/v) of the total reaction
volume. To remove the excess of unreacted, free fluorophore, Dynabeads® His-tag Iso-
lation & Pulldown (Invitrogen) were used. The principle is shown in Figure 21.
Figure 21: Principle of free fluorophore removal via Dynabeads®. (1) The labeling reaction was incubated with the
magnetic beads allowing the labeled proteins (His-tagged) to bind to the magnetic beads (Ni2+-coated). By applying a
magnet, labeled proteins (bound to the beads) were separated from the free fluorophore (supernatant) (2) By adding 3-
times wash buffer further free fluorophore was removed (3) The addition of elution buffer (containing imidazole) de-
tached the labeled proteins from the beads.
Dynabeads® are coated in a cobalt-based Immobilized Metal Affinity Chromatography
(IMAC) chemistry and are well-suited to isolate histidine-tagged proteins. The beads
were first re-suspended and transferred to a microcentrifuge tube. The tube was placed
on a magnet for 2min and the supernatant was discarded. Then the labeling reaction (30
µL) was added and incubated for 30 min allowing the labeled His-tagged proteins to bind
to the beads.

2 Material and methods 65
The application of a magnet for 2 min separated the labeled proteins from the free fluor-
ophore. Subsequently the beads were 3-times washed with 100 µL wash buffer (1x PBS
buffer supplemented with 0.05 % Tween20) by placing the tube on a magnet and discard-
ing the supernatant. To obtain the labeled proteins, 20 – 30 µL elution buffer (1x PBS
buffer supplemented with 300 mM imidazole) were added and incubated for 15 min. After
the application of a magnet for 2 min the supernatant, containing the labeled proteins, was
transferred to a clean tube. In order to remove imidazole and to transfer the protein in
dialysis buffer, ZebaTMSpin Desalting columns (7K) (Thermo Scientific) were used fol-
lowing the manufacturer’s instruction. The single and double labeled proteins were used
for FRET measurements (2.2.3.6).
2.2.3.5 Determination of the degree of labeling (DOL)
After modifying a protein with a fluorophore, the degree of labeling (DOL) was deter-
mined. For this purpose, the absorbance of the protein at 280 nm and the absorbance of
the fluorophore at the absorbance maximum of the dye (Table 18) was recorded with the
spectrophotometer NanoDrop® 1000 (Thermo Scientific). To correctly calculate the pro-
tein concentration, the absorbance at 280 nm had to be corrected using correction factors
(CF) provided by the supplier (Table 18). The correction factor compensates for the ab-
sorption of the dye at 280 nm. The DOL was then calculated using the following equation:
𝐷𝑂𝐿 =
𝐴𝐹
𝜀𝐹
𝐴𝑃 − (𝐴𝐹 ∙ 𝐶𝐹280)𝜀𝑃
where AF is the absorbance of the fluorophore at the absorbance maximum, εF is the molar
extinction coefficient of the fluorophore (Table 18), AP is the absorbance of the protein
at 280 nm, εP is the molar extinction coefficient of the protein (Table 16) and CF280 is the
correction factor of the fluorophore at 280 nm.
2.2.3.6 FRET measurements
Förster resonance energy transfer (FRET) is a powerful tool to study distances or small
distance changes within biomolecules [88]. Because of the distance dependence it is also
denotes as spectroscopic ruler. FRET requires the presence of two fluorophores, a donor
fluorophore and an acceptor fluorophore. Both fluorophores can be attached to the same
biomolecule (intramolecular FRET) or to different biomolecules (intermolecular FRET).

2 Material and methods 66
During FRET donor and acceptor fluorophore are coupled by dipole-dipole interactions
and the energy is transferred from the donor to the acceptor fluorophore without radiation,
which means that no photon is transferred. FRET depends on the following criteria:
(i) The emission spectrum of the donor fluorophore has to overlap with absorp-
tion spectrum of the acceptor fluorophore
(ii) Donor and acceptor dipole moments have to be in a suitable orientation to
each other
(iii) The distance of donor and acceptor should be in the range of 1 – 10 nm, which
is a typical distance in biomolecules
The FRET efficiency (E) strongly depends on the distance of donor and acceptor fluoro-
phore (Figure 22a) and can be described by the Förster equation:
𝐸 =𝑅0
6
𝑅06 + 𝑟6
where r is the distance between donor and acceptor fluorophore and R0 is the Förster
radius. R0 is characteristic for each fluorophore pair and describes the distance of donor
and acceptor at which energy transfer is 50 % efficient. Around R0, small changes in the
distance of donor and acceptor cause a large change in the FRET efficiency.
Figure 22: Principle of FRET. (a) Relationship between FRET efficiency and the distance of donor (green) and ac-
ceptor (red) fluorophore. The FRET efficiency is high, if the distance between donor and acceptor is short and it is low,
if the distance between donor and acceptor is large. (b) Emission spectra of a biomolecule double labeled with donor
and acceptor. Lower: the distance between donor and acceptor is large, thus the donor emission is high whereas the
acceptor emission is low. Upper: the distance between donor and acceptor is short, thus the donor emission decreases
whereas the acceptor emission increases.

2 Material and methods 67
FRET measurements were used for two different purposes. In the first set of experiments
the spatial expansion of the fusion protein scRM6 D54C-EcoRV C21S and different
linker variants (scRM6 D54C-L(x)-EcoRV C21S) was studied in comparison to the wild
type EcoRV C21S N154C and a DNA molecule (3.1.3). In the second set of experiments
the conformation of the structurally different restriction enzymes EcoRV D214C, PvuII
D125C and BsoBI A153 was studied in complex with specific and non-specific DNA as
well as for the apoenzyme (3.2.2). All steady-state ensemble FRET measurements were
carried out at 24 °C using the FluoroMax®4 spectrofluorimeter (HORIBA Jobin-Yvon).
Studying the spatial expansion of different fusion protein variants
Proteins were either double-labeled with Atto488 as donor fluorophore and Atto647N as
acceptor fluorophore or single-labeled with Atto488 or Atto647N, respectively (see
2.2.3.4). Emission spectra were recorded for the donor fluorophore by scanning between
490 – 800 nm (slit width 4 nm) with excitation wavelength set at 470 nm (slit width 4
nm) and for the acceptor fluorophore by scanning between 640 – 800 nm (slit width 4
nm) with excitation wavelength set at 630 nm (slit width 4 nm). Initially, the cuvette
(Quartz Ultra-Micro Cell, Hellma) was filled with 90 µL reaction buffer (supplemented
with 5 mM CaCl2) and emission spectra were recorded. Finally, 10 µL double-labeled
protein (or double-labeled DNA) was added to the cuvette, resulting in a final concentra-
tion of 50 nM protein dimer concentration (or 25 nM DNA concentration) and emission
spectra were recorded again. In control experiments, 5 µL donor only and 5 µL acceptor
only labeled protein were added together to the cuvette and incubated for 5 min, resulting
in a total protein concentration of either 50 nM. In experiments where the influence of the
presence of DNA was investigated, an excess of either a 16 bp or 60 bp long specific
oligonucleotide (see Table 14) was added to the cuvette, incubated for 5 min and emission
spectra were recorded again. The spectra were corrected for background signal by sub-
tracting the spectra of the buffer from the spectra of the protein or protein-DNA com-
plexes. Finally the corrected spectra were normalized to the maximum donor emission at
520 nm and the FRET efficiency was calculated by dividing the emission intensity of the
acceptor signal at 664 nm by the emission intensity of the donor signal at 520 nm.

2 Material and methods 68
Studying the conformation of structurally different restriction enzymes
Proteins were either double labeled with Cy3 as donor fluorophore and Cy5 as acceptor
fluorophore or single labeled with Cy3 or Cy5, respectively (see 2.2.3.4). Emission spec-
tra of double labeled proteins (FDA) were recorded for the donor fluorophore by scanning
between 552 – 800 nm (slit width 3 nm) with the excitation wavelength set at 546 nm (slit
width 3 nm) and for the acceptor fluorophore by scanning between 650 – 800 nm (slit
width 3 nm) with the excitation wavelength set at 644 nm (slit width 3 nm). Initially, the
cuvette was filled with 90 µL reaction buffer (supplemented with either 5 mM CaCl2, 10
mM MgCl2 or 1 mM EDTA) and emission spectra were recorded. Next, 10 µL double
labeled protein were added to the cuvette, resulting in a final protein concentration of 50
nM. After recording the emission spectrum of the apoenzyme, an excess of unlabeled
non-specific or specific DNA (see Table 14) was added to the cuvette and emission spec-
tra were recorded after 5 min incubation. Subsequently, emission spectra were corrected
for background signal by subtracting the spectrum of the buffer from the spectrum of the
apoenzyme or enzyme-DNA complexes. Corrected emission spectra were normalized to
the maximum donor emission and the FRET efficiency (E) was calculated directly by
dividing the emission intensity of the acceptor at 666 nm (emA) by the emission intensity
of the donor at 564 nm (emD), both resulting from direct excitation of the donor fluoro-
phore (exD) [equation adopted from [89]].
𝐸 =𝐹𝐷𝐴
𝑒𝑥𝐷,𝑒𝑚𝐴
𝐹𝐷𝐴𝑒𝑥𝐷,𝑒𝑚𝐷
Additionally, the FRET efficiency was calculated by an alternative method that considers
the correction of the acceptor emission intensity for donor bleed-through and excitation
crosstalk in accordance with the ‘Three-Cube Method’ [89]. To this end, additional meas-
urements of single labeled proteins were performed.
First, the degree of donor bleed-through was determined with a protein sample single
labeled with donor fluorophore (FD). The donor fluorophore was excited with the excita-
tion wavelength set at 546 nm and the emission intensity was measured for either donor
at 564 nm or acceptor at 666 nm. The donor bleed-through correction factor β was calcu-
lated by dividing the emission intensity of the acceptor at 666 nm (emA) by the emission
intensity of the donor at 564 nm (emD), both resulting from direct excitation of the donor
fluorophore (exD).

2 Material and methods 69
𝛽 =𝐹𝐷
𝑒𝑥𝐷,𝑒𝑚𝐴
𝐹𝐷𝑒𝑥𝐷,𝑒𝑚𝐷
Second, the degree of excitation crosstalk was determined with a protein sample single
labeled with acceptor fluorophore (FA). The acceptor fluorophore was either excited with
the excitation wavelength set at 546 nm or 644 nm and the emission intensity was meas-
ured for the acceptor at 666 nm. The excitation crosstalk correction factor α was calcu-
lated by dividing the emission intensity of the acceptor at 666 nm (emA), resulting from
excitation of the donor (exD) by the emission intensity of the acceptor at 666 nm (emA)
resulting from excitation of the acceptor fluorophore (exA).
𝛼 =𝐹𝐴
𝑒𝑥𝐷,𝑒𝑚𝐴
𝐹𝐴𝑒𝑥𝐴,𝑒𝑚𝐴
Finally, double labeled proteins were measured as described above. The acceptor fluoro-
phore was excited with the excitation wavelength set at 546 nm (exD) or 644 nm (exA)
and the emission intensity of the acceptor was measured at 666 nm (emA). The donor
fluorophore was excited with the excitation wavelength set at 546 nm (exD) and the emis-
sion intensity of the donor was measured at 564 nm (emD). The corrected FRET effi-
ciency was calculated using the following equation:
𝐸𝑐𝑜𝑟𝑟 =𝐹𝐷𝐴
𝑒𝑥𝐷,𝑒𝑚𝐴 − 𝛼 ∙ 𝐹𝐷𝐴𝑒𝑥𝐴,𝑒𝑚𝐴 − 𝛽 ∙ 𝐹𝐷𝐴
𝑒𝑥𝐷,𝑒𝑚𝐷
𝐹𝐷𝐴𝑒𝑥𝐷,𝑒𝑚𝐷

2 Material and methods 70
2.2.3.7 Single-molecule experiments
Single-molecule experiments were performed with the fusion protein variant scRM6
D54C-EcoRV C21S to determine the one-dimensional diffusion coefficient (D1) and to
verify a rotational movement by comparing D1 to mathematical models (3.1.4). The fu-
sion protein was purified and labeled with Cy3B as described in chapter 2.2.2.10 and
2.2.3.4 with the exception that the second purification step via Heparin column was con-
ducted after the labeling reaction. DNA molecules (~ 9.2 kbp in size and without any
recognition site for EcoRV) were stretched to about 70 % of their contour length by at-
taching them to a streptavidin coated coverslip via their biotinylated ends as described
previously [67,90]. To prevent non-specific interactions between the protein and the sur-
face, residual streptavidin was passivated with casein blocking reagent (Roche Diagnos-
tics) for 15 min. The stretched DNA molecules were stained with SybrGold (Invitrogen)
and visualized through excitation and emission filters (Omega Optical) after excitation
with a mercury lamp [67,90]. Transverse fluctuations of the DNA molecules ensured that
most of the DNA was free accessible in solution. After recording the position of the DNA
molecules, SybrGold was removed using a buffer containing 20 mM MgCl2. The flow-
cell was flushed with the KGB reaction buffer (Table 6) and the Cy3B-labeled fusion
proteins were injected. For detection of individual fluorophores a TIRF microscopy setup
was used as previously described [67]. Briefly, Cy3B-labeled fusion proteins were ex-
cited using a laser at 532 nm with a light intensity of 100 W/cm2. The fluorescent light
was collected through a dichroic mirror and a bandpass filter and imaged on an EMCCD
camera (Ixon, Andor Technology) with an exposure time of 20 ms. The resulting point-
spread function of the fluorescent spots in each frame was fitted with a 2D Gaussian
function, thereby locating the position of the fusion protein on the DNA molecule with
an accuracy of 30 nm. The one-dimensional diffusion coefficient (D1) of the scRM6-
EcoRV fusion protein was derived from the longitudinal mean squared displacement
(MSD) calculated from 45 enzyme trajectories that were longer than 20 successive frames
(> 400 ms).

3 Results 71
3 Results
3.1 Preparation of an elongated restriction enzyme to study
rotational motion
It has been proposed that restriction enzymes follow the helical pitch of the DNA during
sliding and thereby complementing translational diffusion by a rotational motion [44]. So
far, rotational motion of restriction enzymes during linear diffusion has only been demon-
strated indirectly by single-molecule experiments via the size dependence of the one-
dimensional diffusion coefficient (D1) [75-77]. To determine D1, fluorescently labeled
restriction enzymes are tracked using total internal reflection fluorescence microscopy.
Images are recorded by an EMCCD camera every 20 ms. On each image the longitudinal
and transversal position of the enzyme on the DNA is determined, thereby reconstructing
the enzyme trajectory. From the enzyme trajectory the mean squared displacement (MSD)
can be derived and from the slope of the longitudinal MSD the one-dimensional diffusion
coefficient (D1) can be deduced (for more details see 1.2 and Figure 10). The question
arises whether a rotational motion can also be directly demonstrated in the same experi-
mental setup used for the determination of D1. Usually, only the longitudinal position of
the fluorescent spot is supposed to change over time if the motion of the enzyme is con-
sidered as simple translational diffusion (Figure 10D).
If rotational motion of the enzyme is involved in the translocation process, also the trans-
versal position of the fluorescent spot is supposed to change in a periodic manner. This
means in more detail that the fluorescent spot is expected to appear more below the DNA
molecule in one fluorescent image and to appear more above the DNA molecule in an-
other fluorescent image (indicative of a half-rotation of the enzyme) (see Figure 23a). The
question arises whether such a transversal position change can be resolved in the experi-
mental setup. For a conventional restriction enzyme (diameter of ~ 5 nm, directly labeled
with a fluorophore) the transversal position of the fluorophore is expected to change by 5
nm while turning 180° around the DNA molecule (Figure 23a). Also the most sophisti-
cated cameras would not be able to resolve this small transversal distance change of the
fluorescent spot, which makes the visualization of a rotational motion with a conventional
restriction enzyme impossible.

3 Results 72
Figure 23: Rational design to visualize rotational movement of a restriction enzyme. (a) Conventional restriction
enzyme, directly labeled with a fluorophore (b) Elongated restriction enzyme, labeled at the terminal end of the exten-
sion component scRM6. The DNA molecule is indicated in grey, each subunit of the homodimeric restriction enzyme
is colored in light and dark blue, the fluorophore is indicated by a red sphere. The fluorescent images are explained in
Figure 10A.
It becomes obvious that in order to circumvent the spatial resolution limit, the distance
between the fluorophore and the DNA axis needs to be increased. To this end, an elon-
gated restriction enzyme has been prepared (3.1.1). As restriction enzyme component the
well-characterized Type IIP restriction enzyme EcoRV and as extension component the
engineered Rop (repressor of primer) protein scRM6 has been used [91]. scRM6 is a ho-
motetramer, which consist of a left-handed, all-antiparallel four-helix bundle with a hy-
drophobic core [91]. It has a heptad sequence periodicity (a periodicity of seven residues
in the primary sequence) with the first and fourth residue being hydrophobic, which leads
to the association of α-helices and the formation of a stable coiled coil [91]. The fusion
protein scRM6-EcoRV was created by fusing the single-cysteine variant scRM6 D54C
via its C-terminal α-helix to the N-terminal α-helix of the cysteine-free variant EcoRV
C21S (2.2.2.7), resulting in two scRM6 proteins that were fused to one EcoRV homodi-
mer (Figure 24). The position of the single-cysteine residue is located in a loop at the tip
of the four-helix bundle, whereby the distance between the fluorophore and the DNA axis
could be increased considerably. If we consider this elongated restriction enzyme (diam-
eter of ~ 20 nm, labeled at the tip of scRM6) turning 180° around the DNA molecule, the
transversal position of the fluorophore is expected to change by ~ 20 nm (Figure 23b).
Using super-resolution fluorescence microscopy imaging techniques [92], this larger dis-
tance change should be resolvable, thereby visualizing a rotational motion.

3 Results 73
Figure 24: Model of the scRM6-EcoRV fusion protein. Middle: restriction enzyme EcoRV (4RVE without specific
DNA), the two subunits of the homodimeric protein are colored in red and grey, the N-terminal α-helix in each subunit
is colored in orange. Left and right: engineered Rop protein scRM6 (1QX8), all subunits of the homotetrameric protein
are colored in orange. The C-terminal α-helix of scRM6 is directly fused to the N-terminal α-helix of EcoRV. The
green spheres indicate the position of the single-cysteine residues and the fluorescent label.
After the preparation of the scRM6-EcoRV fusion protein (3.1.1), it was initially tested
if the extension component scRM6 has an influence on the binding or cleavage activity
of the restriction enzyme component EcoRV (3.1.2). Next, the spatial expansion of the
scRM6-EcoRV fusion protein was investigated applying FRET measurements (3.1.3).
Finally, single-molecule experiments were performed to demonstrate rotational move-
ment indirectly by measuring D1 of the scRM6-EcoRV fusion protein and comparing it
to theoretical models (3.1.4) as well as to directly visualize the rotation with super-reso-
lution fluorescence microscopy [92].
3.1.1 Preparation of the scRM6-EcoRV fusion protein
The scRM6-EcoRV fusion protein, consisting of the homodimeric restriction enzyme
EcoRV and the homotetrameric engineered Rop protein scRM6, was cloned as described
in 2.2.2.7. In order to specifically label the scRM6-EcoRV fusion protein with a fluoro-
phore (2.2.3.4), a modified gene coding for the single-cysteine variant scRM6 D54C
was synthesized by GeneArt. Eight native cysteine residues at position 33, 47, 90, 104,
147, 161, 204 and 218 were replaced by alanine residues and a single cysteine residue
was introduced at position 54 in the first loop, which is located at the outside of the protein
(see Figure 25).

3 Results 74
TKQEKTALNMARFIRSQTLTLLEKLNELADIAESLHDHADELYRSALARF GDCGENL
TKQEKTALNMARFIRSQTLTLLEKLNELADIAESLHDHADELYRSALARF GDDGENL
TKQEKTALNMARFIRSQTLTLLEKLNELADIAESLHDHADELYRSALARF GDDGENL
TKQEKTALNMARFIRSQTLTLLEKLNELADIAESLHDHADELYRSALARF GDDGENL
Figure 25: Single cysteine variant of the fusion protein scRM6-EcoRV. Upper: Amino acid sequence of the homo-
tetramer scRM6. The eight native cysteine residues were exchanged for alanine residues (indicated in green) and a
single cysteine residue was introduced in the first loop at position 54. Lower: Schematic representation of one subunit
of the dimeric fusion protein. EcoRV is indicated in red, scRM6 is indicated in grey. The position of the single cysteine
residue in the first loop is indicated by a red star.
In the scRM6-EcoRV fusion protein, the C-terminal α-helix of scRM6 D54C should be
fused to the N-terminal α-helix of EcoRV C21S in a way that an elongated α–helix and a
rigid connection between the two proteins is generated (Figure 24). In order to evaluate
the optimal connection between the two proteins (with regard to binding- and cleavage
activity and spatial expansion), different linker variants of the scRM6-EcoRV fusion
protein were prepared by site directed mutagenesis (2.2.2.6). The gene coding for the
single-cysteine variant scRM6 D54C-EcoRV C21S (containing a 15 amino acids long
peptide linker between the two proteins) was used as template and five different variants
with peptide linkers of 0, 1, 2 and 3 amino acids in length were prepared (Table 22).
Table 22: Different linker variants of the scRM6-EcoRV fusion protein.
Protein variant Amino acid sequence of the peptide linker Linker Length
scRM6 D54C-EcoRV C21S α-helix-GDDGENLENLYFQGK-α-helix 15
scRM6 D54C-L(0)-EcoRV C21S α-helix-α-helix 0
scRM6 D54C-L(G)-EcoRV C21S α-helix-G-α-helix 1
scRM6 D54C-L(N)-EcoRV C21S α-helix-N-α-helix 1
scRM6 D54C-L(NA)-EcoRV C21S α-helix-NA-α-helix 2
scRM6 D54C-L(NAS)-EcoRV C21S α-helix-NAS-α-helix 3

3 Results 75
3.1.1.1 Purification of the scRM6-EcoRV fusion protein
The single-cysteine variant scRM6 D54-EcoRV C21S and the different single-cysteine
linker variants scRM6 D54-L(x)-EcoRV C21S have been purified via Ni-NTA agarose as
described in 2.2.2.10 using the purification buffers listed in Table 3. A representative SDS
gel with the different fractions of the purification procedure is shown in Figure 26 for the
variant scRM6 D54C-EcoRV C21S.
Figure 26: Purification of scRM6 D54C-EcoRV C21S via Ni-NTA agarose. 12 % (v/v) SDS gel, stained with Coo-
massie Brilliant Blue. M = marker (PageRulerTM Protein Ladder, Fermentas). According to the sum of the molecular
mass of the individual components, the fusion protein is supposed to have a size of 57 kDa.
By comparing the lanes before and after induction (last two lanes) it can be seen that the
fusion protein shows a strong expression. The three lanes of the eluates (eluate 1, 2, 3)
show various bands; one defined band with a size of ~ 57 kDa, which corresponds to the
size of the fusion protein, lots of smaller bands between 25 to 30 kDa, which correspond
to the size of the individual components (indicated that the fusion protein could have been
broken apart during purification) and also bands between 70 and 85 kDa. In order to sep-
arate the fusion protein from other proteins that could be found in the eluates, a second
purification step was conducted using a Heparin column (HiTrapTM Heparin HP 1mL)
connected to the ÄKTA purifier (2.2.2.10). Heparin is negatively charged and allows for
purification of DNA-binding proteins. The fusion proteins were eluted via a linear salt
gradient using the low and high salt buffer given in Table 3. The results of the Heparin
purification are shown in Figure 27 for the variant scRM6 D54-EcoRV C21S.

3 Results 76
Figure 27: Purification of scRM6 D54C-EcoRV C21S via Heparin column. (a) Chromatogram of the purification.
blue = absorption at 280 nm, brown = conductivity, * = first peak, ** = second peak (b) 12 % (v/v) SDS-gel, stained
with Coomassie Brilliant Blue. M = marker (PageRulerTM Protein Ladder, Fermentas), A2 = fraction, which corre-
sponds to the first peak, A9 – A12 = fractions, which correspond to the second peak.
On the chromatogram (Figure 27a) it can be seen that the conductivity starts at a value of
26 mS/cm, which corresponds to the salt concentration of the low salt buffer only (250
mM NaCl). After injection of the protein sample, the conductivity shortly increases up to
a value of 40 mS/cm and decreases subsequently to the initial value of 26 mS/cm. It can
be seen that after injection of the protein sample the absorption at 280 nm increases, in-
dicative for the elution of unbound protein. After increasing the salt concentration linearly
by mixing low salt with high salt buffer, the conductivity starts to increase again. This
leads to the elution of further proteins, which can be seen by an increase in the absorption
at 280 nm. The second peak appears at a conductivity of 55 mS/cm, which corresponds
to a salt concentration of 530 mM NaCl. 3 µL of fraction A2 (which corresponds to the
first peak) and 2 µL of fractions A9 – A12 (which correspond to the second peak) were
analyzed on a SDS-gel (Figure 27b). The analysis of the gel shows that the fusion protein
could be successfully separated from the individual components. Fractions corresponding
to the second peak contained the desired fusion proteins with a size of 57 kDa. Fractions
corresponding to the first peak contained the individual components with a size of 25 –
30 kDa and 70 – 85 kDa, but also a small amount of the fusion protein.
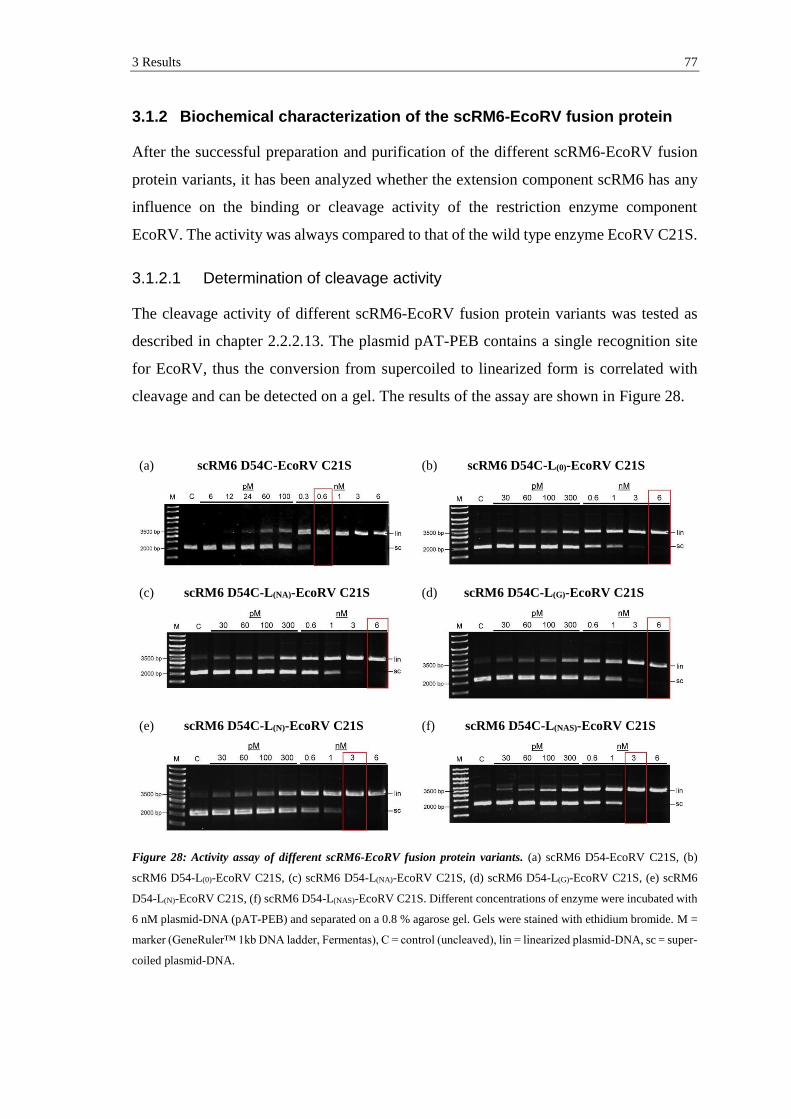
3 Results 77
3.1.2 Biochemical characterization of the scRM6-EcoRV fusion protein
After the successful preparation and purification of the different scRM6-EcoRV fusion
protein variants, it has been analyzed whether the extension component scRM6 has any
influence on the binding or cleavage activity of the restriction enzyme component
EcoRV. The activity was always compared to that of the wild type enzyme EcoRV C21S.
3.1.2.1 Determination of cleavage activity
The cleavage activity of different scRM6-EcoRV fusion protein variants was tested as
described in chapter 2.2.2.13. The plasmid pAT-PEB contains a single recognition site
for EcoRV, thus the conversion from supercoiled to linearized form is correlated with
cleavage and can be detected on a gel. The results of the assay are shown in Figure 28.
(a) scRM6 D54C-EcoRV C21S (b) scRM6 D54C-L(0)-EcoRV C21S
(c) scRM6 D54C-L(NA)-EcoRV C21S (d) scRM6 D54C-L(G)-EcoRV C21S
(e) scRM6 D54C-L(N)-EcoRV C21S (f) scRM6 D54C-L(NAS)-EcoRV C21S
Figure 28: Activity assay of different scRM6-EcoRV fusion protein variants. (a) scRM6 D54-EcoRV C21S, (b)
scRM6 D54-L(0)-EcoRV C21S, (c) scRM6 D54-L(NA)-EcoRV C21S, (d) scRM6 D54-L(G)-EcoRV C21S, (e) scRM6
D54-L(N)-EcoRV C21S, (f) scRM6 D54-L(NAS)-EcoRV C21S. Different concentrations of enzyme were incubated with
6 nM plasmid-DNA (pAT-PEB) and separated on a 0.8 % agarose gel. Gels were stained with ethidium bromide. M =
marker (GeneRuler™ 1kb DNA ladder, Fermentas), C = control (uncleaved), lin = linearized plasmid-DNA, sc = super-
coiled plasmid-DNA.

3 Results 78
It can be seen for all scRM6-EcoRV fusion protein variants that the higher the concentra-
tion of the enzyme the more linearized plasmid-DNA appears while the supercoiled plas-
mid-DNA disappears. The activity assay shows that full cleavage (indicated by the red
box) occurs at a concentration of 600 pM for the variant with the original 15 aa linker
(scRM6 D54-EcoRV C21S), at a concentration of 6 nM for the variants with the linker
L0, LG and LNA and at a concentration of 3 nM for the variants with the linker LN and
LNAS. In contrast, the wild type EcoRV C21S cleaved the plasmid-DNA already at a con-
centration of 100 pM completely (Figure 37c). This reveals that all scRM6-EcoRV fusion
protein variants have a reduced cleavage activity compared to the wild type EcoRV. The
cleavage activity of the variant with the original 15 aa linker is reduced by a factor of 6,
whereas the cleavage activity of the variants with the shorter linkers is reduced by a factor
of 60 (L0, LG and LNA) or 30 (LN and LNAS).
3.1.2.2 Determination of binding activity
The binding activity of wild type EcoRV C21S and different scRM6-EcoRV fusion pro-
tein variants was tested using fluorescence anisotropy as described in chapter 2.2.3.1. The
protein was titrated in the presence of 5 mM CaCl2 to a specific 16 bp oligonucleotide,
labeled at the 5‘-end with a HEX-fluorophore (1 nM for wild type EcoRV and 2 nM for
scRM6-EcoRV fusion protein variants). Representative binding curves are shown in Fig-
ure 29 for the wild type EcoRV C21S and the variants scRM6 D54-EcoRV C21S and
scRM6 D54-L(0)-EcoRV C21S. The dissociation constants (KD) of all variants are sum-
marized in Table 23.
Table 23: KD values for wild type EcoRV and different scRM6-EcoRV fusion protein variants.
Protein variant KD [nM]
EcoRV C21S 8 ± 1
scRM6 D54C-EcoRV C21S 78 ± 6
scRM6 D54C-L(0)-EcoRV C21S 37 ± 3
scRM6 D54C-L(NA)-EcoRV C21S 58 ± 4
scRM6 D54C-L(G)-EcoRV C21S 31 ± 3
scRM6 D54C-L(N)-EcoRV C21S 27 ± 3
scRM6 D54C-L(NAS)-EcoRV C21S 23 ± 2

3 Results 79
Figure 29: Representative binding curves for wild type EcoRV and different scRM6-EcoRV fusion protein variants.
(a) Wild type EcoRV C21S, (b) fusion protein scRM6 D54-EcoRV C21S and (c) fusion protein scRM6 D54-L(0)-
EcoRV C21S. Binding was tested with a 16 bp oligonucleotide containing a central specific recognition site for EcoRV
(1 nM or 2 nM). The anisotropy was measured for different protein concentrations. A simple bimolecular binding model
was fitted by non-linear regression to the data points. The results are the average of at least three independent experi-
ments.
The binding curves in Figure 29 show that with increasing protein concentration also the
anisotropy increases, indicative of binding of the protein to the DNA. The KD-values pre-
sented in Table 23 show that all scRM6-EcoRV fusion protein variants have a reduced
binding activity compared to the wild type EcoRV. The binding activity of the variant
with the original 15 aa linker (scRM6 D54-EcoRV C21S) is reduced by a factor of 10,
whereas the binding activity of the variants with the shorter linkers is reduced by a factor
of 3 (LNAS and LN), 4 (LG), 5 (L0) and 7 (LNA), respectively.

3 Results 80
3.1.2.3 Michaelis-Menten kinetics
Michaelis-Menten kinetics were performed with wild type EcoRV C21S and different
scRM6-EcoRV fusion protein variants as described in chapter 2.2.3.2. Each protein vari-
ant was incubated in the presence of 10 mM MgCl2 with different concentrations of a 5’-
HEX-labeled molecular beacon, containing a specific recognition site for EcoRV. Cleav-
age of the beacon was monitored via an increase in the fluorescence over time. Repre-
sentative Michaelis-Menten curves are shown in Figure 30 for wild type EcoRV C21S
and the variants scRM6 D54-EcoRV C21S and scRM6 D54-L(0)-EcoRV C21S. The
Michaelis-Menten constants (KM), the turnover numbers (kcat) and the catalytic efficien-
cies (kcat/KM) of all variants are summarized in Table 24.
Figure 30: Representative Michaelis-Menten curves for wild type EcoRV and different scRM6-EcoRV fusion pro-
tein variants. (a) Wild type EcoRV C21S, (b) fusion protein scRM6 D54-EcoRV C21S and (c) fusion protein scRM6
D54-L(0)-EcoRV C21S. The cleavage assay was performed with a 5’-HEX-labeled molecular beacon, containing a
specific recognition site for EcoRV (GATATC). The increase in fluorescence over time was monitored for different
substrate concentrations. The Michaelis-Menten equation was fitted by non-linear regression to the data points. The
results are the average of at least three independent experiments.

3 Results 81
Table 24: KM, kcat and kcat/KM values for wild type EcoRV and different scRM6-EcoRV fusion protein variants.
Protein variant KM [nM] kcat [s-1] kcat/KM [s-1µM-1]
EcoRV C21S 4 ± 1 0.218 ± 0.004 54.25
scRM6 D54C-EcoRV C21S 11 ± 2 0.046 ± 0.001 4.16
scRM6 D54C-L(0)-EcoRV C21S 160 ± 26 0.027 ± 0.002 0.17
scRM6 D54C-L(NA)-EcoRV C21S 116 ± 21 0.024 ± 0.002 0.20
scRM6 D54C-L(G)-EcoRV C21S 137 ± 19 0.022 ± 0.001 0.16
scRM6 D54C-L(N)-EcoRV C21S 78 ± 14 0.031 ± 0.002 0.40
scRM6 D54C-L(NAS)-EcoRV C21S 86 ± 13 0.039 ± 0.002 0.46
The Michaelis-Menten curves in Figure 30 show that with increasing substrate concen-
tration also the velocity of the cleavage reaction increases up to a characteristic maximum
velocity (vmax). The Michalis-Menten parameters presented in Table 24 show that all
scRM6-EcoRV fusion protein variants have a reduced cleavage activity compared to the
wild type EcoRV. The KM of the variant with the original 15 aa linker (scRM6 D54-
EcoRV C21S) is reduced by a factor of 3, whereas KM of the variants with the shorter
linkers was reduced by a factor between 20 (LN) and 40 (L0). Interestingly, the kcat is
reduced in a comparable manner for all fusion protein variants by a factor between 5
(scRM6 D54-EcoRV C21S) and 10 (LG). Whereas the kcat/KM value of the variant with
the original 15 aa linker is reduced by a factor of 13, the kcat/KM values of the variants
with the shorter linkers are reduced by a factor between 120 (LNAS) and 340 (LG).
3.1.3 Studying the spatial expansion via FRET
In order to resolve a rotational movement of the scRM6-EcoRV fusion protein in single-
molecule experiments, it is of fundamental importance that the extension component
scRM6 is stretched out as modeled in Figure 24. Only when the distance between the
DNA axis and the fluorophore is sufficiently large, the transverse position of the fluores-
cent spot can be distinguished in a rotational movement. Ideally this would mean that the
extension component scRM6 is positioned all perpendicular to the DNA axis. Because
scRM6 is directly fused to the N-terminal α-helix of EcoRV it can be assumed that the
spatial orientation of the N-terminal α-helix (Figure 31) determines the spatial orientation
of the extension component scRM6, if the fusion leads to a continuous elongated α-helix.

3 Results 82
A first analysis based on the co-crystal structure of EcoRV revealed that the N-terminal
α-helix is not maximally stretched out (or all perpendicular) but rather directed towards
the DNA molecule from a top view (Figure 31a) and rather oriented upwards from a side
view (Figure 31b).
Figure 31: Spatial orientation of the N-terminal α-helix of EcoRV. (a) Top view, (b) Side view. The two subunits of
the homodimeric restriction enzyme EcoRV are colored in red and grey, respectively (4RVE). The black dashed lines
indicate the position of the DNA and the black arrows indicate the position and direction of the N-terminal α-helices.
To determine the spatial orientation of the extension component scRM6 in more detail
and to find out whether it is stretched out sufficiently, a FRET analysis was performed as
described in 2.2.3.6. To this end, different scRM6-EcoRV fusion protein variants were
randomly double-labeled with donor and acceptor fluorophore at the single-cysteine po-
sition at the outside of scRM6 and the FRET efficiency was determined. The rational
design of the FRET measurements is illustrated in Figure 32. Ideally the extension com-
ponent is stretched out in a way that the distance between the donor and the acceptor
fluorophore is in the range of 20 nm. Since energy transfer from donor to acceptor fluor-
ophore can only take place if the distance is smaller than 10 nm, the expectation would
be that no FRET signal can be measured, if scRM6 is stretched out sufficiently (Figure
32, middle). As positive control, the FRET efficiency has also been measured for the
double-labeled single-cysteine variant EcoRV C21S N154C (Figure 32, left). Since the
distance between the two symmetry related cysteine residues in each subunit of the ho-
modimeric protein is smaller than 10 nm, a FRET signal should be measurable. As nega-
tive control, the FRET efficiency has also been measured for a 97 bp long DNA substrate,
double-labeled at each terminal end with a donor and an acceptor fluorophore, respec-
tively (Figure 32, right). Since the distance between the two terminal ends is larger than
10 nm, a FRET signal should not be measurable.

3 Results 83
Figure 32: Rational design of FRET measurements to study the spatial expansion of the fusion protein scRM6-
EcoRV. Different protein variants and a DNA substrate were double-labeled with a donor (green sphere) and an accep-
tor (red sphere) fluorophore, respectively and the FRET efficiency was determined. Left: single-cysteine variant EcoRV
C21S N154. The distance of donor and acceptor is < 10 nm and a FRET signal should be measurable. Right: DNA
substrate. The distance of donor and acceptor is > 10 nm and a FRET signal should not be measurable. Middle: scRM6-
EcoRV fusion protein variant. The optimal orientation of the extension component scRM6 is indicated in dark grey,
other possible orientations are indicated in light grey. Dependent on the spatial orientation, a FRET signal can be
measured or not.
The spatial expansion of the 97 bp DNA substrate, EcoRV C21S N154C and different
scRM6-EcoRV fusion protein variants was analyzed by diluting the double-labeled pro-
tein or DNA in buffer containing 5 mM CaCl2 to result in a final concentration of 50 nM
(protein) or 25 nM (DNA). After excitation at 470 nm the emission spectrum was rec-
orded, normalized to the maximum donor fluorescence and the FRET efficiency was cal-
culated by dividing the fluorescence intensity of the acceptor at 664 nm by the fluores-
cence intensity of the donor at 520 nm. In a control experiment, either a 16 bp or 60 bp
oligonucleotide was added to the double-labeled protein in the cuvette and the measure-
ment was repeated. In a further control experiment, proteins labeled with only donor or
acceptor fluorophore were mixed to result a final concentration of 50 nM and the meas-
urement was repeated. Representative emission spectra of the 97 bp DNA substrate (neg-
ative control), EcoRV C21S N154C (positive control) and the fusion protein variant
scRM6 D54C–L(NA)–EcoRV C21S are shown in Figure 33, the corresponding FRET ef-
ficiency values of all protein variants are summarized in Table 25.

3 Results 84
Figure 33: Emission spectra of double-labeled proteins or DNA molecules. (a) Emission spectrum of the double-
labeled 97 bp DNA substrate (b) Emission spectrum of double-labeled EcoRV C21S N154C (c) Emission spectrum of
double-labeled fusion protein variant scRM6 D54C–L(NA)–EcoRV C21S. Spectra were normalized to the maximum of
donor fluorescence at 520 nm.
The emission spectrum of the double-labeled 97 bp DNA substrate shows only one peak
at 520 nm (Figure 33a) whereas the emission spectrum of the double-labeled protein var-
iant EcoRV C21S N154C shows two peaks at 520 nm and 664 nm (Figure 33b) with a
corresponding FRET efficiency of 0.23 ± 0.01 (Table 25). Surprisingly, also the double-
labeled fusion protein variant scRM6 D54C-L(NA)-EcoRV C21S (Figure 33c) as well as
all other fusion protein variants show an emission spectrum with two peaks at 520 nm
and 664 nm. The FRET efficiency values range from 0.17 ± 0.01 for the variant scRM6
D54C-L(NA)-EcoRV C21S to 0.28 ± 0.01 for the variant scRM6 D54C-L(0)-EcoRV C21S
(Table 25). The addition of a 16 bp or 60 bp oligonucleotide to the double-labeled protein
results in the same FRET efficiency as for the double-labeled protein alone (0.20 ± 0.01).
The mixture of donor and acceptor only labeled proteins instead results in a FRET effi-
ciency of 0.03 which is lower than that of the double-labeled protein (Table 25).

3 Results 85
Table 25: FRET efficiencies (E) of different double-labeled protein variants.
Protein variant FRET efficiency (E)
97 bp DNA substrate 0.01
EcoRV C21S N154C 0.23 ± 0.01
scRM6 D54C-EcoRV C21S
+ 16 bp oligonucleotide
+ 60 bp oligonucleotide
Single labeled protein mix
0.20 ± 0.01
0.20 ± 0.01
0.20 ± 0.01
0.03
scRM6 D54C-L(0)-EcoRV C21S 0.28 ± 0.01
scRM6 D54C-L(G)-EcoRV C21S 0.22 ± 0.01
scRM6 D54C-L(N)-EcoRV C21S 0.24 ± 0.01
scRM6 D54C-L(NA)-EcoRV C21S 0.17 ± 0.01
scRM6 D54C-L(NAS)-EcoRV C21S 0.21 ± 0.01
3.1.4 Single-molecule experiments
To determine the one-dimensional diffusion coefficient (D1) of the fusion protein scRM6
D54C-EcoRV C21S and to verify a rotational movement by comparing D1 with theoreti-
cal models, single-molecule experiments were performed as described in 2.2.3.7. The de-
termination of D1 for the fusion protein was part of a study performed by Dikic et al. [90]
which can be considered as an extension of a study performed by Bonnet et al. [77].
In the latter study, D1 was determined for EcoRV coupled to different fluorescent labels
of varying size. The fluorescent label was either a small organic fluorophore (Cy3B with
r = 0.5 nm) or a small streptavidin organic fluorophore conjugate (savCy3B with r = 2.1
nm) or a large quantum dot (QD655 with r = 15.4 nm). All fluorescent labels were at-
tached to the protein via a flexible polyethylene glycol linker. In the study performed by
Dikic et al. [90] two further quantum dots of varying size coupled to EcoRV via a flexible
linker (QD605 with r = 10.0 nm via a polyethylene glycol linker and QDEO6 with r = 7.2
nm via the N-terminal polyhistidine tag) and the fusion protein scRM6 D54C-EcoRV
C21S were investigated. The special feature of the fusion protein is that it represents a
conjugation strategy in which the fluorescent label (Cy3B) is coupled to EcoRV via a
rigid linker (scRM6). For two reasons scRM6 can be considered as a rigid linker.

3 Results 86
On the one hand, scRM6 is a homotetramer with a heptad sequence periodicity and forms
a stable coiled-coil structure [91], on the other hand scRM6 was directly fused via its C-
terminal α-helix to the N-terminal α-helix of EcoRV, thereby forming an extended α-
helix. The scRM6-EcoRV fusion protein can therefore be modeled as EcoRV (with r =
3.9 nm) with two spherical labels (scRM6-Cy3B with r = 3.1 nm) rigidly attached to the
enzyme.
Based on the different conjugation strategies (flexible or rigid linker) and based on the
different types of motion (linear diffusion or rotation-coupled diffusion), 5 theoretical
models have been established:
(1) linear diffusion, rigid linker
(2) rotation-coupled diffusion, rigid linker (one label)
(3) linear diffusion, flexible linker
(4) rotation-coupled diffusion, flexible linker
(5) rotation-coupled diffusion, rigid linker (two labels)
To elucidate the type of motion of scRM6 D54C-EcoRV C21S, D1 was determined in a
first step (see Figure 34a). Subsequently, the friction coefficient (ξ) was derived from D1
using the Stokes-Einstein relation, normalized to that obtained with EcoRV-Cy3B (con-
sidered as unlabeled) and plotted against the radius of the label (see Figure 34b). Finally,
the experimental results were compared to the theoretical models.

3 Results 87
Figure 34: Results of single-molecule experiments. (a) Mean-squared displacement (MSD) of the fusion protein
scRM6 D54C-EcoRV C21S. Upper: Longitudinal mean-squared displacement (MSDx). The one-dimensional diffu-
sion coefficient (D1) is derived from the slope of the curve using the relation slope = 2D. The dashed line indicates the
linear fit of the first five data points. Lower: Transversal mean-squared displacement (MSDy). (b) Dependence of the
normalized friction coefficient on the label radius. Experimental data are indicated in red. Theoretical data of five
different models are indicated by the green or black dashed lines (note that model 5 is the same as model 2 with two
labels). EcoRV is represented in magenta, the DNA in green and the label in orange. (Figures adopted from [90]).
The one-dimensional diffusion coefficient of scRM6 D54C-EcoRV C21S, derived from
the longitudinal MSD (Figure 34a), was found to be D1 = 0.0024 µm2s-1, which is 4-times
slower than the one-dimensional diffusion coefficient found for EcoRV labeled with
Cy3B (D1 = 0.01 µm2s-1) [67]. The normalized friction coefficient showed a significant
dependence on the label radius. The experimental data for EcoRV coupled to a fluorescent
label via a rigid linker (scRM6-Cy3B) are in agreement with model (5), demonstrating
that the diffusion of scRM6 D54C-EcoRV C21S is coupled to rotation (Figure 34b).

3 Results 88
3.2 Comparison of structurally different restriction enzymes
Proteins that have to locate their specific recognition site within a high excess of non-
specific DNA depend on particular mechanisms to find their target site fast enough to
fulfil their biological function. It could be shown in single-molecule experiments [67] that
restriction enzymes stay in close contact with the DNA while searching for their recogni-
tion site, thereby complementing the 3D-search by a 1D-search (sliding). It would be
interesting to know whether the mechanism of sliding is supported by the structure of a
restriction enzyme and whether one can derive from the structure of a restriction enzyme
to what extent it can slide along the DNA.
Figure 35: Co-Crystal structures of structurally different type IIP restriction enzymes in complex with specific DNA.
(a) PvuII (1PVI), (b) EcoRV (4RVE) and (c) BsoBI (1DC1).
To this end, the structurally different type IIP restriction enzymes PvuII, EcoRV and
BsoBI were compared regarding their conformation of the apoenzyme and in complex
with specific and non-specific DNA as well as in their ability to make use of linear diffu-
sion to speed up target site location. As it can be seen in Figure 35 that PvuII forms a
more open complex with DNA [35] whereas the complexes of EcoRV [30] and BsoBI
[36] are partially or fully closed, respectively.
3.2.1 Preparation of single-cysteine variants
In order to study the conformation of the structurally different restriction enzymes alone
or in complex with non-specific or specific DNA by FRET measurements, the restriction
enzymes PvuII, EcoRV and BsoBI had to be labeled specifically with fluorophores
(2.2.3.4). For this purpose a single-cysteine residue had to be introduced into the protein
at a defined position. The position was chosen according to the following criteria:

3 Results 89
i) no interference with the catalytic center of the restriction enzyme, ii) located at the
surface to be accessible, iii) optimal distance for FRET measurements (close to the Förster
radius (R0) of the selected FRET-pair, see 2.2.3.6) and iv) located at a region that is sup-
posed to move upon DNA binding (e.g. close to the DNA-binding domain). The selected
positions for each restriction enzyme are shown in Figure 36.
Figure 36: Positions of the single-cysteine substitutions, represented in the co-crystal structure. (a) PvuII D125C,
(b) EcoRV D214C and (c) BsoBI A153C. The amino acid residues, which were mutated to cysteine residues are indi-
cated in blue. The proteins were double labeled at the newly introduced cysteine residue with a donor (green sphere)
and an acceptor (red sphere) fluorophore.
The plasmid containing the gene coding for the cysteine-free variant of EcoRV and PvuII
respectively, was used as a template and site-directed mutagenesis was conducted as de-
scribed in 2.2.2.6. The aspartic acid residue at position 125 in the PvuII restriction enzyme
and the aspartic acid residue at position 214 in the EcoRV restriction enzyme were ex-
changed for cysteine residues and the success of the substitution was confirmed by se-
quencing. The single cysteine variant A153C of the BsoBI restriction enzyme had been
prepared by Jasmina Dikic [105].
3.2.1.1 Determination of binding and cleavage activity
To test whether the binding and cleavage activity is impaired by the substitution, the ac-
tivity of the enzyme variants was compared to that of the wild type enzyme. The cleavage
activity was tested as described in 2.2.2.13. The plasmid pAT-PEB contains a single
recognition site for PvuII and EcoRV, thereby the conversion from supercoiled to linear-
ized plasmid is correlated with cleavage and can be detected on a gel. The results of the
activity assay are shown in Figure 37.
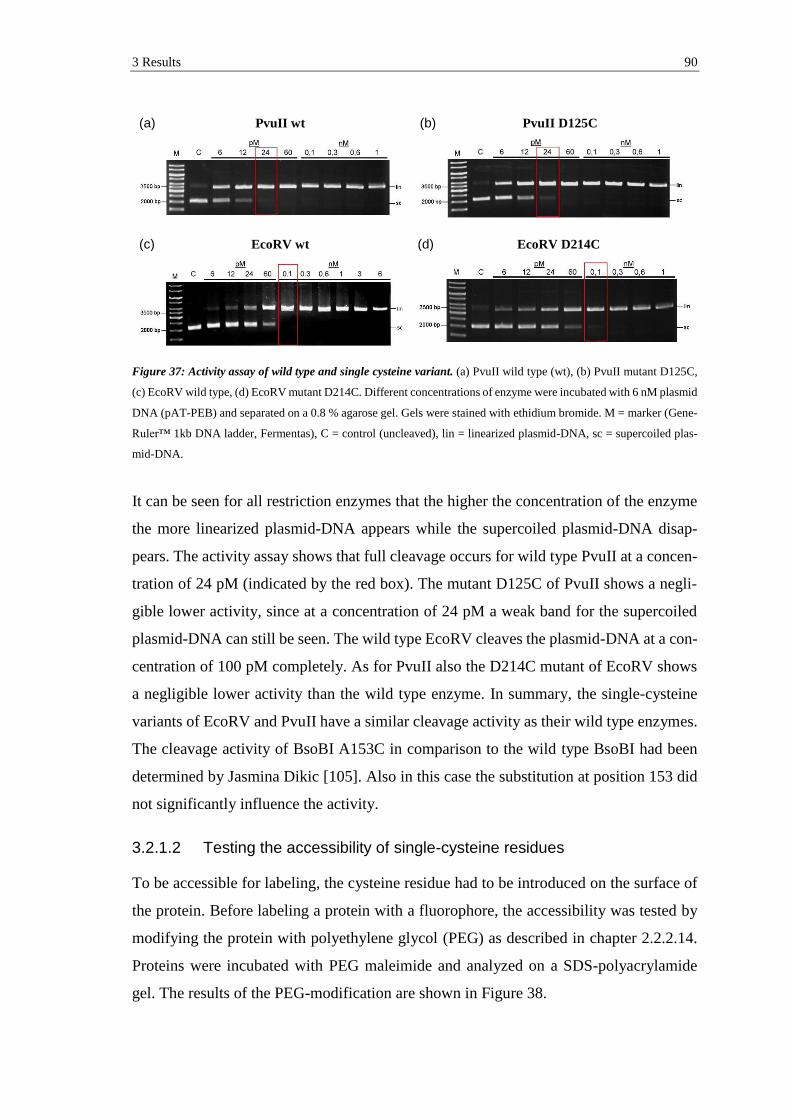
3 Results 90
(a) PvuII wt (b) PvuII D125C
(c) EcoRV wt (d) EcoRV D214C
Figure 37: Activity assay of wild type and single cysteine variant. (a) PvuII wild type (wt), (b) PvuII mutant D125C,
(c) EcoRV wild type, (d) EcoRV mutant D214C. Different concentrations of enzyme were incubated with 6 nM plasmid
DNA (pAT-PEB) and separated on a 0.8 % agarose gel. Gels were stained with ethidium bromide. M = marker (Gene-
Ruler™ 1kb DNA ladder, Fermentas), C = control (uncleaved), lin = linearized plasmid-DNA, sc = supercoiled plas-
mid-DNA.
It can be seen for all restriction enzymes that the higher the concentration of the enzyme
the more linearized plasmid-DNA appears while the supercoiled plasmid-DNA disap-
pears. The activity assay shows that full cleavage occurs for wild type PvuII at a concen-
tration of 24 pM (indicated by the red box). The mutant D125C of PvuII shows a negli-
gible lower activity, since at a concentration of 24 pM a weak band for the supercoiled
plasmid-DNA can still be seen. The wild type EcoRV cleaves the plasmid-DNA at a con-
centration of 100 pM completely. As for PvuII also the D214C mutant of EcoRV shows
a negligible lower activity than the wild type enzyme. In summary, the single-cysteine
variants of EcoRV and PvuII have a similar cleavage activity as their wild type enzymes.
The cleavage activity of BsoBI A153C in comparison to the wild type BsoBI had been
determined by Jasmina Dikic [105]. Also in this case the substitution at position 153 did
not significantly influence the activity.
3.2.1.2 Testing the accessibility of single-cysteine residues
To be accessible for labeling, the cysteine residue had to be introduced on the surface of
the protein. Before labeling a protein with a fluorophore, the accessibility was tested by
modifying the protein with polyethylene glycol (PEG) as described in chapter 2.2.2.14.
Proteins were incubated with PEG maleimide and analyzed on a SDS-polyacrylamide
gel. The results of the PEG-modification are shown in Figure 38.

3 Results 91
PvuII D125C EcoRV D214C
Figure 38: PEG-modification of PvuII D125C and EcoRV D214C. Single-cysteine variants were incubated with a
10-fold molar excess of PEG-maleimide and analyzed on a 15 % (PvuII) or 12 % (EcoRV) SDS-polyacrylamide gel.
Gels were stained with Coomassie Brilliant Blue. M = marker (PageRulerTM Protein Ladder, Fermentas), C = control
(unmodified), PEG = Polyethylene glycol. The blue half-moon represents one subunit of the protein, the black zigzag
chain represents one polyethylene glycol molecule.
Figure 38, left shows the results for PvuII D125C. A single band below 20 kDa can be
seen in the second lane which corresponds to one subunit of PvuII D125C which has a
size of 18 kDa. The third and the fourth lane show an additional band between 25 and 30
kDa, whereas the intensity of the 18 kDa band decreases. The additional band corresponds
to one subunit of PvuII modified with PEG. This band is shifted due to a higher mass and
hydrodynamic radius of the protein. More proteins are modified after 1 h (≈ 91 %) com-
pared to after 1 min (≈ 73 %).
Figure 38, right shows the results for EcoRV D214C. A single band below 30 kDa can be
seen in the second lane which corresponds to one subunit of EcoRV D214C which has a
size of 29 kDa. The third and the fourth lane show an additional band below 40 kDa,
whereas the intensity of the 29 kDa band decreases. The additional band corresponds to
one subunit of EcoRV modified with PEG. Slightly more proteins are modified after 1 h
(≈ 85 %) compared to after 1 min (≈ 80 %).
3.2.1.3 Site-specific labeling of single-cysteine variants
To study the conformation (at the entrance to the DNA-binding site) of different type IIP
restriction enzymes in the absence and presence of specific and non-specific DNA (3.2.2),
enzymes had to be labeled with a donor (Cy3) and an acceptor (Cy5) fluorophore at the
single-cysteine residue (in both – identical – subunits of the homodimeric protein). La-
beling was performed randomly by incubating the protein first with donor and then with
acceptor as described in 2.2.3.4.

3 Results 92
The acceptor was added in molar excess in order to minimize the amount of proteins
labeled with donor fluorophore only (in both subunits). The free fluorophore was re-
moved and the degree of labeling (DOL) was calculated as described in 2.2.3.5. The cal-
culated labeling degree of the double-labeled variants EcoRV D214C, PvuII D125C and
BsoBI A153 is shown in Table 26.
Table 26: Labeling degree for different double labeled protein variants
Protein
monomer
conc.
Donor
conc.
Acceptor
conc.
DOL
donor /
acceptor
DOL
ratio
DOL
total
PvuII D125C 15,0 µM 3,1 µM 8,9 µM 21 % / 59 % 2.8 80 %
EcoRV D214C 22,6 µM 5,9 µM 9,5 µM 26 % / 42 % 1.6 68 %
BsoBI A153C 11,9 µM 1,5 µM 5,2 µM 13 % / 44 % 3.4 57 %
Each protein monomer carries one cysteine residue. It can be seen that none of the pro-
teins is completely labeled. The total labeling degree (DOL total) per subunit varies from
57 % for BsoBI, over 68 % for EcoRV to 80 % for PvuII. The amount of protein-bound
acceptor fluorophore is always higher than the amount of donor fluorophore. The ratio
between the donor and the acceptor fluorophore varies between 1.6 and 3.4. The purity
of the labeled proteins and the success of the labeling reaction was confirmed by SDS-
PAGE. A representative gel is shown in Figure 39 for EcoRV D214C.
Figure 39: SDS-PAGE of single and double labeled EcoRV D214C. Left: Proteins stained with Coomassie Brilliant
Blue. Right: Merged fluorescent image visualized with the VersaDocTM Imaging System (Bio-Rad). EcoRV D214C
was either single labeled with Cy3 or Cy5 or double labeled with Cy3/Cy5. M = Marker (PageRulerTM Protein Ladder,
Fermentas).

3 Results 93
The gel shows that labeling was successful for EcoRV D214C (similar results were ob-
tained for PvuII and BsoBI). The green band corresponds to the protein single-labeled
with Cy3, the red band corresponds to the protein single-labeled with Cy5 and the yel-
lowish band (merged from green and red) corresponds to the protein double-labeled with
Cy3 and Cy5. To test whether the binding and cleavage activity is impaired by the attach-
ment of the fluorophores, the activity of the enzyme variants was compared to that of the
wild type enzyme in the same way as it has been described in 3.2.1.1. Also the labeled
protein variants showed a comparable activity to their wild-type enzymes.
3.2.2 Studying the conformation of structurally different restriction
enzymes
In order to find out which conformation the restriction enzymes EcoRV, PvuII and BsoBI
adopt while sliding along the DNA, FRET measurements were performed (2.2.3.6). Re-
striction endonucleases first bind non-specifically and move along the DNA molecule
before they bind specifically to their recognition site. Accordingly, the conformation the
enzyme adopts while bound to non-specific DNA is presumably the conformation it uses
for sliding [29]. Only for the restriction enzyme EcoRV all relevant crystal structures are
available: the apoenzyme, the complex with specific and the complex with non-specific
DNA [30] (see Figure 3). By comparing the crystal structures of the specific and non-
specific complex one can realize that the DNA-binding cleft of EcoRV in complex with
specific DNA is more closed than in complex with non-specific DNA, similarly as it has
been reported for BamHI [29]. This can also be derived by measuring the distance be-
tween the positions in which cysteine residues in each subunit of the homodimeric protein
had been introduced (see Table 27). The distance of the symmetry-related residues in
EcoRV at position 214 is smaller in complex with specific DNA than in complex with
non-specific DNA (48 Å vs. 57 Å).
Table 27: PDB codes of available crystal structures and distances* of single-cysteine residues.
Apoenzyme Non-specific complex Specific complex
EcoRV 1RVE (47 Å) 2RVE (57 Å) 4RVE (48 Å)
PvuII 1PVU (67 Å) - 1PVI (48 Å)
BsoBI - - 1DC1 (70 Å)
*Distances are indicated in green and were measured from the SH-group of the cysteine residues at position
125 (PvuII), 214 (EcoRV) and 153 (BsoBI) in each subunit of the homodimer using the program PyMOL.

3 Results 94
For PvuII only the crystal structures of the apoenzyme and the complex with specific
DNA (see Figure 4) and for BsoBI only the crystal structure of the complex with specific
DNA are available (see Figure 5). The structure of interest, i.e. the structure of the non-
specific complex is missing for both enzymes. For this reason, a comparison between the
specific and the non-specific complex on the basis of a distance measurement in the crys-
tal structures, as described above for EcoRV, is not possible. In order to predict the con-
formation of the enzyme in the non-specific complex, the extent of DNA-binding cleft
opening was studied using FRET. To this end a single cysteine residue was introduced
into a region close to the DNA-binding domain. Proteins were double-labeled at the de-
fined position with donor and acceptor fluorophore and the FRET efficiency was deter-
mined for the apoenzyme, the complex with non-specific and the complex with specific
DNA (see 2.2.3.6). The rational design of FRET measurements is shown in Figure 40.
Figure 40: Rational design of FRET measurements to analyze the conformation of a restriction enzyme. (a) The
restriction enzyme adopts a closed conformation, thereby donor (green sphere) and acceptor (red sphere) are close
together and the FRET efficiency (E) is high. (b) The restriction enzyme adopts an open conformation, thereby donor
and acceptor are more separated and the FRET efficiency (E) is low.
The conformation of EcoRV D214C, PvuII D125C and BsoBI A153C was analyzed in
steady-state ensemble measurements by mixing double labeled enzyme with either spe-
cific or non-specific unlabeled DNA (see Table 14). Experiments were performed in the
presence of either Ca2+- or Mg2+-ions or in the presence of EDTA.
Firstly, double labeled EcoRV D214C was diluted in buffer containing either 5 mM
CaCl2, 10 mM MgCl2 or 1 mM EDTA to result in a final protein concentration of 50 nM.
After excitation at 546 nm the emission spectrum was recorded (emission spectrum of the
apoenzyme). Then a 20-fold molar excess of either a specific or a non-specific 16 bp
oligonucleotide was added to the cuvette and the measurement was repeated.

3 Results 95
As reference, the emission spectrum of donor only labeled EcoRV D214C was recorded.
Emission spectra were normalized to the maximum donor fluorescence and the FRET
efficiency was calculated by dividing the fluorescence intensity of the acceptor at 666 nm
(A) by the fluorescence intensity of the donor at 546 nm (D).
Figure 41: Emission spectra of double-labeled EcoRV D214C. (a) Conformational changes in the presence of CaCl2
(b) Conformational changes in the presence of MgCl2 (c) Conformational changes in the presence of EDTA. Donor
only labeled enzyme (grey line), double-labeled apoenzyme (black line), double-labeled specific complex (green line),
double-labeled non-specific complex (orange line). Spectra were normalized to the maximum of donor fluorescence.
The emission spectra show that in the presence of Ca2+-ions the addition of the specific
DNA causes an increase in the acceptor signal, which reflects a movement of the two
fluorophores towards each other (Figure 41a). In contrast, the addition of the non-specific
DNA causes a decrease in the acceptor signal, which reflects a movement of the two
fluorophores away from each other. This shows that the conformation of EcoRV bound
to specific DNA is more closed compared to that of the apoenzyme and that the confor-
mation of EcoRV bound to non-specific DNA is more open than that of the apoenzyme
and that of EcoRV bound to specific DNA.

3 Results 96
In the presence of Mg2+-ions the addition of the specific DNA causes only a slight in-
crease in the acceptor signal (Figure 41b). Because most of the DNA is cleaved in the
presence of Mg2+-ions, only the free enzyme can be detected. The addition of the non-
specific DNA in the presence of Mg2+-ions causes a slight decrease in the acceptor signal.
In the presence of EDTA the addition of either specific or non-specific DNA causes only
a slight increase and decrease in the acceptor signal, respectively (Figure 41c).
Table 28: FRET efficiencies (E) of double-labeled EcoRV D214.
Figure 42: FRET efficiencies (E) of double-labeled EcoRV D214. Double-labeled apoenzyme (black bar), addition
of specific 16 bp oligonucleotide (green bar), addition of nonspecific 16 bp oligonucleotide (orange bar). The FRET
efficiency (A/D) was calculated by dividing the maximum fluorescence of the acceptor signal at 666 nm (A) by the
maximum fluorescence of the donor signal at 564 nm (D). The error bars refer to two (specific, non-specific complex)
and four (apoenzyme) independent experiments.
The calculated FRET efficiencies are summarized in Table 28 and Figure 42. It can be
seen that the complex with specific DNA has always a higher FRET efficiency than the
complex with non-specific DNA, which means that the specific complex is more closed
than the non-specific complex.
Metal ion Protein status FRET efficiency (E)
Ca2+
Apoenzyme
Non-specific complex
Specific complex
0.37 ± 0.02
0.32 ± 0.00
0.46 ± 0.00
Mg2+
Apoenzyme
Non-specific complex
Specific complex
0.31 ± 0.01
0.29 ± 0.01
0.33 ± 0.01
EDTA
Apoenzyme
Non-specific complex
Specific complex
0.30 ± 0.00
0.28 ± 0.00
0.33 ± 0.01

3 Results 97
This effect is most prominent in the presence of Ca2+-ions (0.46 vs. 0.32). The FRET
efficiency of the apoenzyme is always between that of the complex with specific and non-
specific DNA. It can also be seen that the presence of different divalent metal ions has an
influence on the conformation of the apoenzyme. In the presence of Ca2+-ions the FRET
efficiency of the apoenzyme is higher than in the presence of Mg2+-ions or EDTA (0.37
vs. 0.31 and 0.30), thus the apoenzyme shows a more closed conformation in the presence
of Ca2+-ions.
Secondly, double-labeled PvuII D125C was diluted in buffer containing either 5 mM
CaCl2, 10 mM MgCl2 or 1 mM EDTA to result in a final protein concentration of 50 nM.
After excitation at 546 nm the emission spectrum was recorded. Then a 100-fold excess
of either the specific or non-specific 16 bp oligonucleotide was added to the cuvette and
the measurement was repeated. As reference, the emission spectrum of donor only labeled
PvuII D125C was recorded.
Figure 43: Emission spectra of double-labeled PvuII D125C. For details see legend to Figure 41.

3 Results 98
The emission spectra show that in the presence of Ca2+-ions the addition of the specific
and the non-specific DNA causes an increase in the acceptor signal, which reflects a
movement of the two fluorophores towards each other (Figure 43a). This effect is more
pronounced in the presence of specific DNA. It shows that the conformation of PvuII
bound to non-specific DNA is more closed compared to that of the apoenzyme and that
the conformation of PvuII bound to specific DNA is again more closed than that of the
apoenzyme and that of the non-specific complex. In the presence of Mg2+-ions the addi-
tion of the specific DNA causes only a slight increase in the acceptor signal (Figure 43b).
The addition of the non-specific DNA in the presence of Mg2+-ions induce no change in
the acceptor signal. In the presence of EDTA the addition of specific and non-specific
DNA causes only a slight increase or no change in the acceptor signal (Figure 43c).
Table 29: FRET efficiencies (E) of double-labeled PvuII D125C.
Figure 44: FRET efficiencies (E) of double-labeled PvuII D125C. Double-labeled apoenzyme (black bar), addition
of specific 16 bp oligonucleotide (green bar), addition of nonspecific 16 bp oligonucleotide (orange bar). The FRET
efficiency (A/D) was calculated by dividing the maximum fluorescence of the acceptor signal at 666 nm (A) by the
maximum fluorescence of the donor signal at 564 nm (D). The error bars refer to two (specific, non-specific complex)
and four (apoenzyme) independent experiments.
Metal ion Protein status FRET efficiency (E)
Ca2+
Apoenzyme
Non-specific complex
Specific complex
0.61 ± 0.01
0.74 ± 0.01
1.12 ± 0.01
Mg2+
Apoenzyme
Non-specific complex
Specific complex
0.57 ± 0.01
0.56 ± 0.01
0.60 ± 0.01
EDTA
Apoenzyme
Non-specific complex
Specific complex
0.60 ± 0.02
0.60 ± 0.00
0.65 ± 0.01

3 Results 99
The calculated FRET efficiencies are summarized in Table 29 and Figure 44. It can be
seen that the complex with specific DNA has always a higher FRET efficiency than the
complex with non-specific DNA, which means that the specific complex is more closed
than the non-specific complex. This effect is most prominent in the presence of Ca2+-ions
(1.12 vs. 0.74). The FRET efficiency of the apoenzyme is always smaller than that of the
complex with specific DNA and smaller or identical with that of the complex with non-
specific DNA. It can also be seen that the presence of different divalent metal ions has no
influence on the conformation of the apoenzyme, because the FRET efficiency is nearly
identical under all conditions (0.61, 0.57 and 0.60).
Thirdly, double labeled BsoBI A153C was diluted in buffer containing either 5 mM
CaCl2, 10 mM MgCl2 or 1 mM EDTA to result in a final protein concentration of 50 nM.
After excitation at 546 nm the emission spectrum was recorded. Then a 20-fold excess of
either the specific or non-specific 16 bp oligonucleotide was added to the cuvette and the
measurement was repeated. As reference, the emission spectrum of donor only labeled
BsoBI A153C was recorded.
Figure 45: Emission spectra of double labeled BsoBI A153C. For details see legend to Figure 41.

3 Results 100
The emission spectra show that in the presence of Ca2+-ions the addition of the specific
DNA causes a decrease in the acceptor signal, which reflects a movement of the two
fluorophores away from each other (Figure 45a). In contrast, the addition of the non-
specific DNA does not induce a change in the acceptor signal. This implies that the con-
formation of BsoBI bound to specific DNA is apparently more open compared to that of
the apoenzyme and that the conformation of BsoBI bound to non-specific DNA is iden-
tical to that of the apoenzyme. In the presence of Mg2+-ions the addition of the specific
and the non-specific DNA causes only a slight decrease in the acceptor signal, respec-
tively (Figure 45b). The same could be observed in the presence of EDTA (Figure 45c).
Table 30: FRET efficiencies (E) of double-labeled BsoBI A153C.
Figure 46: FRET efficiencies (E) of double-labeled BsoBI A153C. Double labeled apoenzyme (black bar), addition
of specific 16 bp oligonucleotide (green bar), addition of nonspecific 16 bp oligonucleotide (orange bar). The FRET
efficiency (A/D) was calculated by dividing the maximum fluorescence of the acceptor signal at 666 nm (A) by the
maximum fluorescence of the donor signal at 564 nm (D). The error bars refer to three (specific, nonspecific complex)
and six (apoenzyme) independent experiments.
Metal ion Protein status FRET efficiency (E)
Ca2+
Apoenzyme
Non-specific complex
Specific complex
1.10 ± 0.06
1.10 ± 0.07
0.82 ± 0.01
Mg2+
Apoenzyme
Non-specific complex
Specific complex
0.82 ± 0.07
0.79 ± 0.06
0.76 ± 0.06
EDTA
Apoenzyme
Non-specific complex
Specific complex
0.80 ± 0.07
0.78 ± 0.06
0.77 ± 0.03

3 Results 101
The calculated FRET efficiencies are summarized in Table 30 and Figure 46. It can be
seen that the complex with specific DNA has always a lower FRET efficiency than the
complex with non-specific DNA, which means that the specific complex is apparently
more open than the non-specific complex (see discussion). This effect is most prominent
in the presence of Ca2+-ions (0.82 vs. 1.10). The FRET efficiency of the apoenzyme is
identical or slightly higher than that of the complex with non-specific DNA and higher
than that of the complex with specific DNA. It can also be seen that the presence of dif-
ferent divalent metal ions has an influence on the conformation of the apoenzyme. In the
presence of Ca2+-ions, the FRET efficiency of the apoenzyme is higher than in the pres-
ence of Mg2+-ions or EDTA (1.10 vs. 0.82 and 0.80), thus the apoenzyme shows a more
closed conformation in the presence of Ca2+ ions.
Because the addition of the specific and non-specific DNA in the presence of Mg2+-ions
and EDTA did not lead to a pronounced change in the acceptor signal, the binding affinity
to these substrates was investigated. The aim was to ensure that the amount of DNA sub-
strate used in the FRET experiments led to binding and that the absence of a change in
the acceptor signal was not due to non-binding. The DNA-binding activity of PvuII
D125C, EcoRV D214C and BsoBI A153 was tested using fluorescence anisotropy meas-
urements as described in chapter 2.2.3.1. The protein was titrated with either a specific or
a non-specific 16 bp oligonucleotide, labeled at the 5‘-end with the HEX-fluorophore (2
nM). The sequence of these oligonucleotides has been identical to that of the unlabeled
oligonucleotides added in the FRET experiments. The binding was tested in the presence
of different divalent metal ions (5 mM CaCl2 or 10 mM MgCl2) and in the presence of
EDTA. Whereas Ca2+-ions support specific binding but no cleavage, Mg2+-ions support
specific binding and cleavage of the DNA substrate. Thus, the combination of specific
oligonucleotide and Mg2+-ions was not investigated. Representative binding curves are
shown in Figure 47 for PvuII D125C, EcoRV D214C and BsoBI A153C in the presence
of non-specific DNA and buffer containing 10 mM MgCl2. The dissociation constants
(KD) are summarized in Table 31 for different substrates and different divalent metal ions.

3 Results 102
Table 31: KD values for PvuII D125C, EcoRV D214C and BsoBI A153C.
Sequence Metal ion KD
PvuII
D125C
5‘-GTCCGCAGCTGACCTA-3'
(specific)
Ca2+
EDTA
54 ± 7 nM
492 ± 49 nM
5‘-GTCCGGTCGACACCTA-3'
(nonspecific)
Ca2+
EDTA
Mg2+
169 ± 9 nM
605 ± 13 nM
2.0 ± 0.1 µM
EcoRV
D214C
5‘-CAGACGATATCCGTAC-3'
(specific)
Ca2+
EDTA
21 ± 4 nM
32 ± 3 nM
5’-CAGACCTATAGCGTAC-3’
(nonspecific)
Ca2+
EDTA
Mg2+
17 ± 4 nM
30 ± 6 nM
69 ± 8 nM
BsoBI
A153C
5‘-CGTTGCTCGAGACATC-3'
(specific)
Ca2+
EDTA
52 ± 5 nM
99 ± 6 nM
5’- CGTTGGAGCTCACATC -3’
(nonspecific)
Ca2+
EDTA
Mg2+
62 ± 2 nM
146 ± 7 nM
374 ± 42 nM
Figure 47: Determination of binding affinity to non-specific DNA in the presence of Mg2+-ions. (a) EcoRV D214C,
(b) PvuII D125C and (c) BsoBI A153C. The anisotropy was measured for different protein concentrations. A simple
bimolecular binding model was fitted by non-linear regression to the data points. The results are the average of at least
three independent experiments.

3 Results 103
The binding curves in Figure 47 show that with increasing protein concentrations also the
anisotropy increases, indicative of binding of the protein to the DNA. The KD-values pre-
sented in Table 31 show a broad distribution, from the low nanomolar range (17 nM) to
the low micromolar range (2 µM). The highest affinities to the specific and non-specific
DNA could be found in the presence of Ca2+-ions. The absence of divalent metal ions as
well as the presence of Mg2+-ions decreased the binding affinity.
In order to finally evaluate the extent of DNA-binding cleft opening in the non-specific
complex, the corrected FRET efficiencies (Ecorr) were calculated (for the Ca2+ conditions
only) as described in chapter 2.2.3.6. The results are presented in Table 32. The corrected
values take into consideration that the acceptor signal at 666 nm is not only caused by
energy transfer from the donor to the acceptor fluorophore but to a certain extent also by
direct excitation of the acceptor fluorophore and signal bleed through from the donor
fluorophore.
Table 32: Corrected FRET efficiencies (Ecorr) in the presence of Ca2+-ions
Restriction enzyme Protein status FRET efficiency (Ecorr)
PvuII
D125C
Apoenzyme
Non-specific complex
Specific complex
0.22 ± 0.01
0.31 ± 0.02
0.59 ± 0.00
EcoRV
D214C
Apoenzyme
Non-specific complex
Specific complex
0.19 ± 0.02
0.14 ± 0.01
0.26 ± 0.00
BsoBI
A153C
Apoenzyme
Non-specific complex
Specific complex
0.46 ± 0.04
0.45 ± 0.06
0.26 ± 0.00
It can be seen that the corrected FRET efficiencies (Ecorr) are in total lower than the un-
corrected FRET efficiencies (E) (see Table 28, Table 29 and Table 30). However, the
proportions between apoenzyme, non-specific and specific protein-DNA complex are
maintained.

3 Results 104
3.2.3 Studying linear diffusion of structurally different restriction
enzymes
To find out to which extent the structurally different restriction enzymes EcoRV, PvuII
and BsoBI make use of liner diffusion, a competitive cleavage assay (2.2.3.3) was em-
ployed [31,44,45]. In this assay a short oligonucleotide is cleaved in competition with a
long PCR fragment. The oligonucleotide is too short to support linear diffusion to signif-
icant extent. The PCR fragments in contrast are long enough to allow the enzyme sliding
along the DNA which will accelerate target site location and speed up cleavage. Since the
specific recognition site is embedded in an identical sequence context, differences in the
cleavage rates of the oligonucleotide and the PCR fragment can only be due to the differ-
ent length of the two substrates and are correlated with linear diffusion [45]. The ratio of
the cleavage rates (klong/kshort) is a measure of the ability of the enzyme to make use of
linear diffusion and allows comparing different restriction enzymes. The rational design
of the competitive cleavage assay is shown in Figure 48.
Figure 48: Rational design of the competitive cleavage assay. (a) The target site (black bar) on the short oligonucleo-
tide, 5’-labeled with Atto647N (red dot) can only be reached directly from solution (3D diffusion). (b) The target site
on the long PCR fragment, 5’-labeled with Atto488 (green dot) can be reached either directly from solution (3D diffu-
sion) or after non-specific binding and subsequent sliding along the DNA (1D diffusion), which accelerates the location
of the target site. Restriction enzymes and DNA fragments are not drawn to scale.

3 Results 105
3.2.3.1 Substrate length dependence of linear diffusion
In the first set of experiments, the dependence of the cleavage rate ratio (klong/kshort) on the
substrate length was investigated. For that purpose, a 26mer oligonucleotide was cleaved
in competition with a PCR fragment of 153, 498, 958 or 1488 bp in length. For control,
the 26mer was also cleaved in competition with another 26mer.
600 pM of each restriction enzyme were incubated together with 20 nM of the 5’-
Atto647N-labeled oligonucleotide and 20 nM of one of the 5’-Atto488-labeled PCR frag-
ments. After appropriate time intervals, samples were withdrawn and analyzed on a de-
naturing polyacrylamide gel (2.2.2.1). Fluorescent bands were quantified, the amount of
substrate cleavage was plotted against the time and cleavage rates of the short oligonu-
cleotide (kshort) and the long PCR fragment (klong) were determined independently.
The results of the substrate length dependence of linear diffusion are shown in Figure 49
for EcoRV D214C, in Figure 50 for PvuII D125C and in Figure 51 for BsoBI A153C,
respectively. On the polyacrylamide gels, it can be seen that the substrate bands for the
26 bp fragment labeled with Atto647N (red fluorescence) and for the 26, 153, 498, 958
and 1488 bp fragments labeled with Atto488 (green fluorescence) disappear over time,
whereas the product bands of a 10 bp fragment (in case of EcoRV and PvuII) or 8 bp
fragment (in case of BsoBI) appear over time. Although the cleavage products of the short
and the long fragment have the same size, they run with different velocity through the
gel, which can be attributed to the different fluorophores. It can also be seen that the PCR
fragments were cleaved almost completely (90 - 95 %) whereas the 26 bp oligonucleo-
tides were cleaved only by 40 – 70 %, which can be attributed to the synthetic nature of
short oligonucleotides. The cleavage rates for the long PCR fragment and the short oli-
gonucleotide as well as their ratios (klong/kshort) and their sum (ktotal) are summarized in
Table 33 for EcoRV D214C, in Table 34 for PvuII D125C and in Table 35 for BsoBI
A153C, respectively.

3 Results 106
(a)
(b)
(c)
(d)
(e)
Figure 49: Substrate length dependence for DNA cleavage by EcoRV D214C. Cleavage of a 5’-Atto647N-labeled
26mer in competition with a 5’-Atto488-labeled (a) 26mer, (b) 153mer, (c) 498mer, (d) 958mer and (e) 1488mer. Left:
Merged fluorescent images of the polyacrylamide gel (red = Atto647N, green = Atto488, C = uncleaved control). Right:
Time course of the competitive cleavage of the long PCR fragment (green) and the short 26mer oligonucleotide (red).
Data points are the average of at least three independent experiments and a single exponential function was fitted to the
data.

3 Results 107
(a)
(b)
(c)
(d)
(e)
Figure 50: Substrate length dependence for DNA cleavage by PvuII D125C. For details see legend to Figure 49.

3 Results 108
(a)
(b)
(c)
(d)
(e)
Figure 51: Substrate length dependence for DNA cleavage by BsoBI A153C. For details see legend to Figure 49.

3 Results 109
Table 33: Cleavage rates of different PCR-fragments (klong) and the 26mer oligonucleotide (kshort), their ratio
(klong/kshort) and their sum (ktotal) for the restriction enzyme EcoRV D214C.
klong [min-1] kshort [min-1] klong/kshort ktotal [min-1]
26 bp 0.40 ± 0.02 0.38 ± 0.05 1.05 0.78
153 bp 0.306 ± 0.005 0.16 ± 0.05 1.87 0.47
498 bp 0.217 ± 0.005 0.078 ± 0.003 2.78 0.295
958 bp 0.123 ± 0.004 0.040 ± 0.005 3.08 0.163
1488 bp 0.095 ± 0.002 0.031 ± 0.003 3.06 0.126
Table 34: Cleavage rates of different PCR-fragments (klong) and the 26mer oligonucleotide (kshort), their ratio
(klong/kshort) and their sum (ktotal) for the restriction enzyme PvuII D125C.
klong [min-1] kshort [min-1] klong/kshort ktotal [min-1]
26 bp 1.01 ± 0.06 0.95 ± 0.03 1.06 1.96
153 bp 0.44 ± 0.06 0.33 ± 0.04 1.33 0.77
498 bp 0.34 ± 0.01 0.22 ± 0.03 1.55 0.56
958 bp 0.33 ± 0.02 0.19 ± 0.02 1.74 0.52
1488 bp 0.24 ± 0.02 0.14 ± 0.01 1.71 0.38
Table 35: Cleavage rates of different PCR-fragments (klong) and the 26mer oligonucleotide (kshort), their ratio
(klong/kshort) and their sum (ktotal) for the restriction enzyme BsoBI A153C.
klong [min-1] kshort [min-1] klong/kshort ktotal [min-1]
26 bp 0.99 ± 0.09 1.02 ± 0.04 0.97 2.01
153 bp 0.71 ± 0.04 0.27 ± 0.03 2.63 0.98
498 bp 0.50 ± 0.03 0.109 ± 0.008 4.59 0.609
958 bp 0.33 ± 0.02 0.057 ± 0.004 5.79 0.387
1488 bp 0.26 ± 0.01 0.039 ± 0.003 6.67 0.299
It can be seen for all restriction enzymes that the cleavage rates of the PCR fragments
(klong) and the oligonucleotide (kshort) decrease with increasing length of the PCR frag-
ment. The effect is more pronounced for the short oligonucleotide. Consequently, also
the sum of the cleavage rates (ktotal) decreases with increasing length of the PCR fragment.
In contrast the ratio of the cleavage rates (klong/kshort) increases with increasing length of
the PCR fragment. Furthermore the cleavage of the long PCR fragment is always faster
than the cleavage of the short oligonucleotide, whereas the differently labeled 26mers are
cleaved with the same rate.

3 Results 110
The dependence of the cleavage rate ratios (klong/kshort) on the substrate length is again
summarized in Figure 52. For each substrate length, BsoBI A153C shows the highest
ratio of klong/kshort, EcoRV D214C the second highest ratio of klong/kshort and PvuII D125C
shows the lowest ratio of klong/kshort.
Figure 52: Length dependence of DNA cleavage rates. The relative rates of cleavage (klong/kshort) of the long PCR
fragment and the short 26mer oligonucleotide were determined in competition cleavage experiments for BsoBI A153C
(▲), EcoRV D214C (●) and PvuII D125C (■) and plotted versus the substrate length. Cartoons of the co-crystal struc-
tures in complex with specific DNA are depicted on the right: 1DC1 (BsoBI), 4RVE (EcoRV) and 1PVI (PvuII).
The experiments above showed that a specific recognition site on a long PCR fragment
is cleaved much faster than on a short oligonucleotide. In a further experiment it was
therefore tested whether this effect can be prevented by fragmentation of the long PCR
fragment prior to the competitive cleavage reaction, similarly as described by Ehbrecht
et al. [40]. This procedure has the advantage that the same amount of unspecific DNA is
present in the reaction mixture. The experimental design is illustrated in Figure 53.
Figure 53: Experimental design to prevent linear diffusion. The 26mer oligonucleotide, containing one HaeIII recog-
nition site (GGCC) and the 958mer PCR fragment, containing 11 HaeIII recognition sites, were predigested with HaeIII
resulting in two 19mers, each containing the specific recognition site for either EcoRV, PvuII or BsoBI (black bar) and
carrying a 5’-Atto647N (red) or 5’-Atto488 (green) modification, respectively (DNA fragments are not drawn to scale).

3 Results 111
For that purpose, a mixture of the 26mer oligonucleotide and the 958mer PCR fragment
have been digested with the 4 bp cutter HaeIII, which produces two 19mers fragments
(which harbor the recognition site and carry two different fluorescent label) and twelve
other fragments ranging from 7 – 234 bp in size. Subsequently, the digested fragments
were cleaved in competition as described above.
(a)
(b)
(c)
Figure 54: Preventing linear diffusion by destroying the continuity of the DNA double strand. The 5’-Atto647N-
labeled 26mer oligonucleotide and the 5’-Atto488-labeled 958mer PCR fragment were predigested with HaeIII and
subsequently cleaved in competition by (a) EcoRV D214C, (b) PvuII D125C and (c) BsoBI A153C. Left: Merged
fluorescent images of the polyacrylamide gel (red = Atto647N, green = Atto488, C = uncleaved control). Right: Time
course of the competitive cleavage of the predigested 958mer PCR fragment (green) and 26mer oligonucleotide (red).
Data points are the average of at least three independent experiments and a single exponential function was fitted to the
data.
Figure 54 shows the results of the competitive cleavage assay after digestion with HaeIII.
On the polyacrylamide gel, it can be seen that the band for the 5’-Atto488-labeled 958 bp
fragment (green fluorescence) is no longer present, whereas the band for the 5’-
Atto647N-labeled 26 bp fragment (red fluorescence) is barely recognizable.

3 Results 112
This shows that the pre-digestion with HaeIII has been completed for the 958 bp fragment
and almost completed for the 26 bp fragment. Instead, two 19 bp fragments (red and green
fluorescence) became visible on the gel. The substrate bands of these two 19 bp fragments
disappear over time, whereas the product bands of a 10 bp fragment (in case of EcoRV
and PvuII) or 8 bp fragment (in case of BsoBI) appear over time. The cleavage rates for
the predigested (pd) long PCR fragment and the predigested short oligonucleotide as well
as their ratios (klong(pd)/kshort(pd)) and their sum (ktotal(pd)) are summarized in Table 36.
Table 36: Cleavage rates of the predigested 958mer PCR-fragment (klong(pd)) and the predigested 26mer oligonucle-
otide (kshort(pd)), their ratio (klong(pd)/kshort(pd)) and their sum (ktotal(pd)) for different restriction enzymes.
Enzyme klong(pd) [min-1] kshort(pd) [min-1] klong(pd)/kshort(pd) ktotal(pd) [min-1]
EcoRV D214C 0.049 ± 0.001 0.048 ± 0.002 1.02 0.097
PvuII D125C 0.12 ± 0.01 0.12 ± 0.01 1.00 0.24
BsoBI A153C 0.161 ± 0.007 0.150 ± 0.002 1.07 0.311
It can be seen that the predigested long and short fragments were cleaved with almost the
same rate, consequently the ratio of the cleavage rates (klong(pd)/kshort(pd)) became 1. With-
out pre-digestion the long PCR fragment was cleaved much faster than the short oligonu-
cleotide (see Table 33 for EcoRV, Table 34 for PvuII and Table 35 for BsoBI, respec-
tively). By comparing the cleavage rates of the substrates with and without pre-digestion,
one can realize that the predigested PCR fragments were cleaved much slower than the
undigested PCR fragments. Interestingly, the predigested oligonucleotides were either
cleaved with approximately the same rate as the undigested oligonucleotides in case of
EcoRV (0.048 ± 0.002 min-1 vs. 0.040 ± 0.005 min-1) and PvuII (0.12 ± 0.01 min-1 vs.
0.19 ± 0.02 min-1) or they were cleaved 3-times faster in case of BsoBI (0.150 ± 0.002
min-1 vs. 0.057 ± 0.004 min-1). Also the total cleavage rates (ktotal(pd)) of the predigested
fragments were found to be slower compared to the undigested fragments.
3.2.3.2 Salt dependence of linear diffusion
In a second set of experiments, the dependence of the cleavage rate ratios (klong/kshort) on
the salt concentration was investigated. For that purpose, a 26mer oligonucleotide was
cleaved in competition with a 958mer PCR fragment in the presence of either 20 mM,
100 mM or 200 mM NaCl. The assay was carried out as described above.

3 Results 113
(a)
(b)
(c)
Figure 55: Salt dependence for DNA cleavage by EcoRV D214C. Cleavage of a 5’-Atto647N 26mer in competition
with a 5’-Atto488 958mer in the presence of (a) 20 mM NaCl, (b) 100 mM NaCl and (c) 200 mM NaCl. Left: Merged
fluorescent images of the polyacrylamide gel (red = Atto647N, green = Atto488, C = uncleaved control). Right: Time
course of the competitive cleavage of the long PCR fragment (green) and the short 26mer oligonucleotide (red). Data
points are the average of at least three independent experiments and a single exponential function was fitted to the data.
Table 37: Cleavage rates of the 958mer PCR-fragment (klong) and the 26mer oligonucleotide (kshort), their ratio
(klong/kshort) and their sum (ktotal) for the restriction enzyme EcoRV D214C under different NaCl concentrations.
[NaCl] klong [min-1] kshort [min-1] klong/kshort ktotal [min-1]
20 mM 0.197 ± 0.006 0.056 ± 0.005 3.52 0.253
50 mM* 0.123 ± 0.004 0.040 ± 0.005 3.08 0.163
100 mM 0.294 ± 0.005 0.109 ± 0.008 2.70 0.403
200 mM 0.266 ± 0.004 0.134 ± 0.007 1.99 0.400
*Results for 50 mM NaCl were taken from Table 33.

3 Results 114
(a)
(b)
(c)
Figure 56: Salt dependence for DNA cleavage by PvuII D125C. For details see legend to Figure 55.
Table 38: Cleavage rates of the 958mer PCR-fragment (klong) and the 26mer oligonucleotide (kshort), their ratio
(klong/kshort) and their sum (ktotal) for the restriction enzyme PvuII D125C under different salt concentrations.
[NaCl] klong [min-1] kshort [min-1] klong/kshort ktotal [min-1]
20 mM 0.328 ± 0.007 0.13 ± 0.01 2.52 0.341
50 mM* 0.33 ± 0.02 0.19 ± 0.02 1.74 0.52
100 mM 0.234 ± 0.005 0.134 ± 0.009 1.75 0.368
200 mM 0.082 ± 0.004 0.048 ± 0.003 1.71 0.130
*Results for 50 mM NaCl were taken from Table 34.

3 Results 115
(a)
(b)
(c)
Figure 57: Salt dependence for DNA cleavage by BsoBI A153C. For details see legend to Figure 55.
Table 39: Cleavage rates of the 958mer PCR-fragment (klong) and the 26mer oligonucleotide (kshort), their ratio
(klong/kshort) and their sum (ktotal) for the restriction enzyme BsoBI A153C under different salt concentrations.
[NaCl] klong [min-1] kshort [min-1] klong/kshort ktotal [min-1]
20 mM 0.33 ± 0.01 0.089 ± 0.007 3.73 0.419
50 mM* 0.33 ± 0.02 0.057 ± 0.004 5.79 0.387
100 mM 0.262 ± 0.008 0.050 ± 0.003 5.24 0.312
200 mM 0.0112 ± 0.0005 0.0065 ± 0.0003 1.72 0.0177
*Results for 50 mM NaCl were taken from Table 35.

3 Results 116
The results of the salt dependence of linear diffusion are shown in Figure 55 for EcoRV
D214C, in Figure 56 for PvuII D125C and in Figure 57 for BsoBI A153C. Explanations
of the images and graphs can be found in Figure 49. The cleavage rates for the long PCR
fragment and the short oligonucleotide as well as their ratios (klong/kshort) and their sum
(ktotal) are shown in Table 37 for EcoRV D214C, in Table 38 for PvuII D125C and in
Table 39 for BsoBI A153C, respectively.
For EcoRV D214C it can be seen that the cleavage rate of the 958mer (klong) first de-
creased, then increased and then again slightly decreased with increasing NaCl concen-
tration. The cleavage rate of the 26mer (kshort) first decreased slightly and then increased
with increasing NaCl concentration. The total velocity (ktotal) showed the same trend as
for the 958mer. In contrast the ratio of the cleavage rates (klong/kshort) continuously de-
creased with increasing NaCl concentration from 3.52 to 1.99.
For PvuII D125C it can be seen that the cleavage rate of the 958mer (klong) first remained
the same and then decreased with increasing NaCl concentration. The cleavage rate of the
26mer (kshort) first increased and then decreased with increasing NaCl concentration. The
total velocity (ktotal) showed the same trend as for the 26mer. In contrast the ratio of the
cleavage rates (klong/kshort) first decreased from 2.52 to 1.74 by increasing the NaCl con-
centration from 20 mM to 50 mM and remained at the almost the same value of klong/kshort
even after a further increase of the NaCl concentration up to 200 mM.
For BsoBI A153C it can be seen that the cleavage rate of the 958mer (klong) first remained
the same and then decreased with increasing NaCl concentration. The cleavage rate of the
26mer (kshort) continuously decreased with increasing NaCl concentration. The total ve-
locity (ktotal) showed the same trend as for the 26mer. In contrast the ratio of the cleavage
rates (klong/kshort) first increased from 3.73 to 5.79 by increasing the NaCl concentration
from 20 mM to 50 mM and then slightly decreased klong/kshort to 5.24 at a NaCl concen-
tration of 100 mM. A further increase of the NaCl concentration up to 200 mM consider-
ably decreased klong/kshort to 1.72.
The dependence of the cleavage rate ratios (klong/kshort) on the NaCl concentration is again
summarized in Figure 58.

3 Results 117
Figure 58: Salt dependence of DNA cleavage rates. The relative rates of cleavage (klong/kshort) of the 958 bp long PCR
fragment and the short 26 bp oligonucleotide were determined in competition for BsoBI (▲), EcoRV (●) and PvuII
(■) in the presence of different salt concentrations and plotted versus the NaCl-concentration.
3.2.3.3 Structure dependence of linear diffusion
In a third set of experiments, the dependence of the cleavage rate ratios (klong/kshort) on the
structure was studied by comparing enzymes in which a defined structural change had
been introduced (see Figure 59). A large structural change that increases the size of a
protein was introduced by fusing EcoRV with the elongated protein scRM6 (see 3.1 and
Figure 24). A small structural change that affects the geometry of the DNA-binding cleft
was introduced in scPvuII by connecting the two identical subunits of PvuII with a short
peptide [93].
Figure 59: Comparison of different crystal structures. EcoRV (a) has a compact globular structure compared to the
fusion protein (b), consisting of scRM6 and EcoRV, which has an elongated shape (model based on the structures of
EcoRV and scRM6). The conformation of PvuII (c) is more open than the structure of scPvuII (d). Crystal structures
were 1RVE for EcoRV, 1PVU for PvuII and 3KSK for scPvuII. Since the crystal structure of scRM6-EcoRV doesn’t
exist, it was modeled with the structures of EcoRV (1RVE) and scRM6 (1QX8).

3 Results 118
For that purpose, a 26mer oligonucleotide was cleaved in competition with a 958mer PCR
fragment by scRM6-EcoRV C21S or scPvuII. The assay was carried out as described
above with the exception that of scRM6-EcoRV C21S 10 nM instead of 600 pM were
used (attributed to the lower activity of the fusion protein).
(a)
(b)
Figure 60: Structure dependence. Cleavage of a 5’-Atto647N 26mer in competition with a 5’-Atto488 958mer by (a)
scRM6-EcoRV C21S and (b) scPvuII. Left: Merged fluorescent images of the polyacrylamide gel (red = Atto647N,
green = Atto488, C = uncleaved control). Right: Time course of the competitive cleavage of the long PCR fragment
(green) and the short 26mer oligonucleotide (red). Data points are the average of at least three independent experiments
and were fitted to a single exponential function.
The results of the competitive cleavage assay are shown in Figure 60. Explanations of the
images and graphs can be found in Figure 49. The cleavage rates for the long PCR frag-
ment and the short oligonucleotide as well as their ratios (klong/kshort) and their sum (ktotal)
are summarized in Table 40.
Table 40: Cleavage rates of the 958mer PCR-fragment (klong) and the 26mer oligonucleotide (kshort), their ratio
(klong/kshort) and their sum (ktotal) for the restriction enzymes scRM6-EcoRV and scPvuII.
Enzyme klong [min-1] kshort [min-1] klong/kshort ktotal [min-1]
scRM6-EcoRV 0.128 ± 0.005 0.074 ± 0.005 1.73 0.202
scPvuII 0.223 ± 0.009 0.11 ± 0.02 2.03 0.333

3 Results 119
It can be seen that the cleavage rate ratio (klong/kshort) of the scRM6-EcoRV fusion protein
is lower compared to that of wild type EcoRV (1.73 vs. 3.08, see Table 33), indicating
that the linear diffusion behavior of scRM6-EcoRV C21S is reduced. On the contrary, the
cleavage rate ratio (klong/kshort) for scPvuII is higher compared to that of wild type PvuII
(2.03 vs. 1.74, see Table 34), indicating that scPvuII is using linear diffusion to a higher
extent.

4 Discussion 120
4 Discussion
4.1 Preparation of an elongated restriction enzyme to study
rotational motion
It is known that restriction enzymes slide along the DNA while searching for their recog-
nition site [67]. Their detailed path of motion however, remains unclear. The question
arises whether these proteins undergo simple translational diffusion corresponding to a
linear path, parallel to the DNA axis (‘non-helical’ sliding mechanism) or whether they
undergo a rotation-coupled translational diffusion corresponding to a helical path, follow-
ing the DNA axis (‘helical’ sliding mechanism). The latter path appears more reasonable
since it allows the protein to maintain correct register with the DNA molecule and to
sense the base pair sequence in the major groove directly.
A helical sliding mechanism of restriction enzymes has already been proposed from bulk
ensemble measurements [44,45]. The fact that restriction enzymes do not overlook a spe-
cific recognition site implied that the enzyme stays in continuous contact with the DNA
and follows the helical pitch during sliding, thereby rotating around the DNA molecule.
A helical sliding mechanism has also been confirmed indirectly by single-molecule ex-
periments [75-77]. The one-dimensional diffusion coefficient is expected to be orders of
magnitude smaller, if rotation is involved in the mechanism of sliding [74]. Most of the
reported D1 values from single-molecule experiments so far are consistent with a model
that involves rotation-coupled sliding.
What is still outstanding and has been addressed in this work is the direct visualization of
such a rotation-coupled translational diffusion of restriction enzymes. To this end, a fu-
sion protein consisting of the restriction enzyme EcoRV and the quasi linear protein
scRM6 has been prepared and purified (3.1.1). It was tested extensively with regard to
binding and cleavage activity (3.1.2) and the spatial expansion was investigated applying
FRET measurements (3.1.3). At the end, the fusion protein has been subjected to single-
molecule experiments to determine the one-dimensional diffusion coefficient (3.1.4)

4 Discussion 121
4.1.1 Preparation of the scRM6-EcoRV fusion protein
First attempts to prepare the scRM6-EcoRV fusion protein were made with the original
eight-cysteine variant of scRM6, in order to determine whether the activity of EcoRV in
general will be preserved after fusing it to scRM6 (data not shown in this work). The
cloning procedure proved to be extremely difficult. The gene coding for scRM6 had to
be amplified via PCR to transfer it subsequently into the vector plasmid pET28a. Because
‘single chain’ RM6 is a homotetramer which consists of four identical subunits aligned
in one polypeptide chain, annealing of the PCR primers has been possible at more than
one position. Thereby, not only the desired PCR fragment but also undesired smaller frag-
ments were amplified. For the purification of the eight-cysteine fusion protein variant, the
same buffers as for EcoRV could be used (see Table 2). Nevertheless, a second purifica-
tion step via Heparin column, similar as it has been shown for the single-cysteine fusion
protein variant (Figure 27), had to be established as well. Despite of several complications
with regard to the cloning and purification procedure, it has finally been possible to pre-
pare a scRM6-EcoRV fusion protein, whose activity could be been shown to be preserved
(data not shown in this work), a prerequisite for all further experiments. Since the fusion
protein should be labeled specifically with a fluorophore at the tip of the scRM6 helix
bundle, the scRM6-EcoRV fusion protein harboring eight cysteine residues could not be
used for these studies. To circumvent unspecific labeling, a single-cysteine variant was
prepared (3.1.1). As a consequence to the difficulties using the scRM6 gene as a template
in a PCR reaction as mentioned above, a stepwise mutagenesis would have been too time-
consuming and a modified synthetic gene of scRM6 coding for a single-cysteine variant
has been synthesized by GeneArt. This modified gene encoded for a scRM6 variant in
which all eight native cysteine residues had been exchanged by alanine residues and a
single cysteine residue had been introduced at position 54. For the synthesis of the mod-
ified gene it has furthermore been considered that identical amino acids in the four subu-
nits were encoded by different base triplets to prevent the annealing of PCR primers at
multiple positions and to facilitate the cloning procedure. Additionally, five different
linker variants of the scRM6-EcoRV fusion protein have been prepared, which differ in
the number of amino acids between the C-terminal α-helix of scRM6 and the N-terminal
α-helix of EcoRV. The peptide linker of the original single-cysteine variant (scRM6
D54C-EcoRV C21S) consists of 15 amino acids whereas the linkers of the different sin-
gle-cysteine linker variants consists of either zero (L(0)), one (L(G) and L(N)), two (L(NA))
or three (L(NAS)) amino acids.

4 Discussion 122
Optimally, the fusion of the two proteins leads to the formation of an elongated, continu-
ous α-helix and thereby to a rigid connection (Figure 24). For that purpose, hydrogen
bonds have to be formed across the junction of the C-terminal α-helix of scRM6 and the
N-terminal α-helix of EcoRV. Because it is not known in which orientation one α-helix
ends and the other α-helix starts and based on the fact, that α-helices have 3.6 amino acids
per helical turn, the linker length was varied between 0 and 3 amino acids. Asparagine,
alanine, and serine are amino acids, which can be typically found in α-helices and are
supposed to promote the formation of an elongated α-helix. Glycine on the other hand is
known as helix breaker and is supposed to kink the α-helix, thereby preventing the for-
mation of an elongated α-helix. It should be evaluated which of the different linker vari-
ants shows an optimal spatial orientation of the extension components scRM6 (3.1.3) and
thereby is suited for the direct visualization of rotational motion in single-molecule ex-
periments. To purify the single-cysteine and the different single-cysteine linker variants
of the fusion protein, other buffers as for EcoRV or the eight-cysteine fusion protein var-
iant had to be used (compare Table 2 and Table 3). The main problem was the poor sta-
bility in consequence of the low salt and DTT concentration of the previously used puri-
fication buffers. For this reason buffers have been changed by increasing the salt concen-
tration of the Ni-NTA elution buffer from 0 mM to 500 mM, the salt concentration of
Heparin low salt buffer from 0 mM to 250 mM and the DTT concentration of all buffers
from 1 mM to 5 mM (see Table 3). A sufficiently high concentration of DTT was neces-
sary to prevent the formation of disulfide bridges between the exposed single-cysteine
residues of the protein. The chromatogram of the Heparin purification (Figure 27) showed
that after injection of the protein sample, the conductivity shortly increased up to a value
of 40 mS/cm. This observation is attributed to the fact that the injected protein sample is
composed of a mixture of 50 % Ni-NTA elution buffer and 50 % low salt buffer. Since
the Ni-NTA elution buffer has a higher salt concentration than the low salt buffer (500
mM vs. 250 mM), the injection of the protein sample led to an increase in the salt con-
centration and thereby to an increase in the conductivity. This conductivity increase led
to the elution of undesired proteins, but also to a partially elution of the desired fusion
protein (Figure 27). However, the largest part of the fusion protein eluted after further
increasing the salt concentration and could successfully be separated from the undesired
proteins (Figure 27).

4 Discussion 123
4.1.2 Biochemical characterization of the scRM6-EcoRV fusion protein
After the successful preparation of different scRM6-EcoRV fusion protein variants it was
evaluated whether the extension component scRM6 has any influence on the binding or
cleavage activity of the restriction enzyme component EcoRV (3.1.2). By looking at the
model in Figure 24, one can imagine that the large extensions will handicap the interac-
tion between EcoRV and the DNA molecule, thereby leading to a reduced activity. To
analyze in more detail to what extent the activity is influenced, which step of the protein-
DNA interaction is influenced most and to find out whether differences among the differ-
ent scRM6-EcoRV fusion protein variants exist, various activity assays were performed,
which either investigated only binding (3.1.2.2) or cleavage in a concentration- (3.1.2.1)
or time-dependent (3.1.2.3) manner.
As expected, all performed activity assays demonstrated that the overall activity of the
different scRM6-EcoRV fusion protein variants was reduced compared to the wild type
EcoRV. Differences among the different interaction steps and linker variants could be
detected as well. The binding activity was reduced by a factor between 3 and 10 compared
to the wild type EcoRV (L(NAS)/L(N) ~ 3x, L(G) ~ 4x, L(0) ~ 5x, L(NA) ~ 7x, L(15) ~ 10x)
which is in the order of one magnitude (Table 23). All variants with short peptide linkers
showed a slightly better binding activity than the variant with the long peptide linker. This
observation could be explained by the fact that the long linker permits too much flexibility
of the extension component, which makes a proper binding to the DNA molecule more
difficult. The shorter linkers instead keep the extension component more fixed, thereby
less influencing the binding procedure. The concentration-dependent cleavage assay re-
vealed that the cleavage activity was reduced by a factor between 6 and 60 compared to
the wild type EcoRV (L(15) ~ 6x, L(NAS)/L(N) ~ 30x, L(NA)/L(0)/L(G) ~ 60x) which is in the
order of one to two magnitudes (Figure 28). Interestingly, this assay revealed that the
variant with the long linker showed a much better cleavage activity than the variants with
the short linkers. Since the cleavage assay was performed with a plasmid, the protein-
DNA interaction involved several steps such as non-specific binding, linear diffusion,
conformational changes, specific binding, catalysis and product release (see also Figure
6). Because binding alone has been shown to be better for the variants with the short
linkers (Table 23), necessarily one of the other interaction steps must have been worse
for the variants with the short linkers.

4 Discussion 124
This for example would make sense for the linear diffusion step, considering that a short
linker forms a more rigid connection between the two proteins which causes a higher
friction for linear diffusion than a long, flexible linker (see also 3.1.4). It also conceivable
that conformational changes are harder to perform if the linker between the two proteins
is shorter, because the extension component needs to be moved as well. A longer linker
instead allows EcoRV to perform conformational changes independent from scRM6. The
time-dependent cleavage assay revealed that kcat was reduced by a factor between 6 and
10 compared to the wild type EcoRV, which is in the order of one magnitude (Table 24).
The different linker variants showed comparable values, indicating that the linker length
has no influence on the catalysis. KM values were found to be reduced by a factor between
3 and 40 compared to the wild type EcoRV (Table 24), which is in the order of one to
two magnitudes. In contrast to the KD values, KM values showed a different dependency
on the linker length. KD and KM values are usually expected to be identical, if the kcat is
much smaller than the koff. Since kcat has been shown to be comparable for the different
linker variants, the koff of the variant with the long linker must have been smaller com-
pared to the variants with short linkers, which can only be achieved if the kon of the variant
with the long linker is smaller. A reduced kon for the variant with the long linker would
be in agreement with the above mentioned hypothesis that a long linkers allows too much
flexibility and makes the binding to the DNA more difficult.
Altogether it has been shown that the extension component scRM6 has indeed an influ-
ence on the binding and cleavage activity of the restriction enzyme component EcoRV.
The reduction of activity was in the order of one to two magnitudes, which can be con-
sidered as a small influence. Decreasing the distance between the extension and re-
striction enzyme component (short linkers) improved binding to the DNA molecule but
reduced the overall cleavage activity. Among the different linker variants, scRM6 D54C-
L(N)-EcoRV C21S and scRM6 D54C-L(NAS)-EcoRV C21S showed the best results, indi-
cating that a peptide linker of one or three amino acids in length leads to a connection of
the two proteins that is fewest influencing the binding and cleavage activity.

4 Discussion 125
4.1.3 Studying the spatial expansion via FRET
In addition to the preserved activity of the scRM6-EcoRV fusion protein, the correct spa-
tial orientation of the extension component scRM6 has been another requirement for the
investigation of rotational movement by single-molecule experiments. Only if the exten-
sion component scRM6 is stretched out maximally, the distance between the DNA axis
and the fluorophore is sufficiently large to distinguish the transversal position of the flu-
orescent spot.
The spatial expansion of the different scRM6-EcoRV fusion protein variants was ana-
lyzed using FRET (3.1.3). FRET is a powerful tool to measure distances within biomol-
ecules, since energy can only be transferred if the distance between donor and acceptor
fluorophore is smaller than 10 nm. In the fusion protein, two scRM6 proteins are attached
to one EcoRV homodimer and the labeling position is located at the tip of the helix bundle
of each scRM6 protein (see Figure 24). Random double-labeling ideally leads to the at-
tachment of a donor fluorophore to one scRM6 protein and an acceptor fluorophore to the
other scRM6 protein. Considering a length of 7 nm for scRM6 and a diameter of 5 nm
for EcoRV, the distance between donor and acceptor fluorophore should be in the range
of 20 nm and no FRET signal should be measurable. To ensure, that the FRET assay
works in general, two control experiments were performed. As a positive control, the
EcoRV variant C21S N154C was used, in which the distance between the two symmetry
related residues at position 154 is smaller than 10 nm. As negative control, a 97 bp long
DNA substrate was used, in which the distance between the two terminal ends is larger
than 10 nm. The length of the DNA substrate is still below the persistence length (~ 150
bp) and it can therefore be considered as rigid molecule. The rational design of the FRET
measurements is summarized in Figure 32.
The emission spectrum of the double-labeled 97 bp DNA substrate showed only one peak
at 520 nm (Figure 33a), resulting from direct excitation of the donor fluorophore. No
second peak could be observed which indicated that no energy transfer took place and
that the two fluorophores are separated by more than 10 nm. The calculated FRET effi-
ciency was therefore close to zero (E = 0.01). The emission spectrum of the double-la-
beled protein variant EcoRV C21S N154C on the other hand showed one peak at 520 nm
and additional peak at 664 nm (Figure 33b), resulting from energy transfer from the donor
to the acceptor fluorophore and indicating that the two fluorophores are closer than 10
nm. The calculated FRET efficiency was found to be E = 0.23 ± 0.01.

4 Discussion 126
The emission spectra of all different double-labeled scRM6-EcoRV fusion proteins vari-
ants showed two peaks at 520 nm and 664 nm as well, indicating that energy transfer took
place and that the two fluorophores are closer than 10 nm (Figure 33c). FRET efficiencies
were found to be in the range of 0.17 ± 0.01 for the variant with the L(NA) linker to 0.28 ±
0.01 for the variant with the L(0) linker. To find out if the spatial orientation of the exten-
sion component scRM6 would be different in a DNA-bound state compared to that in
solution, a 16 bp oligonucleotide was added to the double-labeled fusion protein variant
scRM6 D54C-EcoRV C21S and the measurement was repeated. The FRET efficiency in
the presence of DNA was found to be identical to that in the absence of DNA (0.20 ±
0.01). To exclude that the 16 bp oligonucleotide was too short to allow proper binding,
the experiment was repeated with a larger 60 bp oligonucleotide. Also in this case, the
FRET efficiency remained unchanged. To exclude that aggregation of the proteins due to
hydrophobic interactions caused a FRET signal, a mixture of donor and acceptor only
labeled protein was measured. This mixture shouldn’t lead to any FRET signal, since the
single-labeled proteins are sufficiently separated in solution. Aggregation of the proteins
would bring the donor fluorophore of one protein closer to the acceptor fluorophore of
another protein, thereby causing energy transfer and a FRET signal. The FRET efficiency
of the single-labeled protein mixture was found to be 0.03 which indicated that no aggre-
gation contributed to the FRET signal.
The FRET experiments revealed that the two fluorophores are not separated by around
20 nm as assumed but by less than 10 nm because a FRET signal could be measured. This
consequently implies that the scRM6 extensions components are not maximally stretched
out. No significant differences could be found among the different scRM6-EcoRV linker
variants. A reason for the measured FRET signal could be an improper alignment of the
two α-helices which allows too much flexibility of the extension component, thereby
bringing the terminal ends in close proximity (see Figure 32b, orientations indicated in
light grey ). It is also possible that the alignment of the two α-helices has been proper but
that simply the orientation of the N-terminal α-helix of EcoRV was not optimal to maxi-
mally stretch out scRM6. Further, it has to be considered that the FRET efficiency was
calculated within bulk ensemble measurements, which can only represent an average
value of all subpopulations (population with high and low FRET values). FRET meas-
urements on the single-molecule level could be a solution to this.

4 Discussion 127
4.1.4 Single-molecule experiments
Single-molecule experiments should originally be performed with the fusion protein
scRM6 D54C-EcoRV C21S for two different purposes: (i) Indirect proof of a rotational
movement by measuring the one-dimensional diffusion coefficient and comparing it to
theoretical models (3.1.4) and (ii) direct proof of a rotational movement using super-res-
olution microscopy.
Indirect proof of rotational movement
The one-dimensional diffusion coefficient of the fusion protein scRM6 D54C-EcoRV
C21S labeled with Cy3B was determined in collaboration with the group of Pierre Des-
biolles (Laboratoire Kastler Brossel, Paris). By the same group, D1 was determined pre-
viously for EcoRV coupled to fluorescent labels of different size (e.g. Cy3B [67], QD655
[64], sav-Cy3B [77], QD605 and QDEO6 [90]). In case of wild type EcoRV, all fluores-
cent labels were coupled to the protein via a flexible linker. The fusion protein scRM6
D54C-EcoRV C21S instead represented a conjugation strategy in which the fluorescent
label was coupled to EcoRV via a rigid linker, whereby the portfolio of different theoret-
ical models could be extended (see theoretical models in 3.1.4).
The behavior of the fusion protein scRM6 D54C-EcoRV C21S in single-molecule exper-
iments was slightly different from that of wild type EcoRV. The interaction frequency
with the DNA molecule was lower and also the interaction time was shorter, which can
be explained by the reduced binding affinity observed in bulk ensemble measurements
(3.1.2.2). For this reason, buffer conditions had to be changed (from phosphate buffer
[90] to KGB buffer (Table 6) to increase the interaction time with the DNA molecule and
to allow for an accurate measurement of D1. The one-dimensional diffusion coefficient
of scRM6 D54C-EcoRV C21S was found to be D1 = 0.0024 µm2s-1, which is 4-times
slower than the one-dimensional diffusion coefficient of EcoRV labeled with Cy3B (D1
= 0.01 µm2s-1) [67]. The reduced sliding velocity of the fusion protein compared to the
wild type EcoRV is in agreement with observations from bulk ensemble measurements
(see 3.2.3.3). This can be explained by the fact that the scRM6 extension component in-
creased the total hydrodynamic radius of the fusion construct, thereby increasing the fric-
tion while sliding along the DNA molecule.

4 Discussion 128
In order to evaluate if rotation is involved in the sliding process of scRM6 D54C-EcoRV
C21S, the experimental data were compared to the theoretical models. Two general state-
ments can be derived from the models in Figure 34b. (i) With the same label radius and
the same type of motion, a flexibly attached label causes less friction than a rigidly at-
tached label (comparing model 1+3 or model 2+4). This can be explained by the fact that
the motion of the label is decoupled from that of the protein if it is flexibly attached,
whereas the motion of the label is coupled to that of the protein if it is rigidly attached.
(ii) With the same label radius and the same conjugation strategy, linear diffusion causes
less friction than rotation-coupled diffusion (comparing model 1+2 or model 3+4). This
is attributed to the fact that linear diffusion depends only on translational friction (ξ =
6πηr) and the friction coefficient is expected to increase linearly with the label radius
(model 1). In contrast, rotation-coupled diffusion depends on translational and rotational
friction (ξ = 6πηr + 8πηr3) and the friction coefficient is expected to increase to the power
of three with the label radius (model 2) [74]. The friction coefficient of scRM6 D54C-
EcoRV C21S calculated from the measured one-dimensional diffusion coefficient
showed a fairly high value relative to the small label size (Figure 34b). This can only be
explained by the fact that the label is rigidly attached to EcoRV (as assumed) and that
linear diffusion is coupled to rotation. Consequently, experimental data were in agree-
ment with model (5).
Direct proof of rotational movement
The single-molecule experiments performed in Paris were suited to confirm a rotational
movement indirectly by comparing D1 with theoretical models. However, a direct visual-
ization based on the theory demonstrated in Figure 23 would not have been possible there,
since the spatial and temporal resolution of the detection system was restricted to 30 nm
and 20 ms, respectively. For this reason a collaboration with the group of Markus Sauer
(Julius-Maximilians University, Würzburg) was started, who established super-resolution
fluorescence microscopy imaging techniques (e.g. STORM = Stochastic Optical Recon-
struction Microscopy) with superior spatial and temporal resolution [94,95].
Two important prerequisites for the direct visualization of rotational motion by single-
molecule experiments were the preserved activity of the scRM6-EcoRV fusion protein
and a large distance between the fluorophore and the DNA axis in order to distinguish the
transverse position of the fluorescent spot.
4 Discussion 129
The first prerequisite could be met (3.1.2) however, FRET experiments revealed that the
scRM6 extension components were not stretched out maximally (3.1.3), which conse-
quently means that the distance between the fluorophore and the DNA axis could not
successfully be increased in the fusion protein. Thereby none of the scRM6-EcoRV fu-
sion protein variants was appropriate for the direct visualization of rotational motion.
But even with an optimal spatial expansion of the scRM6-EcoRV fusion protein, a direct
visualization would not have been possible. The spatial resolution was considered as a
problem which can be circumvented with the fusion protein (Figure 23). Theoretically,
nanometer precision is possible which would have allowed distinguishing a transversal
position change of 20 nm using super-resolution techniques [95]. Effectively, Brownian
fluctuations of the DNA molecules take place in the same direction and decrease the spa-
tial resolution by one or two orders of magnitude above the theoretical limitations [62].
An additional problem is the temporal resolution (Figure 61). The transverse position of
the fluorescent spot is supposed to change by 20 nm after the enzyme turned 180° around
the DNA molecule (half-rotation). Therefore the questions arises how much time the en-
zyme needs to perform such a half-rotation. This can be calculated using the equation:
𝜏 =𝑎2
2 ∙ 𝐷1
where τ is the time, a is the covered distance (a half-rotation is performed after sliding
over 5 bp, which is equivalent to 1.7 nm) and D1 is the one-dimensional diffusion coeffi-
cient (D1 = 0.0024 µm2s-1 for scRM6 D54C-EcoRV C21S). According to the equation, a
half-rotation of the scRM6-EcoRV fusion protein is completed after 600 µs. In order to
temporally resolve the motion, the exposure time of the camera needs to be in the same
order of magnitude. Even with the most sophisticated cameras with exposure times in the
range of a few milliseconds, such a fast motion cannot be resolved. During an exposure
time of e.g. 10 ms the fusion protein slide already over 7 nm and circled several times
around the DNA.

4 Discussion 130
Figure 61: Problem of temporal resolution and rotation speed. The time (τ) that the scRM6-EcoRV fusion protein
needs to slide over 1 bp can be calculated using the equation for Brownian motion τ = a2/2D where a is the length of 1
bp (a = 0.34 nm) and D is the one-dimensional diffusion coefficient of the scRM6-EcoRV fusion protein (D = 0.0024
µm2s-1). According to this, scRM6-EcoRV needs 24 µs to slide over 1 bp. A full-rotation (10 bp based on the length of
the helical pitch) is completed after 2400 µs, a half-rotation (5 bp) is completed after 600 µs.
Additionally, spatial and temporal resolution are directly interdependent and mutually
determine the localization accuracy of the fluorescent spot. The spatial resolution depends
on the number of captured photons accumulated during the exposure time of the camera,
whereas the temporal resolution depends on the read-out rate of the camera and thereby
on the exposure time. Decreasing the exposure time improves the temporal resolution,
because more fluorescent images can be recorded per time, but debase the spatial resolu-
tion, because not so many photons can be accumulated within the short exposure time.
Increasing the exposure time instead improves the spatial resolution but debase the tem-
poral resolution.
A third problem is the randomness of the translocations of Type II restriction enzymes,
which means that one-dimensional diffusion oscillates between different directions.
Therefore, a change of the transverse position of the fluorescent spot in a periodic manner
as described in 3.1 would not have been observable. Because of the randomness it would
also be difficult to apply alternative methods for the visualization of rotational movement
of Type II restriction enzymes (1.2.1). Fluorescence polarization for example relies on
periodically alternating intensities of the vertically and the horizontally polarized light
[78,79], which could not be implemented with the scRM6-EcoRV fusion protein. Also
torque measurements rely on the fact that the position of the huge labeled tag changes in
a clockwise (or anticlockwise) direction which presumes a directed motion of the corre-
sponding protein [80,82]. Presumably for this reason, most of the studies using these tech-
niques have been performed with motor proteins (e.g. myosin, mDia1, RNAP and F1-
ATPase), which undergo directional translocations under energy consumption.

4 Discussion 131
Final conclusion
Despite many difficulties it was finally possible to prepare and to purify the fusion protein
consisting of EcoRV and scRM6. The binding and cleavage activity was slightly reduced
compared to the wild type EcoRV, however sufficient to study the motion along the DNA
molecule by single-molecule techniques. It could successfully be demonstrated by an in-
direct approach that linear diffusion of the scRM6-EcoRV fusion protein is coupled to
rotation [90]. The direct visualization of rotational motion however, was not possible due
to the speed and randomness of the diffusional motion. Direct experimental observation
of rotation-coupled sliding of restriction enzymes remains a difficult task.

4 Discussion 132
4.2 Comparison of structurally different restriction enzymes
The structurally different restriction enzymes PvuII, EcoRV and BsoBI were compared
regarding their conformation and linear diffusion behavior. It was hypothesized that the
more open the enzyme-DNA complex, the less linear diffusion is used by the enzyme. To
this end, the conformation of the enzyme in complex with non-specific DNA (sliding
conformation) was determined in comparison to the conformation of the apoenzyme and
the conformation in complex with specific DNA with the aid of FRET measurements
(3.2.2). Afterwards the linear diffusion behavior was investigated with conventional ki-
netic methods (3.2.3). All experiments were performed with the same enzyme mutants
under identical buffer condition to ensure the comparability of the results.
4.2.1 Preparation of single-cysteine variants
In order to study the conformation of structurally different restriction enzymes, single-
cysteine variants had to be prepared and labeled with fluorophores. The position of the
single cysteine residue was chosen according to several criteria, having in mind that the
introduction of a cysteine residue in one subunit leads to the introduction at the same
position in the other subunit of the homodimer. First of all, the distance of the desired
cysteine residues, measured from one subunit to the other, should be different for the
apoenzyme and the complexes with specific or non-specific DNA. Consequently, the cys-
teine residues had to be located in a subdomain, which is supposed to move upon DNA
binding. Secondly, the distance of the residues should be in the range of the Förster radius
(R0) (2.2.3.6), which is the distance of donor and acceptor fluorophore at which energy
transfer is 50% efficient. Around R0, small changes in the distance of donor and acceptor
fluorophore cause large changes in the FRET efficiency. In this study the fluorophores
Cy3 and Cy5 have been chosen as donor and acceptor fluorophore, respectively. They are
the most frequently used and best described FRET pair in the literature [96] with an R0
of 56 Å. Thirdly, the residue had to be located at the surface of the protein, to be accessible
for labeling and finally, the residue had to be located far away from the catalytic subdo-
main to not influence the binding and cleavage activity of the enzyme. To this end, the
three crystal structures of EcoRV (apoenzyme, non-specific complex, specific complex)
were compared and the position 214 was found to meet all the criteria.

4 Discussion 133
The residue at position 214 is located on the outside of α-helix D, which belongs to the
top of the recognition subdomain of EcoRV which is supposed to move upon DNA bind-
ing (Figure 3). The distance changes from 48 Å in the specific complex to 57 Å in the
non-specific complex (Δ = 9 Å), which is in the range of the Förster radius. To find an
appropriate position for PvuII, the crystal structure of the specific complex was compared
to that of the apoenzyme. A residue at position 125, which is located in α-helix D of the
recognition subdomain, was chosen (Figure 4). This residue is located at the surface and
the distance changes from 67 Å in the apoenzyme to 48 Å in the specific complex (Δ =
19 Å), which is in the range of the Förster radius. For BsoBI it was not possible to choose
a position that meet all the criteria, since only the crystal structure of the specific complex
is available (Figure 5). From this crystal structure it can only be seen, if the residue is
located at the surface of the enzyme and far away from the catalytic center. It cannot be
determined, whether this region of the enzyme is supposed to move and if the change of
the distance is in the range of the Förster radius. The last two criteria were already inves-
tigated by Jasmina Dikic [105] and the residue located at position 153 was found to be
appropriate.
The introduction of the mutation and the subsequent labeling should not have an influence
on the binding and cleavage activity. By comparing the activity of the wild type enzymes
with that of the mutant enzymes (3.2.1.1) or with that of the labeled mutant enzymes
(3.2.1.3), it could be shown that neither the mutation nor the attachment of the fluorophore
had an influence on the binding or cleavage activity. The PEG-modification (3.2.1.2)
confirmed that the cysteine residues are located on the surface of the protein and thus are
accessible for labeling. Also the fluorescent labeling (3.2.1.3) was successfully, however
to a different extent for the three enzymes. The acceptor was added in excess in order to
increase the probability that every enzyme that carries a donor fluorophore carries also an
acceptor fluorophore. This strategy minimizes the number of enzymes that carry a donor
fluorophore only but it increases the number of enzymes that carry an acceptor fluoro-
phore only. Due to the acceptor crosstalk, the presence of the acceptor only labeled en-
zymes would lead to a higher acceptor signal and thus to a seemingly higher FRET effi-
ciency. For this reason, the FRET efficiency was corrected as described in 2.2.3.6.

4 Discussion 134
4.2.2 Studying the conformation of structurally different restriction
enzymes
Before comparing the linear diffusion behavior of the structurally different restriction
enzymes PvuII, EcoRV and BsoBI, it was necessary to elucidate, which conformation the
restriction enzymes adopt for sliding. Since linear diffusion takes places on non-specific
DNA, the conformation the enzyme adopts in the non-specific complex is the confor-
mation it uses for sliding [29]. Traditionally, X-ray crystallography is used to obtain struc-
tural information about an enzyme. However, this technique requires the presence of crys-
tals, which is often hard to achieve and extremely time-consuming. Additionally, one has
to keep in mind that crystal structures represent only a snapshot of a particular phase of a
dynamic process. So far, structural information about the non-specific complex is availa-
ble only for EcoRV [30] (and BamHI [29]). Since the non-specific complex structures of
PvuII and BsoBI are missing, a new strategy had to be found, which allows determining
the conformation of the non-specific complex in comparison to the apoenzyme and the
specific complex.
Förster resonance energy transfer (FRET) represents a powerful tool for monitoring dis-
tance changes and thereby conformational changes in proteins. It has many advantages
over X-ray crystallography since it is cheap, rapid and easy. A disadvantage of FRET is
that it is dependent on the photo-physical properties of the fluorophores. Thereby, obtain-
ing quantitative distances and deriving the three-dimensional structures remains ex-
tremely challenging. Several approaches for the determination of FRET efficiencies exist
in the literature [89,97], which differ in the measured species and the degree of correc-
tions. Among the intensity-based FRET approaches, one can distinguish between (i) ap-
proaches which rely on the measurement of the donor emission in the presence and ab-
sence of acceptor and (ii) approaches which rely on the measurement of the acceptor
emission after excitation of the donor. The first approach requires the presence of two
different species (one that carry only a donor fluorophore and another that carry a donor
and an acceptor fluorophore), the second requires the presence of only one species (that
carries a donor and an acceptor fluorophore). Since in this work donor and acceptor fluor-
ophore were coupled to two different subunits but in one protein, only the second ap-
proach turned out to be suitable. FRET measurements were performed with the single-
cysteine variants EcoRV D214C, PvuII D125C and BsoBI A153C.

4 Discussion 135
Proteins were single-labeled and randomly double-labeled with donor and acceptor fluor-
ophore (see 3.2.1.3) leading ideally to the introduction of the donor fluorophore in one
subunit and the acceptor fluorophore in the other subunit. Emission spectra were recorded
for the apoenzyme, the complex with non-specific and the complex with specific DNA in
the presence of either Ca2+- or Mg2+-ions or in the presence of EDTA and the FRET effi-
ciency was calculated (see 3.2.2).
First of all, some general statements can be made. The emission spectrum of the donor
only labeled protein (reference) showed only one maximum at 564 nm, the emission spec-
trum of the double-labeled protein (apoenzyme) showed two maxima at 564 nm and 666
nm. Since in both cases only the donor fluorophore was excited, the additional maximum
of the double-labeled protein at 666 nm could only result from energy transfer from the
donor to the acceptor fluorophore (and to a lower degree also from acceptor crosstalk; see
discussion below), indicating that the distance of the two fluorophores is within the
Förster distance (< 10 nm). The addition of either specific or non-specific DNA changed
the ratio of the two maxima (and thereby the FRET efficiency) to a different extent, in-
dicative of conformational changes of the protein upon DNA binding.
For all restriction enzymes, the effect on the change in FRET efficiency upon DNA bind-
ing was most pronounced in the presence of Ca2+-ions and only weak or non-existent for
EDTA and Mg2+-ions. The question arose, whether the enzymes are able to bind to the
oligonucleotides under the conditions used for the assay. For this reason, the binding af-
finity to these substrates was tested (3.2.2). The results showed indeed, that the binding
affinity in the presence of EDTA or Mg2+-ions is weaker than in the presence of Ca2+-
ions (the KD values for PvuII and non-specific DNA were for example 169 nM in the
presence of Ca2+-ions, 605 nM in the presence of EDTA and 2 µM in the presence of
Mg2+-ions). Nevertheless, the chosen concentrations of protein (50 nM) and the high ex-
cess of oligonucleotide (1 µM for EcoRV and BsoBI and 5 µM for PvuII) should lead to
an almost complete binding of the protein to the oligonucleotides under all conditions.
The oligonucleotides used in the FRET and binding experiments have exactly the same
sequence, the only difference is that the oligonucleotides that were used for binding ex-
periments were labeled with a HEX-fluorophore and the oligonucleotides that were used
for the FRET experiments were unlabeled.

4 Discussion 136
It is therefore possible that the presence of the HEX-fluorophore, however increased the
affinity to the labeled oligonucleotides and that the real affinity to the unlabeled oligonu-
cleotide was much lower. This would consequently mean that not all proteins were bound
in the presence of EDTA and Mg2+-ions, thereby a mixture of bound and unbound species
was measured. Since this two kind of species cannot be distinguished in an ensemble
measurement, only an average of the FRET efficiencies could be measured, leading to
the conclusion that only small conformational changes took place in the presence of
EDTA and Mg2+-ions. For this reason only the FRET efficiencies calculated in the pres-
ence of Ca2+-ions were considered for the evaluation, since in this case binding surely had
occurred.
As described in 2.2.3.6, FRET efficiencies were calculated in two different ways. In a
first approach, FRET efficiencies were directly calculated from the emission spectra by
dividing the acceptor emission intensity at 666 nm by the donor emission intensity at 564
nm (Table 28, Table 29 and Table 30). Due to the normalization of the emission spectra
to the maximum of donor emission at 564 nm, the FRET efficiency could be derived
directly from the height of the acceptor peak at 666 nm. For a comparison of the FRET
efficiencies instead, it was necessary to correct the acceptor emission intensity at 666 nm,
since this emission did not only result from energy transfer of the donor fluorophore. Two
other components contributed to the signal at 666 nm as well. On the one hand, the donor
itself was able to emit light at the emission maximum of the acceptor fluorophore, because
both emission maxima were not sufficiently separated (denoted as ‘donor bleed-through’
[89]). On the other hand, the acceptor could also be directly excited to a certain extent by
the excitation wavelength of donor, because of an overlap between the excitation spec-
trum of the acceptor and the excitation wavelength of the donor (denoted as ‘acceptor
crosstalk’ [89]). Thus, in a second approach, FRET efficiencies were calculated by divid-
ing the corrected acceptor emission at 666 nm by the donor emission at 564 nm (Table
32). The results showed that the corrected FRET efficiencies were lower than the directly
calculated FRET efficiencies (Ecorr < E). This was expected, since a subtraction of the
donor bleed through and acceptor crosstalk from the acceptor emission intensity led to a
decrease of the acceptor emission intensity and thereby to a decrease of the FRET effi-
ciency. The tendency or rather the proportions between apoenzyme, non-specific and spe-
cific protein-DNA complex remained the same.

4 Discussion 137
In order to finally evaluate the extent of DNA-binding cleft opening in the non-specific
complex, the corrected FRET efficiency of the non-specific complex was compared with
the corrected FRET efficiencies of the apoenzyme and the specific complex. Furthermore
it was examined if and to which extent the results of FRET measurements correspond
with the available crystal structures and the conformational changes described so far in
the literature.
PvuII D125C
The measurements revealed corrected FRET efficiencies of 0.22 for the apoenzyme, 0.31
for the non-specific complex and 0.59 for the specific complex, respectively (see Table
32 and Figure 62, orange numbers). By comparing apoenzyme and non-specific complex,
it can be seen that the FRET efficiency increased by 0.09, which means that the enzyme
closes its DNA-binding cleft slightly upon non-specific binding. Comparing apoenzyme
and specific complex, the FRET efficiency increased by 0.37, which means that the en-
zyme closes its DNA-binding cleft considerably upon specific binding. The difference
between non-specific and specific complex was found to be 0.28, which means that the
enzyme closes the DNA-binding cleft when switching from the non-specific to the spe-
cific binding mode and that the specific complex is more closed than the non-specific
complex. This first comparison showed that for sliding PvuII adopts a conformation
which is between the conformation of the apoenzyme and the specifically bound enzyme.
Since the difference between the non-specific complex and the apoenzyme (0.09) is much
smaller than the difference between the non-specific and the specific complex (0.28), it
can be concluded that the conformation of PvuII during sliding is more related to the
conformation of the apoenzyme. Since the conformation of the apoenzyme is extremely
open, it is assumed that PvuII uses also an open conformation for sliding.

4 Discussion 138
Figure 62: Summary of FRET efficiencies and distances for the restriction enzyme PvuII. FRET efficiencies and
FRET efficiency changes are indicated in orange, distances and distance changes are indicated in green. Note that the
distances of the apoenzyme (67 Å) and the specific complex (48 Å) are derived from crystal structures and that the
distance of the non-specific complex (62 Å) is estimated based on FRET efficiency comparison.
The results of the FRET measurements perfectly fit the available crystal structures of
PvuII. The distance in the crystal structure of the apoenzyme was found to be 67 Å [34],
whereas it was found to be 48 Å in the co-crystal structure of the specific complex
[35](see Table 27). This shows that the apoenzyme closes its DNA-binding cleft by 19 Å
upon specific binding, which can be perfectly correlated with an increase in the FRET
efficiency of 0.37. If a change of 19 Å can be considered equivalent to a change of 0.37
in the FRET efficiency, a change of 0.09 in the FRET efficiency should be equivalent to
5 Å and a change of 0.28 in the FRET efficiency should be equivalent to 14 Å estimated
by the rule of three. This means that the enzyme closes its DNA binding cleft by 5 Å upon
non-specific binding and closes by further 14 Å upon specific binding. With this compar-
ative analyses the distance in the non-specific complex can be predicted as 62 Å. The
distances and distance changes of PvuII are summarized in Figure 62 (green numbers).
The results of the FRET measurements perfectly fit the conformational changes described
so far in the literature for PvuII [23,27,34]. The crystal structure of the apoenzyme im-
plied that the DNA-binding cleft is too open to accommodate DNA with both subunits
simultaneously. Therefore, it was postulated that a contact of the L-AB loop with the
DNA stimulates closing of the DNA-binding cleft [34]. Indeed, the FRET measurements
showed that the enzyme closes the DNA-binding cleft slightly (by 5 Å) upon binding to
non-specific DNA. It can further be deduced that the enzyme remains in this relatively
open conformation during the sliding process and closes the DNA-binding cleft consid-
erably (by 14 Å) after binding to the specific recognition site.

4 Discussion 139
Furthermore, it can be seen that PvuII undergoes relatively large conformational changes,
which can be attributed to the fact that changes in the conformation of PvuII are mainly
characterized by quaternary conformational changes rather than by local conformational
changes (see 1.1.1.1). The motion of the two subunits occurs in a pure tongue-like motion,
which is characterized by a translation of the subunits that is nearly perpendicular to the
DNA axis [23]. This translation is characterized by a rotation of 46° around an axis almost
completely parallel to the DNA axis [23], which indicates a considerably opening/closing
movement around the DNA. This explains the large changes of FRET efficiencies. Local
conformational changes were not described for PvuII so far. The order and the degree of
conformational changes are summarized in Figure 63.
Figure 63: Summary of conformational changes of the restriction enzyme PvuII. The apoenzyme of PvuII has an
open conformation, which does not allow accommodating DNA with both subunits simultaneously. The contact of the
L-AB loop with the DNA molecule triggers a slight closing of the DNA-binding cleft. PvuII remains in this relatively
open conformation to slide along the DNA. The contact with the specific recognition site triggers the two subunits to
move toward each other in a tongue-like motion, thereby closing the DNA-binding cleft considerably.
EcoRV D214C
The measurements revealed corrected FRET efficiencies of 0.19 for the apoenzyme, 0.14
for the non-specific complex and 0.26 for the specific complex, respectively (see Table
32 and Figure 64, orange numbers). By comparing apoenzyme and non-specific complex,
it can be seen that the FRET efficiency decreased by 0.05, which means that the enzyme
slightly opens its DNA-binding cleft upon non-specific binding. Comparing apoenzyme
and specific complex, the FRET efficiency increased by 0.07, which means that the en-
zyme slightly closes its DNA-binding cleft upon specific binding. The difference between
non-specific and specific complex was found to be 0.12, which means that the enzyme
closes the DNA-binding cleft when switching from the non-specific to the specific bind-
ing mode and that the specific complex is more closed than the non-specific complex.

4 Discussion 140
This first comparison showed that for sliding EcoRV adopts a conformation which is
more open than the conformation of the apoenzyme and the specifically bound enzyme.
Since the differences between the non-specific complex, the apoenzyme and the specific
complex are marginal (0.05 - 0.12) and since the conformation of the apoenzyme and the
specific complex are both relatively closed, it is assumed that EcoRV uses also a more
closed conformation for sliding.
Figure 64: Summary of FRET efficiencies and calculated distances for the restriction enzyme EcoRV. FRET effi-
ciencies and FRET efficiency changes are indicated in orange, distances and distance changes are indicated in green.
At first sight, the results of the FRET measurements did not fit the available crystal struc-
tures of EcoRV. The distances in the crystal structures of the apoenzyme, the non-specific
and the specific complex were found to be 47 Å, 57 Å and 48 Å, respectively [30] (see
Table 27). It can be seen that the distance change between the apoenzyme and the non-
specific complex is relatively high (10 Å) whereas the distance change between the apo-
enzyme and the specific complex is extremely low (1 Å); the change in the FRET effi-
ciency however, was found to be similar (0.05 and 0.07). For this reason, the results of
the FRET measurements could not be reconciled with the available crystal structures of
Winkler only. Since for EcoRV several different crystal and co-crystal structures exist,
they were also measured regarding the distance of the two cysteine residues at position
214. For the apoenzyme, one further crystal structure exists (1AZ3) in which the distance
was found to be 51 Å [25], for the non-specific complex, also one further co-crystal struc-
ture exists (2BOD) in which the distance was found to be 50 Å [32] and for the specific
complex two further co-crystal structures exist (1B94 and 1EOP) in which the distances
were found to be 51 Å [98,99].

4 Discussion 141
The biggest difference between all these available structures exists for the non-specific
complex (57 Å in the Winkler structure vs. 50 Å in the Hiller structure) which can be
attributed to the fact that different non-specific oligonucleotides were used for crystalli-
zation (Winkler et al. used two 8mer duplexes, Hiller at al. used one 11mer duplex). The
FRET efficiencies could best be reconciled with a distance of 51 Å for the apoenzyme
(distance found in the structure of Perona [25]) and a distance of 48 Å for the specific
complex (distance found in the structure of Winkler [30]), resulting in a distance of 53 Å
for the non-specific complex which is right in the middle of the distances found in the
structure of Hiller and Winkler, respectively. Again, one has to keep in mind that a crystal
structure only represents a protein which has been frozen in a certain step of a dynamic
process, whereas in the FRET measurements the dynamic behavior of the proteins is pre-
served. Based on the above mentioned assumption, it can further be derived that the en-
zyme opens its DNA-binding cleft by 2 Å (equivalent to a FRET efficiency change of
0.05) upon non-specific binding and closes again by 5 Å (equivalent to a FRET efficiency
change of 0.07) upon specific binding. The distances and distance changes of EcoRV are
summarized in Figure 64 (green numbers).
The results of the FRET measurements perfectly fit the conformational changes described
so far in the literature for EcoRV [23,25,27,30,32]. The crystal structure of the apoenzyme
implied that the DNA-binding cleft is not sufficiently open to allow DNA entry. It was
therefore postulated that a contact of the C-terminal α-helices with the DNA stimulates
opening of the DNA-binding cleft [33]. Indeed, the FRET measurements showed that the
enzyme opens the DNA-binding cleft slightly (by 2 Å) upon binding to non-specific
DNA. It can further be deduced that the enzyme remains in this relatively closed confor-
mation during the sliding process and closes the DNA-binding cleft again slightly (by 5
Å) after binding to the specific recognition site. It can be seen that EcoRV undergoes
relatively small conformational changes, which can be attributed to the fact that changes
in the conformation of EcoRV are mainly characterized by local conformational changes
rather than by quaternary conformational changes as it postulated for PvuII. The motion
of the two subunits predominantly occurs in a scissor-like motion, which is characterized
by a translation of the subunits which is more parallel to the DNA axis [23]. This trans-
lation is characterized by a rotation of 23° around an axis more perpendicular to the DNA
axis [23], which indicates that the orientation of the subunits changes only slightly. This
explains also the small changes of the FRET efficiencies.

4 Discussion 142
The local conformational changes which especially occur in EcoRV (like ordering of the
Q- and the R-loop) cannot be detected with the FRET measurements. The order and the
degree of conformational changes are summarized in Figure 65.
Figure 65: Summary of conformational changes for the restriction enzyme EcoRV. The EcoRV apoenzyme has a
closed conformation, which does not allow DNA entry. The contact of the C-terminal α-helices with the DNA molecule
triggers a slight opening of the DNA-binding cleft. EcoRV remains in this relatively closed conformation to slide along
the DNA. The contact with the specific recognition site triggers the two subunits to move toward each other in a more
scissor-like motion, thereby closing the DNA-binding cleft again slightly.
BsoBI A153C
The measurements revealed corrected FRET efficiencies of 0.46 for the apoenzyme, 0.45
for the non-specific complex and 0.26 for the specific complex, respectively (see Table
32). By comparing apoenzyme and non-specific complex, it can be seen that the FRET
efficiency is almost identical, which suggests that the enzyme does not change its confor-
mation upon non-specific binding. Comparing apoenzyme and specific complex, the
FRET efficiency decreased by 0.20, which suggests that the enzyme opens its DNA-bind-
ing cleft upon specific binding. It also indicates that the specific complex is apparently
more open than the non-specific complex. Although the hypothesis that BsoBI undergoes
large conformational changes in order to allow DNA entry [36] could be confirmed
(FRET efficiency changed by 0.20 upon specific binding), the direction of the changes
was unexpected. It was expected that the FRET efficiency increases upon specific bind-
ing, which means that the enzyme closes its DNA-binding cleft, as it could be shown for
PvuII and EcoRV. Also previous experiments performed by Jasmina Dikic [105], includ-
ing steady-state ensemble as well as single-molecule measurements, revealed the same
unexpected results. It was concluded that the conformational changes in BsoBI cannot be
explained by a simple closing/opening of the DNA-binding cleft in a tongue- or scissor-
like movement, as it assumed for PvuII or EcoRV.

4 Discussion 143
The conformational changes could best be explained assuming a twisting-like motion of
the two subunits of BsoBI, by which upon specific binding the DNA-binding cleft closes
while the residues located at position 153 however move away from each other [105]. If
with this explanation, the DNA-binding cleft is considered to be closed in the specific
complex and open in the apoenzyme, this would consequently mean that the DNA-bind-
ing cleft is also open in the non-specific complex, since the FRET efficiencies of the
apoenzyme and the non-specific complex were found to be similar (0.46 vs. 0.45). No
change of the FRET efficiency upon binding to a non-specific 12 bp oligonucleotide has
been observed also by Jasmina Dikic in single-molecule experiments [105]. Interestingly,
the addition of a non-specific 39 bp oligonucleotide induced a decrease of the FRET ef-
ficiency, which in a twisting-like motion would mean a closing of the DNA-binding cleft.
It was therefore concluded that the conformation BsoBI uses for sliding is more closed
than the conformation of the apoenzyme [105]. It can be seen that the conformational
changes of BsoBI are more complex and cannot be explained by single FRET measure-
ments. A definitive answer regarding the non-specific complex of BsoBI requires further
experiments (e.g. labeling at different sites in the protein) or the solution of the crystal
structure. Nevertheless, it is not assumed that BsoBI greatly deviates from its ‘tunnel
conformation’, because a tunnel could be a strategy to promote linear diffusion [36].
However, it is assumed that the conformation BsoBI adopts for sliding is ‘tunnel-like’,
on the one hand closed enough to prevent falling off the DNA and on the other hand open
enough to prevent friction between the protein and the DNA.
Another interesting observation that could be made during the FRET measurements, is
that the apoenzyme of BsoBI and EcoRV exist in at least two different conformations in
solution, depending on the presence of divalent metal ions. It has been postulated earlier
that restriction enzymes oscillate between a ‘closed’ and an ‘open’ state [33,100]. How-
ever, these observations could not be made for PvuII. It is therefore possible that only
restriction enzymes whose DNA-binding cleft is not open enough to directly bind to DNA
(such as EcoRV and BsoBI) switch between different conformations in solution. Since
the DNA-binding cleft of PvuII is already open enough, no conformational changes in
solution are necessary.

4 Discussion 144
4.2.3 Studying linear diffusion of structurally different restriction
enzymes
Linear diffusion has been studied in detail for EcoRI [40,44] and more extensively for
EcoRV [31,45](see also 1.1.1.2). In these studies several aspects were investigated such
as the influence of the substrate length and the concentration of mono- and divalent cati-
ons on linear diffusion, the effect of obstacles and star sites, overlooking of specific sites,
reflection at the ends of DNA and the mechanism of product dissociation. So far not under
investigation was, whether linear diffusion depends on the structure of a restriction en-
zyme, especially on the conformation of the DNA-binding cleft. In this work the depend-
ence of linear diffusion on the substrate length and the salt concentration has been exam-
ined in a comparative manner for the structurally different restriction enzymes EcoRV,
PvuII and BsoBI. All enzymes are homodimeric 6 bp cutter but differ in the conformation
of their DNA-binding cleft (Figure 35). It seems reasonable to assume that the structural
features of the three enzymes will affect their ability to make use of linear diffusion. It
has been hypothesized that the more open the DNA-binding cleft, the smaller the contri-
bution of linear diffusion to target site location.
Substrate length dependence
It has been shown in earlier studies that the degree of linear diffusion depends on the
length of the DNA substrate [31,40,45]. To find out whether the substrate length depend-
ence is similar for the three enzymes, competitive cleavage experiments were carried out
under identical conditions.
The results showed that the cleavage rates of the long and the short fragment (klong and
kshort) and consequently the total cleavage rates (ktotal) decreased with increasing length of
the PCR fragment (Table 33, Table 34 and Table 35). This observation can be attributed
to the fact that the longer the PCR fragment the more non-specific DNA is present in the
reaction mixture, which reduces the concentration of free enzyme and thereby the cleav-
age rate (so called ‘trapping effect’ of non-specific DNA [101]). This effect was most
pronounced for BsoBI (ktotal was reduced from 2.01 min-1 for the 26mer to 0.299 min-1
for the 1488mer by a factor of 6.7) and less pronounced for EcoRV (factor 6.2) and PvuII
(factor 5.2), indicating that BsoBI can be trapped more effectively on non-specific DNA
than EcoRV and PvuII, which can be correlated with a longer residence time on non-
specific DNA. Further experiments revealed that the trapping effect of non-specific DNA
depends on the continuity of the DNA substrate.
4 Discussion 145
The 26mer was cleaved 3-times faster by BsoBI when the 958mer was digested prior to
the competitive cleavage reaction, although the same amount of non-specific DNA was
present in the reaction mixture (Table 36). Due to the fragmentation of the 958mer, less
BsoBI was trapped in a sliding movement on non-specific DNA and thereby more BsoBI
was available to cleave the 26mer which increased the cleavage rate. This revealed that
BsoBI can be trapped more effectively on long DNA substrates than on shorter ones,
suggesting that the residence time on long fragments is longer than on short fragments.
In case of EcoRV and PvuII instead, the 26mer was cleaved with nearly the same rate,
independent of whether the 958mer was digested prior to the competitive cleavage reac-
tion or not. This revealed that EcoRV and PvuII can be trapped on short and long frag-
ments equally well, suggesting that the residence time on long fragments is comparable
to that on short fragments.
Furthermore, the results showed that the cleavage of the long fragment was always faster
than the cleavage of the short fragment (klong > kshort), which can be attributed to a contri-
bution of linear diffusion to the searching process. kshort characterizes the rate of cleavage
resulting from direct binding to the specific site (3D-diffusion), whereas klong character-
izes the rate of cleavage resulting from initial non-specific binding and subsequent sliding
to the specific site (1D- and 3D-diffusion) (see also Figure 48). The probability that the
protein makes a direct collision with the specific site is low and it is more likely that the
initial contact will be non-specific. The following 1D-diffusion along non-specific DNA
effectively decreases the search volume of the protein which accelerates the location of
the target site. This property of long substrates is also referred to as ‘antenna effect’ of
non-specific DNA [101]. Further experiments showed that the antenna effect can be elim-
inated and linear diffusion thereby prevented. After digestion of the 958mer prior to the
competitive cleavage reaction, the short and the (fragmented) long substrate were cleaved
with essentially the same rate (klong = kshort), resulting from the fact that the predigested
958mers were cleaved much slower than the undigested 958mers. Due to the fragmenta-
tion of the 958mer, non-specific DNA could no longer serve as antenna and linear diffu-
sion could no longer contribute to the searching process, thereby reducing the rate of
cleavage.

4 Discussion 146
The above mentioned preferential cleavage of long substrates over the short ones, which
can also be expressed in the ratio of the cleavage rates (klong/kshort), was found to increase
with increasing length of the long substrate (see Figure 52). However, the dependence on
the substrate length was found to be different for the three enzymes, demonstrating that
linear diffusion is used to a different extent. The length dependence was most pronounced
for BsoBI (e.g. the 958mer was cleaved 5.79-times faster than the 26mer), second most
pronounced for EcoRV (e.g. the 958mer was cleaved 3.08-times faster than the 26mer)
and least pronounced for PvuII (e.g. the 958mer was cleaved 1.74-times faster than the
26mer), indicating that BsoBI is using the antenna effect of non-specific DNA most ef-
fectively to accelerate target location. The length dependence of (klong/kshort) is directly
relevant to the sliding length, which is the average number of base pairs scanned within
one binding event [102](Figure 66). If the length of the substrate is smaller than the slid-
ing length, (klong/kshort) is virtually proportional to the length of the substrate, because of
the antenna effect. Every binding event would lead to cleavage of the specific site. If the
length of the substrate is greater than the sliding length, not every binding event would
lead to cleavage of the specific site, since the probability increases that the enzyme dis-
sociates before finding the specific site by linear diffusion, which explains the asymptot-
ical dependence of (klong/kshort) on the substrate length. Accordingly, it can be derived
from Figure 52 that BsoBI scans more base pairs within one binding event than EcoRV
or PvuII.
Figure 66: Sliding length. After non-specific association to the DNA molecule (kon), the sliding length λ depends on
the probability that the enzyme slides one step (kdiff) rather than dissociates from the DNA (koff). The cleavage rate can
only be enhanced by linear diffusion, if dissociation is slow (low koff) or/and linear diffusion is fast (high kdiff).

4 Discussion 147
The fact that BsoBI is using linear diffusion to a higher degree than EcoRV and PvuII can
be attributed to the fact that BsoBI spends more time diffusing along non-specific DNA
and thereby is able to scan more base pairs within one binding event. A long residence
time (also called dwell time) on non-specific DNA should be reflected in the non-specific
binding constant (KD) of the enzymes.
The dwell time (τ) is related to dissociation rate constant (koff) by τ = 1/koff, which can be
calculated by koff = KD * kon from the non-specific binding constant (KD) (see Table 31),
assuming that the association rate constant (kon) is identical for the three enzymes and
diffusion controlled (kon = 108 M-1s-1). The calculations revealed an expected short dwell
time for PvuII (5 ms), the dwell time for BsoBI however, was not as long as expected (27
ms), instead EcoRV showed the longest dwell time (145 ms). There are different possi-
bilities how to explain the discrepancy. One possibility is that the association of BsoBI to
non-specific DNA is slower than assumed. This would make sense if one considers that
BsoBI has to open the DNA-binding cleft prior to binding. And indeed, it could be shown
in pre-steady state experiments that the association to a specific 39mer in the presence of
Mg2+-ions was slower than diffusion controlled (kon = 4.8 x 10⁶ M-1s-1) [105]. Recalculat-
ing the dwell time for BsoBI with this value of kon yields 557 ms, which is longer than
the dwell time of EcoRV. Another possibility is that the diffusion along the DNA (kdiff) is
much faster for BsoBI compared to EcoRV. If the dwell time of BsoBI is shorter than that
of EcoRV, BsoBI has to move much faster in order to scan the same amount of base pairs
within in one binding event. A third possibility is that the low binding affinity (and
thereby the short dwell time) is only valid for short substrates (for the determination of
KD a 16-bp oligonucleotide was used) and would be much higher for long substrates. This
theory is consistent with the finding that BsoBI could be trapped much better on long
substrates than on short ones (see 3.2.3.1). It would also explain why no conformational
changes could be observed in the presence of a non-specific 16mer but in the presence of
a non-specific 39mer [105]. Since BsoBI presumably forms a tunnel around non-specific
DNA, it is more likely that it falls-off the ends (which would happen faster if the substrate
is short) rather than opening the DNA-binding cleft. However, in order to elucidate which
of the three options is the correct one, further experiments are necessary to determine for
example the association rate constant (kon), the one-dimensional diffusion coefficient (D1)
and the dwell time (τ) on longer DNA substrates for BsoBI. But, regardless of what the
correct explanation is, it remains the fact that the sliding length of BsoBI is longer than
that of EcoRV and PvuII, indicating that BsoBI uses linear diffusion most effectively.

4 Discussion 148
Salt dependence
In early studies with EcoRI [40,42,43] and EcoRV [31,45] it was shown that the effect of
facilitated diffusion on target site location is salt dependent. To find out whether the salt
dependence is similar for the three enzymes, competitive cleavage experiments were car-
ried out in the presence of 20, 50, 100 and 200 mM NaCl under otherwise identical con-
ditions.
The salt dependence of linear diffusion can be ascribed to the fact that salt influences both
the non-specific binding constant (KD) and the one-dimensional diffusion coefficient
(D1). Both parameters influence the sliding length (see Figure 66) and thereby the effi-
ciency of linear diffusion. High salt concentrations are expected to increase KD, mainly
by increasing koff since the rate of association (kon) is only moderately affected by salt
[38]. A high koff leads to a shorter interaction time (τ) with the DNA, which reduces the
sliding length (λ) and thereby the efficiency of linear diffusion. The effect of salt on the
one-dimensional diffusion coefficient (D1) is controversial. It was first assumed that D1
would be independent of the salt concentration, since the protein remains in contact with
the DNA, hopping instead was expected to be dependent, since dissociation and re-asso-
ciation events are involved in the mechanism [71]. However, it could be shown in single-
molecule experiments [67] as well as in bulk ensemble measurements [101] that D1 in-
creased with increasing salt concentration. In the first instance this suggests that increas-
ing the salt concentration would increase the efficiency of linear diffusion, since a high
D1 increases the sliding length. Nevertheless, the experiments also revealed that in total
the sliding length and thereby the efficiency of linear diffusion was reduced with increas-
ing salt concentration [67,101], which implies that the negative effect on the interaction
time was much more pronounced than the positive effect on D1.
The results in Figure 58 showed that only the klong/kshort values for EcoRV continuously
decreased with increasing NaCl concentration, however Jeltsch et al. [31,45] found a
maximum for EcoRV at 50 mM NaCl. The klong/kshort values for PvuII only initially de-
creased (when increasing the NaCl concentration from 20 to 50 mM) and then remained
approximately at the same level, indicating that already NaCl concentrations > 50 mM
reduce the efficiency of linear diffusion considerably. In contrast, such a low efficiency
of linear diffusion (klong/kshort ≈ 1.8) was seen with EcoRV and BsoBI only at a NaCl
concentration > 200 mM.

4 Discussion 149
The klong/kshort values for BsoBI initially increased (when increasing the NaCl concentra-
tion from 20 to 50 mM) and then continuously decreased with increasing NaCl concen-
tration, indicating that the efficiency of linear diffusion is reduced at NaCl concentrations
< 50 mM and > 150 mM. Low salt concentrations should normally increase the efficiency
of linear diffusion. On the other hand, one has to consider that salt has the function of
balancing electrostatic interactions or hydrogen bonds between the protein and the DNA.
If they are unbalanced, binding between protein and DNA becomes too strong and in-
creases the friction. In order to move on, interactions have to be broken which reduces
the rate of linear diffusion [31,45].
The results showed indeed that the salt dependence of linear diffusion is different for the
three enzymes. This was expected since all enzymes have a different protein-DNA inter-
face with different hydrogen bonds and electrostatic interactions. Between 50 and 100
mM NaCl the efficiency of linear diffusion remained mostly the same for each enzyme.
Decreasing the NaCl concentration to 20 mM led to either a higher degree of linear dif-
fusion for PvuII or to a lower degree of linear diffusion for BsoBI. At 200 mM NaCl
facilitated diffusion is much less effective than at 100 mM NaCl for all enzymes, indicat-
ing that ionic strength above the physiological value (150 mM) reduces the effectiveness
of facilitated diffusion considerably.
Structure dependence
The structure dependence of linear diffusion can be studied particularly well if one intro-
duces structural changes into the same enzyme. This has been done already for EcoRV,
where individual hydrogen bond acceptors or donors and positive charges had been re-
moved from the DNA-binding cleft of the protein, leading to variants for which linear
diffusion was impaired or even abolished [31]. In this work the effect of a defined struc-
tural change was investigated (see Figure 59).
The results in Table 40 showed that small as well as large structural changes influenced
the efficiency of linear diffusion. By fusing EcoRV to the elongated protein scRM6 the
hydrodynamic radius was increased. It could be shown in single-molecule experiments
that the one-dimensional diffusion coefficient (D1) of the fusion protein was reduced by
a factor of 4 compared to EcoRV (see 3.1.4 and [90]). This observation could now be
confirmed by ensemble measurements since the fusion protein showed a lower value of
klong/kshort compared to wild type EcoRV, indicating that the efficiency of linear diffusion
was reduced.

4 Discussion 150
By connecting the two subunits of PvuII with a short peptide linker the DNA-binding
cleft became more closed (the distance of the symmetry-related cysteine residues at po-
sition 125 decreased from 67 Å in PvuII to 58 Å in scPvuII) [93]. It could be shown that
the klong/kshort values for scPvuII were larger than for wild type PvuII, indicating that this
small change allows scPvuII to make better use of linear diffusion than the wild type. In
addition, this observation confirms the above mentioned hypothesis.
Final conclusion
The results of the linear diffusion analysis (3.2.3) perfectly fit the results of the confor-
mation analysis (3.2.2) and confirm the hypothesis that restriction enzymes with a rela-
tively open DNA-binding cleft make less use of linear diffusion than enzymes with a
more closed DNA- binding cleft.
PvuII was found to adopt an open conformation while sliding along the DNA and showed
the lowest degree of linear diffusion. Conformational changes in PvuII are characterized
by rigid body motions in a tongue-like movement, which are supposed to facilitate fast
association and dissociation [27]. Additionally, it could be shown for PvuII that only
small conformational changes are needed to associate with or dissociate from non-spe-
cific DNA (slight closing/opening of the DNA-binding cleft). This suggests that the prob-
ability of dissociation is much higher than the probability of linear diffusion, resulting in
a shorter interaction time with non-specific DNA (which has been confirmed by a high
KD for PvuII) and consequently in a shorter sliding length and a low degree of linear
diffusion. Additionally, a search mechanism consisting of mainly association and disso-
ciation events is supposed to be more impaired by salt than a pure sliding mechanism.
This explains why already small salt concentrations (> 50 mM) decreased the interaction
time and consequently the degree of linear diffusion.
EcoRV was found to adopt a more closed conformation while sliding along the DNA and
showed a higher degree of linear diffusion than PvuII. Conformational changes in EcoRV
are characterized mainly by local rearrangements and only few by rigid body motions in
a scissor-like movement. Such motions are not supposed to facilitate fast association and
dissociation. This suggests that the probability of linear diffusion is much higher than the
probability of dissociation, resulting in a longer interaction time with non-specific DNA
(which has been confirmed by a low KD for EcoRV) and consequently in a longer sliding
length and a higher degree of linear diffusion. Due to a different mechanism, the degree
of linear diffusion was affected only at salt concentrations > 150 mM.

4 Discussion 151
For BsoBI it was assumed that it adopts a closed (‘tunnel-like’) conformation while slid-
ing along the DNA and showed the highest degree of linear diffusion. The exact confor-
mational changes in BsoBI are not known so far, since only the crystal structure of the
specific complex is available, but it was assumed that changes appear in a twisting-like
motion [105]. Nevertheless, these kind of motions are not supposed to facilitate fast as-
sociation and dissociation. Once wrapped around the DNA, it seems more likely that
BsoBI diffuses along the DNA rather changes again the conformation in order to disso-
ciate from the DNA. This results in a longer interaction time with non-specific DNA and
consequently in a longer sliding length and a higher degree of linear diffusion. A close
contact between protein and DNA also explains the finding that linear diffusion was de-
creased for BsoBI at low salt concentrations. In this case the reducing effect of low salt
concentrations on the one-dimensional diffusion coefficient predominates, leading to a
higher friction and a lower degree of linear diffusion.
Figure 67: Summary of the properties of structurally different restriction enzymes.
It has been proposed that the structural basis for linear diffusion is that the enzyme partly
wraps around the DNA and that both components are hold together by electrostatic inter-
actions and hydrogen bonds [31]. By the comparison of structurally different restriction
enzymes, it can be further assumed that the wrapping around the DNA might be a strategy
of the enzyme to stay in longer contact with the DNA. The more pronounced the wrap-
ping, the longer the interaction time and the higher the contribution of linear diffusion to
the mechanism of target site location.

5 Summary 152
5 Summary
Many biological functions depend on interactions between DNA and site-specific DNA-
binding proteins, which must locate their specific target site within a high excess of non-
specific sites. Several proteins make use of a process called facilitated diffusion, which is
based on translocations of the protein along non-specific DNA and accelerates target site
location. Different mechanisms involved in facilitated diffusion, such as sliding, hopping
or jumping and intersegment transfer, have been discussed. Type II restriction enzymes
are model systems for studying protein-DNA interactions and their target search mecha-
nism has been investigated intensively by bulk ensemble as well as by single-molecules
experiments. Two open questions related to the sliding (linear diffusion) mechanism of
Type II restriction enzymes have been addressed in this work.
The first aim of this work was to investigate whether the sliding mechanism of Type II
restriction enzymes is coupled to rotation. To this end, different variants of an ‘elongated’
restriction enzyme, consisting of EcoRV and the quasi-linear protein scRM6, have been
prepared. Two important prerequisites for the visualization of rotational motion are: a
preserved activity and a correct spatial orientation. Binding- and cleavage experiments
demonstrated that the activity could be preserved, although being reduced by one to two
orders of magnitude compared to EcoRV alone. FRET measurements however revealed
that the extension component scRM6 is not maximally stretched out and hence the spatial
orientation is not optimal. Rotational movement of the fusion protein scRM6-EcoRV
could successfully be demonstrated indirectly by measuring the linear diffusion coeffi-
cient (D1) using single-molecule experiments and comparing it to theoretical models.
However, direct visualization of rotational movement using super-resolution microscopy
has not been possible due to suboptimal spatial orientation of the fusion protein and speed
and randomness of the diffusional motion.
The second aim of this work was to investigate whether the structure of a restriction en-
zyme influences the degree of sliding. To this end, the structurally different Type II re-
striction enzymes PvuII, EcoRV and BsoBI were compared regarding their conformation
in complex with DNA and their ability to make use of linear diffusion. It was hypothe-
sized that the more open the enzyme-DNA complex, the less linear diffusion is used by
the enzyme. FRET measurements were performed to elucidate the conformation of the
restriction enzyme in complex with non-specific DNA (sliding conformation), especially
the extent of opening of the DNA-binding cleft. The measurements revealed that PvuII
5 Summary 153
adopts and open conformation for sliding, whereas EcoRV and BsoBI adopt a more
closed conformation. Conventional kinetic methods were performed to investigate the
linear diffusion behavior and revealed that linear diffusion is used most effectively by
BsoBI to speed up target site location and less effectively by EcoRV and PvuII. Addi-
tionally, it could be demonstrated that the ionic strength dependence of linear diffusion is
different for the three enzymes. Enzymes with an open conformation (PvuII) are more
affected by salt than enzymes with a more closed conformation (EcoRV, BsoBI). The
results of the conformation analysis could be perfectly correlated with the results of the
linear diffusion analysis and confirmed the hypothesis that restriction enzymes with a
relatively open DNA-binding cleft make less use of linear diffusion than enzymes with a
more closed DNA-binding cleft. The hypothesis could be further confirmed by studying
the linear diffusion behavior of enzyme variants in which a defined structural change had
been introduced.

6 Zusammenfassung 154
6 Zusammenfassung
Viele biologische Funktionen hängen von Wechselwirkungen zwischen DNA und spezi-
fischen DNA-Bindungproteinen ab, die ihre spezifische Zielsequenz im hohen Über-
schuss nicht-spezifischer Sequenzen auffinden müssen. Verschiedene Proteine haben ei-
nen Prozess namens ‚erleichterter Diffusion‘ entwickelt, der auf einer Translokation des
Proteins entlang nicht-spezifischer DNA beruht und das Auffinden der Zielsequenz be-
schleunigt. Verschiedene Mechanismen der erleichterten Diffusion, wie z.B. Gleiten,
Hüpfen oder Springen und Intersegmenttransfer, wurden diskutiert. Typ II-Restriktions-
enzyme dienen als Modellsysteme für die Untersuchung von Protein-DNA Wechselwir-
kungen und ihr Suchmechanismus wurde bereits intensiv durch ‚Bulk-Ensemble‘ sowie
durch Einzelmolekülexperimente untersucht. Zwei offene Fragen im Zusammenhang mit
dem Gleitmechanismus (lineare Diffusion) der Typ II-Restriktionsenzyme wurden in die-
ser Arbeit adressiert.
Das erste Ziel dieser Arbeit war es zu untersuchen, ob der Gleitmechanismus von Typ II-
Restriktionsenzymen mit einer Rotationsbewegung verbunden ist. Hierzu sind verschie-
dene Varianten eines ‚verlängerten‘ Restriktionsenzyms, bestehend aus EcoRV und dem
quasi-linearen Protein scRM6, hergestellt worden. Zwei wichtige Voraussetzungen für
die Visualisierung einer Rotationsbewegung sind: eine konservierte Aktivität und eine
korrekte räumliche Orientierung. Bindungs- und Spaltexperimente zeigten, dass die Ak-
tivität bewahrt werden konnte, wenn sie auch im Vergleich zu EcoRV alleine um ein bis
zwei Größenordnungen reduziert war. FRET-Messungen zeigten hingegen, dass die ‚Er-
weiterungskomponente‘ scRM6 nicht maximal ausgestreckt und damit die räumliche Ori-
entierung nicht optimal ist. Die Rotationsbewegung des Fusionsproteins scRM6-EcoRV
konnte erfolgreich durch Messung des linearen Diffusionskoeffizienten (D1) unter Ver-
wendung von Einzelmolekülmessungen und dem Vergleich mit theoretischen Modellen
indirekt nachgewiesen werden. Allerdings war die direkte Visualisierung der Rotations-
bewegung mittels superhochauflösender Mikroskopie aufgrund der suboptimalen räum-
lichen Orientierung des Fusionsproteins und der Geschwindigkeit sowie zufälligen Rich-
tung der diffusen Bewegung nicht möglich.
Das zweite Ziel dieser Arbeit war es zu untersuchen, ob die Struktur eines Restriktions-
enzyms das Ausmaß des Gleitens beeinflussen kann. Zu diesem Zweck wurden die struk-
turell unterschiedlichen Typ II-Restriktionsenzyme PvuII, EcoRV und BsoBI hinsichtlich

6 Zusammenfassung 155
ihrer Konformation im Komplex mit DNA und ihrer Fähigkeit zur Verwendung von li-
nearer Diffusion verglichen. Es wurde angenommen, dass je offener der Enzym-DNA
Komplex ist, desto weniger lineare Diffusion durch das Enzym verwendet wird. FRET-
Messungen wurden durchgeführt um die Konformation des Restriktionsenzyms im Kom-
plex mit nicht-spezifischer DNA (Konformation des Gleitens), insbesondere das Ausmaß
der Öffnung der DNA-Bindungsspalte, aufzuklären. Die Messungen ergaben, dass PvuII
eine offene Konformation zum Gleiten einnimmt, während EcoRV und BsoBI eine eher
geschlossene Konformation einnehmen. Konventionelle kinetische Methoden wurden
verwendet, um das lineare Diffusionsverhalten zu untersuchen und zeigten, dass lineare
Diffusion am effektivsten von BsoBI zur beschleunigten Auffindung der Zielsequenz ver-
wendet wird und weniger effektiv durch EcoRV und PvuII. Darüber hinaus konnte ge-
zeigt werden, dass die drei Enzyme eine unterschiedliche Ionenstärkeabhängigkeit in Be-
zug auf lineare Diffusion aufweisen. Enzyme mit einer offenen Konformation (PvuII)
werden stärker in ihrem linearen Diffusionsvermögen von Salz beeinflusst als Enzyme
mit einer eher geschlossenen Konformation (EcoRV, BsoBI). Die Ergebnisse der Kon-
formationsanalyse konnten perfekt mit den Ergebnissen der linearen Diffusionsanalyse in
Einklang gebracht werden und die Hypothese, dass Restriktionsenzyme mit einer relativ
offenen DNA-Bindungsspalte mehr Gebrauch von linearer Diffusion machen als Enzyme
mit einer geschlossenen DNA-Bindungsspalte, bestätigen. Die Hypothese konnte durch
Untersuchungen des linearen Diffusionsverhaltens von Enzymvarianten, in denen eine
definierte Strukturänderung eingeführt wurde, weiter bestätigt werden.

7 References 156
7 References
1. Anderson, J.E. (1993) Restriction endonucleases and modification methylases.
Curr. Opin. Struct. Biol., 3, 24-30.
2. Raleigh, E.A. and Brooks, J.E. (1998) In De Bruijn, F. J., Lupski, J. R. and
Weinstock, G. M. (eds.), Bacterial Genomes. Chapman & Hall, New York, pp.
78-92.
3. Van Etten, J.L. (2003) Unusual life style of giant chlorella viruses. Annu. Rev.
Genet., 37, 153-195.
4. Jeltsch, A. (2002) Beyond Watson and Crick: DNA methylation and molecular
enzymology of DNA methyltransferases. Chembiochem, 3, 274-293.
5. Sistla, S. and Rao, D.N. (2004) S-Adenosyl-L-methionine-dependent restriction
enzymes. Crit. Rev. Biochem. Mol. Biol., 39, 1-19.
6. Bheemanaik, S., Reddy, Y.V. and Rao, D.N. (2006) Structure, function and
mechanism of exocyclic DNA methyltransferases. Biochem. J., 399, 177-190.
7. Smith, H.O. and Nathans, D. (1973) Letter: A suggested nomenclature for
bacterial host modification and restriction systems and their enzymes. J. Mol.
Biol., 81, 419-423.
8. Roberts, R.J., Belfort, M., Bestor, T., Bhagwat, A.S., Bickle, T.A., Bitinaite, J.,
Blumenthal, R.M., Degtyarev, S., Dryden, D.T., Dybvig, K. et al. (2003) A
nomenclature for restriction enzymes, DNA methyltransferases, homing
endonucleases and their genes. Nucleic Acids Res., 31, 1805-1812.
9. Loenen, W.A., Dryden, D.T., Raleigh, E.A., Wilson, G.G. and Murray, N.E.
(2014) Highlights of the DNA cutters: a short history of the restriction enzymes.
Nucleic Acids Res., 42, 3-19.
10. Murray, N.E. (2000) Type I restriction systems: sophisticated molecular machines
(a legacy of Bertani and Weigle). Microbiol. Mol. Biol. Rev., 64, 412-434.
11. Loenen, W.A., Dryden, D.T., Raleigh, E.A. and Wilson, G.G. (2014) Type I
restriction enzymes and their relatives. Nucleic Acids Res., 42, 20-44.
12. Pingoud, A., Wilson, G.G. and Wende, W. (2014) Type II restriction
endonucleases--a historical perspective and more. Nucleic Acids Res., 42, 7489-
7527.
13. McCleland, S.E. and Sczcelkun, M.D. (2004) In Pingoud, A. (ed.), Restriction
Endonucleases. Springer, Berlin, pp. 111-135.
14. Rao, D.N., Dryden, D.T. and Bheemanaik, S. (2014) Type III restriction-
modification enzymes: a historical perspective. Nucleic Acids Res., 42, 45-55.
15. Loenen, W.A. and Raleigh, E.A. (2014) The other face of restriction:
modification-dependent enzymes. Nucleic Acids Res., 42, 56-69.
16. Pingoud, A. and Jeltsch, A. (1997) Recognition and cleavage of DNA by type-II
restriction endonucleases. Eur. J. Biochem., 246, 1-22.
17. Pingoud, A. and Jeltsch, A. (2001) Structure and function of type II restriction
endonucleases. Nucleic Acids Res., 29, 3705-3727.

7 References 157
18. Pingoud, A., Fuxreiter, M., Pingoud, V. and Wende, W. (2005) Type II restriction
endonucleases: structure and mechanism. Cell. Mol. Life Sci., 62, 685-707.
19. Venclovas, C., Timinskas, A. and Siksnys, V. (1994) Five-stranded beta-sheet
sandwiched with two alpha-helices: a structural link between restriction
endonucleases EcoRI and EcoRV. Proteins, 20, 279-282.
20. Aggarwal, A.K. (1995) Structure and function of restriction endonucleases. Curr.
Opin. Struct. Biol., 5, 11-19.
21. Huai, Q., Colandene, J.D., Chen, Y., Luo, F., Zhao, Y., Topal, M.D. and Ke, H.
(2000) Crystal structure of NaeI - an evolutionary bridge between DNA
endonuclease and topoisomerase. EMBO J., 19, 3110-3118.
22. Sussman, J.L., Lin, D., Jiang, J., Manning, N.O., Prilusky, J., Ritter, O. and Abola,
E.E. (1998) Protein Data Bank (PDB): database of three-dimensional structural
information of biological macromolecules. Acta Crystallogr D Biol Crystallogr,
54, 1078-1084.
23. Little, E.J. and Horton, N.C. (2005) DNA-induced conformational changes in type
II restriction endonucleases: the structure of unliganded HincII. J. Mol. Biol., 351,
76-88.
24. Newman, M., Strzelecka, T., Dorner, L.F., Schildkraut, I. and Aggarwal, A.K.
(1995) Structure of Bam HI endonuclease bound to DNA: partial folding and
unfolding on DNA binding. Science, 269, 656-663.
25. Perona, J.J. and Martin, A.M. (1997) Conformational transitions and structural
deformability of EcoRV endonuclease revealed by crystallographic analysis. J.
Mol. Biol., 273, 207-225.
26. Scheuring-Vanamee, E., Viadiu, H., Lukacs, C.M. and Aggarwal, A.K. (2004) In
Pingoud, A. (ed.), Restriction Endonucleases. Springer, Berlin, pp. 215-236.
27. Uyar, A., Kurkcuoglu, O., Nilsson, L. and Doruker, P. (2011) The elastic network
model reveals a consistent picture on intrinsic functional dynamics of type II
restriction endonucleases. Phys. Biol., 8, 056001.
28. Lukacs, C.M., Kucera, R., Schildkraut, I. and Aggarwal, A.K. (2001) Structure of
free BglII reveals an unprecedented scissor-like motion for opening an
endonuclease. Nat. Struct. Biol., 8, 126-130.
29. Viadiu, H. and Aggarwal, A.K. (2000) Structure of BamHI bound to nonspecific
DNA: A model for DNA sliding. Mol. Cell, 5, 889-895.
30. Winkler, F.K., Banner, D.W., Oefner, C., Tsernoglou, D., Brown, R.S.,
Heathman, S.P., Bryan, R.K., Martin, P.D., Petratos, K. and Wilson, K.S. (1993)
The crystal structure of EcoRV endonuclease and of its complexes with cognate
and non-cognate DNA fragments. EMBO J., 12, 1781-1795.
31. Jeltsch, A., Wenz, C., Stahl, F. and Pingoud, A. (1996) Linear diffusion of the
restriction endonuclease EcoRV on DNA is essential for the in vivo function of
the enzyme. EMBO J., 15, 5104-5111.
32. Hiller, D.A., Rodriguez, A.M. and Perona, J.J. (2005) Non-cognate enzyme-DNA
complex: structural and kinetic analysis of EcoRV endonuclease bound to the
EcoRI recognition site GAATTC. J. Mol. Biol., 354, 121-136.
7 References 158
33. Schulze, C., Jeltsch, A., Franke, I., Urbanke, C. and Pingoud, A. (1998)
Crosslinking the EcoRV restriction endonuclease across the DNA-binding site
reveals transient intermediates and conformational changes of the enzyme during
DNA binding and catalytic turnover. EMBO J., 17, 6757-6766.
34. Athanasiadis, A., Vlassi, M., Kotsifaki, D., Tucker, P.A., Wilson, K.S. and
Kokkinidis, M. (1994) Crystal structure of PvuII endonuclease reveals extensive
structural homologies to EcoRV. Nat. Struct. Biol., 1, 469-475.
35. Cheng, X., Balendiran, K., Schildkraut, I. and Anderson, J.E. (1994) Structure of
PvuII endonuclease with cognate DNA. EMBO J., 13, 3927-3935.
36. van der Woerd, M.J., Pelletier, J.J., Xu, S. and Friedman, A.M. (2001) Restriction
enzyme BsoBI-DNA complex: a tunnel for recognition of degenerate DNA
sequences and potential histidine catalysis. Structure (Camb.), 9, 133-144.
37. von Hippel, P.H. and Berg, O.G. (1989) Facilitated target location in biological
systems. J. Biol. Chem., 264, 675-678.
38. Halford, S.E. and Marko, J.F. (2004) How do site-specific DNA-binding proteins
find their targets? Nucleic Acids Res., 32, 3040-3052.
39. Jeltsch, A. and Urbanke, C. (2004) In Pingoud, A. (ed.), Restriction
Endonucleases. Springer, Berlin, pp. 95-110.
40. Ehbrecht, H.J., Pingoud, A., Urbanke, C., Maass, G. and Gualerzi, C. (1985)
Linear diffusion of restriction endonucleases on DNA. J. Biol. Chem., 260, 6160-
6166.
41. Winter, R.B., Berg, O.G. and von Hippel, P.H. (1981) Diffusion-driven
mechanisms of protein translocation on nucleic acids. 3. The Escherichia coli lac
repressor--operator interaction: kinetic measurements and conclusions.
Biochemistry, 20, 6961-6977.
42. Jack, W.E., Terry, B.J. and Modrich, P. (1982) Involvement of outside DNA
sequences in the major kinetic path by which EcoRI endonuclease locates and
leaves its recognition sequence. Proc. Natl. Acad. Sci. U. S. A., 79, 4010-4014.
43. Terry, B.J., Jack, W.E. and Modrich, P. (1985) Facilitated diffusion during
catalysis by EcoRI endonuclease. Nonspecific interactions in EcoRI catalysis. J.
Biol. Chem., 260, 13130-13137.
44. Jeltsch, A., Alves, J., Wolfes, H., Maass, G. and Pingoud, A. (1994) Pausing of
the restriction endonuclease EcoRI during linear diffusion on DNA. Biochemistry,
33, 10215-10219.
45. Jeltsch, A. and Pingoud, A. (1998) Kinetic characterization of linear diffusion of
the restriction endonuclease EcoRV on DNA. Biochemistry, 37, 2160-2169.
46. Stanford, N.P., Szczelkun, M.D., Marko, J.F. and Halford, S.E. (2000) One- and
three-dimensional pathways for proteins to reach specific DNA sites. EMBO J.,
19, 6546-6557.
47. Halford, S.E. and Szczelkun, M.D. (2002) How to get from A to B: strategies for
analysing protein motion on DNA. Eur. Biophys. J., 31, 257-267.
48. Townson, S.A., Samuelson, J.C., Bao, Y., Xu, S.Y. and Aggarwal, A.K. (2007)
BstYI bound to noncognate DNA reveals a "hemispecific" complex: implications
for DNA scanning. Structure, 15, 449-459.

7 References 159
49. Singer, P. and Wu, C.W. (1987) Promoter search by Escherichia coli RNA
polymerase on a circular DNA template. J. Biol. Chem., 262, 14178-14189.
50. Ricchetti, M., Metzger, W. and Heumann, H. (1988) One-dimensional diffusion
of Escherichia coli DNA-dependent RNA polymerase: a mechanism to facilitate
promoter location. Proc. Natl. Acad. Sci. U. S. A., 85, 4610-4614.
51. Surby, M.A. and Reich, N.O. (1996) Facilitated diffusion of the EcoRI DNA
methyltransferase is described by a novel mechanism. Biochemistry, 35, 2209-
2217.
52. Surby, M.A. and Reich, N.O. (1996) Contribution of facilitated diffusion and
processive catalysis to enzyme efficiency: implications for the EcoRI restriction-
modification system. Biochemistry, 35, 2201-2208.
53. Berg, O.G., Winter, R.B. and von Hippel, P.H. (1981) Diffusion-driven
mechanisms of protein translocation on nucleic acids. 1. Models and theory.
Biochemistry, 20, 6929-6948.
54. Lieberman, B.A. and Nordeen, S.K. (1997) DNA intersegment transfer, how
steroid receptors search for a target site. J. Biol. Chem., 272, 1061-1068.
55. Coleman, R.A. and Pugh, B.F. (1995) Evidence for functional binding and stable
sliding of the TATA binding protein on nonspecific DNA. J. Biol. Chem., 270,
13850-13859.
56. Joo, C., Balci, H., Ishitsuka, Y., Buranachai, C. and Ha, T. (2008) Advances in
single-molecule fluorescence methods for molecular biology. Annu. Rev.
Biochem., 77, 51-76.
57. Bustamante, C. (2008) In singulo biochemistry: when less is more. Annu. Rev.
Biochem., 77, 45-50.
58. Orrit, M. and Bernard, J. (1990) Single pentacene molecules detected by
fluorescence excitation in a p-terphenyl crystal. Phys Rev Lett, 65, 2716-2719.
59. Haustein, E. and Schwille, P. (2004) Single-molecule spectroscopic methods.
Curr. Opin. Struct. Biol., 14, 531-540.
60. Wozniak, A.K., Schroder, G.F., Grubmuller, H., Seidel, C.A. and Oesterhelt, F.
(2008) Single-molecule FRET measures bends and kinks in DNA. Proc. Natl.
Acad. Sci. U. S. A., 105, 18337-18342.
61. Margittai, M., Widengren, J., Schweinberger, E., Schroder, G.F., Felekyan, S.,
Haustein, E., Konig, M., Fasshauer, D., Grubmuller, H., Jahn, R. et al. (2003)
Single-molecule fluorescence resonance energy transfer reveals a dynamic
equilibrium between closed and open conformations of syntaxin 1. Proc. Natl.
Acad. Sci. U. S. A., 100, 15516-15521.
62. Gorman, J. and Greene, E.C. (2008) Visualizing one-dimensional diffusion of
proteins along DNA. Nat. Struct. Mol. Biol., 15, 768-774.
63. van den Broek, B., Noom, M.C. and Wuite, G.J. (2005) DNA-tension dependence
of restriction enzyme activity reveals mechanochemical properties of the reaction
pathway. Nucleic Acids Res., 33, 2676-2684.
64. Biebricher, A., Wende, W., Escude, C., Pingoud, A. and Desbiolles, P. (2009)
Tracking of single quantum dot labeled EcoRV sliding along DNA manipulated
by double optical tweezers. Biophys. J., 96, L50-52.

7 References 160
65. Herbert, K.M., Greenleaf, W.J. and Block, S.M. (2008) Single-molecule studies
of RNA polymerase: motoring along. Annu. Rev. Biochem., 77, 149-176.
66. Crut, A., Koster, D.A., Seidel, R., Wiggins, C.H. and Dekker, N.H. (2007) Fast
dynamics of supercoiled DNA revealed by single-molecule experiments. Proc.
Natl. Acad. Sci. U. S. A., 104, 11957-11962.
67. Bonnet, I., Biebricher, A., Porte, P.L., Loverdo, C., Benichou, O., Voituriez, R.,
Escude, C., Wende, W., Pingoud, A. and Desbiolles, P. (2008) Sliding and
jumping of single EcoRV restriction enzymes on non-cognate DNA. Nucleic
Acids Res., 36, 4118-4127.
68. Kim, J.H. and Larson, R.G. (2007) Single-molecule analysis of 1D diffusion and
transcription elongation of T7 RNA polymerase along individual stretched DNA
molecules. Nucleic Acids Res., 35, 3848-3858.
69. Wang, Y.M., Austin, R.H. and Cox, E.C. (2006) Single molecule measurements
of repressor protein 1D diffusion on DNA. Phys Rev Lett, 97, 048302.
70. Graneli, A., Yeykal, C.C., Robertson, R.B. and Greene, E.C. (2006) Long-
distance lateral diffusion of human Rad51 on double-stranded DNA. Proc. Natl.
Acad. Sci. U. S. A., 103, 1221-1226.
71. Blainey, P.C., van Oijen, A.M., Banerjee, A., Verdine, G.L. and Xie, X.S. (2006)
A base-excision DNA-repair protein finds intrahelical lesion bases by fast sliding
in contact with DNA. Proc. Natl. Acad. Sci. U. S. A., 103, 5752-5757.
72. Gorman, J., Chowdhury, A., Surtees, J.A., Shimada, J., Reichman, D.R., Alani,
E. and Greene, E.C. (2007) Dynamic basis for one-dimensional DNA scanning by
the mismatch repair complex Msh2-Msh6. Mol. Cell, 28, 359-370.
73. Tafvizi, A., Huang, F., Leith, J.S., Fersht, A.R., Mirny, L.A. and van Oijen, A.M.
(2008) Tumor suppressor p53 slides on DNA with low friction and high stability.
Biophys. J., 95, L01-03.
74. Schurr, J.M. (1979) The one-dimensional diffusion coefficient of proteins
absorbed on DNA. Hydrodynamic considerations. Biophys. Chem., 9, 413-414.
75. Bagchi, B., Blainey, P.C. and Xie, X.S. (2008) Diffusion constant of a
nonspecifically bound protein undergoing curvilinear motion along DNA. J Phys
Chem B, 112, 6282-6284.
76. Blainey, P.C., Luo, G., Kou, S.C., Mangel, W.F., Verdine, G.L., Bagchi, B. and
Xie, X.S. (2009) Nonspecifically bound proteins spin while diffusing along DNA.
Nat. Struct. Mol. Biol., 16, 1224-1229.
77. Bonnet, I. and Desbiolles, P. (2011) The diffusion constant of a labeled protein
sliding along DNA. The European physical journal. E, Soft matter, 34, 1-10.
78. Sase, I., Miyata, H., Ishiwata, S. and Kinosita, K., Jr. (1997) Axial rotation of
sliding actin filaments revealed by single-fluorophore imaging. Proc. Natl. Acad.
Sci. U. S. A., 94, 5646-5650.
79. Mizuno, H., Higashida, C., Yuan, Y., Ishizaki, T., Narumiya, S. and Watanabe,
N. (2011) Rotational movement of the formin mDia1 along the double helical
strand of an actin filament. Science, 331, 80-83.
80. Sakata-Sogawa, K. and Shimamoto, N. (2004) RNA polymerase can track a DNA
groove during promoter search. Proc. Natl. Acad. Sci. U. S. A., 101, 14731-14735.

7 References 161
81. Harada, Y., Ohara, O., Takatsuki, A., Itoh, H., Shimamoto, N. and Kinosita, K.,
Jr. (2001) Direct observation of DNA rotation during transcription by Escherichia
coli RNA polymerase. Nature, 409, 113-115.
82. Noji, H., Yasuda, R., Yoshida, M. and Kinosita, K., Jr. (1997) Direct observation
of the rotation of F1-ATPase. Nature, 386, 299-302.
83. Nishizaka, T., Oiwa, K., Noji, H., Kimura, S., Muneyuki, E., Yoshida, M. and
Kinosita, K., Jr. (2004) Chemomechanical coupling in F1-ATPase revealed by
simultaneous observation of nucleotide kinetics and rotation. Nat. Struct. Mol.
Biol., 11, 142-148.
84. Kirsch, R.D. and Joly, E. (1998) An improved PCR-mutagenesis strategy for two-
site mutagenesis or sequence swapping between related genes. Nucleic. Acids
Res., 26, 1848-1850.
85. Gill, S.C. and von Hippel, P.H. (1989) Calculation of protein extinction
coefficients from amino acid sequence data. Anal. Biochem., 182, 319-326.
86. Huang, Q. and Quinones, E. (2008) A spectroscopic method to determine the
activity of the restriction endonuclease EcoRV that involves a single reaction.
Anal. Biochem.
87. Jeltsch, A., Fritz, A., Alves, J., Wolfes, H. and Pingoud, A. (1993) A fast and
accurate enzyme-linked immunosorbent assay for the determination of the DNA
cleavage activity of restriction endonucleases. Anal. Biochem., 213, 234-240.
88. Hillisch, A., Lorenz, M. and Diekmann, S. (2001) Recent advances in FRET:
distance determination in protein-DNA complexes. Curr. Opin. Struct. Biol., 11,
201-207.
89. Zeug, A., Woehler, A., Neher, E. and Ponimaskin, E.G. (2012) Quantitative
intensity-based FRET approaches--a comparative snapshot. Biophys. J., 103,
1821-1827.
90. Dikic, J., Menges, C., Clarke, S., Kokkinidis, M., Pingoud, A., Wende, W. and
Desbiolles, P. (2012) The rotation-coupled sliding of EcoRV. Nucleic Acids Res.,
40, 4064-4070.
91. Glykos, N.M., Papanikolau, Y., Vlassi, M., Kotsifaki, D., Cesareni, G. and
Kokkinidis, M. (2006) Loopless Rop: structure and dynamics of an engineered
homotetrameric variant of the repressor of primer protein. Biochemistry, 45,
10905-10919.
92. Han, R., Li, Z., Fan, Y. and Jiang, Y. (2013) Recent advances in super-resolution
fluorescence imaging and its applications in biology. J Genet Genomics, 40, 583-
595.
93. Simoncsits, A., Tjornhammar, M.L., Rasko, T., Kiss, A. and Pongor, S. (2001)
Covalent joining of the subunits of a homodimeric type II restriction
endonuclease: single-chain PvuII endonuclease. J. Mol. Biol., 309, 89-97.
94. Wolter, S., Schuttpelz, M., Tscherepanow, M., S, V.D.L., Heilemann, M. and
Sauer, M. (2010) Real-time computation of subdiffraction-resolution fluorescence
images. J Microsc, 237, 12-22.

7 References 162
95. Huang, B., Wang, W., Bates, M. and Zhuang, X. (2008) Three-dimensional super-
resolution imaging by stochastic optical reconstruction microscopy. Science, 319,
810-813.
96. Levitus, M. and Ranjit, S. (2011) Cyanine dyes in biophysical research: the
photophysics of polymethine fluorescent dyes in biomolecular environments. Q.
Rev. Biophys., 44, 123-151.
97. Berney, C. and Danuser, G. (2003) FRET or no FRET: a quantitative comparison.
Biophys. J., 84, 3992-4010.
98. Thomas, M.P., Brady, R.L., Halford, S.E., Sessions, R.B. and Baldwin, G.S.
(1999) Structural analysis of a mutational hot-spot in the EcoRV restriction
endonuclease: a catalytic role for a main chain carbonyl group. Nucleic Acids Res.,
27, 3438-3445.
99. Horton, N.C. and Perona, J.J. (2000) Crystallographic snapshots along a protein-
induced DNA-bending pathway. Proc. Natl. Acad. Sci. U. S. A., 97, 5729-5734.
100. Erskine, S.G., Baldwin, G.S. and Halford, S.E. (1997) Rapid-reaction analysis of
plasmid DNA cleavage by the EcoRV restriction endonuclease. Biochemistry, 36,
7567-7576.
101. Esadze, A., Kemme, C.A., Kolomeisky, A.B. and Iwahara, J. (2014) Positive and
negative impacts of nonspecific sites during target location by a sequence-specific
DNA-binding protein: origin of the optimal search at physiological ionic strength.
Nucleic Acids Res., 42, 7039-7046.
102. Esadze, A. and Iwahara, J. (2014) Stopped-flow fluorescence kinetic study of
protein sliding and intersegment transfer in the target DNA search process. J. Mol.
Biol., 426, 230-244.
103. Adam, G. and Delbrück, M. (1968) Reduction of dimensionality in biological
diffusion processes. Structural Chemistry and Molecular Biology (Rich, A. and
Davidson, N., Eds.), 198-215, Freeman & Co., San Francisco.
104. Richter, P.H. and Eigen, M. (1974) Diffusion controlled reaction rates in
spheroidal geometry: Application to repressor-operator association and
membrane bound enzymes. Biophys. Chem., 9, 255-263.
105. Dikic, J. (2009) The conformational dynamics of BsoBI, analyzed by fluorescence
spectroscopy down to the single molecule level. Inauguraldissertation, Justus-
Liebig University Giessen.