Embed Size (px)
Citation preview

Analysis of TO-15/TO-17 air toxics in urban air using TD–GC/TOF MS and automated
compound identification softwareNEMC, Washington D.C. August 6th 2012
ww
w.Nicola Watson m
arkes
Environmental SpecialistMarkes International
[email protected] s.com

Thermal desorption – One versatile technique for all vapour-phase air monitoring applicationsp p g pp
Electrically-cooled focusing trap
Online
Canisters/bags
ww
w.
Sorbent tubes
Passive
markes
Injection of 100–200 µL vapour into GC(MS)
Water and volatileActive
s.com
interferences can be purged to vent
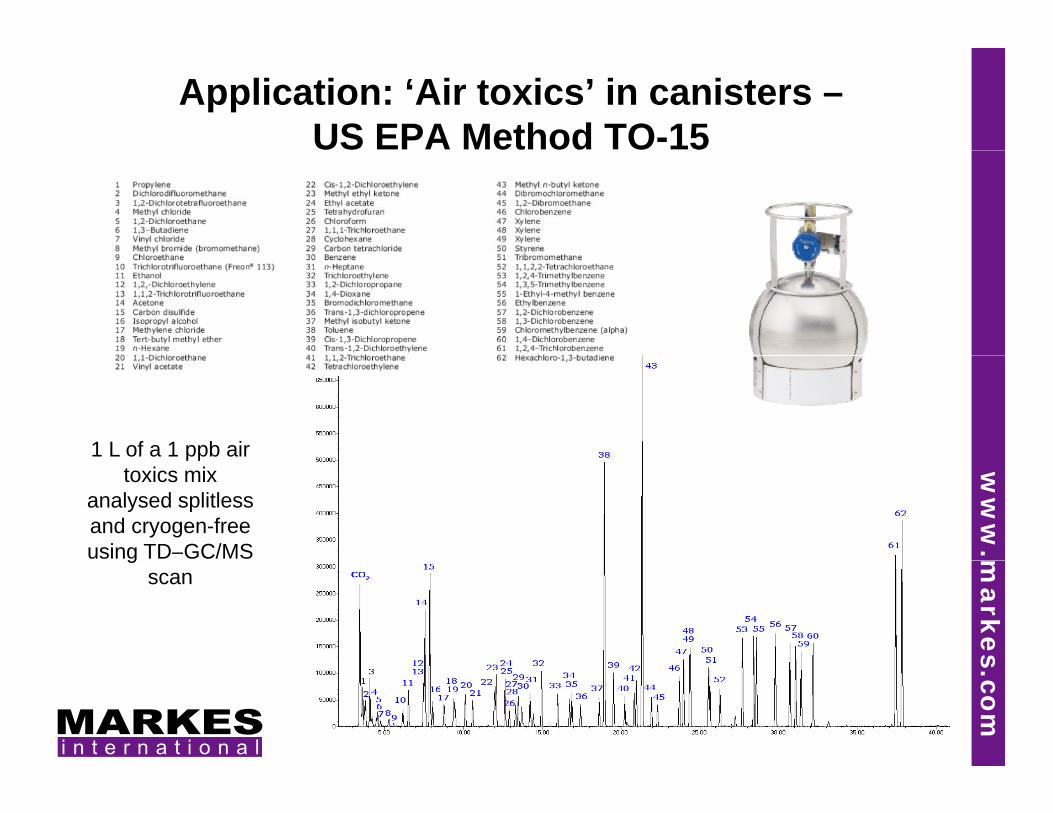
Application: ‘Air toxics’ in canisters –US EPA Method TO-15
1 L of a 1 ppb air ww
w.
pptoxics mix
analysed splitless and cryogen-free using TD–GC/MS m
arkes
gscan
s.com

Application: ‘Air toxics’ using sorbent tubes –US EPA Method TO-17
ww
w.
Splitless desorption of ‘Air toxics’ tube loaded with 1 L of 1 ppb std m
arkes
with 1 L of 1 ppb stdGC/MS
s.com

Can canisters do everything?
Great for C2 to C12 compounds
Suitable for rapid transfer (not storage) Suitable for rapid transfer (not storage) of ultra-volatile reactive compounds such as H2S
Id l f i l b li Ideal for simple grab-sampling
x NOT suitable for compounds with ww
w.
x NOT suitable for compounds with volatility less than C10/12
x NOT suitable for high-concentration markes
samples
x Time-weighted average sampling is NOT easy with a canister s.com
y

Application: Soil gas w
ww
.markes
Profiles of soil gas contaminated with kerosene obtained using:(a) Canister sampling and TO-15 analysis (blue) s.com
(b) Sorbent tube sampling with TO-17 analysis (red)
Courtesy of H. Hayes, Eurofins Air Toxics, Folsom CA

Active (pumped) samplingActive (pumped) sampling
• TO17 specifies “The monitoring procedure p g pinvolves pulling a volume of air through a sorbent packing to collect VOCs”
• Flow rate typically 20 – 100 ml/min• Flow rate typically 20 – 100 ml/min
• Volume taken is typically in the range 5 ml – 100 L, depending on expected
t ti (t i ll t l 1 L ww
w.
concentration (typically two samples 1 L and 4 L)
• Much faster technique compared to markes
diffusive sampling
• Important do not exceed breakthrough volume for a compound on a given sorbent Pump s.com
volume for a compound on a given sorbent
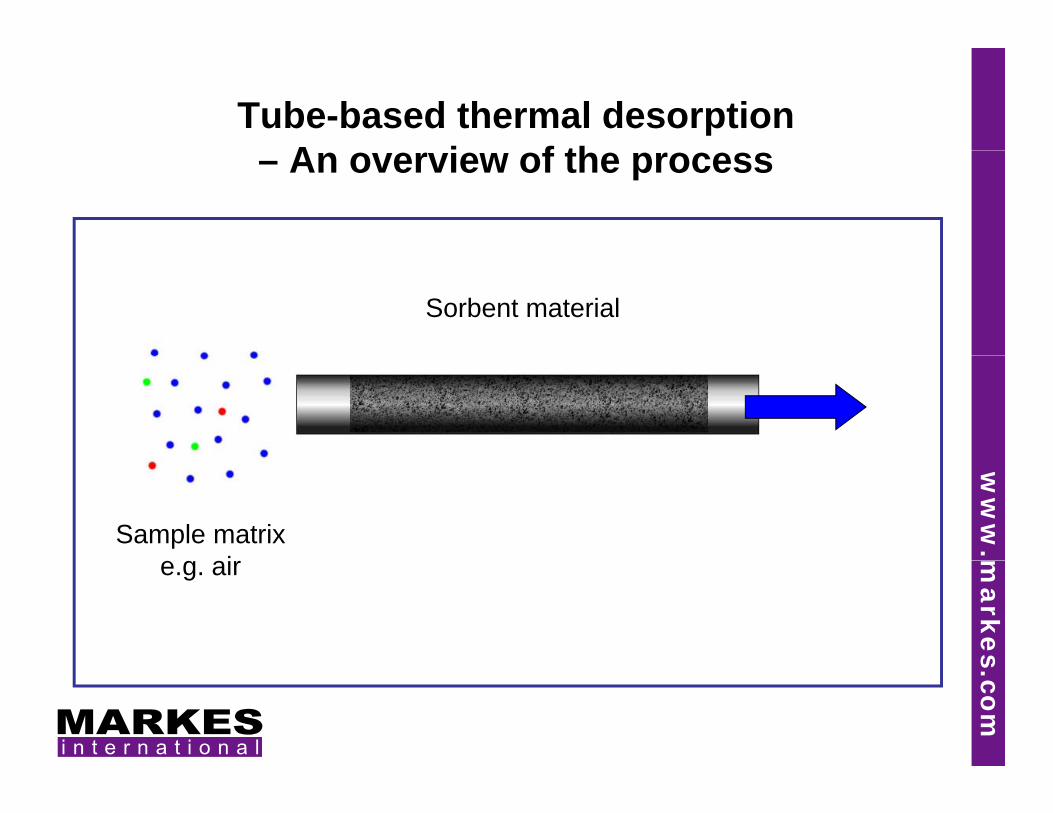
Tube-based thermal desorption A i f th– An overview of the process
Sorbent material
ww
w.Sample matrix
i markes
e.g. air
s.com

Tube-based thermal desorption ube based t e a deso pt o
Sample passes onto the sorbent
ww
w.
Compounds of interest are adsorbed on the sorbent surface m
arkess.com

Tube-based thermal desorption ube based t e a deso pt o
ww
w.Lighter gases such as nitrogen pass
th h th b t markes
through the sorbent
s.com

Breakthrough
ww
w.
Affected by:Temperature lower temp. = stronger interactionSample volume lower volume = less risk of breakthrough m
arkes
p gMass or sorbent more sorbent = more surface areaType of sorbent stronger sorbent = stronger interaction
s.com

Air monitoring – Pumped
Sorbent selection for both tubes and focusing trap are very important
g p
Semi-volatile compounds – Weak sorbentpHelps prevent retention of unwanted compounds
ww
w.
S
markes
Very volatile compounds – Strong sorbentPrevents breakthrough of light compounds
s.com

Common sorbents
Sorbent name Volatility range Water retention
Quartz wool / silica beads C30 – C40
Tenax TA C7 – C30
Carbograph 2TD C8 – C20
Carbograph 1TD C5/6 – C14
C b h 5TD C C ww
w.
Carbograph 5TD C3/4 – C6/7
SulfiCarb C3 – C8
Carboxen 1003 C2 – C5 markes
Carbosieve SIII C2 – C5
s.com

Application examples – High/Low concentration
50 mL sample of50 mL sample of diesel exhaust
ww
w.500 mL sample of Isoprene S/N 15:1 m
arkes
p4 ppb ozone precursor standard
Isoprene S/N 15:1
s.com
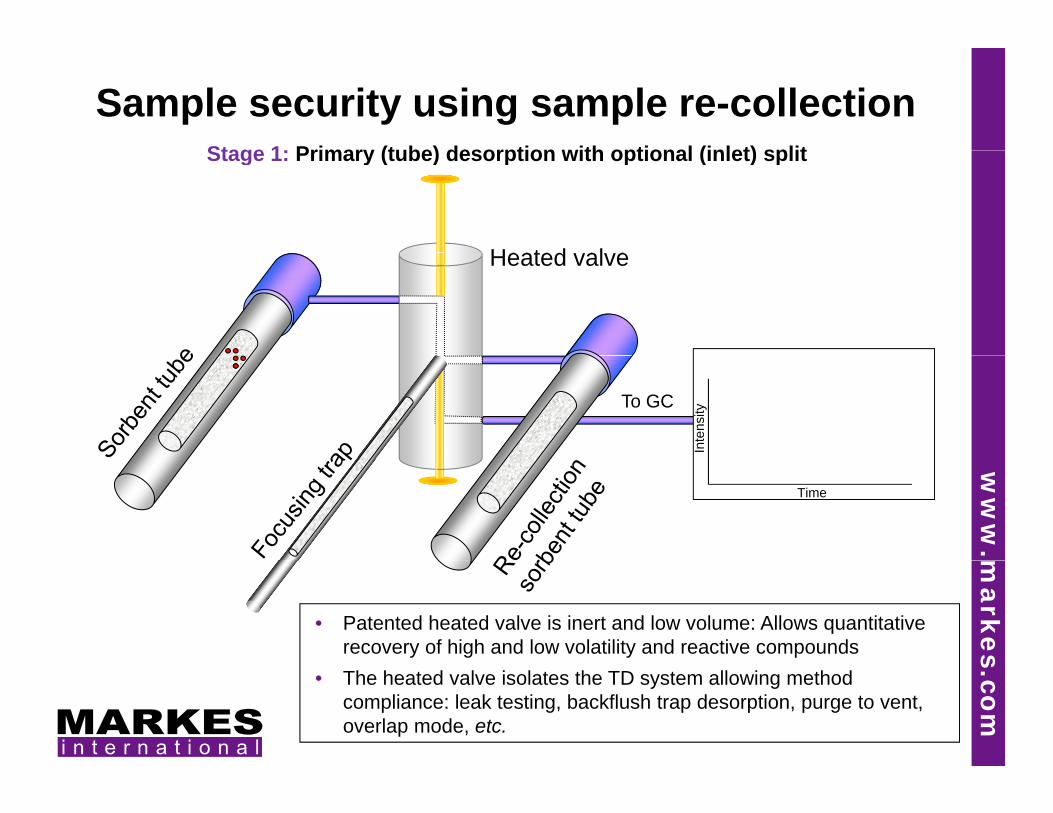
Sample security using sample re-collectionStage 1: Primary (tube) desorption with optional (inlet) split
Heated al e
Stage 1: Primary (tube) desorption with optional (inlet) split
Heated valve
To GC
Inte
nsity
ww
w.
Time
markes
• Patented heated valve is inert and low volume: Allows quantitative recovery of high and low volatility and reactive compounds s.com
• The heated valve isolates the TD system allowing method compliance: leak testing, backflush trap desorption, purge to vent, overlap mode, etc.

Sample security using sample re-collection
Heated valve
Stage 2: Secondary (trap) desorption with optional (outlet) split
Heated valve
To GC
Inte
nsity
ww
w.
Time
markes
• Repeat analysis of re-collected samples makes it easy to validate analyte recovery through the TD flow path s.com
• A change to the overall VOC profile indicates any bias

Re-analysis of low-concentration sampleThe 4 ppb standard was re-collected for re-analysis using SIM
detection conditions
Isoprene S/N200:1
ww
w.m
arkess.com

BenchTOF-dx:BenchTOF-dx: Detector enhancements for air monitoring
ww
w.m
arkess.com

What does BenchTOF-dx offer?O
• Spectral accuracy cannot be compromised• Sensitivity is KING• Speed can be leveraged for deconvolution• Selectivity – enhanced mass resolution should
mainly be used to limit the matrix in VOC work ww
w.
mainly be used to limit the matrix in VOC work(high res has limited advantages)
• Stability is key to productivity markes
y y p y
s.com
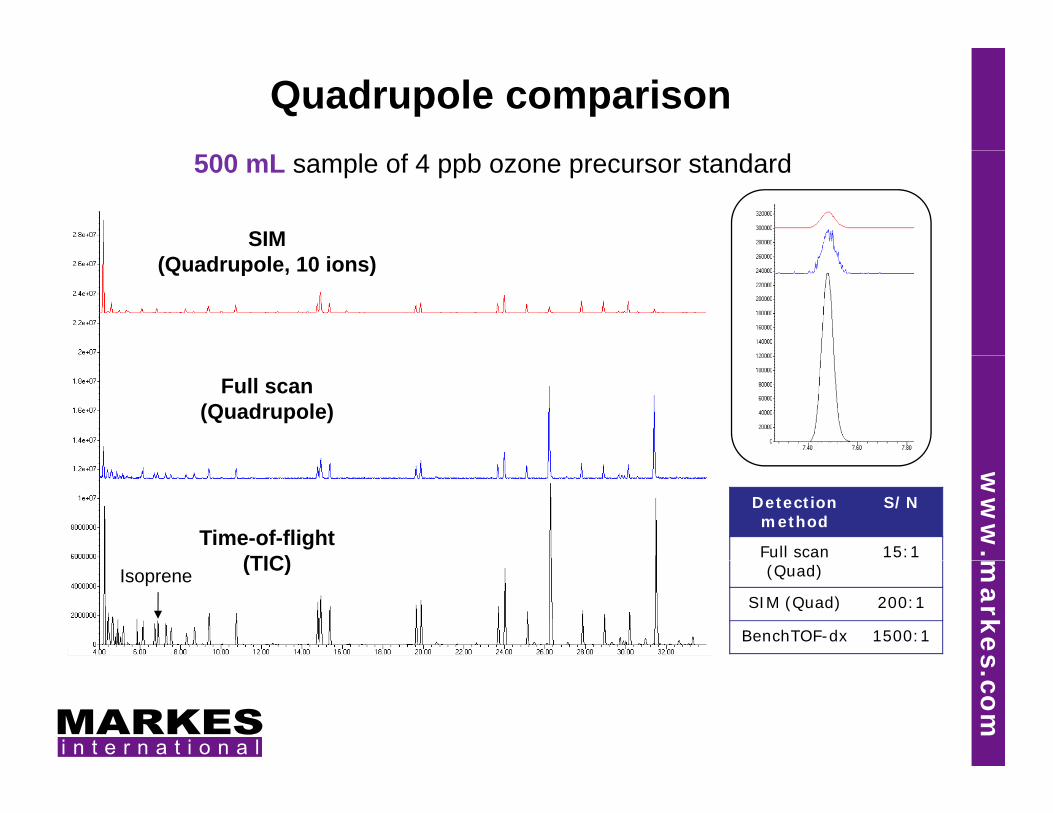
Quadrupole comparison
SIM
500 mL sample of 4 ppb ozone precursor standard
(Quadrupole, 10 ions)
Full scan (Quadrupole)
ww
w.Time-of-flight
(TIC)
Detection method
S/N
Full scan 15:1 markes
Isoprene (TIC) (Quad)
SIM (Quad) 200:1
BenchTOF-dx 1500:1 s.com

Quadrupole comparison200 mL sample of ambient rural air
Quad data (magnified) – Full scan and ( g )SIM (ten ions)
ww
w.m
arkes
BenchTOF-dx data(full spectrum) s.com
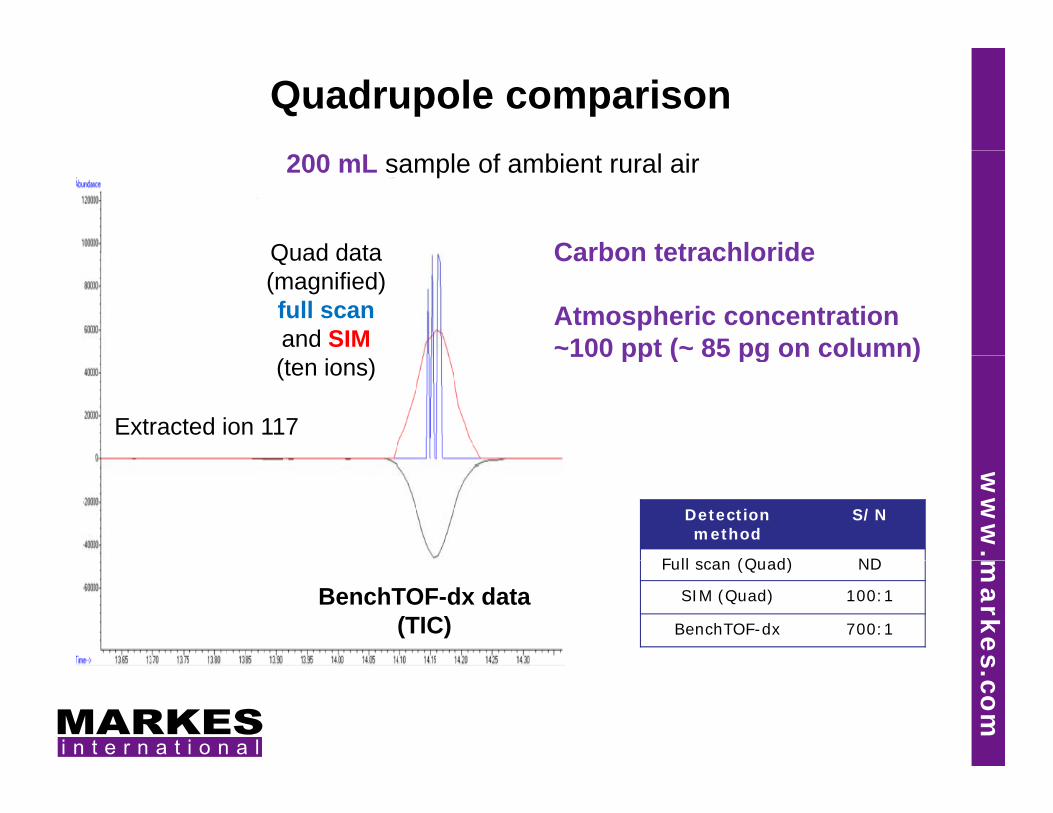
Quadrupole comparison
Carbon tetrachlorideQuad data
200 mL sample of ambient rural air
Carbon tetrachloride
Atmospheric concentration~100 ppt (~ 85 pg on column)
Quad data (magnified) full scan and SIM
Extracted ion 117
100 ppt ( 85 pg on column)(ten ions)
ww
w.
Detection method
S/N
F ll (Q d) ND markes
BenchTOF-dx data(TIC)
Full scan (Quad) ND
SIM (Quad) 100:1
BenchTOF-dx 700:1
s.com

10 mL of ambient semi-rural airw
ww
.markes
Total ion chromatogram showing splitless analysis of only 10 mL of semi-rural airusing TD–GC–TOF MS. s.com
Inset: Extracted-ion chromatogram for a characteristic fragment ion of Freon® 113(present in the atmosphere at ca. 80 ppt).

How can I use a large sensitivity boost in air it i li ti ?monitoring applications?
• Trace level work for unknowns and targets• Trace-level work for unknowns and targets combined at lower MDLs
• Smaller sample sizes but same MDLs
• Higher splits, cleaner system but same MDLs ww
w.
g p , y
• However you want to!
markes
An investment in BenchTOF-dx provides a sensitivity boost! s.com

Q d MS 1 L i j ti f 1 t d d
Provides productivity too!Quad MS – 1 mL injection of 1 ppm standard(62 component) with no split
Equivalent to ~1000 ppt (1 ppb) on column
BenchTOF-dx – 1 mL injection of 1 ppm standard(65 component) with 100:1 split
ww
w.
Equivalent to ~10 ppt (0.01 ppb) on column
markess.com
From 40 minutes to 7 minutes (4 runs in the time to do 1!)

...without compromising sensitivityBenchTOF-dx – 1 mL injection of 1 ppm standard (65 component) with 292:1 split
Equivalent to ~3 ppt (0.003 ppb) on-column
RMS signal-to-noise ranges from 15:1 to 1350:1 (non DBC)
ww
w.
LODs (assuming 3:1 minimum S/N)0.01 ppt (10 ppq) to0.6 ppt (600 ppq) m
arkes
B hTOF d l 100 i b S/N h d l i
s.com
BenchTOF-dx – at least 100 times better S/N than a quadrupole infull scan mode

...whilst maintaining linearityR2 0 9996R2 0.9996
R2 0.9995
R2 0.9995
R2 0.9993
R2 0.9992
R2 0.9990
R2 0.9990
R2 0.9990
R2 0.9989
R2 0.9989
R2 0.9988
R2 0.9985
R2 0.9984
R2 0.9975
ww
w.m
arkess.com

Challenges associated with identifying target compounds in complex GCMS profiles
The problem…
TargetView software Identifying the presence of known toxic chemicals in complex GCMS TIC fil i h ll i
compounds in complex GCMS profiles
The way forward….
Development of data mining software which looks more intensively at the GCMS data
TargetView softwareprofiles is very challenging
Technical capacity to interpret spectra is declining or absent, majority of l t l i l lib i (NIST Wil t ) Development of data mining software which looks more intensively at the GCMS data
Implementation of spectral deconvolution to clean merged analyte/matrix spectra
analysts rely on commercial libraries (NIST, Wiley etc)
Identification is complicated by chromatographic coelution of compounds d t i ff t d i i d t w
ww
.
The application of multivariate data analysis algorithms provides an orthoganol dimension of analysis
and matrix effects, producing mixed spectra
Conventional library search techniques can result in mis identification with l lit t h d li it d fid i th lt m
arkes
low quality matches and limited confidence in the result
s.com
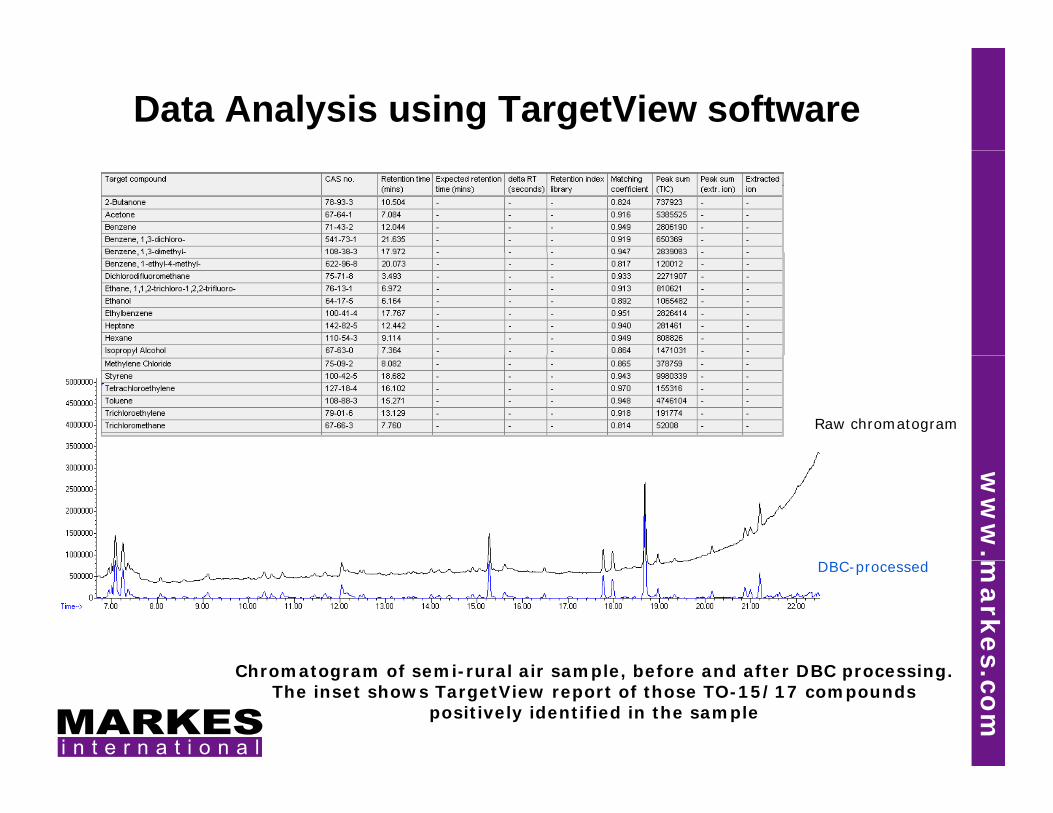
Data Analysis using TargetView software
Raw chromatogram
ww
w.m
arkes
DBC-processed
s.com
Chromatogram of semi-rural air sample, before and after DBC processing. The inset shows TargetView report of those TO-15/17 compounds
positively identified in the sample

Dynamic Background Compensation (DBC)
Dynamic Background Compensation (DBC) is a sophisticated software algorithm designed to distinguish between chromatographic peaks and slower GC-background / baselinechromatographic peaks and slower GC background / baseline anomalies.The main advantages of DBC include:
Improved spectral purityp p p y
- Enhanced identification of trace target analytes and unknowns.
ww
w.
Selective elimination of interfering ions resulting in
- Flat chromatographic baseline
Enhanced integration markes
- Enhanced integration
Increased sensitivity s.com- Reduced noise enhances S/N

DBC in action –
Baseline noise suppression
ww
w.m
arkes
Original non background compensated GCMS (TIC) dataPost DBC – baseline optimised, minimal background noise
s.com

Deconvolution of peaks
*
ww
w.m
arkesDeconvolved spectra for both known and unknown s.com
Deconvolved spectra for both known and unknown compounds can be cross searched against NIST databases

The chemometric visualisation of data (PCA)
Deconvolution identifies a number of target and unknown compounds intarget and unknown compounds in the sample
The deconvolved spectrum for all The deconvolved spectrum for all compounds (yellow circles) is projected onto a 2 dimensional plane.
ww
w.
The red dot equates to the target compound spectrum
markes
Proximity of a yellow circle to the target indicates a positive hitPCA identification of benzene
s.com
The close proximity of 1 spectrum indicates a single positive match
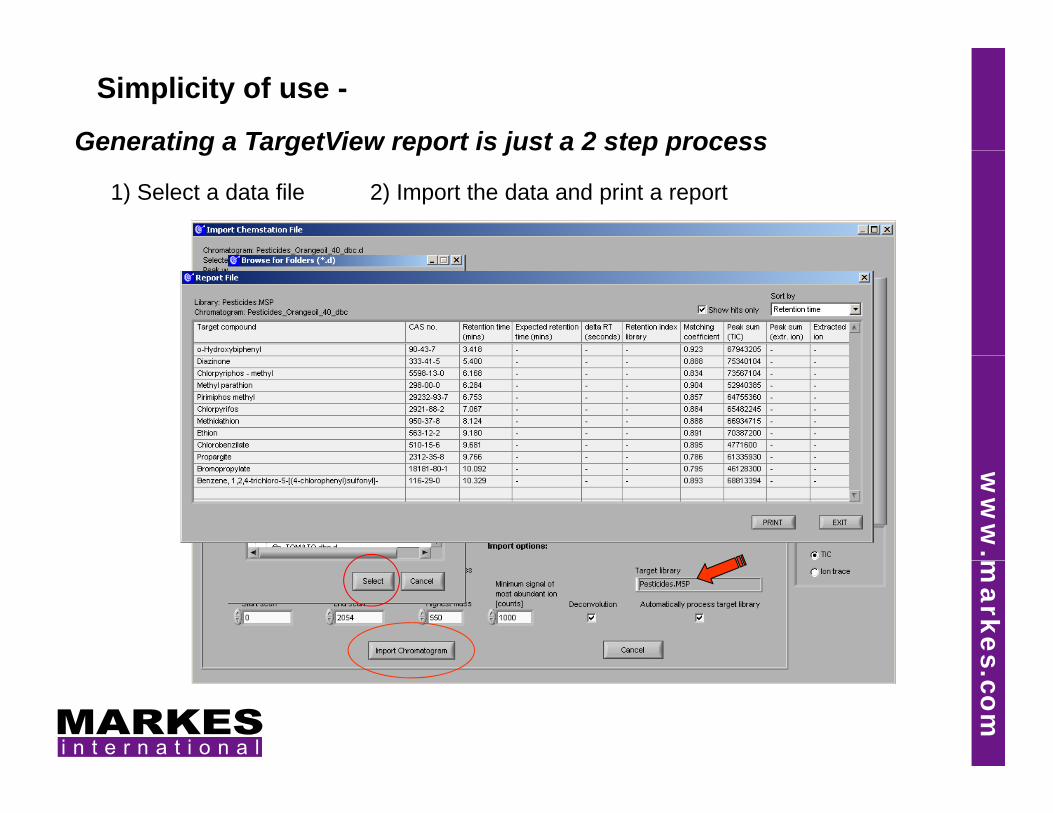
Generating a TargetView report is just a 2 step process
Simplicity of use -
Ge e at g a a get e epo t s just a step p ocess
1) Select a data file 2) Import the data and print a report
ww
w.m
arkess.com

SummarySu a y
• A combination of canisters and sorbent tubes id h i l ti fprovides a comprehensive evaluation of an
application, e.g. ambient air monitoring
B hTOF d id iti it d d ti it• BenchTOF-dx provides a sensitivity and productivity boost that can be utilised several ways while providing method tunes and NIST-compliant spectra
ww
w.
• Challenges associated with identifying target compounds in complex GCMS profiles can now be m
arkes
overcome by employing simple data analysis packages such as TargetView.
s.com

AnyAny Questions?Q
ww
w.
Nicola WatsonEnvironmental Specialist m
arkes
pMarkes International
[email protected] s.com