Embed Size (px)
Citation preview

Analysis of tuberculosis
prevalence surveys
(Chapter 16)
Sian Floyd and Babis SismanidisPhnom Penh, 3 March 2011
Background
Prevalence = TB cases / Number of eligible participants
(95% CI of a proportion)
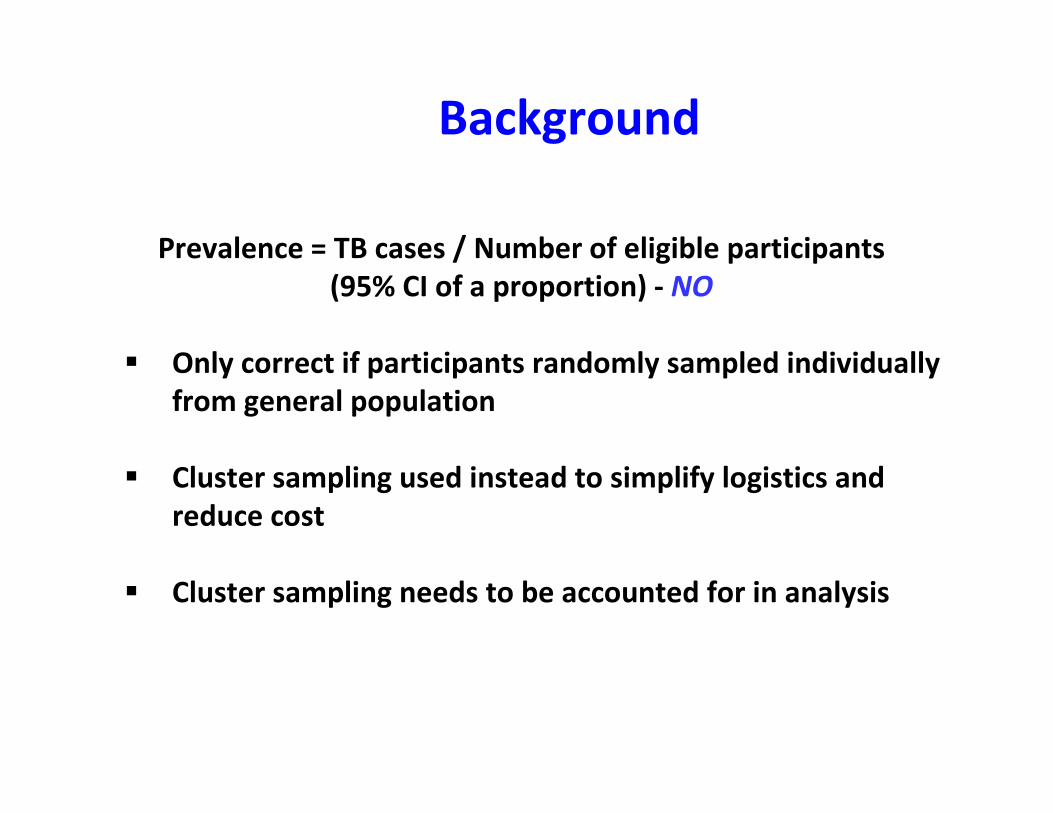
Background
Prevalence = TB cases / Number of eligible participants
(95% CI of a proportion) - NO
� Only correct if participants randomly sampled individually
from general population
� Cluster sampling used instead to simplify logistics and
reduce cost
� Cluster sampling needs to be accounted for in analysis
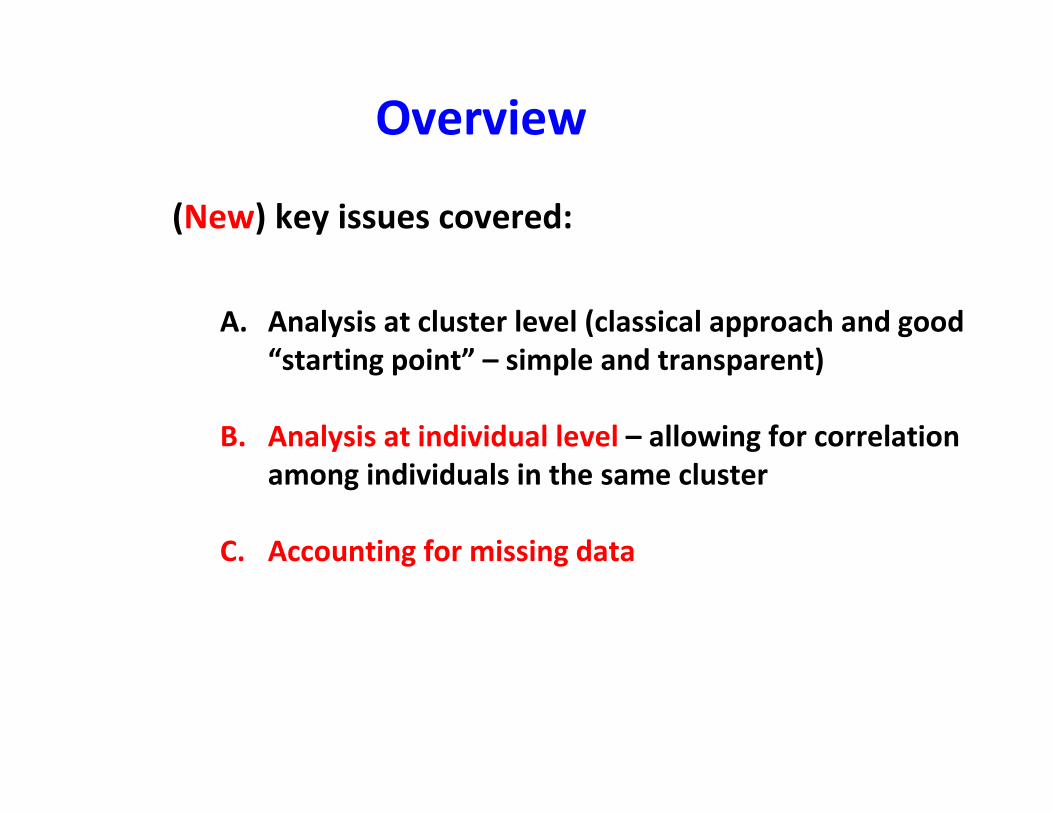
Overview
(New) key issues covered:
A. Analysis at cluster level (classical approach and good
“starting point” – simple and transparent)
B. Analysis at individual level – allowing for correlation
among individuals in the same cluster
C. Accounting for missing data
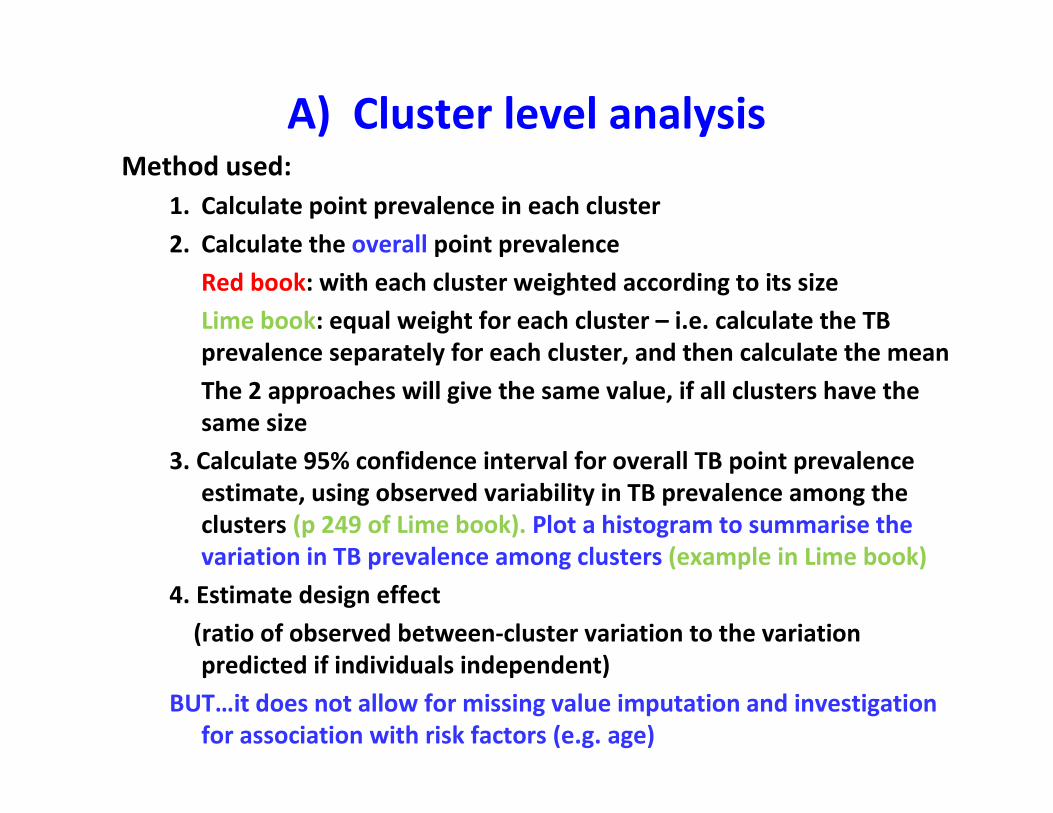
A) Cluster level analysisMethod used:
1. Calculate point prevalence in each cluster
2. Calculate the overall point prevalence
Red book: with each cluster weighted according to its size
Lime book: equal weight for each cluster – i.e. calculate the TB
prevalence separately for each cluster, and then calculate the mean
The 2 approaches will give the same value, if all clusters have the
same size
3. Calculate 95% confidence interval for overall TB point prevalence
estimate, using observed variability in TB prevalence among the
clusters (p 249 of Lime book). Plot a histogram to summarise the
variation in TB prevalence among clusters (example in Lime book)
4. Estimate design effect
(ratio of observed between-cluster variation to the variation
predicted if individuals independent)
BUT…it does not allow for missing value imputation and investigation
for association with risk factors (e.g. age)
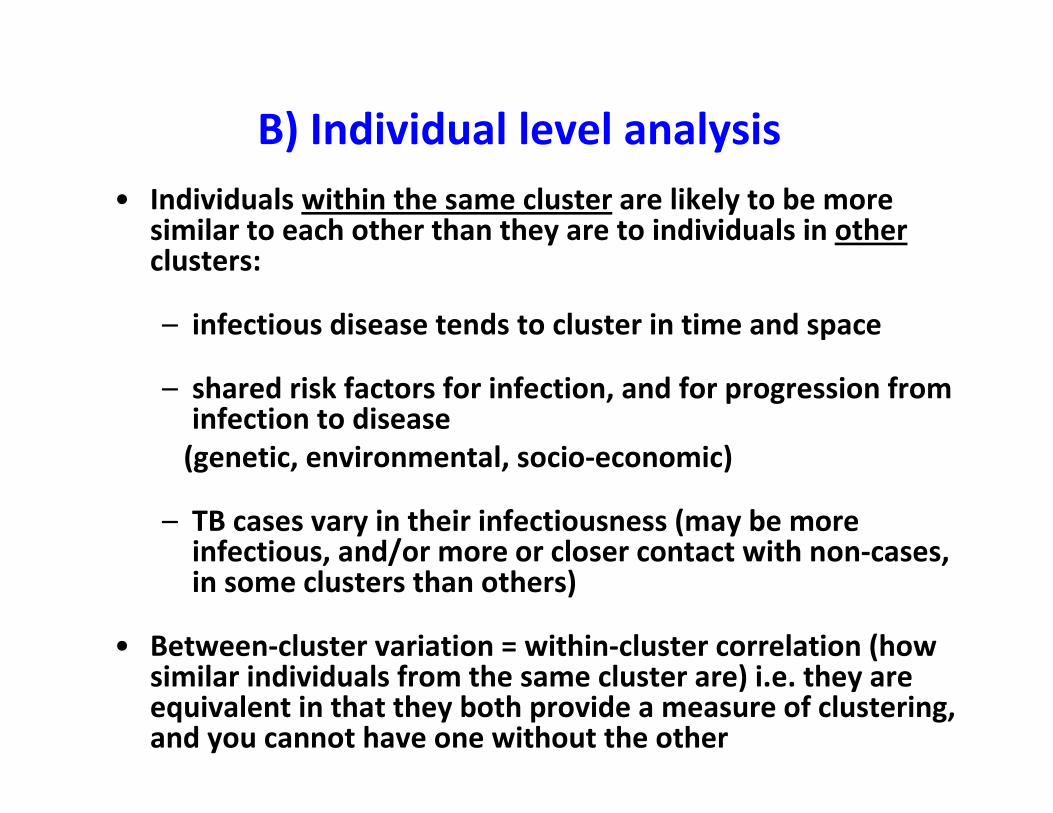
B) Individual level analysis
• Individuals within the same cluster are likely to be more similar to each other than they are to individuals in otherclusters:
– infectious disease tends to cluster in time and space
– shared risk factors for infection, and for progression from infection to disease
(genetic, environmental, socio-economic)
– TB cases vary in their infectiousness (may be more infectious, and/or more or closer contact with non-cases, in some clusters than others)
• Between-cluster variation = within-cluster correlation (how similar individuals from the same cluster are) i.e. they are equivalent in that they both provide a measure of clustering, and you cannot have one without the other
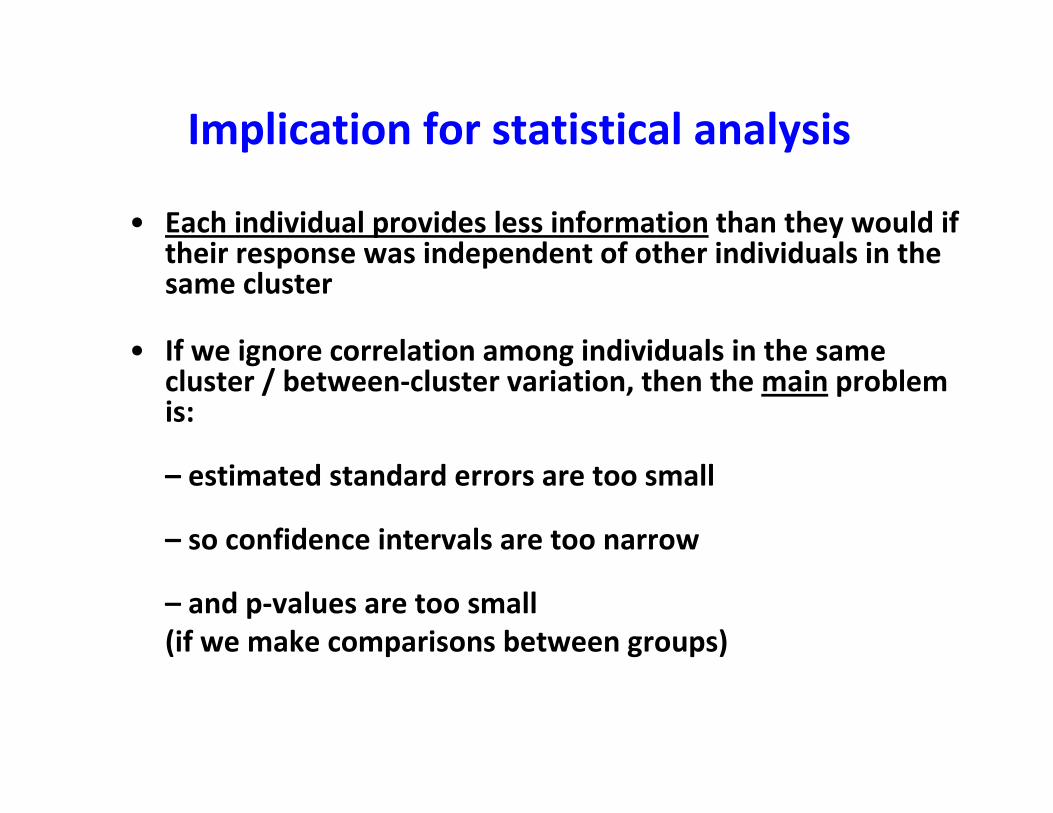
Implication for statistical analysis
• Each individual provides less information than they would if their response was independent of other individuals in the same cluster
• If we ignore correlation among individuals in the same cluster / between-cluster variation, then the main problem is:
– estimated standard errors are too small
– so confidence intervals are too narrow
– and p-values are too small
(if we make comparisons between groups)
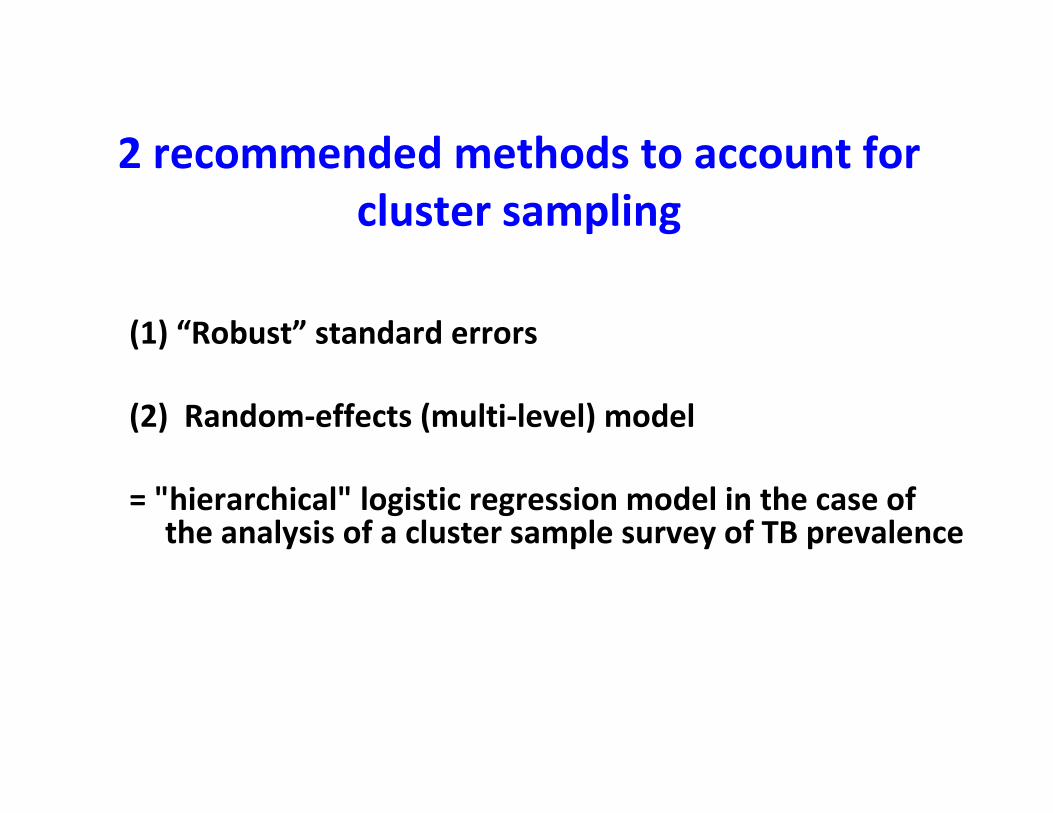
2 recommended methods to account for
cluster sampling
(1) “Robust” standard errors
(2) Random-effects (multi-level) model
= "hierarchical" logistic regression model in the case of the analysis of a cluster sample survey of TB prevalence
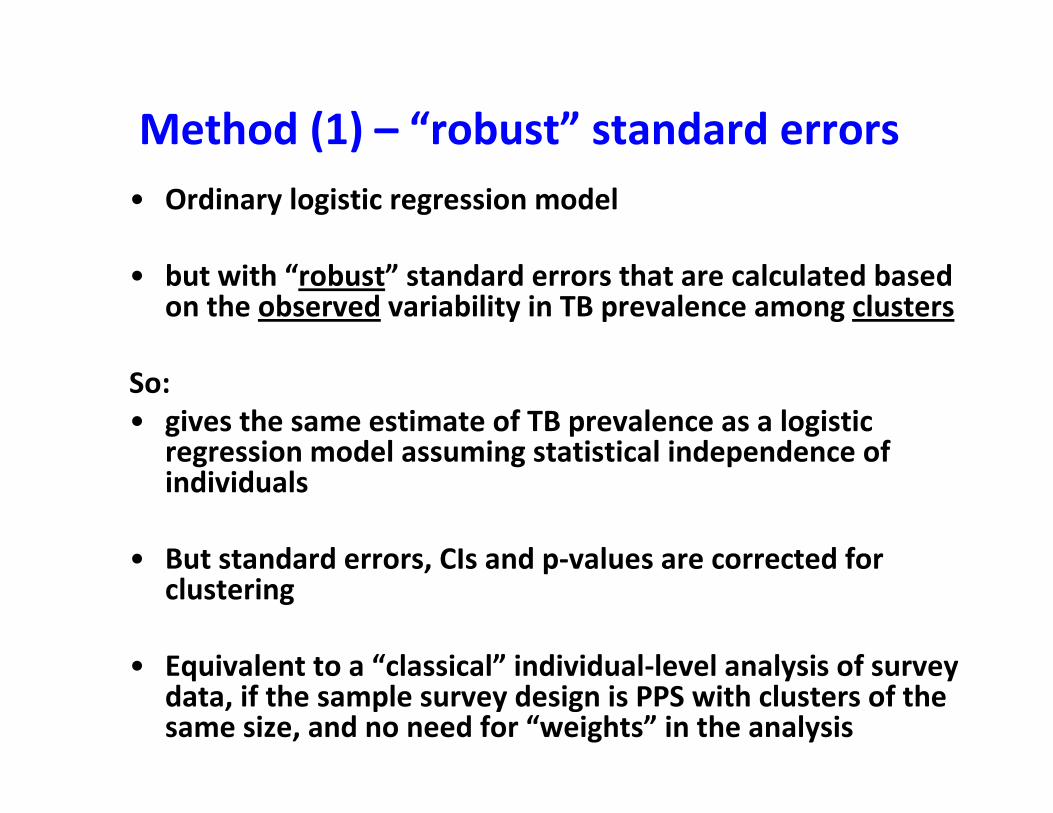
Method (1) – “robust” standard errors
• Ordinary logistic regression model
• but with “robust” standard errors that are calculated based on the observed variability in TB prevalence among clusters
So:
• gives the same estimate of TB prevalence as a logistic regression model assuming statistical independence of individuals
• But standard errors, CIs and p-values are corrected for clustering
• Equivalent to a “classical” individual-level analysis of survey data, if the sample survey design is PPS with clusters of the same size, and no need for “weights” in the analysis
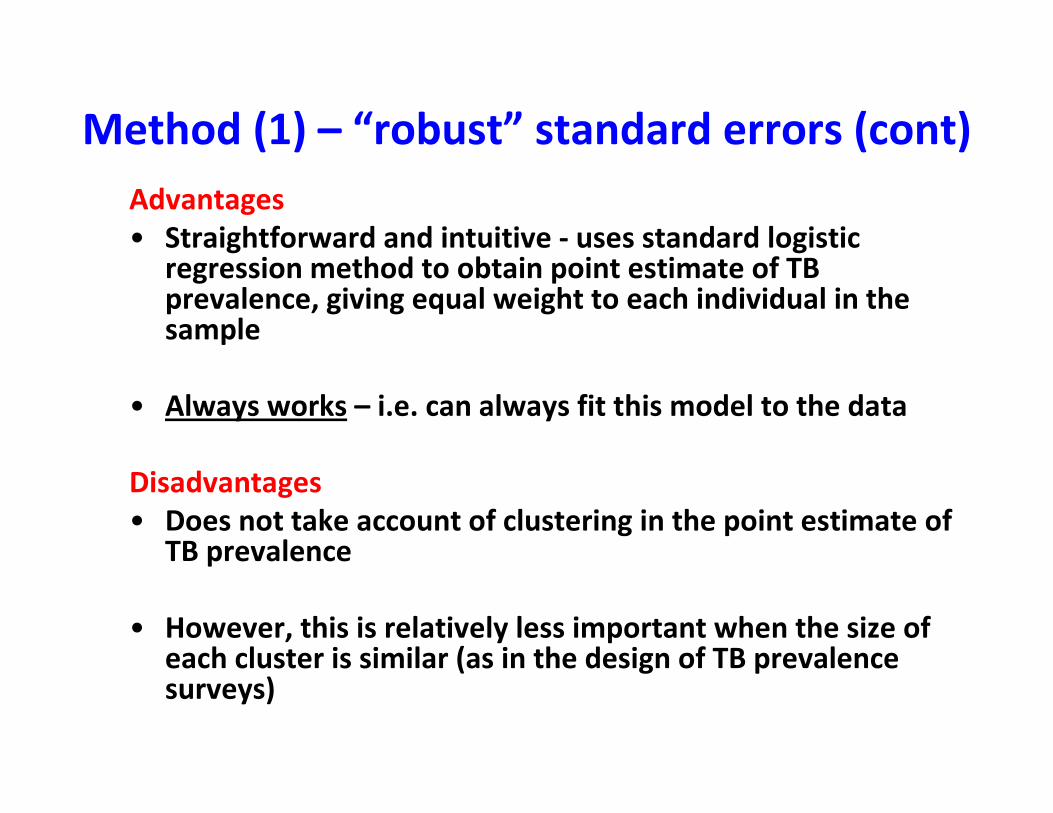
Method (1) – “robust” standard errors (cont)
Advantages
• Straightforward and intuitive - uses standard logistic regression method to obtain point estimate of TB prevalence, giving equal weight to each individual in the sample
• Always works – i.e. can always fit this model to the data
Disadvantages
• Does not take account of clustering in the point estimate of TB prevalence
• However, this is relatively less important when the size of each cluster is similar (as in the design of TB prevalence surveys)
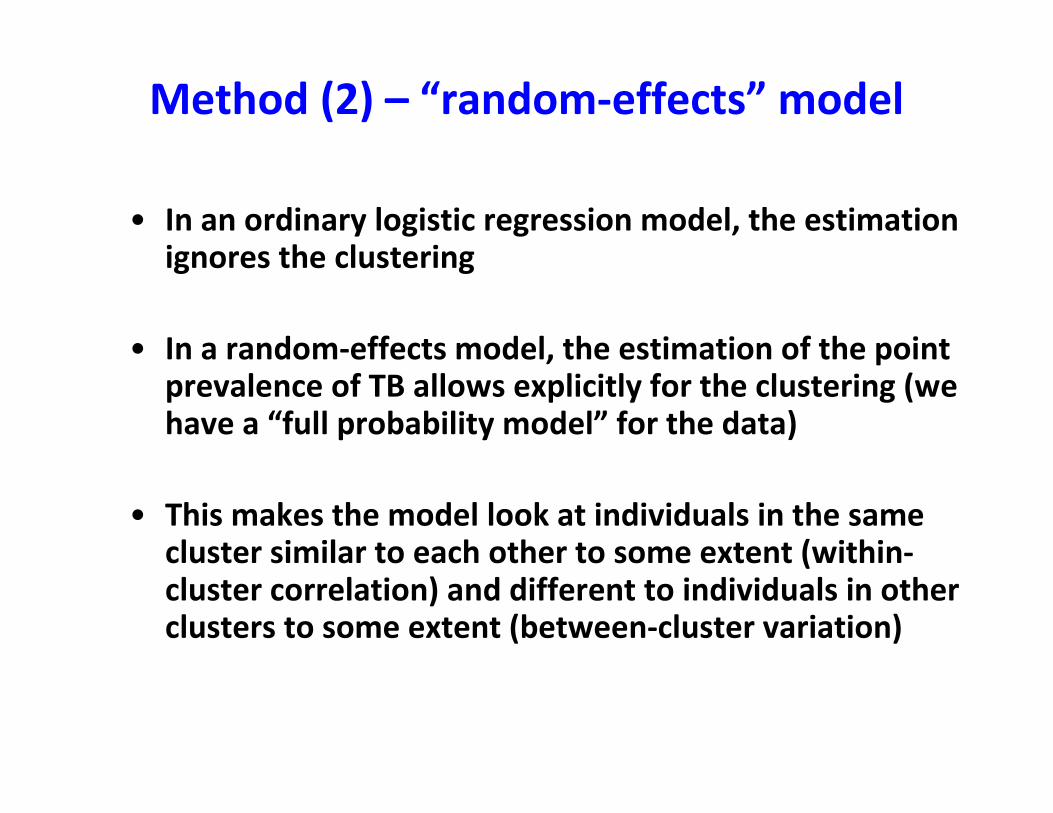
Method (2) – “random-effects” model
• In an ordinary logistic regression model, the estimation ignores the clustering
• In a random-effects model, the estimation of the point prevalence of TB allows explicitly for the clustering (we have a “full probability model” for the data)
• This makes the model look at individuals in the same cluster similar to each other to some extent (within-cluster correlation) and different to individuals in other clusters to some extent (between-cluster variation)
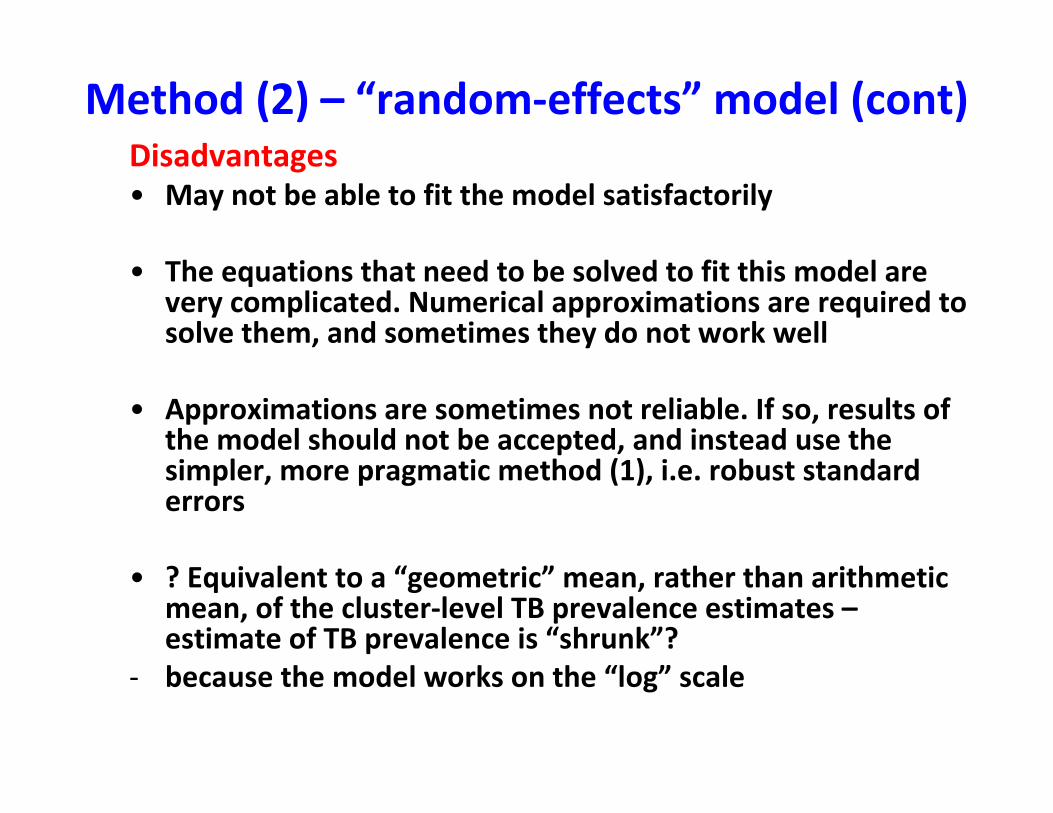
Method (2) – “random-effects” model (cont)Disadvantages• May not be able to fit the model satisfactorily
• The equations that need to be solved to fit this model are very complicated. Numerical approximations are required to solve them, and sometimes they do not work well
• Approximations are sometimes not reliable. If so, results of the model should not be accepted, and instead use the simpler, more pragmatic method (1), i.e. robust standard errors
• ? Equivalent to a “geometric” mean, rather than arithmetic mean, of the cluster-level TB prevalence estimates –estimate of TB prevalence is “shrunk”?
- because the model works on the “log” scale
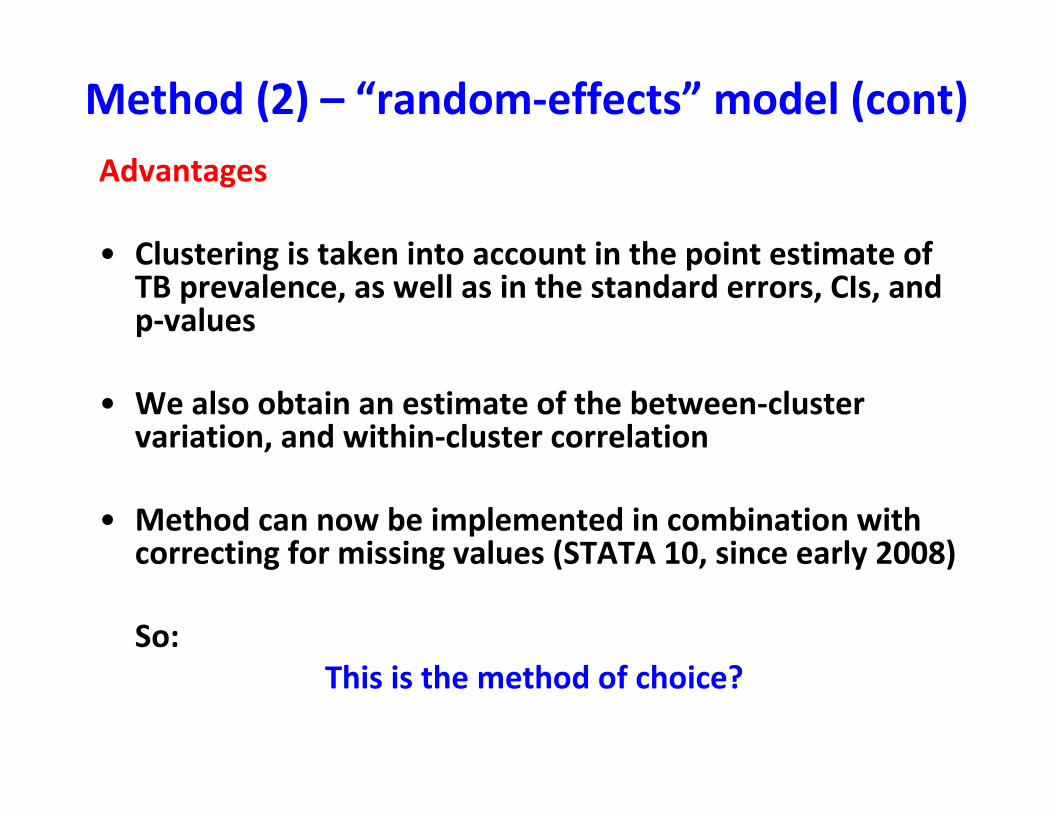
Method (2) – “random-effects” model (cont)
Advantages
• Clustering is taken into account in the point estimate of TB prevalence, as well as in the standard errors, CIs, and p-values
• We also obtain an estimate of the between-cluster variation, and within-cluster correlation
• Method can now be implemented in combination with correcting for missing values (STATA 10, since early 2008)
So:
This is the method of choice?
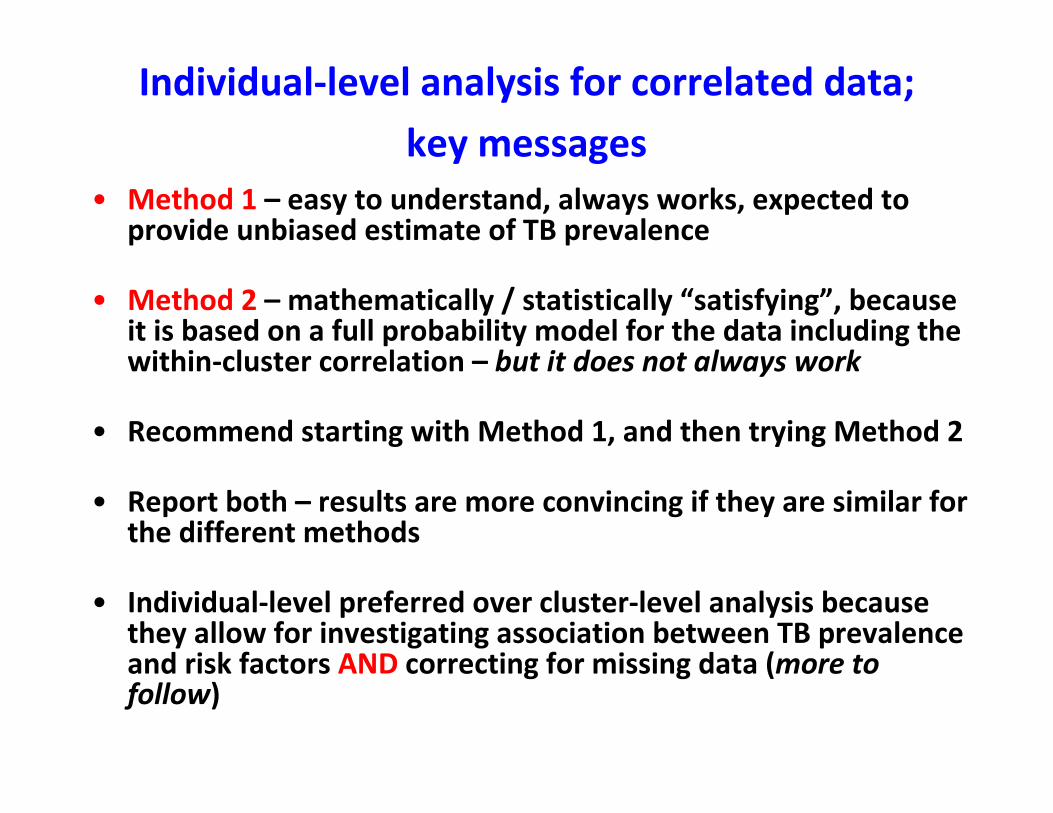
Individual-level analysis for correlated data;
key messages
• Method 1 – easy to understand, always works, expected to provide unbiased estimate of TB prevalence
• Method 2 – mathematically / statistically “satisfying”, because it is based on a full probability model for the data including the within-cluster correlation – but it does not always work
• Recommend starting with Method 1, and then trying Method 2
• Report both – results are more convincing if they are similar for the different methods
• Individual-level preferred over cluster-level analysis because they allow for investigating association between TB prevalence and risk factors AND correcting for missing data (more to follow)
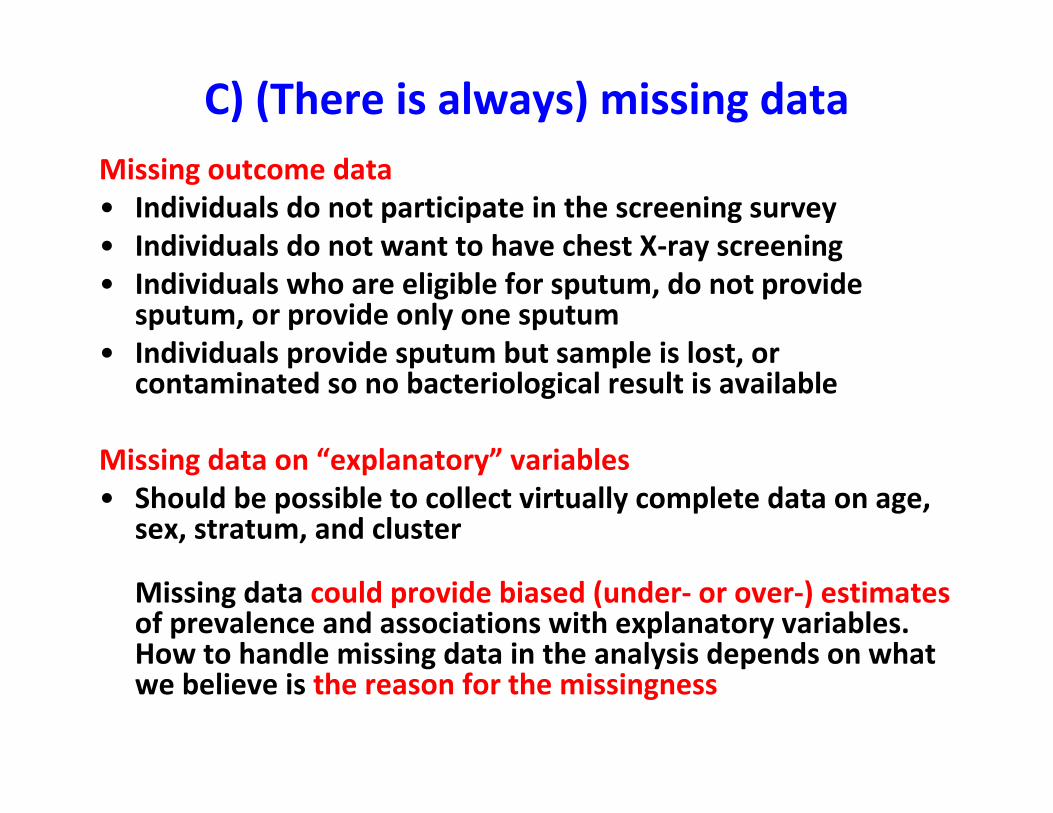
C) (There is always) missing data
Missing outcome data
• Individuals do not participate in the screening survey
• Individuals do not want to have chest X-ray screening
• Individuals who are eligible for sputum, do not provide sputum, or provide only one sputum
• Individuals provide sputum but sample is lost, or contaminated so no bacteriological result is available
Missing data on “explanatory” variables
• Should be possible to collect virtually complete data on age, sex, stratum, and cluster
Missing data could provide biased (under- or over-) estimatesof prevalence and associations with explanatory variables. How to handle missing data in the analysis depends on what we believe is the reason for the missingness
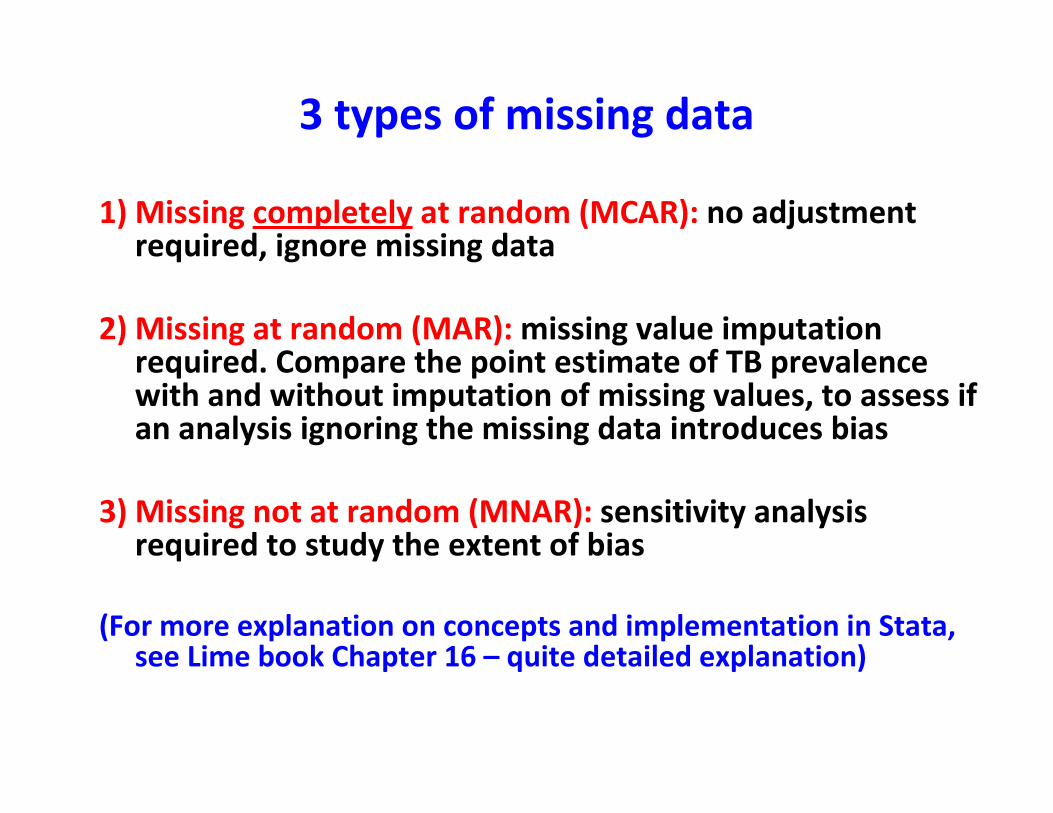
3 types of missing data
1) Missing completely at random (MCAR): no adjustment required, ignore missing data
2) Missing at random (MAR): missing value imputation required. Compare the point estimate of TB prevalence with and without imputation of missing values, to assess if an analysis ignoring the missing data introduces bias
3) Missing not at random (MNAR): sensitivity analysis required to study the extent of bias
(For more explanation on concepts and implementation in Stata, see Lime book Chapter 16 – quite detailed explanation)
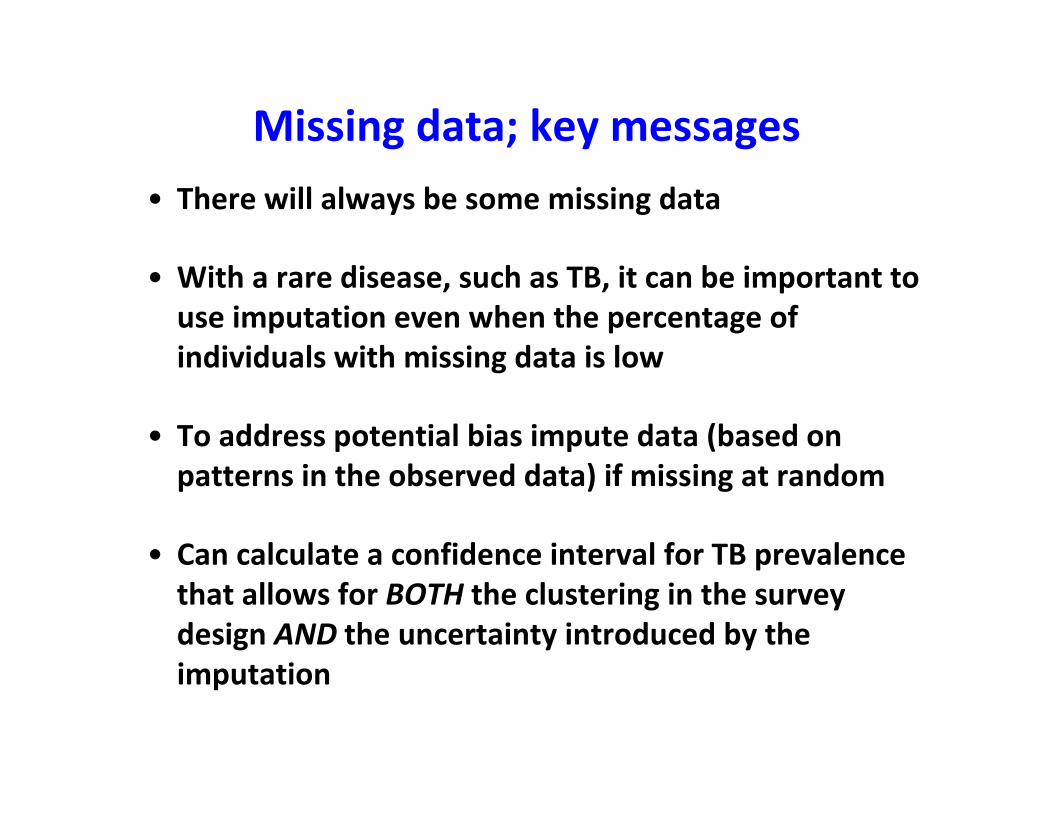
Missing data; key messages
• There will always be some missing data
• With a rare disease, such as TB, it can be important to
use imputation even when the percentage of
individuals with missing data is low
• To address potential bias impute data (based on
patterns in the observed data) if missing at random
• Can calculate a confidence interval for TB prevalence
that allows for BOTH the clustering in the survey
design AND the uncertainty introduced by the
imputation
Missing data; key messages (cont)
• Must describe the percentage of individuals with missing data, for each key variable
e.g. symptom screening questionnaire, chest X-ray,
smear and culture results
• Must describe (and tabulate) how the percentage of individuals with missing data on key outcome variables varies according to characteristics known to be associated with TB (e.g. age, sex, stratum, cluster)
• Unless data are “missing completely at random”, an analysis restricted to individuals with complete data may introduce bias (over- or under- estimate TB prevalence)
What to remember
• The clustered sampling design must be accounted for in the analysis
• Even well designed and conducted surveys, need to investigate the
potential bias of missing data
• The analysis of TB prevalence surveys is not simple, proper care
should be taken
• Different approaches should be used and their results reported;
consistency of results across different methods makes for convincing
conclusions
• Careful and thorough description of the data, before moving to
analysis of TB prevalence, is ESSENTIAL for both epidemiological
understanding and transparency of reporting – see section 16.2 of
Lime book for key Table shells that must be produced for each
survey
Sample weights, or self-weighting sample?
• No need for “sample weights”, if the sample size in each cluster is the same or similar, and the clusters are selected with probability proportional to size
• Recommended that sample size in each cluster is the same or at least similar because this makes the analysis both more straightforward and more intuitive
• Worth doing an analysis with weights, to allow for variation in cluster size, but don’t expect it to make much difference