Embed Size (px)
Citation preview
Analysis of tumour stage and treatment
•26 REGISTRIES IN TOTAL
–2: BREAST ONLY–2: CHILDREN ONLY
•DATE OF INCIDENCE RANGE: 1978-2003
•YEARS OF DATA RANGE: 2 TO 25
•REGISTRIES VARY IN SIZE (NUMBER OF CASES) AND YEAR RANGE OF DATA
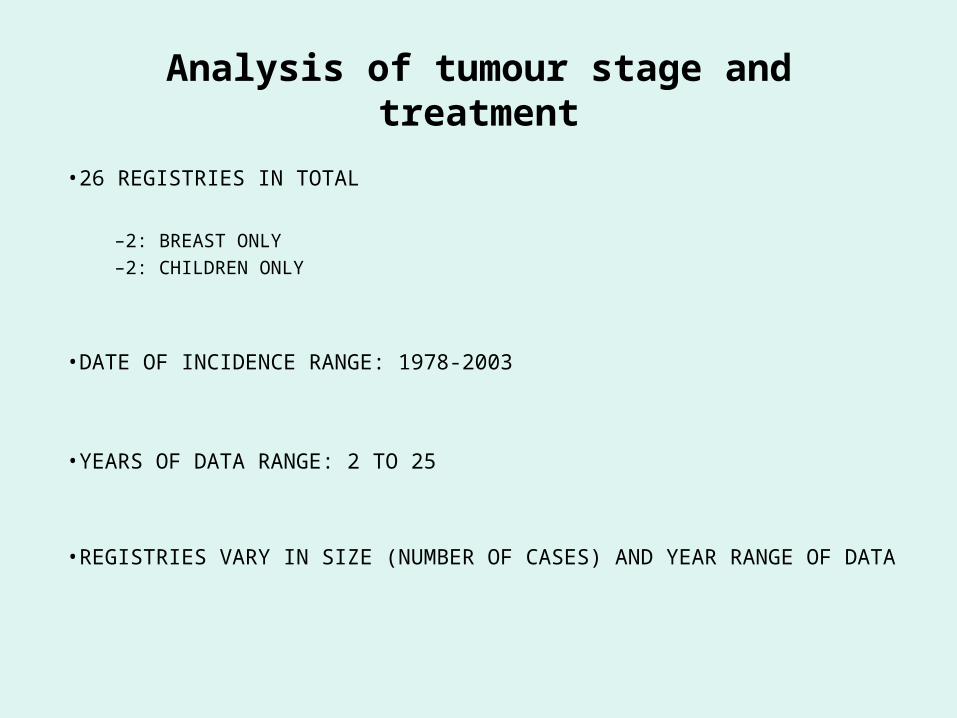
Stage and treatment data fields
Method of diagnosis: histology, cytology, either, none or unknown
Actual T, N and M data: detailed information on T, N and M status Condensed T, N and M: (more generalised information)
T: localised or advanced N: none or present M: none or present Stage (Extent of Disease) combined information on tumour, nodal & distant metastasis in a single value.
* possible to assign cases as local, regional or distant Tumour size in millimetres Number of nodes examined & number with metastasis Certainty factor: if specialised diagnostic methods were used in order to stage Treatment surgery, chemotherapy, radiotherapy, other therapies
(such as hormonal therapy) indicated (yes, no, unknown)
Treatment flagged as first therapy post-diagnosis and/or symptomatic treatment

RegistryMicro
confirmation Stage (EOD) TNM StageCondensed TNM Stage
Tumour Size Nodes
Certainty factor Treatment
Amsterdam 100% 81% 60% 80% 0 0 0 0Basel 100% 0 50% 0 7% 5% 0 0Basque 93% 43% 0 0 0 0 0 21%CastillonB 96% 90% 90% 90% 85% 90% 95% 95%Cracow 90% 50% 10% 1% 1% 1% 2% 30%EAnglia 60% 30% 0 0 4% 4% 0 40%Eindhoven 95% 5 70% 60% 2% 0 0 0Finland 100% 80% 0 0 0 0 0 90%Flemish 92% 0 40% 0 0 0 0 0Geneva 90% 93% 70% 85% 30% 3% 0 0Grisons 99% 53% 85% 85% 10% 10% 0 0Ireland 97% 42% 45% 0 0 0 0 0Kielce 87% 52% 0 0 0 0 0 80%Lorraine-Child 100% 70% 70% 70% 0 0 0 0March-Child 100% 17% 2% 8% 14% 2% 16% 60%NIreland 99% 12% 15% 0 9% 8% 0 0Palermo 95% 0 90% 0 70% 80% 0 98%Saarland 99% 52% 34% 0 0 0 0 60%Slovenia 98% 91% 22% 36% 0 0 0 0St.Gallen 98% 78% 53% 50% 8% 99% 0 0Ticino 100% 54% 55% 54% 14% 25% 0 0Tyrol 95% 0 0 30% 0 0 0 40%Valais 99% 40% 63% 60% 8% 8% 0 0WestMidland 85% 100% 0 0 11% 5% 0 45%Yorkshire 100% 0 1% 0 8% 0 0 99%Zurich 99% 22% 60% 60% 7% 5% 0 0
PERCENTAGE OF ALL TUMOURS
Data available on stage and treatment
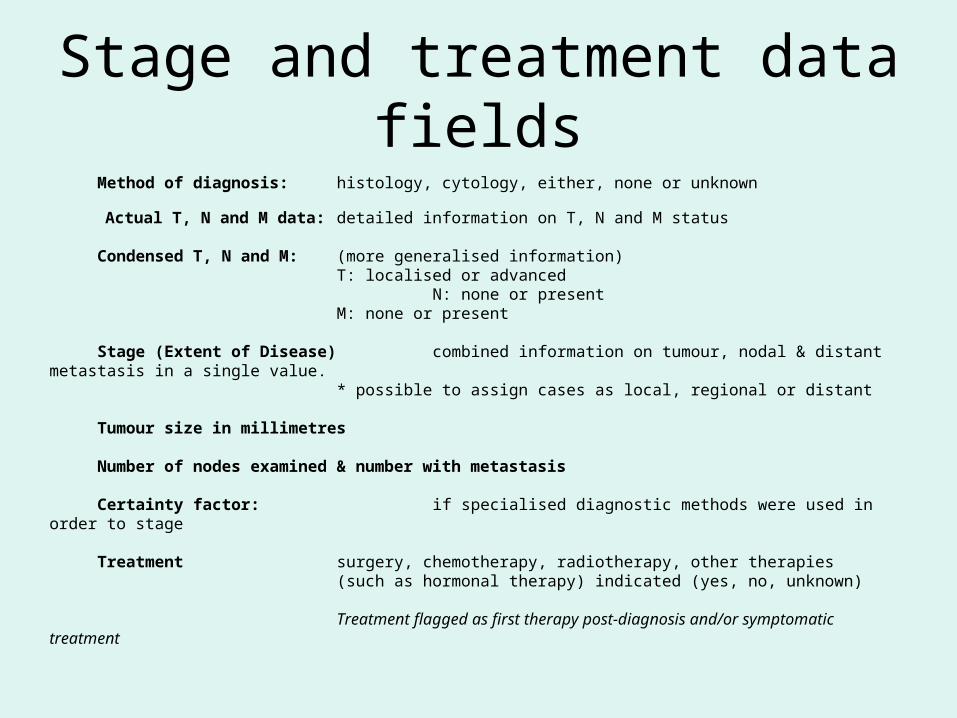
Entities examined for stage and treatment:
Digestive cancers: OesophagusStomachSmall IntestineColon, Rectum, Anal CanalPancreasLiver and Intrahepatic Bile DuctsGall-bladder and Extrahepatic Bile Ducts
Lung cancer
Breast cancer
Prostate cancer
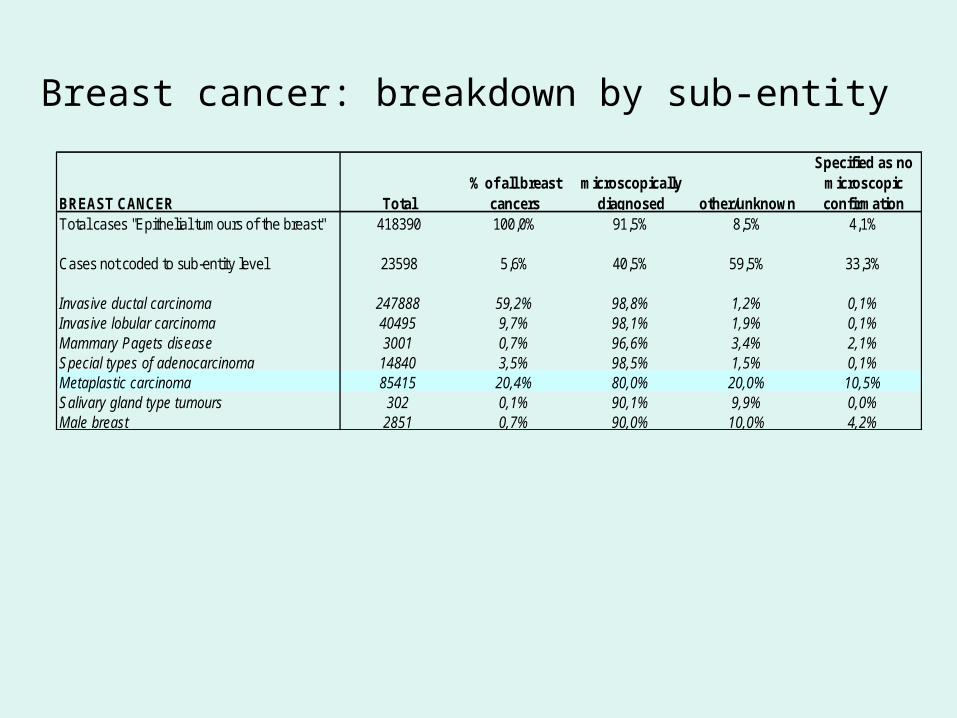
Breast cancer: breakdown by sub-entity
BREAST CANCER Total% of all breast
cancersmicroscopically
diagnosed other/unknown
Specified as no microscopic confirmation
Total cases "Epithelial tumours of the breast" 418390 100,0% 91,5% 8,5% 4,1%
Cases not coded to sub-entity level 23598 5,6% 40,5% 59,5% 33,3%
Invasive ductal carcinoma 247888 59,2% 98,8% 1,2% 0,1%Invasive lobular carcinoma 40495 9,7% 98,1% 1,9% 0,1%Mammary Pagets disease 3001 0,7% 96,6% 3,4% 2,1%Special types of adenocarcinoma 14840 3,5% 98,5% 1,5% 0,1%Metaplastic carcinoma 85415 20,4% 80,0% 20,0% 10,5%Salivary gland type tumours 302 0,1% 90,1% 9,9% 0,0%Male breast 2851 0,7% 90,0% 10,0% 4,2%
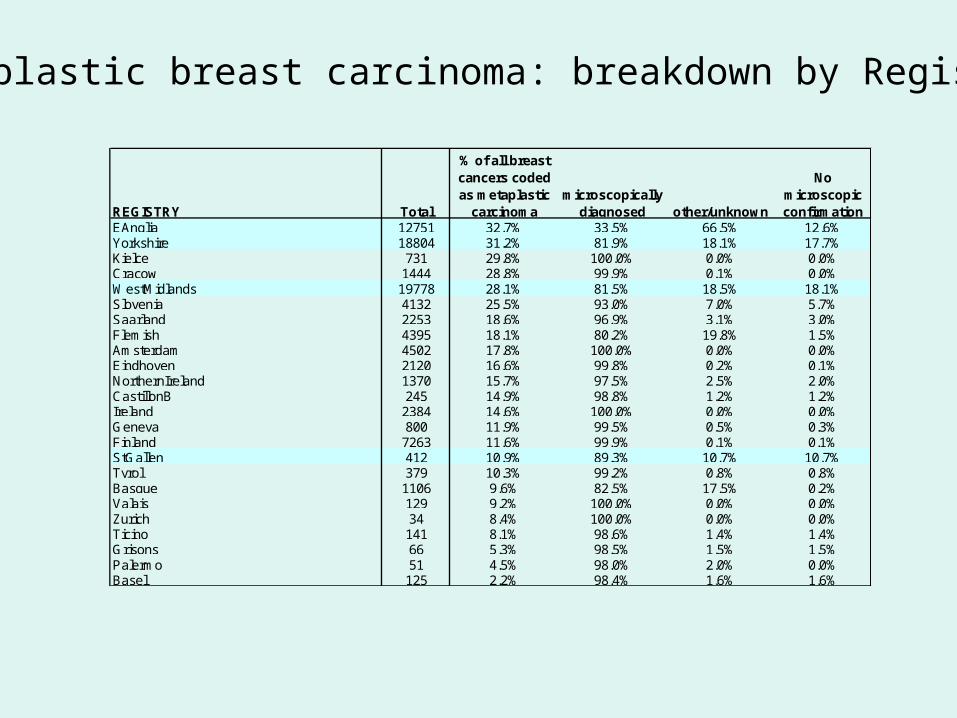
REGISTRY Total
% of all breast cancers coded as metaplastic
carcinomamicroscopically
diagnosed other/unknown
No microscopic confirmation
EAnglia 12751 32.7% 33.5% 66.5% 12.6%Yorkshire 18804 31.2% 81.9% 18.1% 17.7%Kielce 731 29.8% 100.0% 0.0% 0.0%Cracow 1444 28.8% 99.9% 0.1% 0.0%WestMidlands 19778 28.1% 81.5% 18.5% 18.1%Slovenia 4132 25.5% 93.0% 7.0% 5.7%Saarland 2253 18.6% 96.9% 3.1% 3.0%Flemish 4395 18.1% 80.2% 19.8% 1.5%Amsterdam 4502 17.8% 100.0% 0.0% 0.0%Eindhoven 2120 16.6% 99.8% 0.2% 0.1%NorthernIreland 1370 15.7% 97.5% 2.5% 2.0%CastillonB 245 14.9% 98.8% 1.2% 1.2%Ireland 2384 14.6% 100.0% 0.0% 0.0%Geneva 800 11.9% 99.5% 0.5% 0.3%Finland 7263 11.6% 99.9% 0.1% 0.1%StGallen 412 10.9% 89.3% 10.7% 10.7%Tyrol 379 10.3% 99.2% 0.8% 0.8%Basque 1106 9.6% 82.5% 17.5% 0.2%Valais 129 9.2% 100.0% 0.0% 0.0%Zurich 34 8.4% 100.0% 0.0% 0.0%Ticino 141 8.1% 98.6% 1.4% 1.4%Grisons 66 5.3% 98.5% 1.5% 1.5%Palermo 51 4.5% 98.0% 2.0% 0.0%Basel 125 2.2% 98.4% 1.6% 1.6%
Metaplastic breast carcinoma: breakdown by Registry
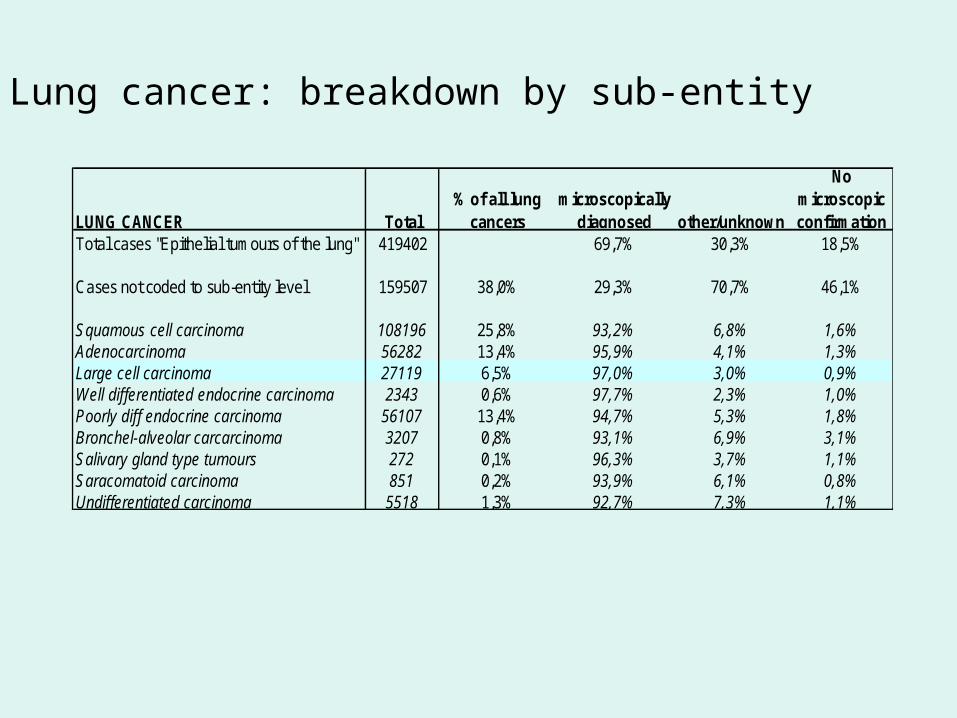
Lung cancer: breakdown by sub-entity
LUNG CANCER Total% of all lung
cancersmicroscopically
diagnosed other/unknown
No microscopic confirmation
Total cases "Epithelial tumours of the lung" 419402 69,7% 30,3% 18,5%
Cases not coded to sub-entity level 159507 38,0% 29,3% 70,7% 46,1%
Squamous cell carcinoma 108196 25,8% 93,2% 6,8% 1,6%Adenocarcinoma 56282 13,4% 95,9% 4,1% 1,3%Large cell carcinoma 27119 6,5% 97,0% 3,0% 0,9%Well differentiated endocrine carcinoma 2343 0,6% 97,7% 2,3% 1,0%Poorly diff endocrine carcinoma 56107 13,4% 94,7% 5,3% 1,8%Bronchel-alveolar carcarcinoma 3207 0,8% 93,1% 6,9% 3,1%Salivary gland type tumours 272 0,1% 96,3% 3,7% 1,1%Saracomatoid carcinoma 851 0,2% 93,9% 6,1% 0,8%Undifferentiated carcinoma 5518 1,3% 92,7% 7,3% 1,1%
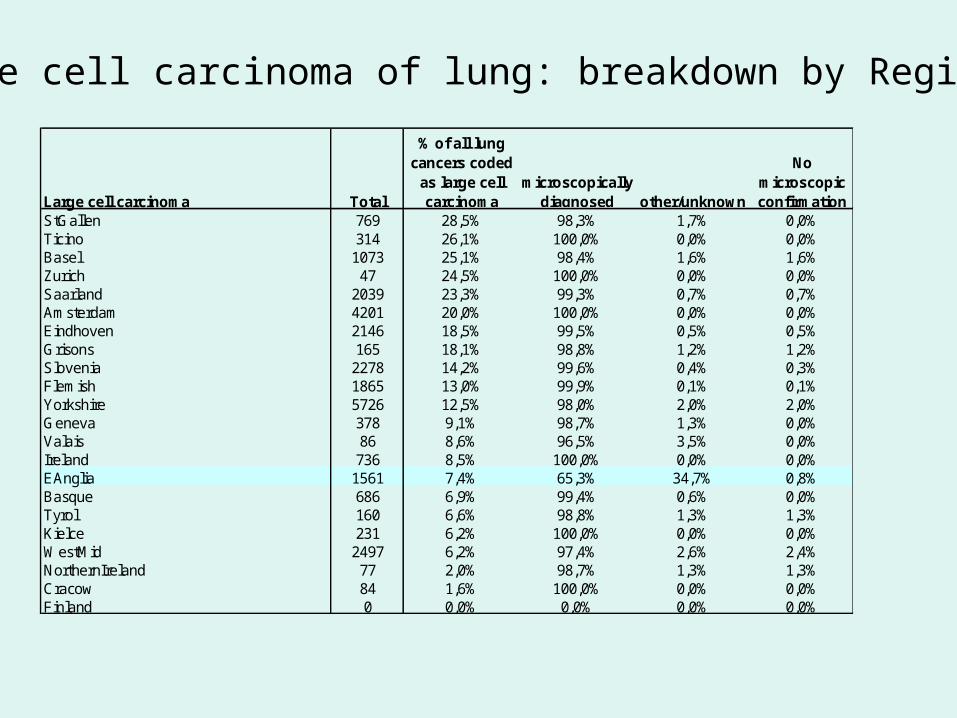
Large cell carcinoma of lung: breakdown by Registry
Large cell carcinoma Total
% of all lung cancers coded
as large cell carcinoma
microscopically diagnosed other/unknown
No microscopic confirmation
StGallen 769 28,5% 98,3% 1,7% 0,0%Ticino 314 26,1% 100,0% 0,0% 0,0%Basel 1073 25,1% 98,4% 1,6% 1,6%Zurich 47 24,5% 100,0% 0,0% 0,0%Saarland 2039 23,3% 99,3% 0,7% 0,7%Amsterdam 4201 20,0% 100,0% 0,0% 0,0%Eindhoven 2146 18,5% 99,5% 0,5% 0,5%Grisons 165 18,1% 98,8% 1,2% 1,2%Slovenia 2278 14,2% 99,6% 0,4% 0,3%Flemish 1865 13,0% 99,9% 0,1% 0,1%Yorkshire 5726 12,5% 98,0% 2,0% 2,0%Geneva 378 9,1% 98,7% 1,3% 0,0%Valais 86 8,6% 96,5% 3,5% 0,0%Ireland 736 8,5% 100,0% 0,0% 0,0%EAnglia 1561 7,4% 65,3% 34,7% 0,8%Basque 686 6,9% 99,4% 0,6% 0,0%Tyrol 160 6,6% 98,8% 1,3% 1,3%Kielce 231 6,2% 100,0% 0,0% 0,0%WestMid 2497 6,2% 97,4% 2,6% 2,4%NorthernIreland 77 2,0% 98,7% 1,3% 1,3%Cracow 84 1,6% 100,0% 0,0% 0,0%Finland 0 0,0% 0,0% 0,0% 0,0%
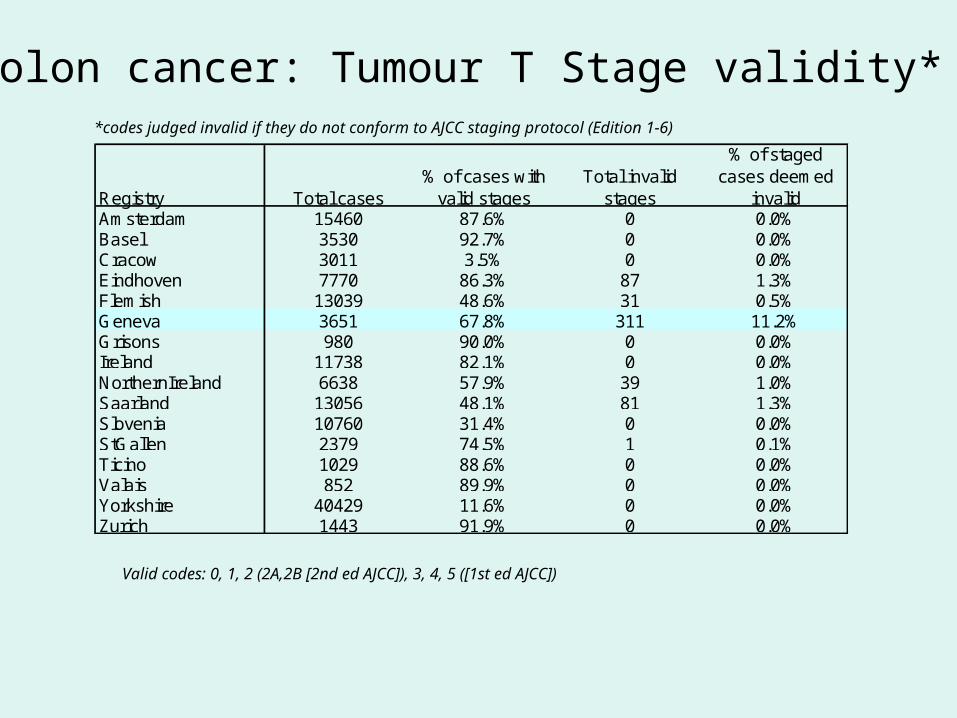
Colon cancer: Tumour T Stage validity**codes judged invalid if they do not conform to AJCC staging protocol (Edition 1-6)
Registry Total cases% of cases with
valid stagesTotal invalid
stages
% of staged cases deemed
invalidAmsterdam 15460 87.6% 0 0.0%Basel 3530 92.7% 0 0.0%Cracow 3011 3.5% 0 0.0%Eindhoven 7770 86.3% 87 1.3%Flemish 13039 48.6% 31 0.5%Geneva 3651 67.8% 311 11.2%Grisons 980 90.0% 0 0.0%Ireland 11738 82.1% 0 0.0%NorthernIreland 6638 57.9% 39 1.0%Saarland 13056 48.1% 81 1.3%Slovenia 10760 31.4% 0 0.0%StGallen 2379 74.5% 1 0.1%Ticino 1029 88.6% 0 0.0%Valais 852 89.9% 0 0.0%Yorkshire 40429 11.6% 0 0.0%Zurich 1443 91.9% 0 0.0%
Valid codes: 0, 1, 2 (2A,2B [2nd ed AJCC]), 3, 4, 5 ([1st ed AJCC])
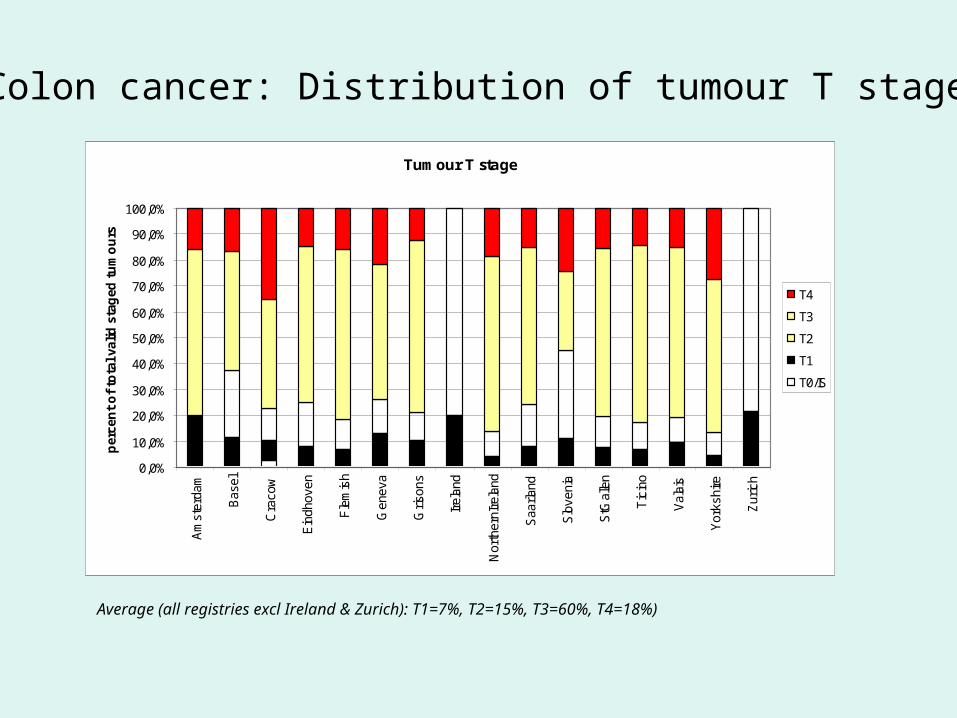
Colon cancer: Distribution of tumour T stage
Tumour T stage
0,0%
10,0%
20,0%
30,0%
40,0%
50,0%
60,0%
70,0%
80,0%
90,0%
100,0%A
mst
erda
m
Bas
el
Cra
cow
Ein
dhov
en
Fle
mis
h
Gen
eva
Gris
ons
Irel
and
Nor
ther
nIre
land
Saa
rland
Slo
veni
a
StG
alle
n
Tic
ino
Val
ais
Yor
kshi
re
Zur
ich
per
cen
t o
f to
tal v
alid
sta
ged
tu
mo
urs
T4
T3
T2
T1
T0/IS
Average (all registries excl Ireland & Zurich): T1=7%, T2=15%, T3=60%, T4=18%)
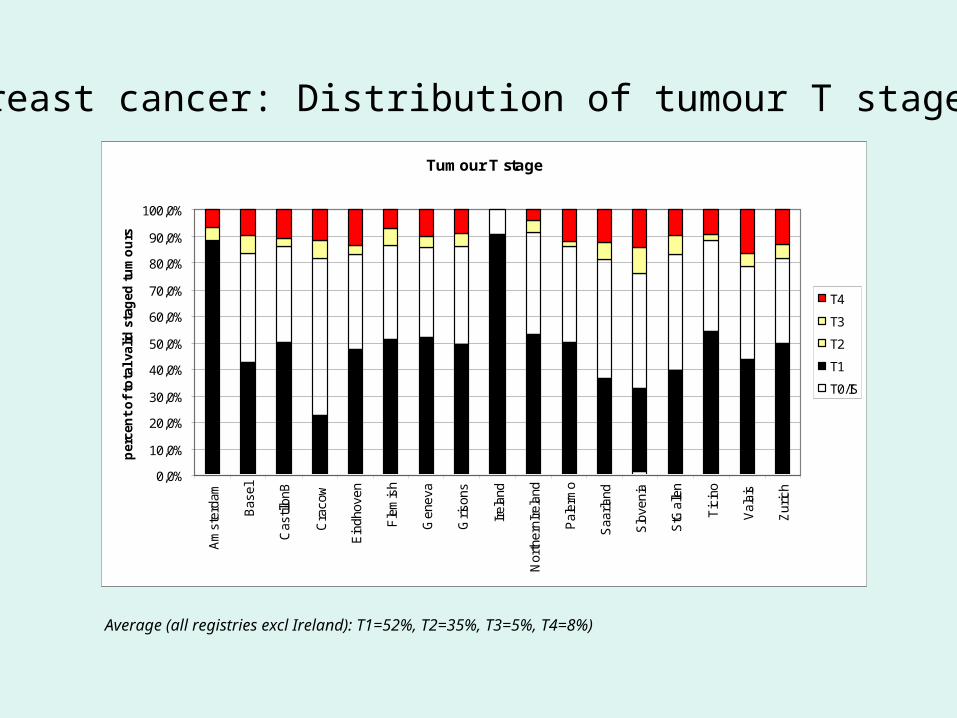
Breast cancer: Distribution of tumour T stage
Tumour T stage
0,0%
10,0%
20,0%
30,0%
40,0%
50,0%
60,0%
70,0%
80,0%
90,0%
100,0%A
mst
erda
m
Bas
el
Cas
tillo
nB
Cra
cow
Ein
dhov
en
Fle
mis
h
Gen
eva
Gris
ons
Irel
and
Nor
ther
nIre
land
Pal
erm
o
Saa
rland
Slo
veni
a
StG
alle
n
Tic
ino
Val
ais
Zur
ich
per
cen
t o
f to
tal v
alid
sta
ged
tu
mo
urs
T4
T3
T2
T1
T0/IS
Average (all registries excl Ireland): T1=52%, T2=35%, T3=5%, T4=8%)
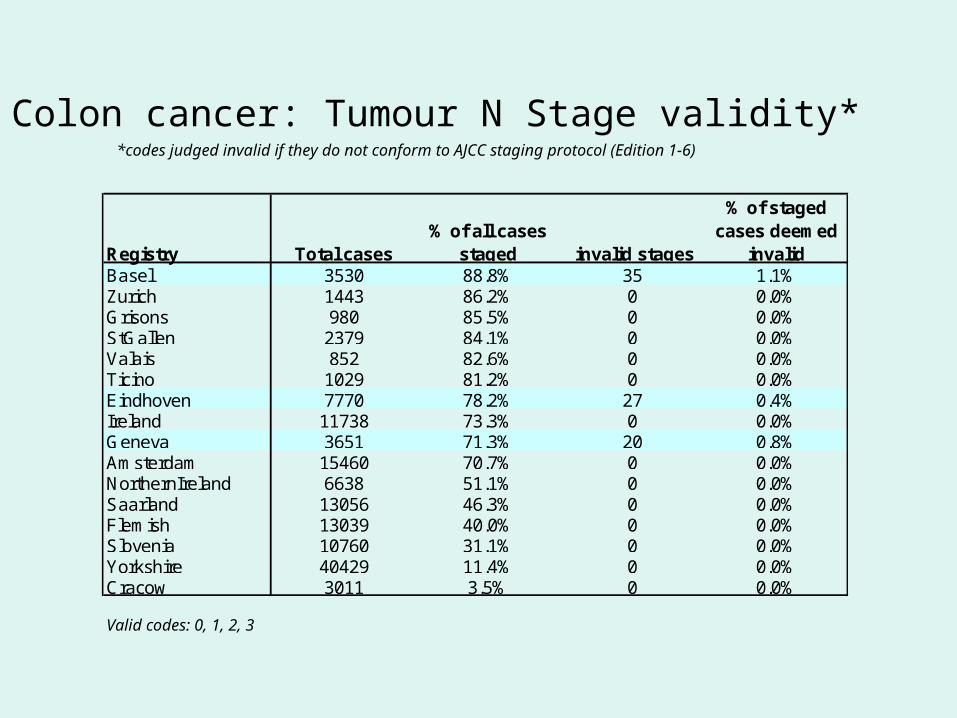
Registry Total cases% of all cases
staged invalid stages
% of staged cases deemed
invalidBasel 3530 88.8% 35 1.1%Zurich 1443 86.2% 0 0.0%Grisons 980 85.5% 0 0.0%StGallen 2379 84.1% 0 0.0%Valais 852 82.6% 0 0.0%Ticino 1029 81.2% 0 0.0%Eindhoven 7770 78.2% 27 0.4%Ireland 11738 73.3% 0 0.0%Geneva 3651 71.3% 20 0.8%Amsterdam 15460 70.7% 0 0.0%NorthernIreland 6638 51.1% 0 0.0%Saarland 13056 46.3% 0 0.0%Flemish 13039 40.0% 0 0.0%Slovenia 10760 31.1% 0 0.0%Yorkshire 40429 11.4% 0 0.0%Cracow 3011 3.5% 0 0.0%
Colon cancer: Tumour N Stage validity**codes judged invalid if they do not conform to AJCC staging protocol (Edition 1-6)
Valid codes: 0, 1, 2, 3
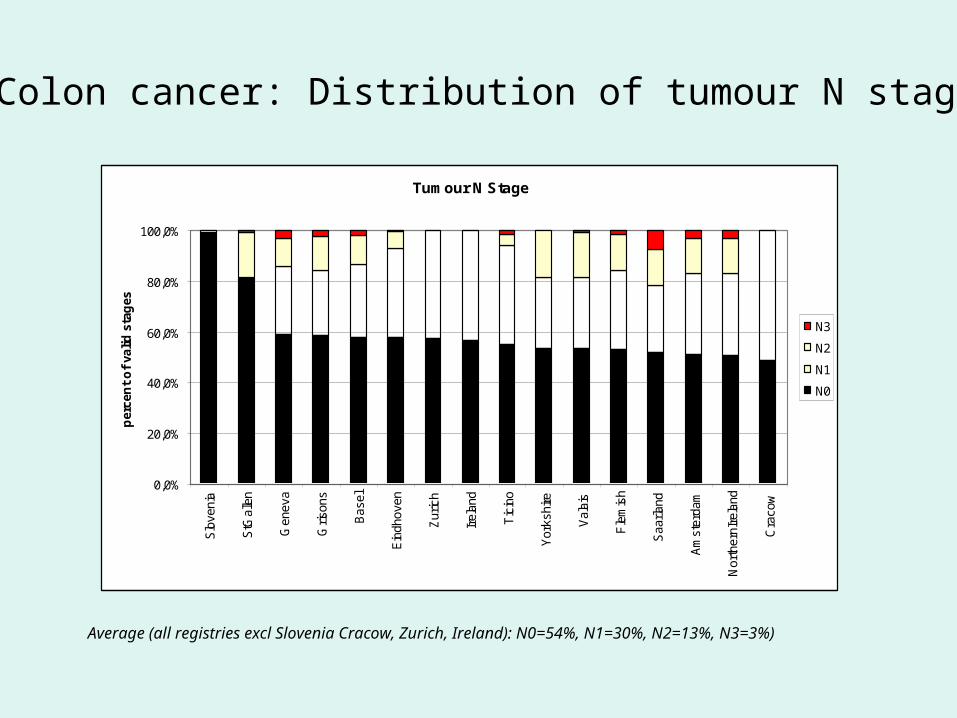
Colon cancer: Distribution of tumour N stage
Tumour N Stage
0,0%
20,0%
40,0%
60,0%
80,0%
100,0%
Slo
veni
a
StG
alle
n
Gen
eva
Gris
ons
Bas
el
Ein
dhov
en
Zur
ich
Irel
and
Tic
ino
Yor
kshi
re
Val
ais
Fle
mis
h
Saa
rland
Am
ster
dam
Nor
ther
nIre
land
Cra
cow
per
cen
t o
f va
lid s
tag
es
N3
N2
N1
N0
Average (all registries excl Slovenia Cracow, Zurich, Ireland): N0=54%, N1=30%, N2=13%, N3=3%)
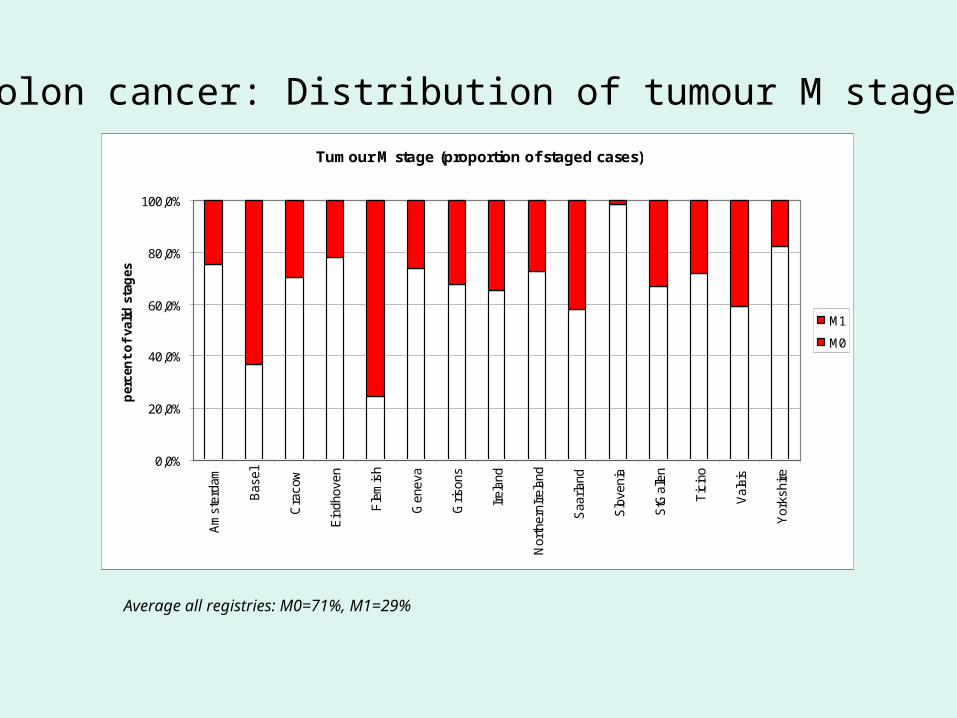
Colon cancer: Distribution of tumour M stage
Average all registries: M0=71%, M1=29%
Tumour M stage (proportion of staged cases)
0,0%
20,0%
40,0%
60,0%
80,0%
100,0%A
mst
erda
m
Bas
el
Cra
cow
Ein
dhov
en
Fle
mis
h
Gen
eva
Gris
ons
Irel
and
Nor
ther
nIre
land
Saa
rland
Slo
veni
a
StG
alle
n
Tic
ino
Val
ais
Yor
kshi
re
per
cen
t o
f va
lid s
tag
es
M1
M0
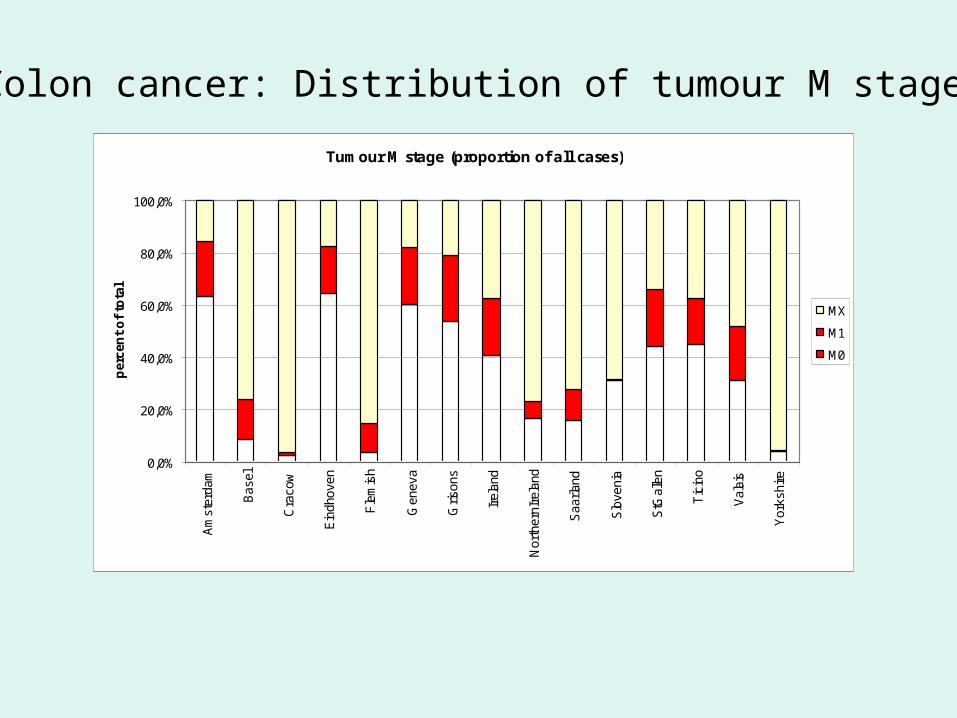
Colon cancer: Distribution of tumour M stage
Tumour M stage (proportion of all cases)
0,0%
20,0%
40,0%
60,0%
80,0%
100,0%A
mst
erda
m
Bas
el
Cra
cow
Ein
dhov
en
Fle
mis
h
Gen
eva
Gris
ons
Irel
and
Nor
ther
nIre
land
Saa
rland
Slo
veni
a
StG
alle
n
Tic
ino
Val
ais
Yor
kshi
re
per
cen
t o
f to
tal
MX
M1
M0
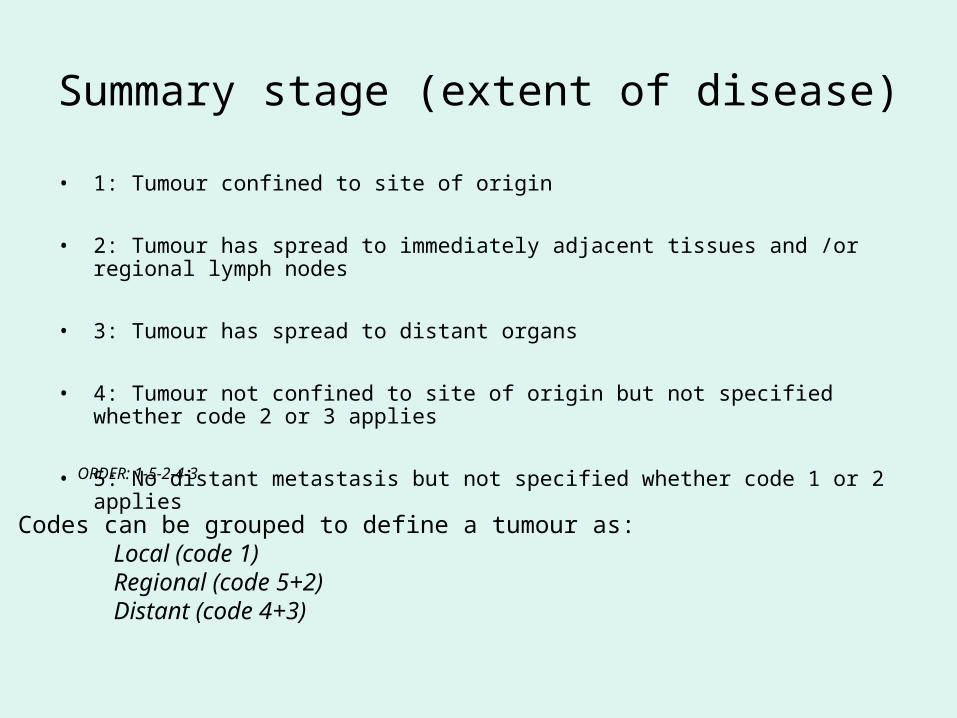
Summary stage (extent of disease)
• 1: Tumour confined to site of origin
• 2: Tumour has spread to immediately adjacent tissues and /or regional lymph nodes
• 3: Tumour has spread to distant organs
• 4: Tumour not confined to site of origin but not specified whether code 2 or 3 applies
• 5: No distant metastasis but not specified whether code 1 or 2 applies
Codes can be grouped to define a tumour as:Local (code 1)Regional (code 5+2)Distant (code 4+3)
ORDER: 1-5-2-4-3
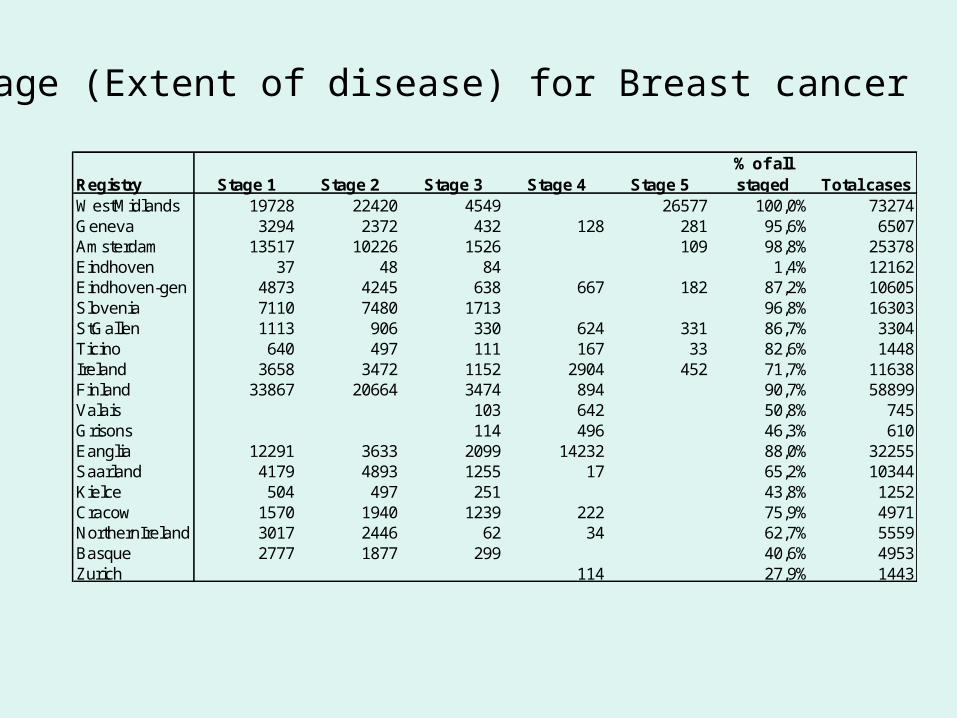
Stage (Extent of disease) for Breast cancer
Registry Stage 1 Stage 2 Stage 3 Stage 4 Stage 5% of all staged Total cases
WestMidlands 19728 22420 4549 26577 100,0% 73274Geneva 3294 2372 432 128 281 95,6% 6507Amsterdam 13517 10226 1526 109 98,8% 25378Eindhoven 37 48 84 1,4% 12162Eindhoven-gen 4873 4245 638 667 182 87,2% 10605Slovenia 7110 7480 1713 96,8% 16303StGallen 1113 906 330 624 331 86,7% 3304Ticino 640 497 111 167 33 82,6% 1448Ireland 3658 3472 1152 2904 452 71,7% 11638Finland 33867 20664 3474 894 90,7% 58899Valais 103 642 50,8% 745Grisons 114 496 46,3% 610Eanglia 12291 3633 2099 14232 88,0% 32255Saarland 4179 4893 1255 17 65,2% 10344Kielce 504 497 251 43,8% 1252Cracow 1570 1940 1239 222 75,9% 4971NorthernIreland 3017 2446 62 34 62,7% 5559Basque 2777 1877 299 40,6% 4953Zurich 114 27,9% 1443
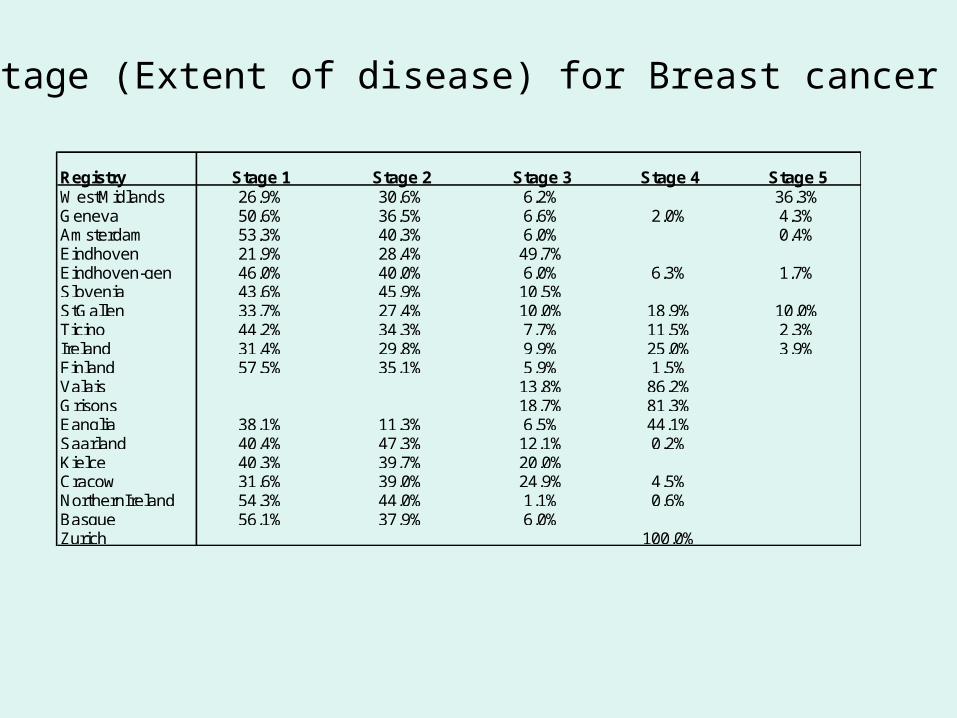
Stage (Extent of disease) for Breast cancer
Registry Stage 1 Stage 2 Stage 3 Stage 4 Stage 5WestMidlands 26,9% 30,6% 6,2% 36,3%Geneva 50,6% 36,5% 6,6% 2,0% 4,3%Amsterdam 53,3% 40,3% 6,0% 0,4%Eindhoven 21,9% 28,4% 49,7%Eindhoven-gen 46,0% 40,0% 6,0% 6,3% 1,7%Slovenia 43,6% 45,9% 10,5%StGallen 33,7% 27,4% 10,0% 18,9% 10,0%Ticino 44,2% 34,3% 7,7% 11,5% 2,3%Ireland 31,4% 29,8% 9,9% 25,0% 3,9%Finland 57,5% 35,1% 5,9% 1,5%Valais 13,8% 86,2%Grisons 18,7% 81,3%Eanglia 38,1% 11,3% 6,5% 44,1%Saarland 40,4% 47,3% 12,1% 0,2%Kielce 40,3% 39,7% 20,0%Cracow 31,6% 39,0% 24,9% 4,5%NorthernIreland 54,3% 44,0% 1,1% 0,6%Basque 56,1% 37,9% 6,0%Zurich 100,0%
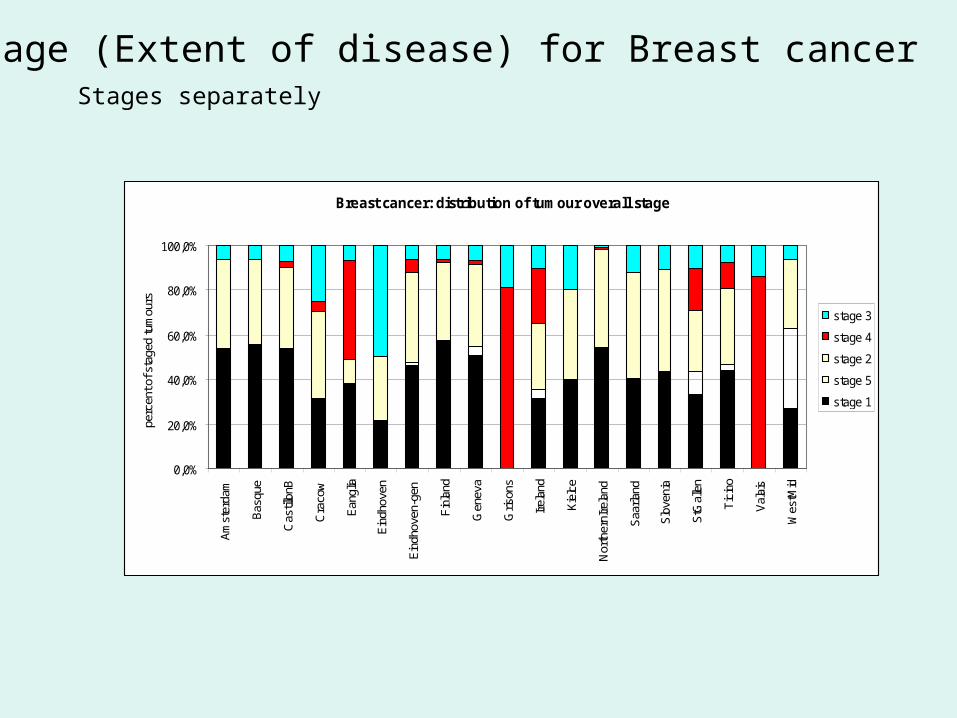
Stage (Extent of disease) for Breast cancer
Breast cancer: distribution of tumour overall stage
0,0%
20,0%
40,0%
60,0%
80,0%
100,0%
Am
ster
dam
Bas
que
Cas
tillo
nB
Cra
cow
Ean
glia
Ein
dhov
en
Ein
dhov
en-g
en
Fin
land
Gen
eva
Gris
ons
Irel
and
Kie
lce
Nor
ther
nIre
land
Saa
rland
Slo
veni
a
StG
alle
n
Tic
ino
Val
ais
Wes
tMid
perc
ent o
f sta
ged
tum
ours
stage 3
stage 4
stage 2
stage 5
stage 1
Stages separately
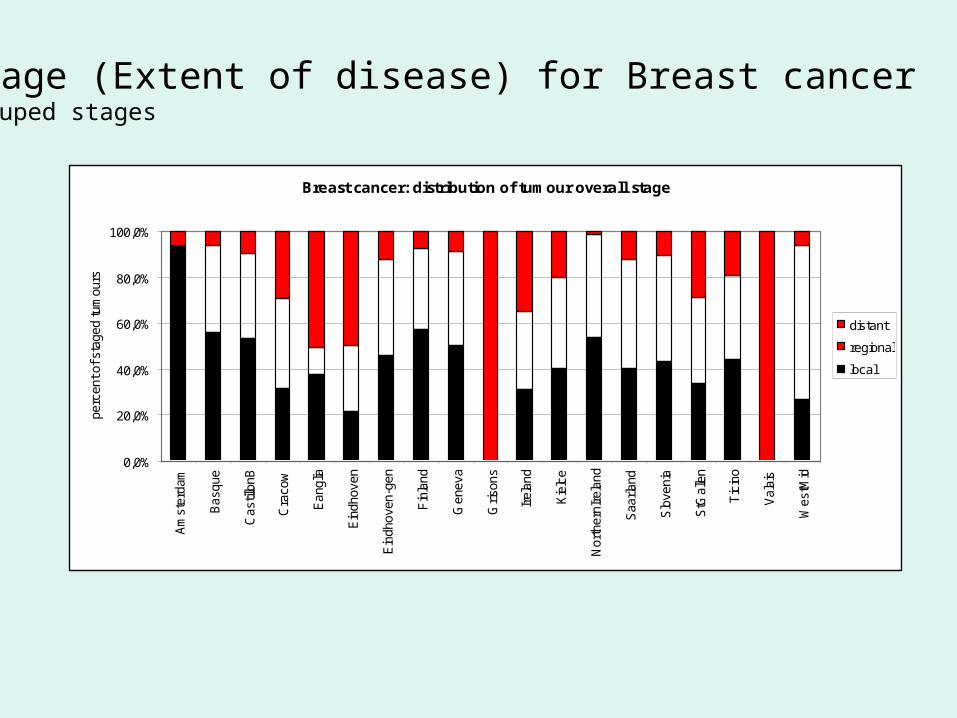
Stage (Extent of disease) for Breast cancerGrouped stages
Breast cancer: distribution of tumour overall stage
0,0%
20,0%
40,0%
60,0%
80,0%
100,0%
Am
ster
dam
Bas
que
Cas
tillo
nB
Cra
cow
Ean
glia
Ein
dhov
en
Ein
dhov
en-g
en
Fin
land
Gen
eva
Gris
ons
Irel
and
Kie
lce
Nor
ther
nIre
land
Saa
rland
Slo
veni
a
StG
alle
n
Tic
ino
Val
ais
Wes
tMid
perc
ent o
f sta
ged
tum
ours
distant
regional
local
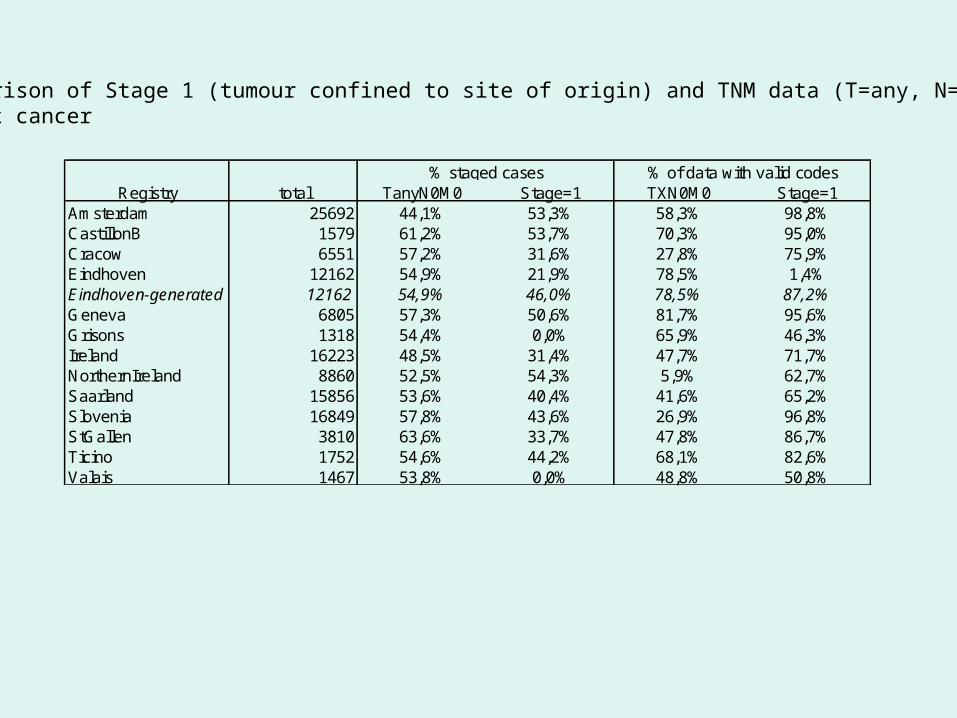
Registry total TanyN0M0 Stage=1 TXN0M0 Stage=1Amsterdam 25692 44,1% 53,3% 58,3% 98,8%CastillonB 1579 61,2% 53,7% 70,3% 95,0%Cracow 6551 57,2% 31,6% 27,8% 75,9%Eindhoven 12162 54,9% 21,9% 78,5% 1,4%Eindhoven-generated 12162 54,9% 46,0% 78,5% 87,2%Geneva 6805 57,3% 50,6% 81,7% 95,6%Grisons 1318 54,4% 0,0% 65,9% 46,3%Ireland 16223 48,5% 31,4% 47,7% 71,7%NorthernIreland 8860 52,5% 54,3% 5,9% 62,7%Saarland 15856 53,6% 40,4% 41,6% 65,2%Slovenia 16849 57,8% 43,6% 26,9% 96,8%StGallen 3810 63,6% 33,7% 47,8% 86,7%Ticino 1752 54,6% 44,2% 68,1% 82,6%Valais 1467 53,8% 0,0% 48,8% 50,8%
% staged cases % of data with valid codes
Comparison of Stage 1 (tumour confined to site of origin) and TNM data (T=any, N=0, M=0)Breast cancer
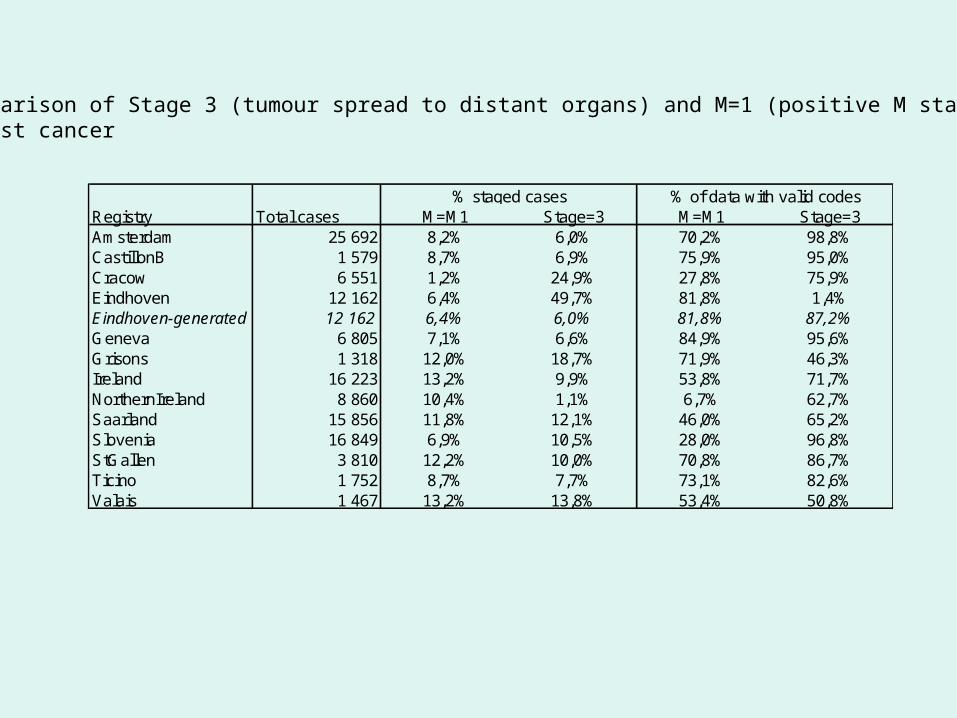
Registry Total cases M=M1 Stage=3 M=M1 Stage=3Amsterdam 25 692 8,2% 6,0% 70,2% 98,8%CastillonB 1 579 8,7% 6,9% 75,9% 95,0%Cracow 6 551 1,2% 24,9% 27,8% 75,9%Eindhoven 12 162 6,4% 49,7% 81,8% 1,4%Eindhoven-generated 12 162 6,4% 6,0% 81,8% 87,2%Geneva 6 805 7,1% 6,6% 84,9% 95,6%Grisons 1 318 12,0% 18,7% 71,9% 46,3%Ireland 16 223 13,2% 9,9% 53,8% 71,7%NorthernIreland 8 860 10,4% 1,1% 6,7% 62,7%Saarland 15 856 11,8% 12,1% 46,0% 65,2%Slovenia 16 849 6,9% 10,5% 28,0% 96,8%StGallen 3 810 12,2% 10,0% 70,8% 86,7%Ticino 1 752 8,7% 7,7% 73,1% 82,6%Valais 1 467 13,2% 13,8% 53,4% 50,8%
% staged cases % of data with valid codes
Comparison of Stage 3 (tumour spread to distant organs) and M=1 (positive M stage) dataBreast cancer
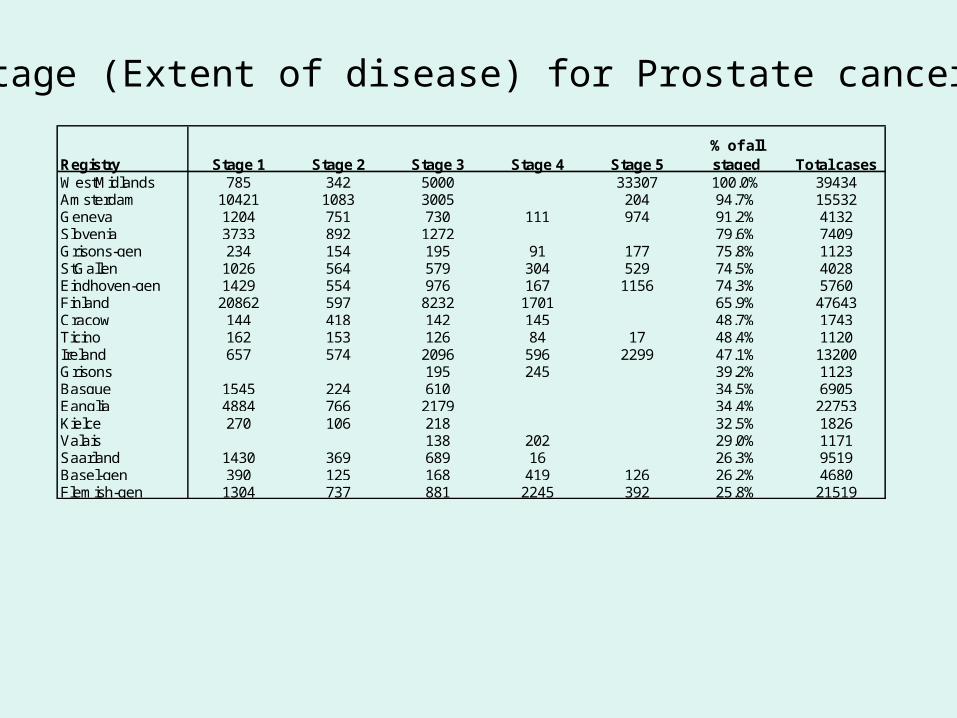
Stage (Extent of disease) for Prostate cancer
Registry Stage 1 Stage 2 Stage 3 Stage 4 Stage 5% of all staged Total cases
WestMidlands 785 342 5000 33307 100.0% 39434Amsterdam 10421 1083 3005 204 94.7% 15532Geneva 1204 751 730 111 974 91.2% 4132Slovenia 3733 892 1272 79.6% 7409Grisons-gen 234 154 195 91 177 75.8% 1123StGallen 1026 564 579 304 529 74.5% 4028Eindhoven-gen 1429 554 976 167 1156 74.3% 5760Finland 20862 597 8232 1701 65.9% 47643Cracow 144 418 142 145 48.7% 1743Ticino 162 153 126 84 17 48.4% 1120Ireland 657 574 2096 596 2299 47.1% 13200Grisons 195 245 39.2% 1123Basque 1545 224 610 34.5% 6905Eanglia 4884 766 2179 34.4% 22753Kielce 270 106 218 32.5% 1826Valais 138 202 29.0% 1171Saarland 1430 369 689 16 26.3% 9519Basel-gen 390 125 168 419 126 26.2% 4680Flemish-gen 1304 737 881 2245 392 25.8% 21519
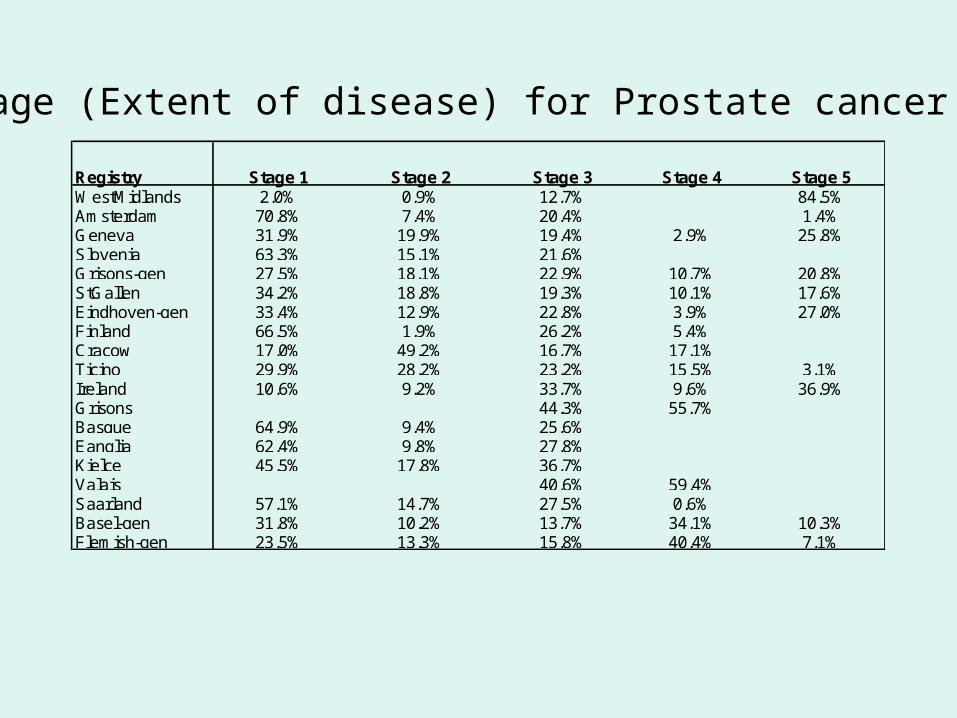
Stage (Extent of disease) for Prostate cancer
Registry Stage 1 Stage 2 Stage 3 Stage 4 Stage 5WestMidlands 2,0% 0,9% 12,7% 84,5%Amsterdam 70,8% 7,4% 20,4% 1,4%Geneva 31,9% 19,9% 19,4% 2,9% 25,8%Slovenia 63,3% 15,1% 21,6%Grisons-gen 27,5% 18,1% 22,9% 10,7% 20,8%StGallen 34,2% 18,8% 19,3% 10,1% 17,6%Eindhoven-gen 33,4% 12,9% 22,8% 3,9% 27,0%Finland 66,5% 1,9% 26,2% 5,4%Cracow 17,0% 49,2% 16,7% 17,1%Ticino 29,9% 28,2% 23,2% 15,5% 3,1%Ireland 10,6% 9,2% 33,7% 9,6% 36,9%Grisons 44,3% 55,7%Basque 64,9% 9,4% 25,6%Eanglia 62,4% 9,8% 27,8%Kielce 45,5% 17,8% 36,7%Valais 40,6% 59,4%Saarland 57,1% 14,7% 27,5% 0,6%Basel-gen 31,8% 10,2% 13,7% 34,1% 10,3%Flemish-gen 23,5% 13,3% 15,8% 40,4% 7,1%
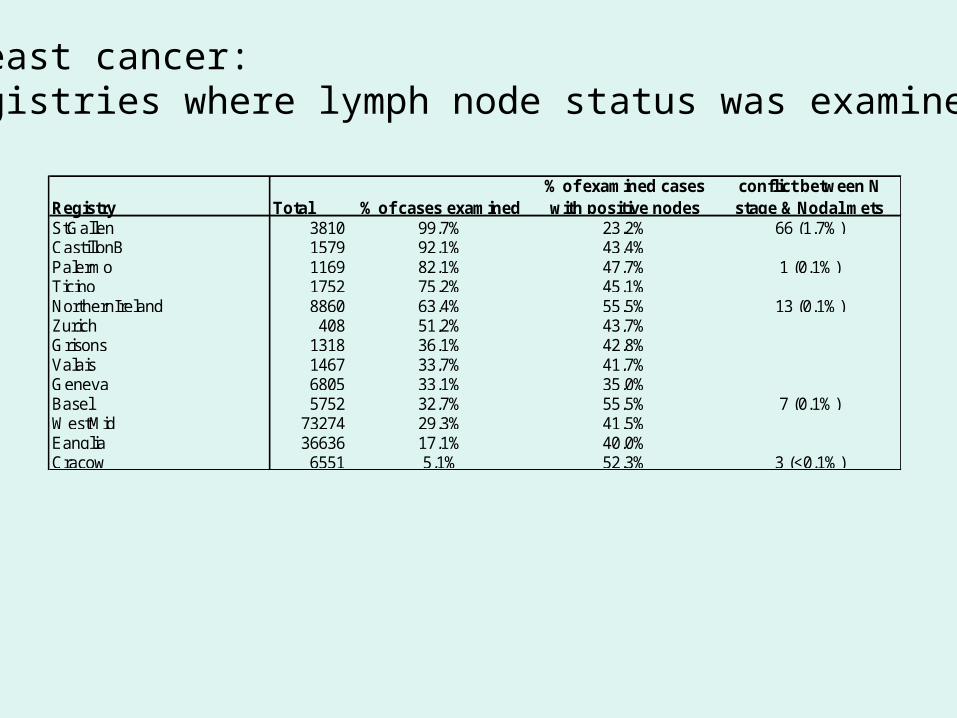
Breast cancer: Registries where lymph node status was examined
Registry Total % of cases examined% of examined cases with positive nodes
conflict between N stage & Nodal mets
StGallen 3810 99,7% 23,2% 66 (1.7%)CastillonB 1579 92,1% 43,4%Palermo 1169 82,1% 47,7% 1 (0.1%)Ticino 1752 75,2% 45,1%NorthernIreland 8860 63,4% 55,5% 13 (0.1%)Zurich 408 51,2% 43,7%Grisons 1318 36,1% 42,8%Valais 1467 33,7% 41,7%Geneva 6805 33,1% 35,0%Basel 5752 32,7% 55,5% 7 (0.1%)WestMid 73274 29,3% 41,5%Eanglia 36636 17,1% 40,0%Cracow 6551 5,1% 52,3% 3 (<0.1%)
Tumour size
0.0%
10.0%
20.0%
30.0%
40.0%
50.0%
0 1-19 20-39 40-59 60-79 80+
% o
f al
l sez
ed t
um
ou
rs
Eanglia (7.3%)
Geneva (92.4%)
NorthernIreland (25.6%)
WestMidlands (15.4%)
Yorkshire (6.7%)
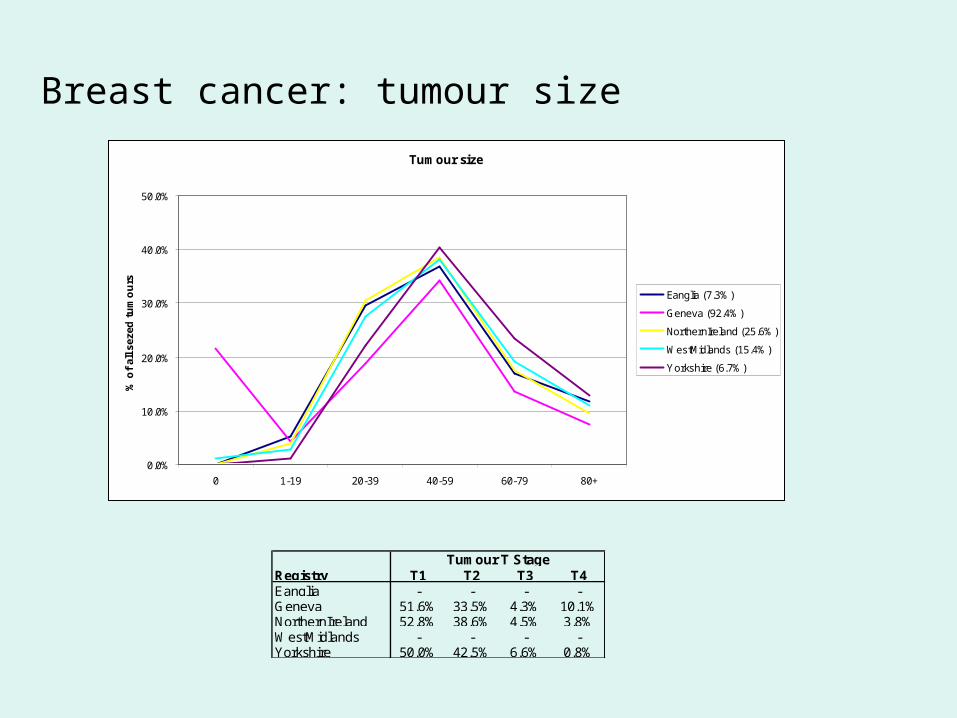
Breast cancer: tumour size
Registry T1 T2 T3 T4Eanglia - - - -Geneva 51.6% 33.5% 4.3% 10.1%NorthernIreland 52.8% 38.6% 4.5% 3.8%WestMidlands - - - -Yorkshire 50.0% 42.5% 6.6% 0.8%
Tumour T Stage
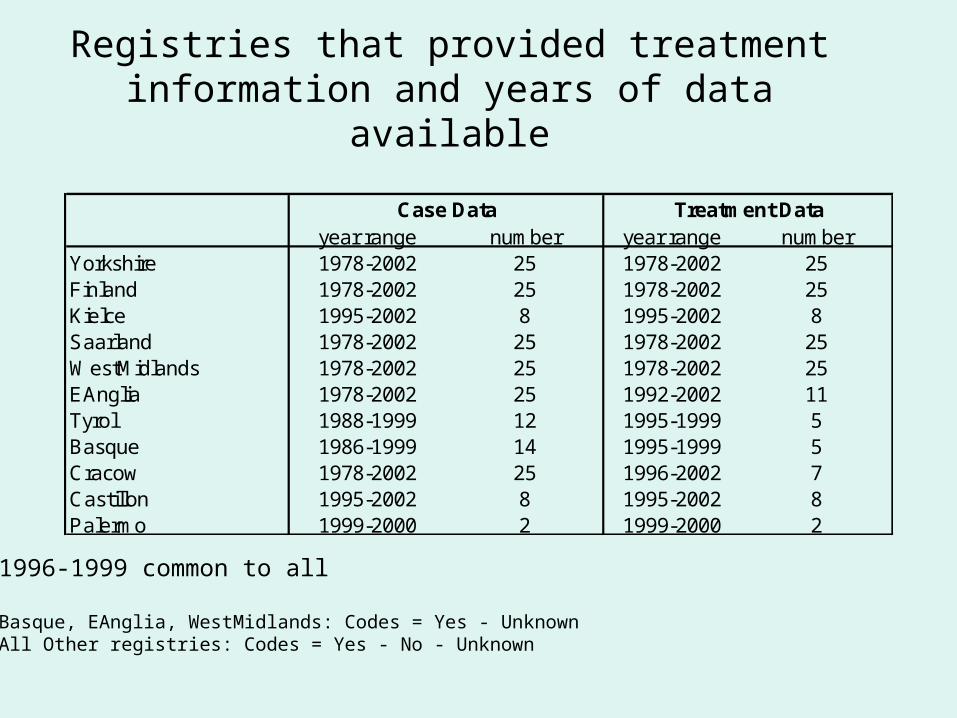
Registries that provided treatment information and years of data available
year range number year range numberYorkshire 1978-2002 25 1978-2002 25Finland 1978-2002 25 1978-2002 25Kielce 1995-2002 8 1995-2002 8Saarland 1978-2002 25 1978-2002 25WestMidlands 1978-2002 25 1978-2002 25EAnglia 1978-2002 25 1992-2002 11Tyrol 1988-1999 12 1995-1999 5Basque 1986-1999 14 1995-1999 5Cracow 1978-2002 25 1996-2002 7Castillon 1995-2002 8 1995-2002 8Palermo 1999-2000 2 1999-2000 2
Case Data Treatment Data
1996-1999 common to all
Basque, EAnglia, WestMidlands: Codes = Yes - UnknownAll Other registries: Codes = Yes - No - Unknown
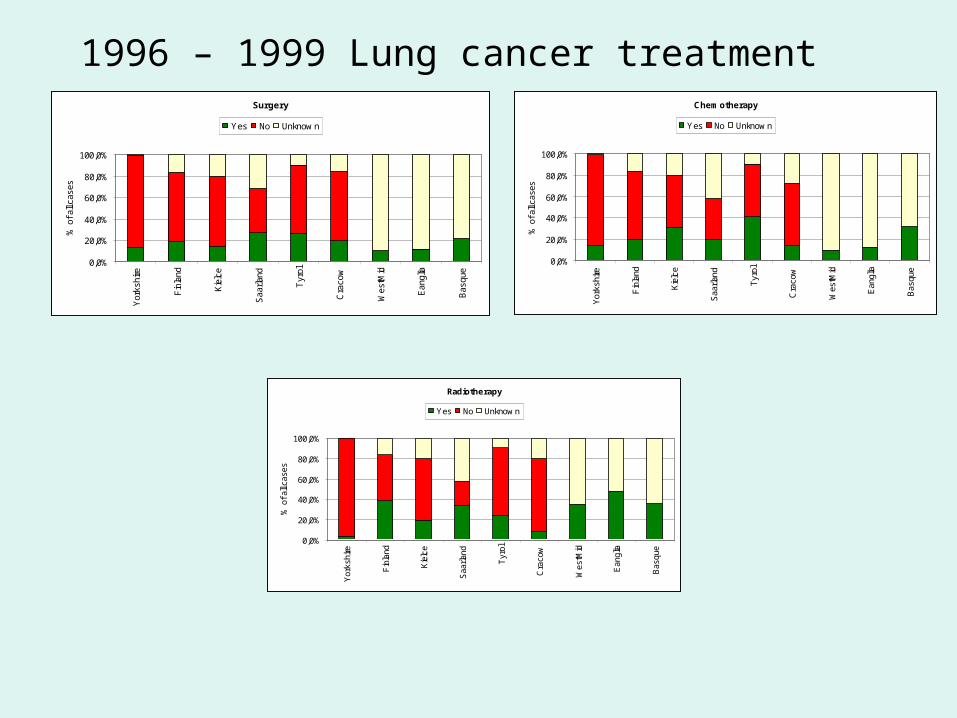
1996 – 1999 Lung cancer treatmentSurgery
0,0%
20,0%
40,0%
60,0%
80,0%
100,0%
Yor
kshi
re
Fin
land
Kie
lce
Saa
rland
Tyr
ol
Cra
cow
Wes
tMid
Ean
glia
Bas
que
% o
f all
case
s
Yes No Unknow n
Chemotherapy
0,0%
20,0%
40,0%
60,0%
80,0%
100,0%
Yor
kshi
re
Fin
land
Kie
lce
Saa
rland
Tyr
ol
Cra
cow
Wes
tMid
Ean
glia
Bas
que
% o
f all
case
s
Yes No Unknow n
Radiotherapy
0,0%
20,0%
40,0%
60,0%
80,0%
100,0%
Yor
kshi
re
Fin
land
Kie
lce
Saa
rland
Tyr
ol
Cra
cow
Wes
tMid
Ean
glia
Bas
que
% o
f all
case
s
Yes No Unknow n
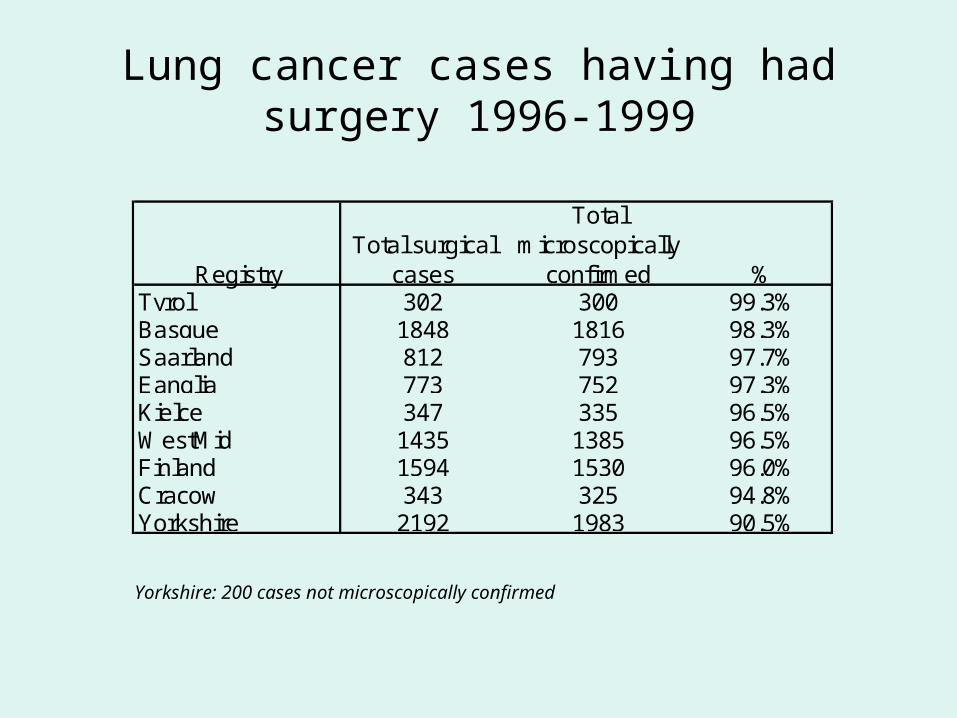
Lung cancer cases having had surgery 1996-1999
RegistryTotal surgical
cases
Total microscopically
confirmed %Tyrol 302 300 99.3%Basque 1848 1816 98.3%Saarland 812 793 97.7%Eanglia 773 752 97.3%Kielce 347 335 96.5%WestMid 1435 1385 96.5%Finland 1594 1530 96.0%Cracow 343 325 94.8%Yorkshire 2192 1983 90.5%
% chemotherapy
0.0%
10.0%
20.0%
30.0%
40.0%
50.0%
Yor
kshi
re
Fin
land
Kie
lce
Saa
rland
Wes
tMid
Ean
glia
Tyr
ol
Bas
que
Cra
cow
perc
ent
of c
ases
Yorkshire: 200 cases not microscopically confirmed
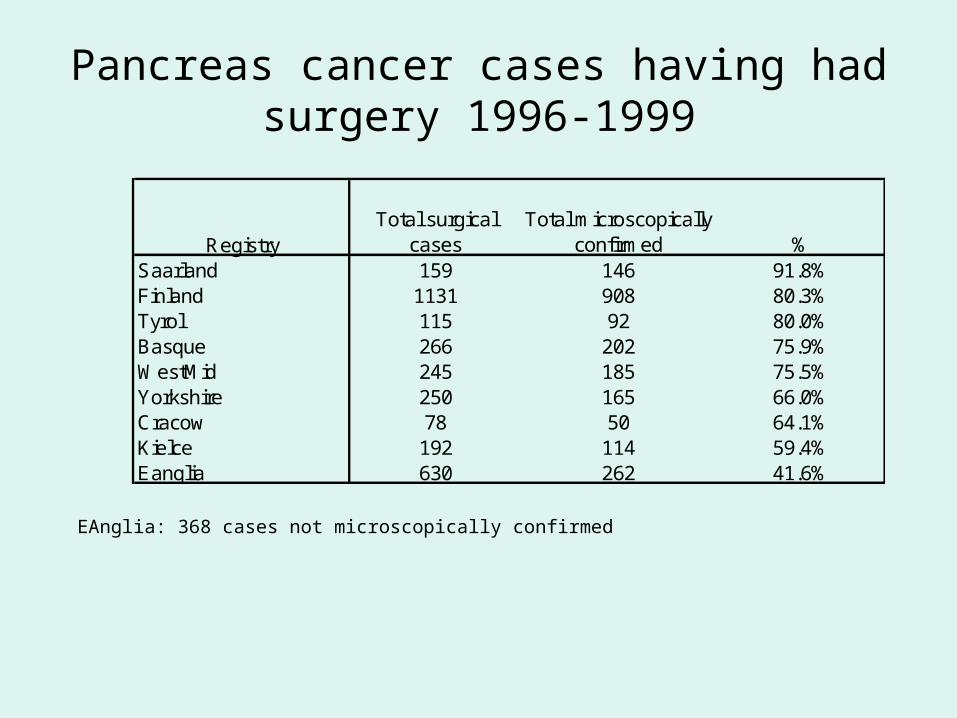
Pancreas cancer cases having had surgery 1996-1999
RegistryTotal surgical
casesTotal microscopically
confirmed %Saarland 159 146 91.8%Finland 1131 908 80.3%Tyrol 115 92 80.0%Basque 266 202 75.9%WestMid 245 185 75.5%Yorkshire 250 165 66.0%Cracow 78 50 64.1%Kielce 192 114 59.4%Eanglia 630 262 41.6%
EAnglia: 368 cases not microscopically confirmed
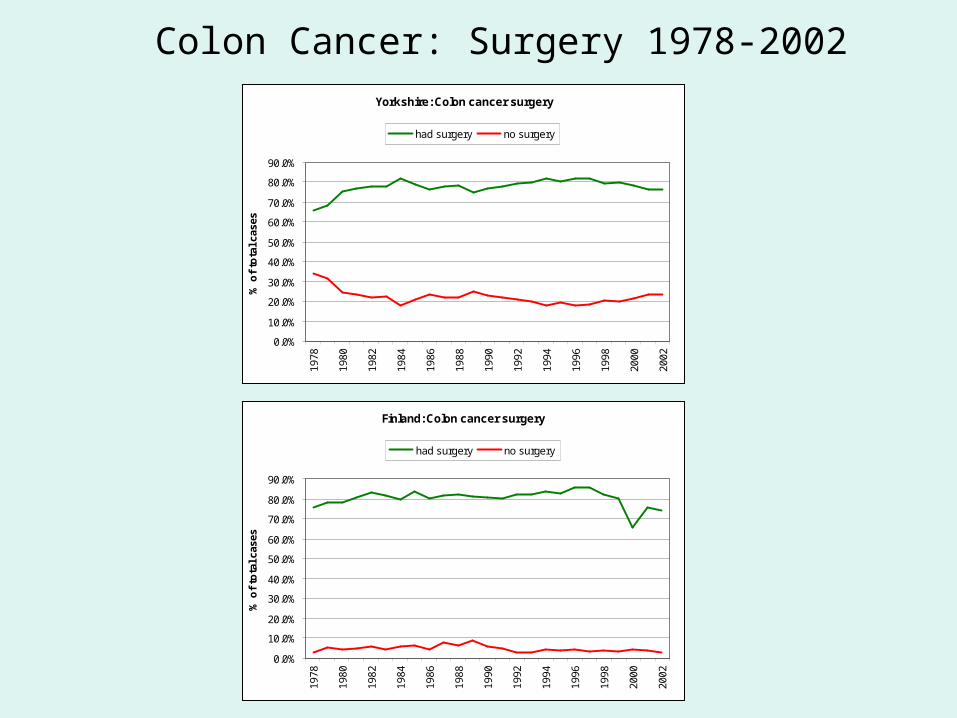
Yorkshire: Colon cancer surgery
0.0%
10.0%
20.0%
30.0%
40.0%
50.0%
60.0%
70.0%
80.0%
90.0%
1978
1980
1982
1984
1986
1988
1990
1992
1994
1996
1998
2000
2002
% o
f to
tal c
ases
had surgery no surgery
Finland: Colon cancer surgery
0.0%
10.0%
20.0%
30.0%
40.0%
50.0%
60.0%
70.0%
80.0%
90.0%
1978
1980
1982
1984
1986
1988
1990
1992
1994
1996
1998
2000
2002
% o
f to
tal c
ases
had surgery no surgery
Colon Cancer: Surgery 1978-2002
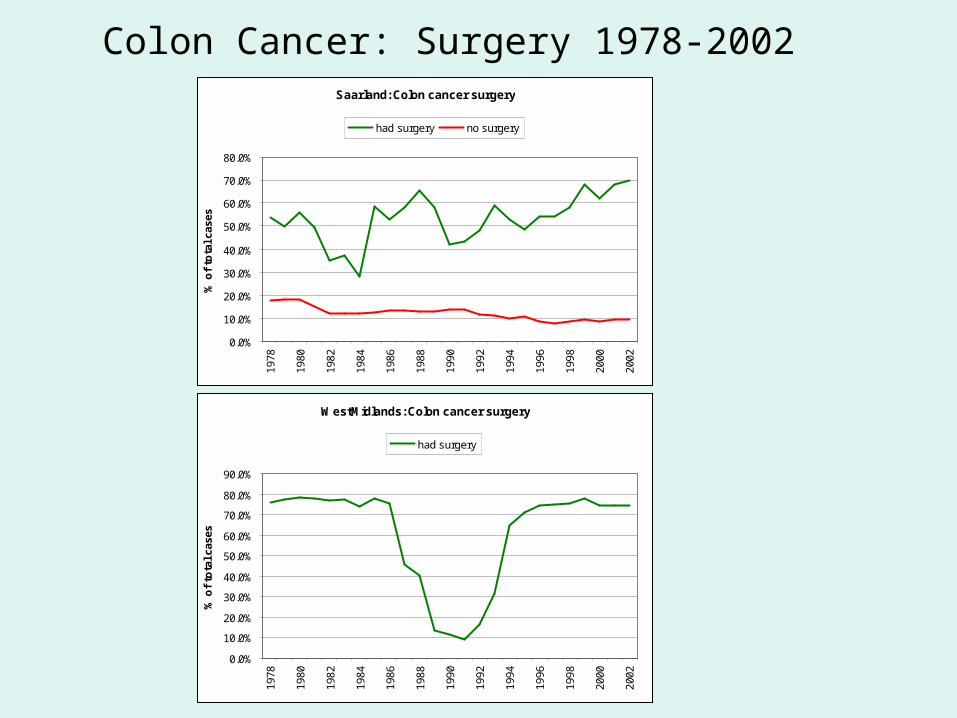
Saarland: Colon cancer surgery
0.0%
10.0%
20.0%
30.0%
40.0%
50.0%
60.0%
70.0%
80.0%
1978
1980
1982
1984
1986
1988
1990
1992
1994
1996
1998
2000
2002
% o
f to
tal c
ases
had surgery no surgery
WestMidlands: Colon cancer surgery
0.0%
10.0%
20.0%
30.0%
40.0%
50.0%
60.0%
70.0%
80.0%
90.0%
1978
1980
1982
1984
1986
1988
1990
1992
1994
1996
1998
2000
2002
% o
f to
tal c
ases
had surgery
Colon Cancer: Surgery 1978-2002


![Registries: oase of fata morgana? - NVTAG · Microsoft PowerPoint - NVTAG registries oase of fata morgana [Read-Only] Author: CAME Created Date: 1/14/2016 2:11:50 PM](https://img.pdfslide.net/doc/110x75/604755b632eb2414c221e233/registries-oase-of-fata-morgana-microsoft-powerpoint-nvtag-registries-oase.jpg)