Embed Size (px)
Citation preview

Analysis of Turbine Wake Characteristics using Proper Orthogonal Decomposition and Triple Decomposition Methods
Pavithra Premaratne, Wei Tian, Hui Hu
Advanced Flow Diagnostics and Experimental Aerodynamics Laboratory Department of Aerospace Engineering
Iowa State University 2242 Howe Hall, Ames, Iowa 50011-2271
Contents • Motivation and Objectives • Experiment setup • Predicting velocity deficit in the wake • Triple Decomposition (TD) • Proper Orthogonal Decomposition (POD) • Future work (DMD)

Motivation and Objectives
• The study of wake behind a wind turbine is crucial in determining the wind farm layouts.
• The study focuses on understanding the momentum recovery process through quantitative and qualitative analysis.
Image courtesy:
http://nstergiannis.blogspot.com/
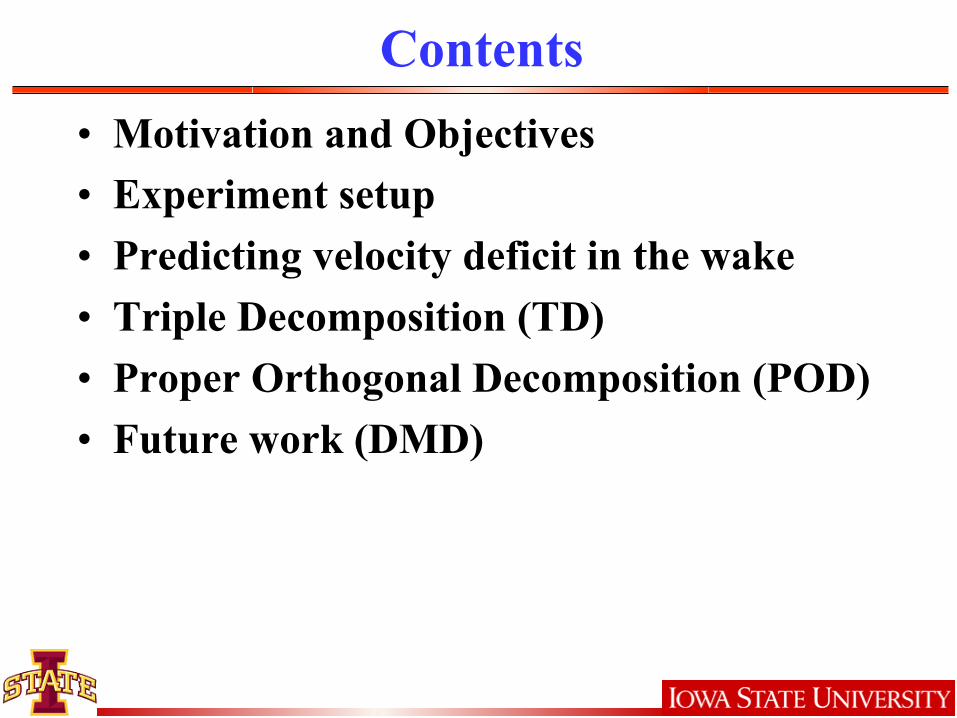
Simulation of Atmospheric Boundary Layer (ABL) Winds
Offshore wind farm (9.5% at hub height)
Hansen & Barthelmie, Wind Energ.2012;15:183–196
Architecture Institute of Japan
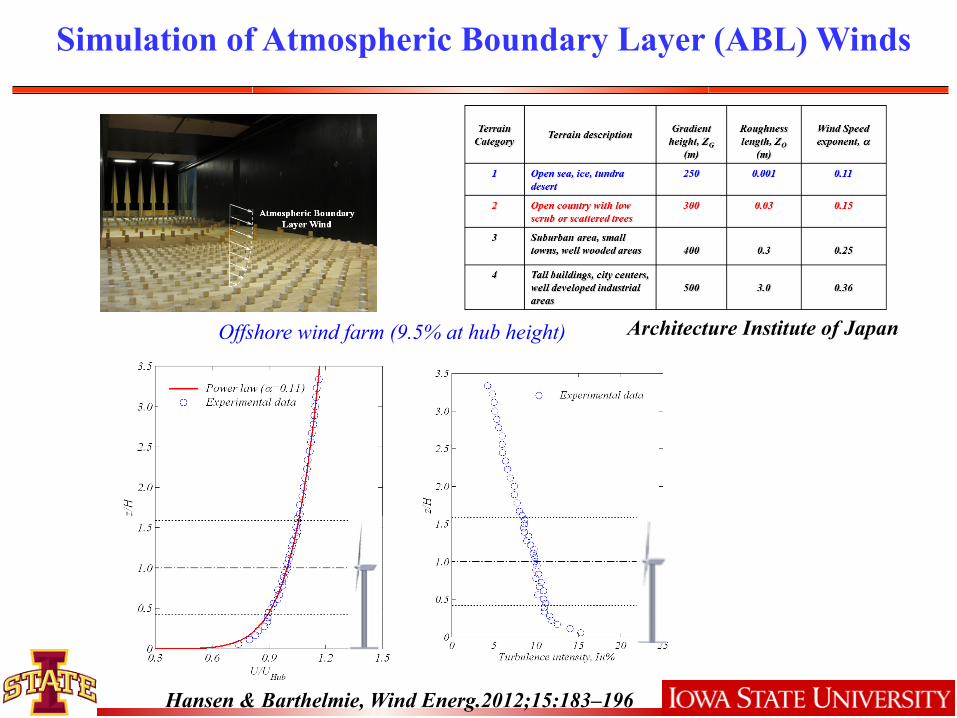
Wind Turbine Models
Parameter
R (mm)
H (mm)
d pole
(mm)
d nacelle
(mm)
α (deg.)
a (mm)
a1 (mm)
A2 (mm)
Dimension 127 226 18 18 5o 68 20 35
1:350 scaled model to simulate a 2MW wind turbine ERS-100 prototype of wind turbine blade developed by TPI
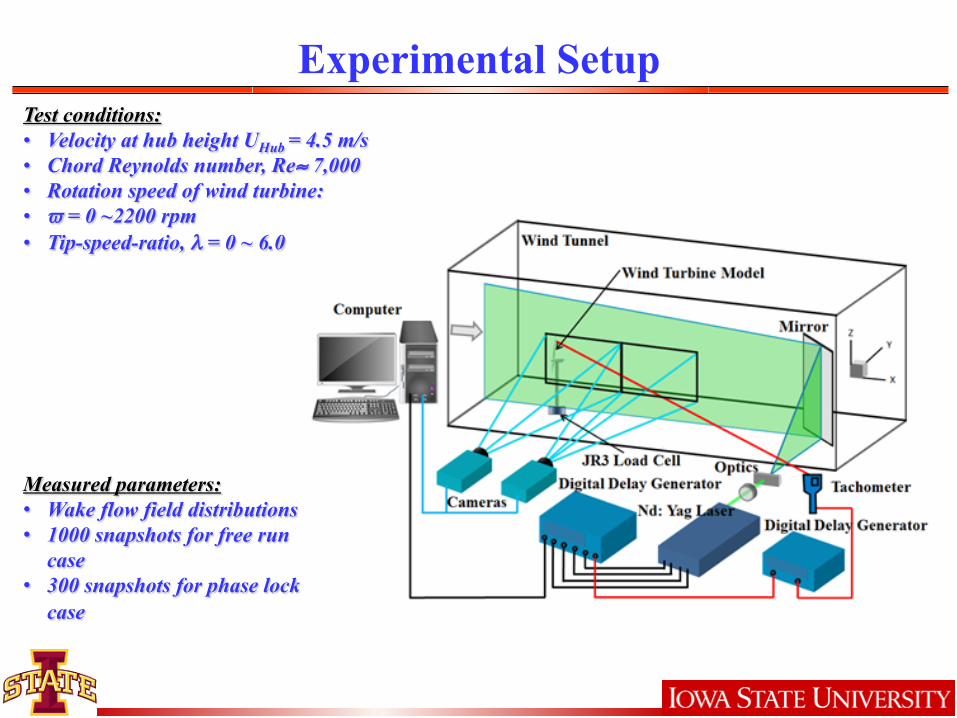
Experimental Setup
Measured parameters: • Wake flow field distributions • 1000 snapshots for free run
case • 300 snapshots for phase lock
case
Test conditions: • Velocity at hub height UHub = 4.5 m/s • Chord Reynolds number, Re≈ 7,000 • Rotation speed of wind turbine: • ϖ = 0 ~2200 rpm • Tip-speed-ratio, λ = 0 ~ 6.0
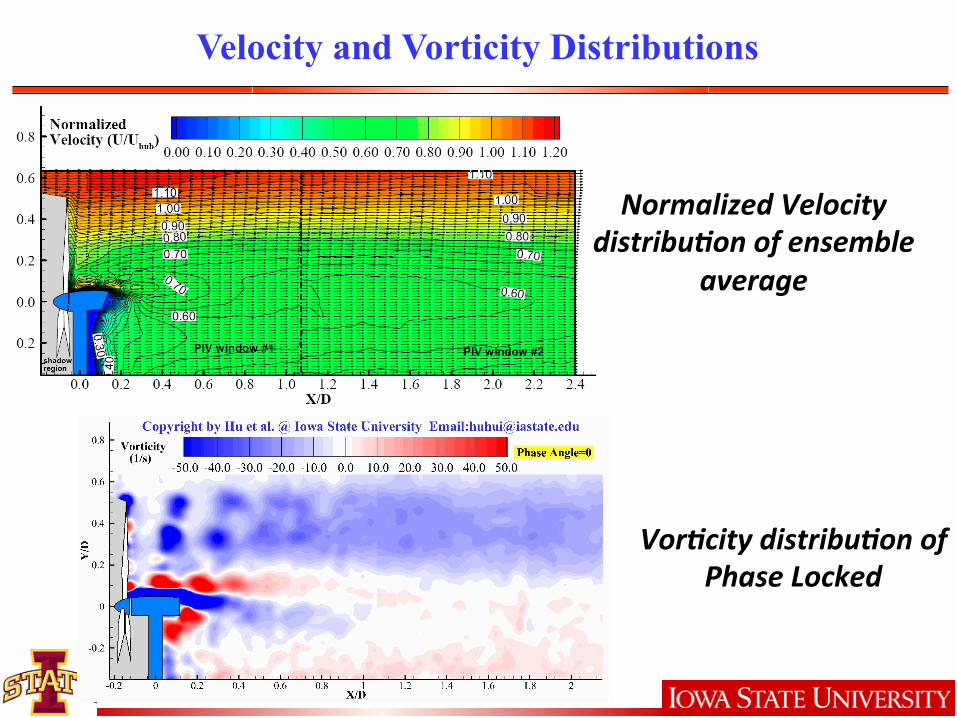
Velocity and Vorticity Distributions
Normalized Velocity distribu3on of ensemble
average
Vor3city distribu3on of Phase Locked
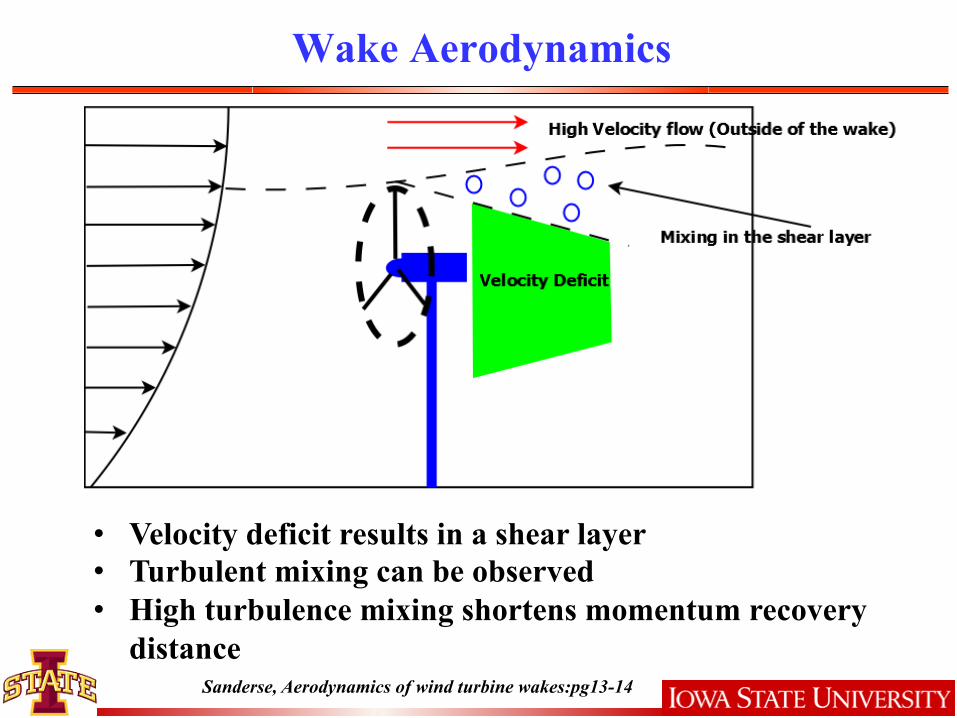
Wake Aerodynamics
• Velocity deficit results in a shear layer • Turbulent mixing can be observed • High turbulence mixing shortens momentum recovery
distance Sanderse, Aerodynamics of wind turbine wakes:pg13-14
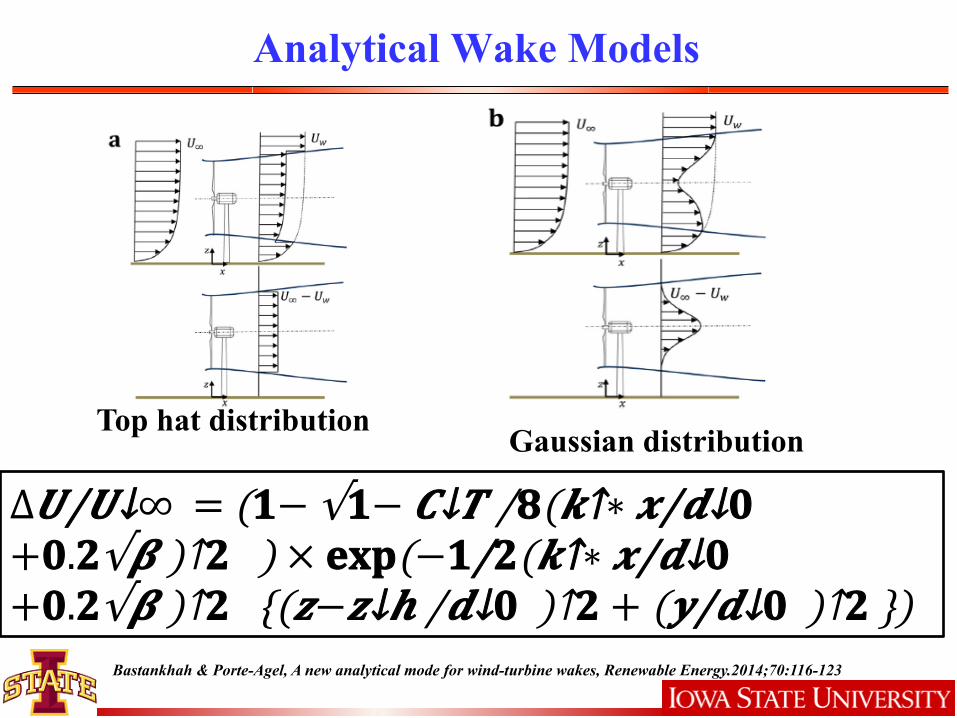
Analytical Wake Models
Top hat distribution Gaussian distribution
∆𝑼/𝑼↓∞ = (𝟏− √𝟏− 𝑪↓𝑻 /𝟖 (𝒌↑∗ 𝒙/𝒅↓𝟎 +𝟎.𝟐√𝜷 )↑𝟐 ) × 𝐞𝐱𝐩(− 𝟏/𝟐 (𝒌↑∗ 𝒙/𝒅↓𝟎 +𝟎.𝟐√𝜷 )↑𝟐 {(𝒛− 𝒛↓𝒉 /𝒅↓𝟎 )↑𝟐 + (𝒚/𝒅↓𝟎 )↑𝟐 })
Bastankhah & Porte-Agel, A new analytical mode for wind-turbine wakes, Renewable Energy.2014;70:116-123

Predicting Velocity Deficit Z
/ D
X/D
Z/D
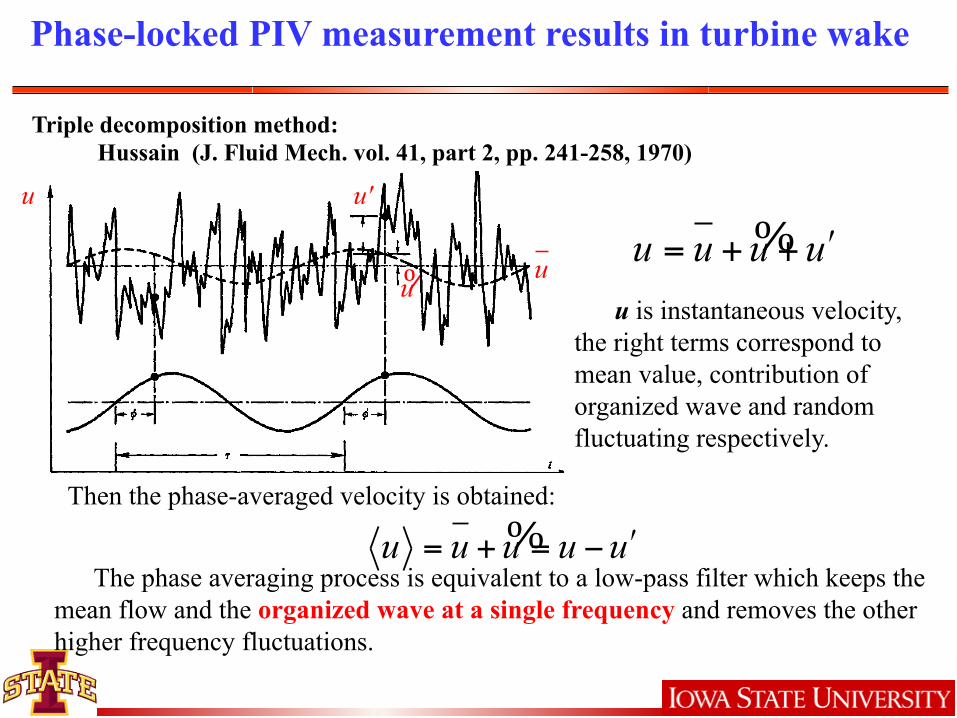
Phase-locked PIV measurement results in turbine wake
Triple decomposition method: Hussain (J. Fluid Mech. vol. 41, part 2, pp. 241-258, 1970)
u u'
%uu
%u u u uʹ′= + +
u is instantaneous velocity, the right terms correspond to mean value, contribution of organized wave and random fluctuating respectively.
%u u u u uʹ′= + = −
Then the phase-averaged velocity is obtained:
The phase averaging process is equivalent to a low-pass filter which keeps the mean flow and the organized wave at a single frequency and removes the other higher frequency fluctuations.

Phase-locked PIV measurement results-Reynolds shear stress
Triple decomposition method to Reynolds stress:
Additionally, coherent structures are uncorrelated with random parts :
%u u u= − u u uʹ′ = −Where:
So:
Therefore the overall Reynolds stress consists of the contributions from the coherent structures 𝑢 𝑣 and random fluctuating 𝑢′ 𝑣↑′
The Reynolds stress contribute a major part of the momentum transfer in turbine wake flow
𝑟↓𝑖𝑗 /−𝜌 = (𝑢 + 𝑢↑′ )( 𝑣 +𝑣′) = 𝑢 𝑣 + 𝑢′ 𝑣 + 𝑢 𝑣′ + 𝑢↑′ 𝑣′
𝑢′ 𝑣 = 0 𝑢 𝑣↑′ =0
𝑟↓𝑖𝑗 /−𝜌 = 𝑢 𝑣 + 𝑢↑′ 𝑣′
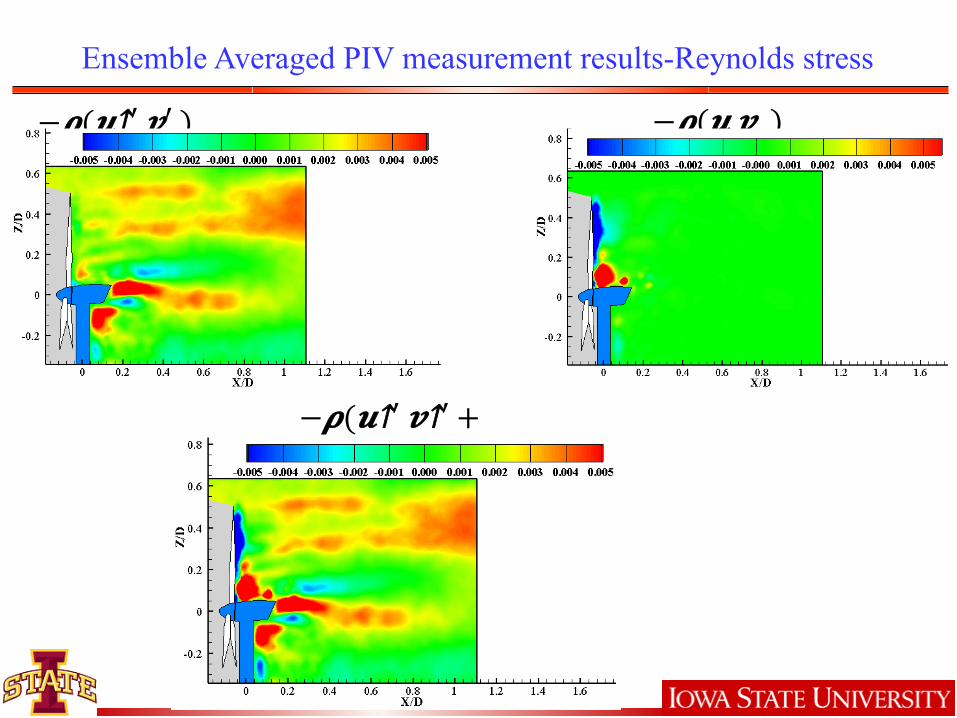
Ensemble Averaged PIV measurement results-Reynolds stress
−𝝆( 𝒖↑′ 𝒗′ ) −𝝆( 𝒖 𝒗 )
−𝝆( 𝒖↑′ 𝒗↑′ + 𝒖 𝒗 )
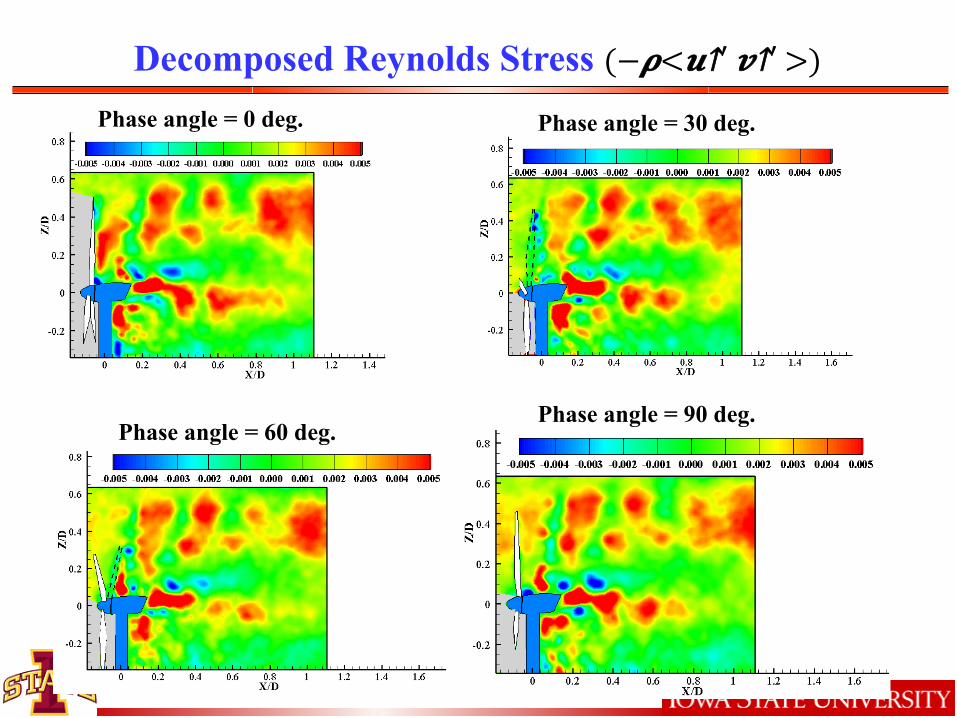
Decomposed Reynolds Stress (−𝝆< 𝒖↑′ 𝒗↑′ >) Phase angle = 0 deg. Phase angle = 30 deg.
Phase angle = 60 deg. Phase angle = 90 deg.

POD (Proper Orthogonal Decomposition)
• POD is used to extract dominant large scale structures buried in a flow.
• The flow is decomposed to modes using linear decomposition and reconstructed using singular value decomposition (SVD).
• The magnitude of the eigenvalues represent the kinetic energy which the modes are ranked based on.
• Large scale structures can be represented with the first few modes.
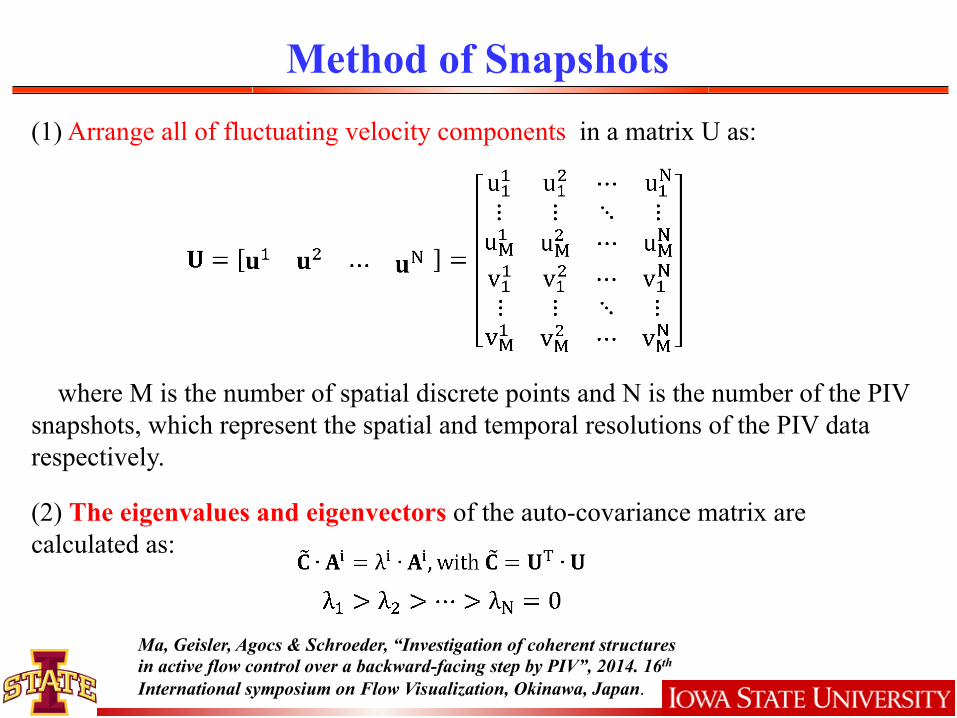
Method of Snapshots (1) Arrange all of fluctuating velocity components in a matrix U as:
where M is the number of spatial discrete points and N is the number of the PIV snapshots, which represent the spatial and temporal resolutions of the PIV data respectively.
(2) The eigenvalues and eigenvectors of the auto-covariance matrix are calculated as:
Ma, Geisler, Agocs & Schroeder, “Investigation of coherent structures in active flow control over a backward-facing step by PIV”, 2014. 16th International symposium on Flow Visualization, Okinawa, Japan.

where is the ensemble-averaged velocity
Free run PIV results analysis-Proper orthogonal decomposition (POD)
(3) Each mode is obtained by projecting matrix U onto each eigenvector and then normalized by its norm as:
So:
(4) The coefficients of each mode can be obtained:
(5) A snapshot can be reconstructed as:
1
Ln n n
i ii
U U u U a φ=
= + = +∑ U
(6) An instantanous velocity fields can be reconstructed using the first Lth modes as:
Reconstruct the snapshot:

Selecting a Region of Interest (ROI)
• A region in the wake was selected for POD analysis to minimize the outliers and measurement noise.
• The region encompasses includes the shear layer, located between the wake and high momentum flow outside the wake.
Free run PIV results analysis-Proper Orthogonal Decomposition (POD)
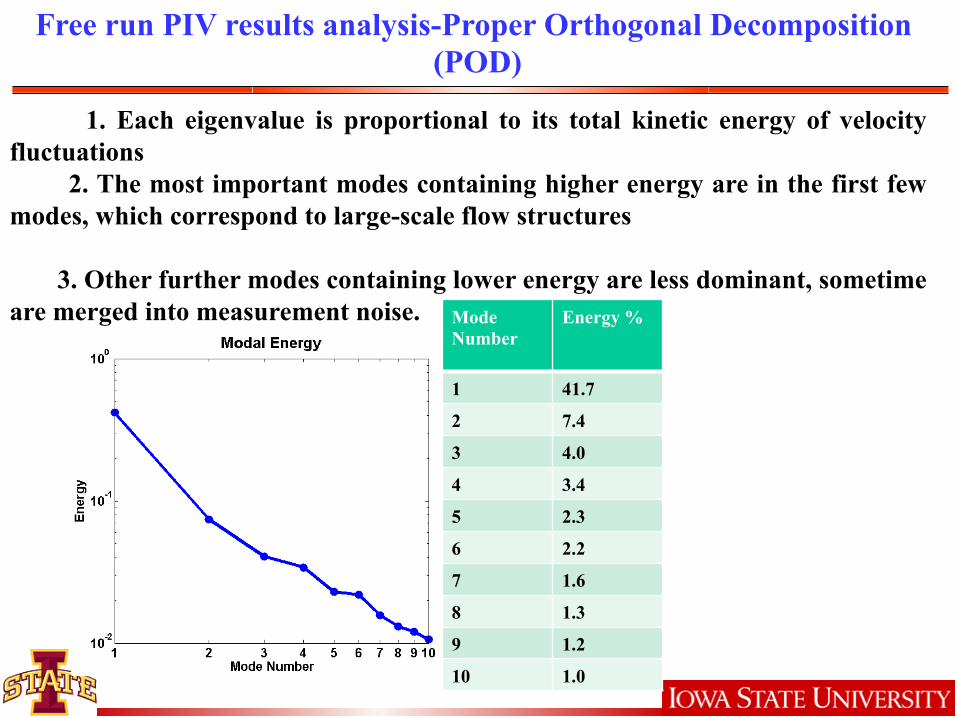
1. Each eigenvalue is proportional to its total kinetic energy of velocity fluctuations 2. The most important modes containing higher energy are in the first few modes, which correspond to large-scale flow structures 3. Other further modes containing lower energy are less dominant, sometime are merged into measurement noise. Mode
Number Energy %
1 41.7
2 7.4
3 4.0
4 3.4
5 2.3
6 2.2
7 1.6
8 1.3
9 1.2
10 1.0

Proper Orthogonal Decomposition (POD)
Mode Std. Dev 1 4.31 2 1.72 3 1.37
Time Averaged Solutions (Mode 0)
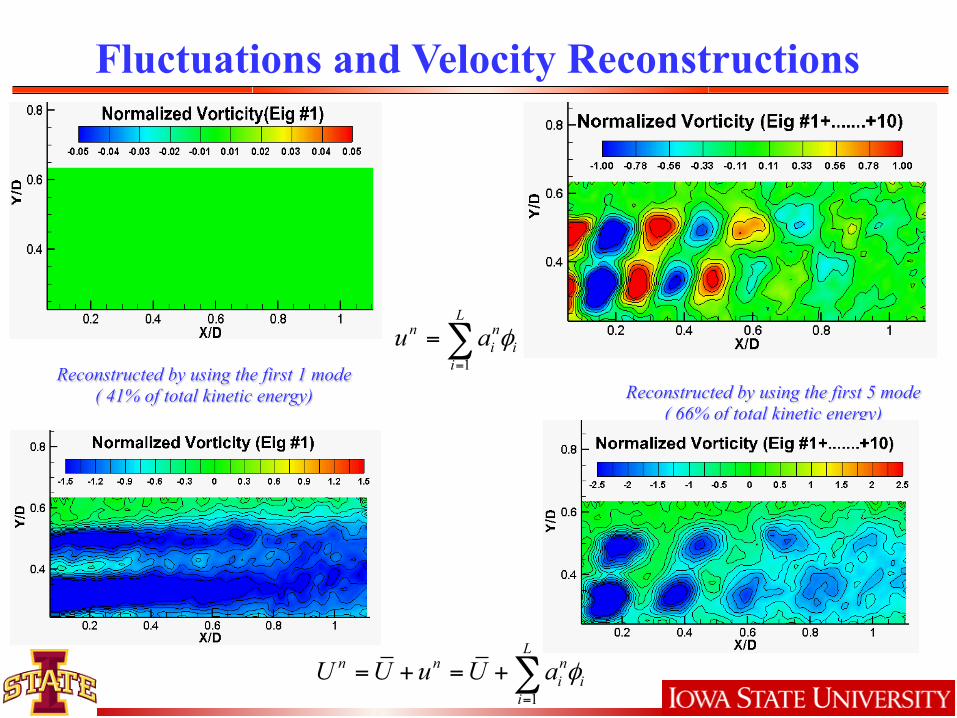
Reconstructed by using the first 1 mode ( 41% of total kinetic energy) Reconstructed by using the first 5 mode
( 66% of total kinetic energy)
1
Ln n
i ii
u a φ=
=∑
Fluctuations and Velocity Reconstructions
1
Ln n n
i ii
U U u U a φ=
= + = +∑

Conclusions
• Proper Orthogonal Decomposition (POD) can be successfully used to identify principal components of the flow.
• The principal components carry most of the kinetic energy and the low order reconstructions aid the design process of blades, rotor assemblies and vortex generators
• Reynolds stress obtained from TD indicates vertical momentum transfer in the recovering wake.
• The wind farm designer can use this information to determine the distance between turbines for max. performance.
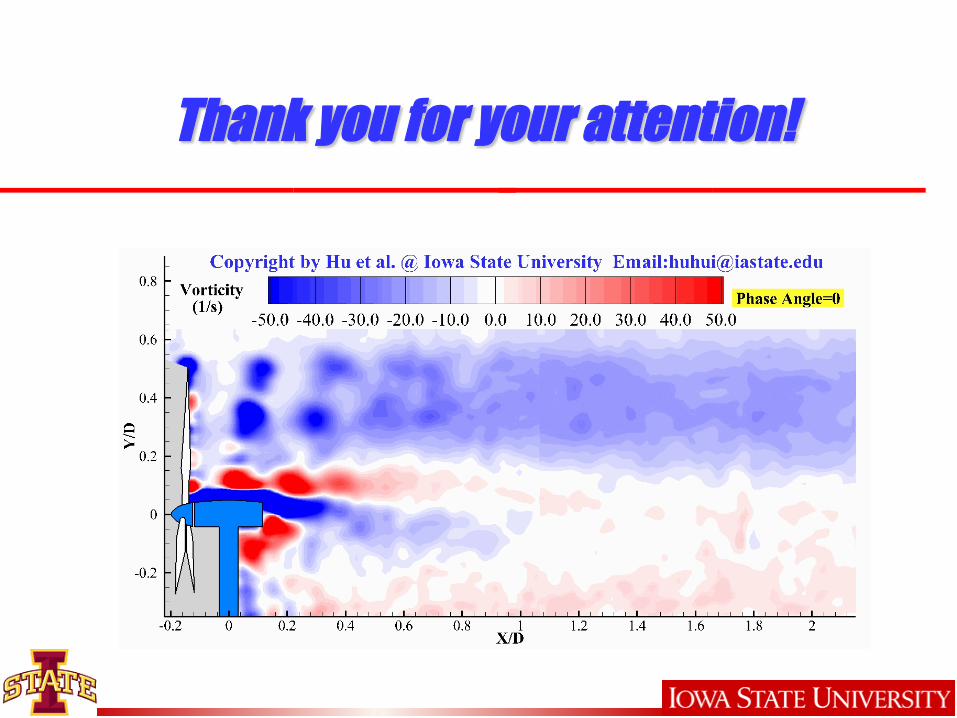
Thank you for your attention!

APPENDIX
Future Work - DMD
• Dynamic Mode Decomposition (DMD) is a new tool in dynamical systems that are used to investigate flow features of unsteady flows.
• DMD assigns frequencies to the large scale structures
while POD modes are ranked based on kinetic energy of the flow.
• DMD is based on a temporal orthogonal framework
while POD is based on a spatial orthogonal one.
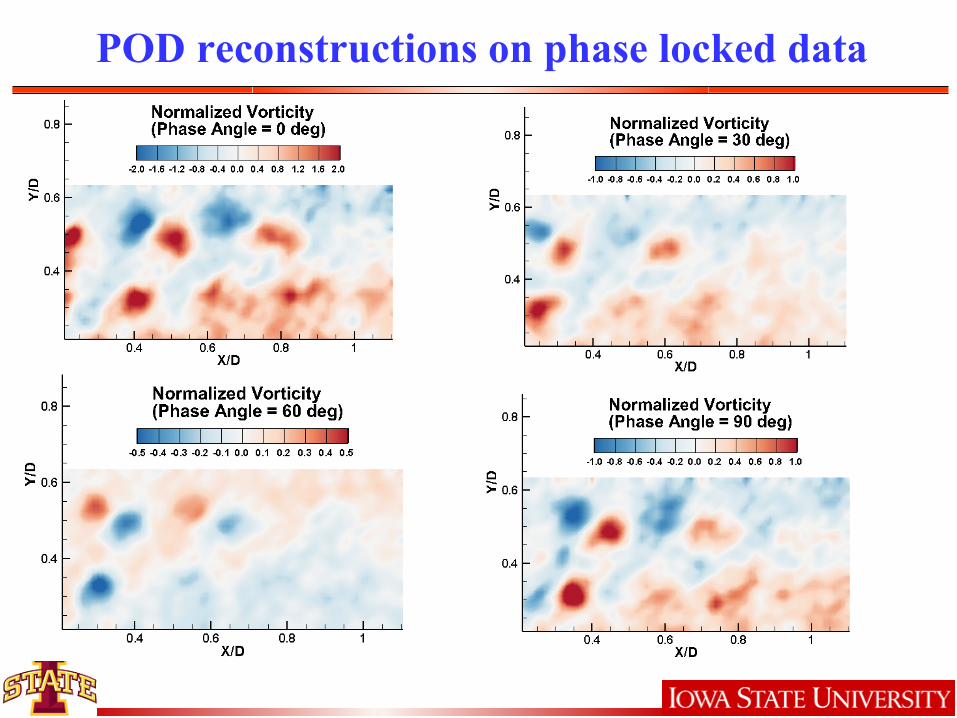
POD reconstructions on phase locked data

Swriling strength distributions in the turbine wake
Low turbulence inflow Phase angle=0

Phase-locked PIV measurement results-Reynolds stress
−𝝆< 𝒖↑′ 𝒗′> −𝝆< 𝒖 𝒗 >
−𝝆< 𝒖↑′ 𝒗↑′ + 𝒖 𝒗 >
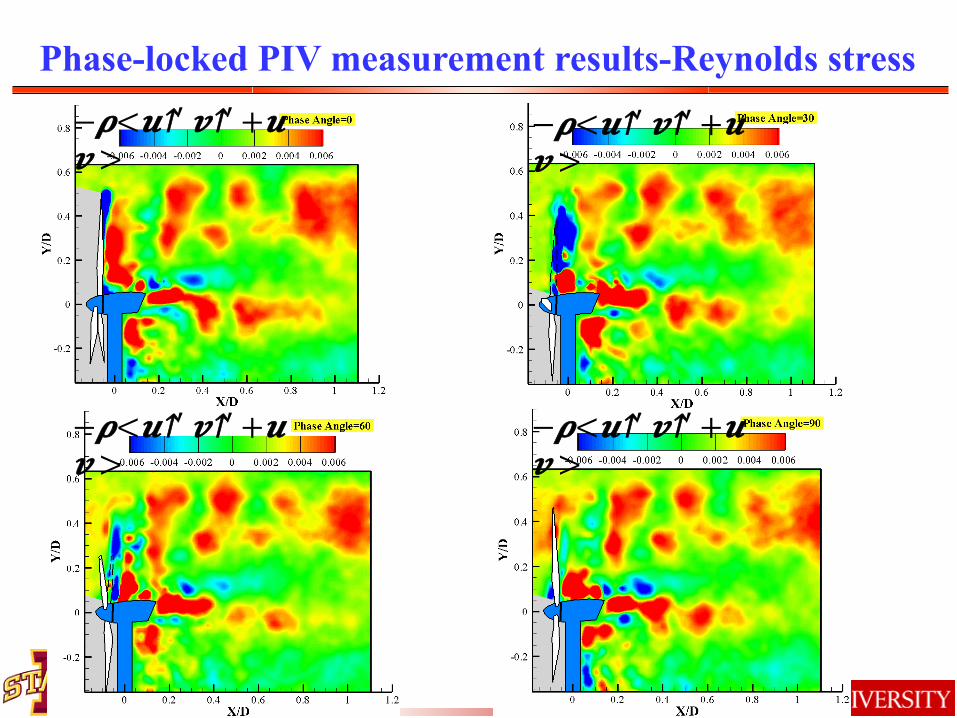
Phase-locked PIV measurement results-Reynolds stress
−𝝆< 𝒖↑′ 𝒗↑′ + 𝒖 𝒗 >
−𝝆< 𝒖↑′ 𝒗↑′ + 𝒖 𝒗 >
−𝝆< 𝒖↑′ 𝒗↑′ + 𝒖 𝒗 >
−𝝆< 𝒖↑′ 𝒗↑′ + 𝒖 𝒗 >

Observations
• Reynolds stresses are distributed within the shear layer.
• The shed vortices also contain turbulent mixing components.
• Presence of a tower and a nacelle also contributes to T.K.E and Reynolds Stress in downstream wake.