Embed Size (px)
Citation preview
International Research Journal of Engineering and Technology (IRJET) e-ISSN: 2395 -0056
Volume: 04 Issue: 05 | May -2017 www.irjet.net p-ISSN: 2395-0072
© 2017, IRJET | Impact Factor value: 5.181 | ISO 9001:2008 Certified Journal | Page 1134
Analysis of User Behavior for Twitter Posts on Hadoop
Priya Gupta1
1M.tech Student, Department of Computer Science and Engineering,
Faculty of Engineering and Technology, MRIU, Haryana, India ---------------------------------------------------------------------***---------------------------------------------------------------------
Abstract - Big Data refers to collection of large datasets containing massive amount of data. Big Data is generated from various sources such as social networking sites like Facebook, Twitter etc. and the data that is generated can be in various formats like structured, semi-structured or unstructured format. Social media monitoring is growing day by day therefore analysis of social data plays a vital role in knowing user behaviour. These behaviour of users country wise helps in getting information about various current trends and can be used further in deciding usefulness of some tasks, products and themes. In this paper we would be analyzing tweets for user behaviour. Tweets are available in JSON format which is to be converted into a structured data. By analyzing all the user social data about a particular topic we would give the output of how users behave for particular topic in certain country and city.
Key Words : Big data, Sentiment Analysis, Hadoop, Naïve Bayesian Classification, Twitter
1. INTRODUCTION Big Data refers to collection of large datasets containing massive amount of data whose size is in the range of Petabytes, Zettabytes, or with high rate of growth, and complexity that make them difficult to process and analyse using conventional database technologies. Big Data is generated from various sources such as social networking sites like Facebook, Twitter etc, and the data that is generated can be in various formats like structured, semi-structured or unstructured format. Social media monitoring is growing day by day therefore analysis of social data plays a vital role in knowing customer behaviour. These behaviours of users country wise helps in getting information about various current trends and can be used further in deciding usefulness of some tasks, products and themes. So by analysing Social data such as Twitter Tweets, Facebook posts, comments using sentiment analysis which checks the attitude of User review. In this project we would be analysing tweets for user behaviour. Tweets are available in JSON format which is to be converted into a structured data. By analysing all the user social data about a particular topic we would give the output of how users behave for particular topic in certain country and city. Challenges with social media data are as under [3]:- 1. Grammar and Spellings: With users being too causal when posting on the web they tend to make a lot of
mistakes in the semantics of the language and even the spellings of words. These are generally checked in the pre-processing stage of any application using these datasets. 2. Trustworthiness: The most important property of social data is the views of different users on different subjects, but there are many fake accounts being made to give fake views and reviews to either push or pull an entity on the platform. 3. Format: Every other social media site has its own style of posting data and also the way users post their data on these sites. Like people using # to tag subjects or using @ to refer to different users. Hence, it is important to study and understand each site differently. 4. Language: Social media sites provide options of using different languages to post views. There lie options to tackle this problem with either using translation mechanisms or building engines with respect to different languages.
1.1 Existing Work Sentiment Data is the representation of the different opinions, emotions and attitudes which can be found in social media posts, blogs, online product reviews, and customer support interactions. It is a data set of unstructured data. Sentiment Analysis is a major area of study under Machine learning. The ideology used in existing system is based on the underlying principles in which the tweets were classified using unigram vectors and training was performed by distant supervision. The use of emoticons as labels is effective in reducing dependencies in machine learning. The system also focusses on the basis of a query term and feature reduction using algorithms like Naive Bayes, Maximum Entropy and Support Vector Machines. The research and analysis conducted by Pang and Lee was used to analyse the performance of different machine learning techniques in the movie review domain. It also found implementations as a sub component technology in augmentation with other systems like emails and online advertisements. With the help of improved Natural Language Processing capabilities and tools, this domain is gaining widespread importance and improved application in various other fields. The Figure shows the overall architecture and process flow of various tasks for analysing sentiments of social media dataset of existing system.
International Research Journal of Engineering and Technology (IRJET) e-ISSN: 2395 -0056
Volume: 04 Issue: 05 | May -2017 www.irjet.net p-ISSN: 2395-0072
© 2017, IRJET | Impact Factor value: 5.181 | ISO 9001:2008 Certified Journal | Page 1135
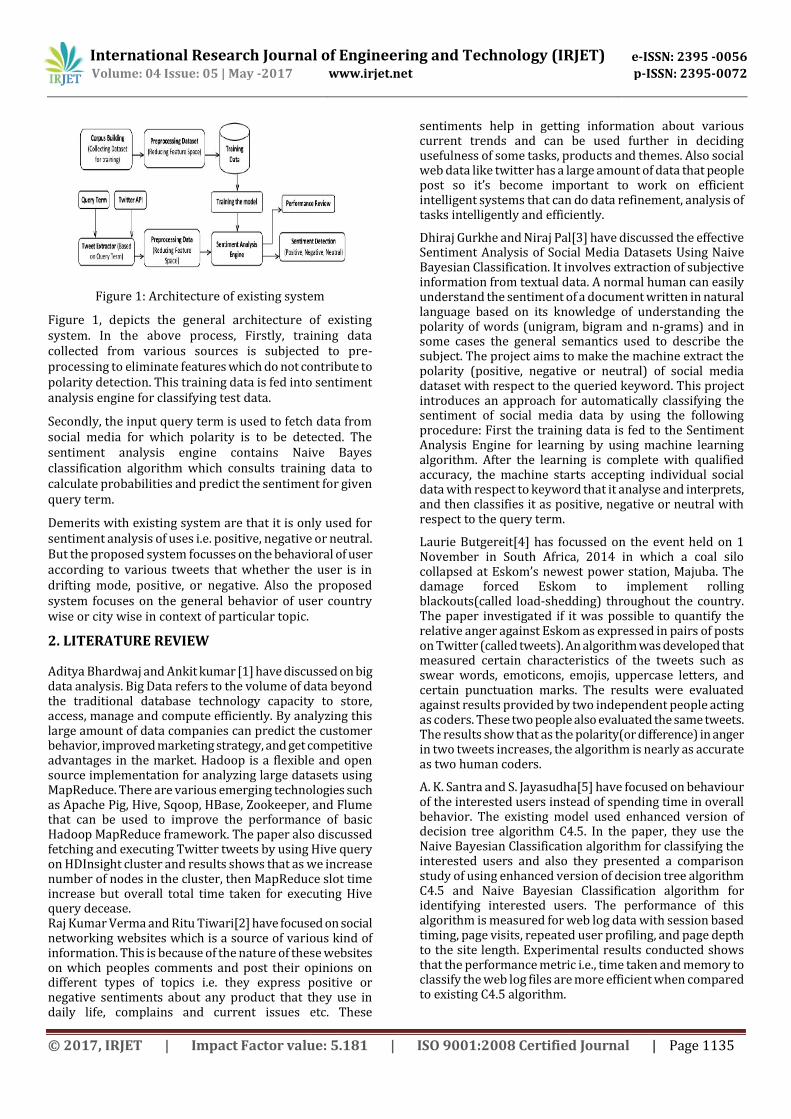
Figure 1: Architecture of existing system
Figure 1, depicts the general architecture of existing system. In the above process, Firstly, training data collected from various sources is subjected to pre-processing to eliminate features which do not contribute to polarity detection. This training data is fed into sentiment analysis engine for classifying test data.
Secondly, the input query term is used to fetch data from social media for which polarity is to be detected. The sentiment analysis engine contains Naive Bayes classification algorithm which consults training data to calculate probabilities and predict the sentiment for given query term.
Demerits with existing system are that it is only used for sentiment analysis of uses i.e. positive, negative or neutral. But the proposed system focusses on the behavioral of user according to various tweets that whether the user is in drifting mode, positive, or negative. Also the proposed system focuses on the general behavior of user country wise or city wise in context of particular topic.
2. LITERATURE REVIEW Aditya Bhardwaj and Ankit kumar [1] have discussed on big data analysis. Big Data refers to the volume of data beyond the traditional database technology capacity to store, access, manage and compute efficiently. By analyzing this large amount of data companies can predict the customer behavior, improved marketing strategy, and get competitive advantages in the market. Hadoop is a flexible and open source implementation for analyzing large datasets using MapReduce. There are various emerging technologies such as Apache Pig, Hive, Sqoop, HBase, Zookeeper, and Flume that can be used to improve the performance of basic Hadoop MapReduce framework. The paper also discussed fetching and executing Twitter tweets by using Hive query on HDInsight cluster and results shows that as we increase number of nodes in the cluster, then MapReduce slot time increase but overall total time taken for executing Hive query decease. Raj Kumar Verma and Ritu Tiwari[2] have focused on social networking websites which is a source of various kind of information. This is because of the nature of these websites on which peoples comments and post their opinions on different types of topics i.e. they express positive or negative sentiments about any product that they use in daily life, complains and current issues etc. These
sentiments help in getting information about various current trends and can be used further in deciding usefulness of some tasks, products and themes. Also social web data like twitter has a large amount of data that people post so it’s become important to work on efficient intelligent systems that can do data refinement, analysis of tasks intelligently and efficiently.
Dhiraj Gurkhe and Niraj Pal[3] have discussed the effective Sentiment Analysis of Social Media Datasets Using Naive Bayesian Classification. It involves extraction of subjective information from textual data. A normal human can easily understand the sentiment of a document written in natural language based on its knowledge of understanding the polarity of words (unigram, bigram and n-grams) and in some cases the general semantics used to describe the subject. The project aims to make the machine extract the polarity (positive, negative or neutral) of social media dataset with respect to the queried keyword. This project introduces an approach for automatically classifying the sentiment of social media data by using the following procedure: First the training data is fed to the Sentiment Analysis Engine for learning by using machine learning algorithm. After the learning is complete with qualified accuracy, the machine starts accepting individual social data with respect to keyword that it analyse and interprets, and then classifies it as positive, negative or neutral with respect to the query term.
Laurie Butgereit[4] has focussed on the event held on 1 November in South Africa, 2014 in which a coal silo collapsed at Eskom’s newest power station, Majuba. The damage forced Eskom to implement rolling blackouts(called load-shedding) throughout the country. The paper investigated if it was possible to quantify the relative anger against Eskom as expressed in pairs of posts on Twitter (called tweets). An algorithm was developed that measured certain characteristics of the tweets such as swear words, emoticons, emojis, uppercase letters, and certain punctuation marks. The results were evaluated against results provided by two independent people acting as coders. These two people also evaluated the same tweets. The results show that as the polarity(or difference) in anger in two tweets increases, the algorithm is nearly as accurate as two human coders.
A. K. Santra and S. Jayasudha[5] have focused on behaviour of the interested users instead of spending time in overall behavior. The existing model used enhanced version of decision tree algorithm C4.5. In the paper, they use the Naive Bayesian Classification algorithm for classifying the interested users and also they presented a comparison study of using enhanced version of decision tree algorithm C4.5 and Naive Bayesian Classification algorithm for identifying interested users. The performance of this algorithm is measured for web log data with session based timing, page visits, repeated user profiling, and page depth to the site length. Experimental results conducted shows that the performance metric i.e., time taken and memory to classify the web log files are more efficient when compared to existing C4.5 algorithm.
International Research Journal of Engineering and Technology (IRJET) e-ISSN: 2395 -0056
Volume: 04 Issue: 05 | May -2017 www.irjet.net p-ISSN: 2395-0072
© 2017, IRJET | Impact Factor value: 5.181 | ISO 9001:2008 Certified Journal | Page 1136
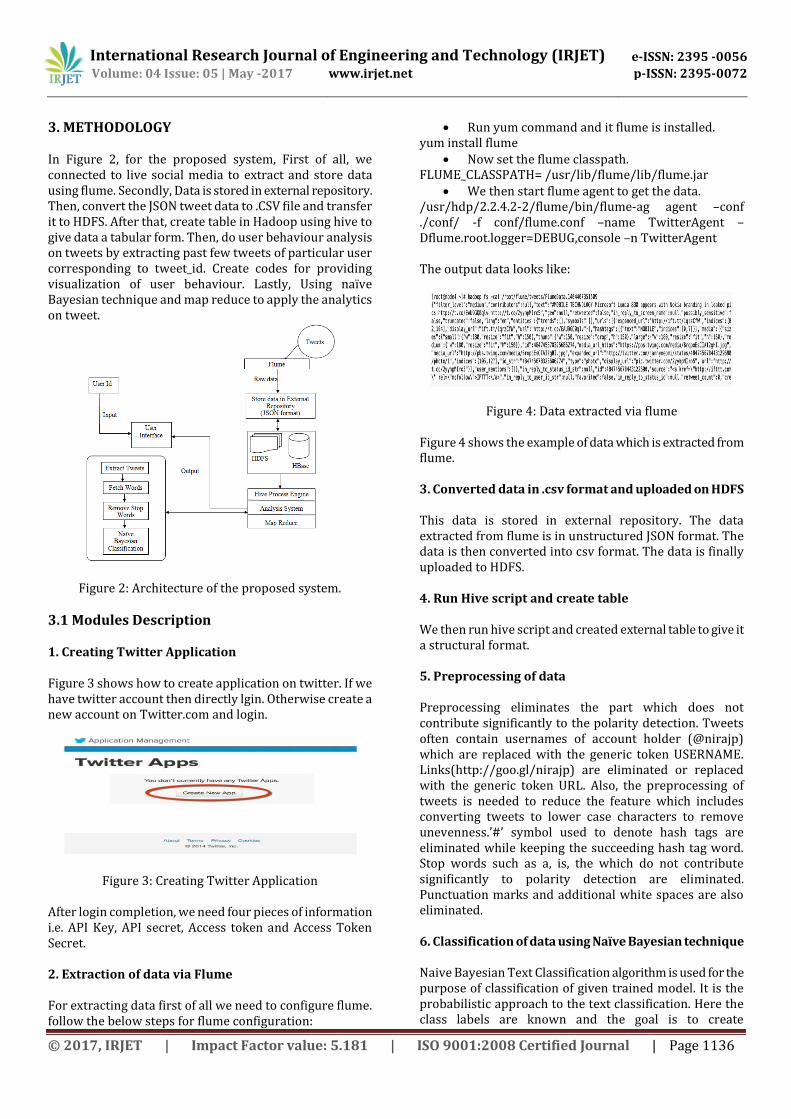
3. METHODOLOGY In Figure 2, for the proposed system, First of all, we connected to live social media to extract and store data using flume. Secondly, Data is stored in external repository. Then, convert the JSON tweet data to .CSV file and transfer it to HDFS. After that, create table in Hadoop using hive to give data a tabular form. Then, do user behaviour analysis on tweets by extracting past few tweets of particular user corresponding to tweet_id. Create codes for providing visualization of user behaviour. Lastly, Using naïve Bayesian technique and map reduce to apply the analytics on tweet.
Figure 2: Architecture of the proposed system.
3.1 Modules Description 1. Creating Twitter Application Figure 3 shows how to create application on twitter. If we have twitter account then directly lgin. Otherwise create a new account on Twitter.com and login.
Figure 3: Creating Twitter Application After login completion, we need four pieces of information i.e. API Key, API secret, Access token and Access Token Secret. 2. Extraction of data via Flume For extracting data first of all we need to configure flume. follow the below steps for flume configuration:
Run yum command and it flume is installed. yum install flume
Now set the flume classpath. FLUME_CLASSPATH= /usr/lib/flume/lib/flume.jar
We then start flume agent to get the data. /usr/hdp/2.2.4.2-2/flume/bin/flume-ag agent –conf ./conf/ -f conf/flume.conf –name TwitterAgent –Dflume.root.logger=DEBUG,console –n TwitterAgent The output data looks like:
Figure 4: Data extracted via flume Figure 4 shows the example of data which is extracted from flume. 3. Converted data in .csv format and uploaded on HDFS This data is stored in external repository. The data extracted from flume is in unstructured JSON format. The data is then converted into csv format. The data is finally uploaded to HDFS. 4. Run Hive script and create table We then run hive script and created external table to give it a structural format. 5. Preprocessing of data Preprocessing eliminates the part which does not contribute significantly to the polarity detection. Tweets often contain usernames of account holder (@nirajp) which are replaced with the generic token USERNAME. Links(http://goo.gl/nirajp) are eliminated or replaced with the generic token URL. Also, the preprocessing of tweets is needed to reduce the feature which includes converting tweets to lower case characters to remove unevenness.’#’ symbol used to denote hash tags are eliminated while keeping the succeeding hash tag word. Stop words such as a, is, the which do not contribute significantly to polarity detection are eliminated. Punctuation marks and additional white spaces are also eliminated. 6. Classification of data using Naïve Bayesian technique Naive Bayesian Text Classification algorithm is used for the purpose of classification of given trained model. It is the probabilistic approach to the text classification. Here the class labels are known and the goal is to create

International Research Journal of Engineering and Technology (IRJET) e-ISSN: 2395 -0056
Volume: 04 Issue: 05 | May -2017 www.irjet.net p-ISSN: 2395-0072
© 2017, IRJET | Impact Factor value: 5.181 | ISO 9001:2008 Certified Journal | Page 1137
probabilistic models, which can be used to classify new texts. It is specifically formulated for text and makes use of text specific characteristics. The Naive Bayesian classifier treats each tweet as a ”bag of words” free of stop words. 7. Provided visualization of behavioral system Visualization of the behavioral analysis of all the data gathered is provided through excel sheets. Each Tweet has been assigned a frequency having positive, negative and neutral. Result is to depicted in graphical format for each users. Whether user is in drifting mode, positive or negative. Also we can plot the general behavior of users country wise or city wise for particular topic.
4. EXPEREMENTAL WORK
Figure 5: User Behavior System
Figure 5 shows the basic User Interface for user behavior system. In this we can either search by id, city or by country.
Figure 6: User data corresponding to USER_ID Figure 6 shows the individual tweet wise behavior of user corresponding to a particular user_id.
Figure 7: User data imported to excel sheet Figure 7 represents the data imported to the excel sheet. From here we can make the graphs for analysis.
Figure 8: User behavior on the basis of USER_ID
Figure 8 shows the graph for the user corresponding to user_id. In this the user is first positive then negative and lastly neutral i.e. The user with the corresponding id is in drifting state.
Figure 9: Another User behavior on the basis of USER_ID Figure 9 shows the user here has the maximum of negative counts. Therefore we conclude that the user is negative.
International Research Journal of Engineering and Technology (IRJET) e-ISSN: 2395 -0056
Volume: 04 Issue: 05 | May -2017 www.irjet.net p-ISSN: 2395-0072
© 2017, IRJET | Impact Factor value: 5.181 | ISO 9001:2008 Certified Journal | Page 1138
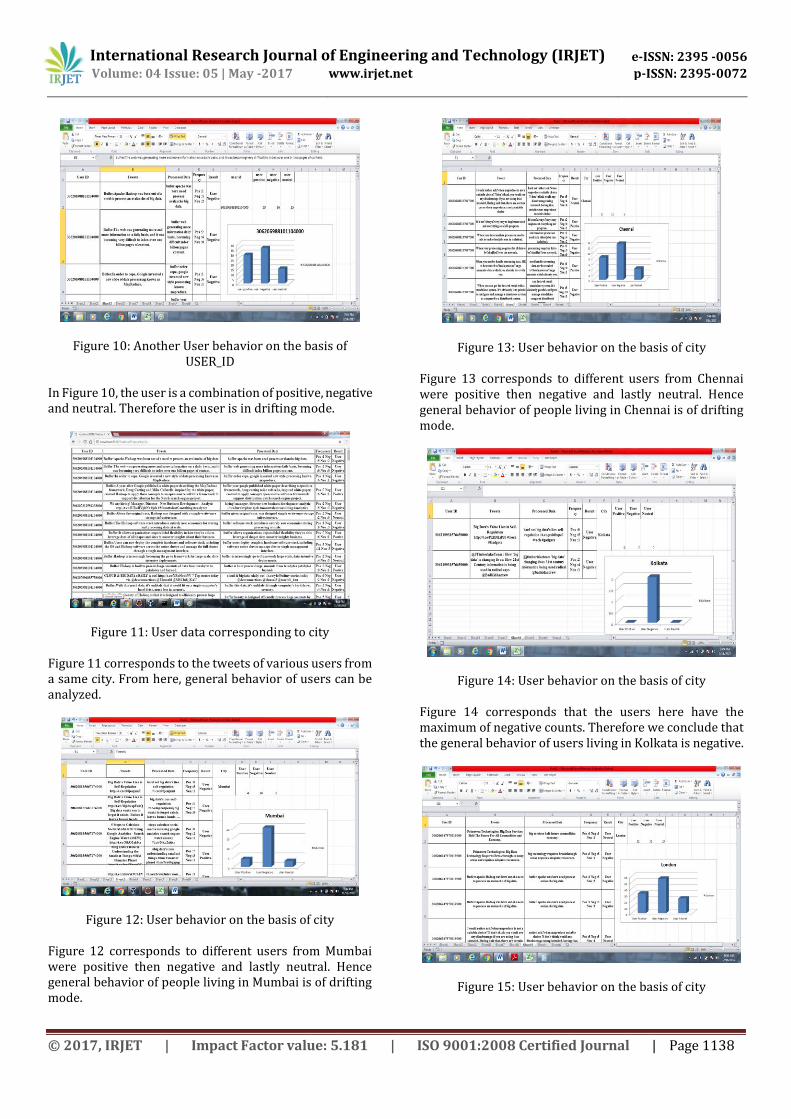
Figure 10: Another User behavior on the basis of USER_ID
In Figure 10, the user is a combination of positive, negative and neutral. Therefore the user is in drifting mode.
Figure 11: User data corresponding to city
Figure 11 corresponds to the tweets of various users from a same city. From here, general behavior of users can be analyzed.
Figure 12: User behavior on the basis of city Figure 12 corresponds to different users from Mumbai were positive then negative and lastly neutral. Hence general behavior of people living in Mumbai is of drifting mode.
Figure 13: User behavior on the basis of city Figure 13 corresponds to different users from Chennai were positive then negative and lastly neutral. Hence general behavior of people living in Chennai is of drifting mode.
Figure 14: User behavior on the basis of city Figure 14 corresponds that the users here have the maximum of negative counts. Therefore we conclude that the general behavior of users living in Kolkata is negative.
Figure 15: User behavior on the basis of city

International Research Journal of Engineering and Technology (IRJET) e-ISSN: 2395 -0056
Volume: 04 Issue: 05 | May -2017 www.irjet.net p-ISSN: 2395-0072
© 2017, IRJET | Impact Factor value: 5.181 | ISO 9001:2008 Certified Journal | Page 1139
Figure 15 shows the different users from London were first positive then negative and finally neutral. Hence the general behavior of people living in London is of drifting mode.
Figure 16: User data corresponding to country
Figure 16 corresponds to the tweets of various users from a same country. From here, general behavior of users corresponding to a country can be analyzed.
Figure 17: User behavior on the basis of COUNTRY In Figure 17, different users from India were positive then negative and lastly neutral. Hence general behavior of people living in India is of drifting mode.
Figure 18: User behavior on the basis of COUNTRY In Figure 18, different users from Australia were positive then negative and lastly neutral. Hence general behavior of people living in Australia is of drifting mode.
5. OUTCOME User behavioural analysis system that predicts the behaviour of user whether the user is in drifting mode, positive or negative on the basis of the tweet_id of user on live social twitter data. Also to predict the general behaviour of users in different locations in particular time stamp in a certain context and depicted in graph form.
Table 1: Statistical Data
Table 1 shows the statistical data of the tweets used to analyse behaviour of user corresponding to user_id, city and country.
6. CONCLUSION AND FUTURE SCOPE For analyzing the user behaviour, first of all twitter data is extracted using flume. The data extracted is available is in unstructured (JSON) format. The data is integrated with Hadoop. Using hive it is given a tabular form i.e. a structured form of data is obtained. Mavean framework is used to get the executable jar to integrate eclipse and Hadoop. Data needs to be filtertered before analyzing. Data is cleaned by removing stop words. For classification, Naïve Bayesian Technique has been used. For using naïve Bayesian technique, we have used a dictionary which stores a list of words that are positive, negative and neutral. Lastly, data is imported to excel to give a graphical form and to get the results. In the project, we can identify the user behaviour with the help of user_id whether the user is positive, negative or in drifting mode. Also, the system tells the general behavior of users country-wise as well as city-wise for a particular topic. The system is 70-80% accurate. In future, the data can be from multiple sources at the same time. Also various different tools like R, tablue can be integrated. Also we can continue with ontologies in it. Finally, multiple topics also can be taken into consideration. Further works can be done to improve the efficiency and accuracy.

International Research Journal of Engineering and Technology (IRJET) e-ISSN: 2395 -0056
Volume: 04 Issue: 05 | May -2017 www.irjet.net p-ISSN: 2395-0072
© 2017, IRJET | Impact Factor value: 5.181 | ISO 9001:2008 Certified Journal | Page 1140
REFERENCES [1] Aditya Bhardwaj and Ankit kumar, “Big Data Emerging Technologies: A Case Study with Analyzing Twitter Data using Apache Hive”, IEEE Proceedings of 2015 RAECS UIET Panjab University Chandigarh, 21-22nd December 2015. [2]Raj Kumar Verma and Ritu Tiwari, “Sentiment Analysis of Social web data: A Review”, ACEIT Conference Proceeding 2016. [3]Dhiraj Gurkhe and Niraj Pal, “Effective Sentiment Analysis of Social Media Datasets using Naive Bayesian Classification” , International Journal of Computer Applications (0975 8887) ,Volume 99, No. 13, August 2014. [4] Laurie Butgereit , “An Algorithm for measuring anger at Eskom during Load-Shedding using Twitter”, IEEE, 978-1-4799-7498-6/15. [5] A. K. Santra and S. Jayasudha, “Classification of Web Log Data to Identify Interested Users Using Naïve Bayesian Classification”, IJCSI International Journal of Computer Science Issues, Vol. 9, Issue 1, No 2, January 2012. [6] Sagiroglu, S., & Sinanc, D, “Big data: A review”, IEEE International Conference on Collaboration Technologies and Systems (CTS), pp 42-47, 2013. [7] Pal, A., & Agrawal, S “An experimental approach towards big data for analyzing memory utilization on a Hadoop cluster using HDFS and MapReduce”, IEEE, First International Conference on Networks & Soft Computing (ICNSC), pp.442-447, August 2014. [8] Bedi,P.,Jindal,V., & Gautam, A,“Beginning with Big Data Simplified”, IEEE International Conference on Data Mining and Intelligent Computing (ICDMIC), pp.442-447, 2014. [9] Patnaik, L. M, “Big Data Analytics: An Approach using Hadoop Distributed File System.”, International Journal of Engineering and Innovative Technology (IJEIT), vol 3, pp. 239-243, May 2014.
BIOGRAPHIES
Masters of Technology,
Faculty of Engineering and
Technology, MRIU-Faridabad,
Haryana, India