Embed Size (px)
Citation preview

Prof. Byeong-Kyu Lee, Ph.D.
Do-Soon Kim, Yoo-Sik Ham
University of Ulsan, Ulsan 680-749, Korea
Ulsan Institute of Health & Environment , Korea
Prof. Byeong-Kyu Lee, Ph.D.
Do-Soon Kim, Yoo-Sik Ham
University of Ulsan, Ulsan 680-749, Korea
Ulsan Institute of Health & Environment , Korea
Analysis of VOCs and Carbonyls in the
Classrooms of Elementary Schools in
Ulsan, Korea

Ø Most of people spend approximately 85 – 90 % of their life time indoors
including houses, offices, schools, traffic vehicles, and even
underground facilities.
Ø We didn’t realize the importance of IAQ until SBS (Sick Building
Syndrome) was reported in 1970.
Ø School classrooms are also important indoor facilities that a lot of
young students can be exposed to high concentrations of pollutants
(VOCs, HCHO)
Backgrounds and ObjectivesBackgrounds and Objectives
1

Integrated IAQ Management in KoreaIntegrated IAQ Management in Korea
IAAQ ACT of public facilities
Art gallery, Library, etc.
(Public sanitary management ACT)
Wedding hall, Gymnasium
Integrated IAQIntegrated IAQ : : 17 group facilities17 group facilities
≪≪≪≪Ministry of Construction≫≫≫≫
Parking lots
≪≪≪≪sub act≫≫≫≫ adding 5 facilities
Funeral, Nursing facilities, etc.
≪≪≪≪Ministry of labor≫≫≫≫
Workplace office
Safety & Health law
≪≪≪≪Ministry of education, science and technology≫≫≫≫
Schools
School law
2

IAQ Standards in KoreaIAQ Standards in Korea
DepartmentDepartment
ItemsItemsMinistry of Ministry of
EnvironmentEnvironmentMinistry of Ministry of
LaborLaborMinistry of education, Ministry of education,
science and technologyscience and technology
PM10 (㎍㎍㎍㎍/㎥㎥㎥㎥) 100~200 150 100
CO (ppm) 10~25 10 10
CO2 (ppm) 1000 1000 1000
NO2 (ppm) 0.05~0.3 - 0.05
HCHO (㎍㎍㎍㎍/㎥㎥㎥㎥) 100 0.1ppm 100
Total Suspended Bacteria (CFU/㎥㎥㎥㎥)
800 - 800
Radon (pCi/L) 4 - 4
VOCs (㎍㎍㎍㎍/㎥㎥㎥㎥) 400~1000 - 400
Asbestos (piece/cc) 0.01 - 0.01
O3 (ppm) 0.06~0.08 - 0.06
Mite (No./㎥㎥㎥㎥) - - 100
Falling germ
(CFU/class room)- - 10
3
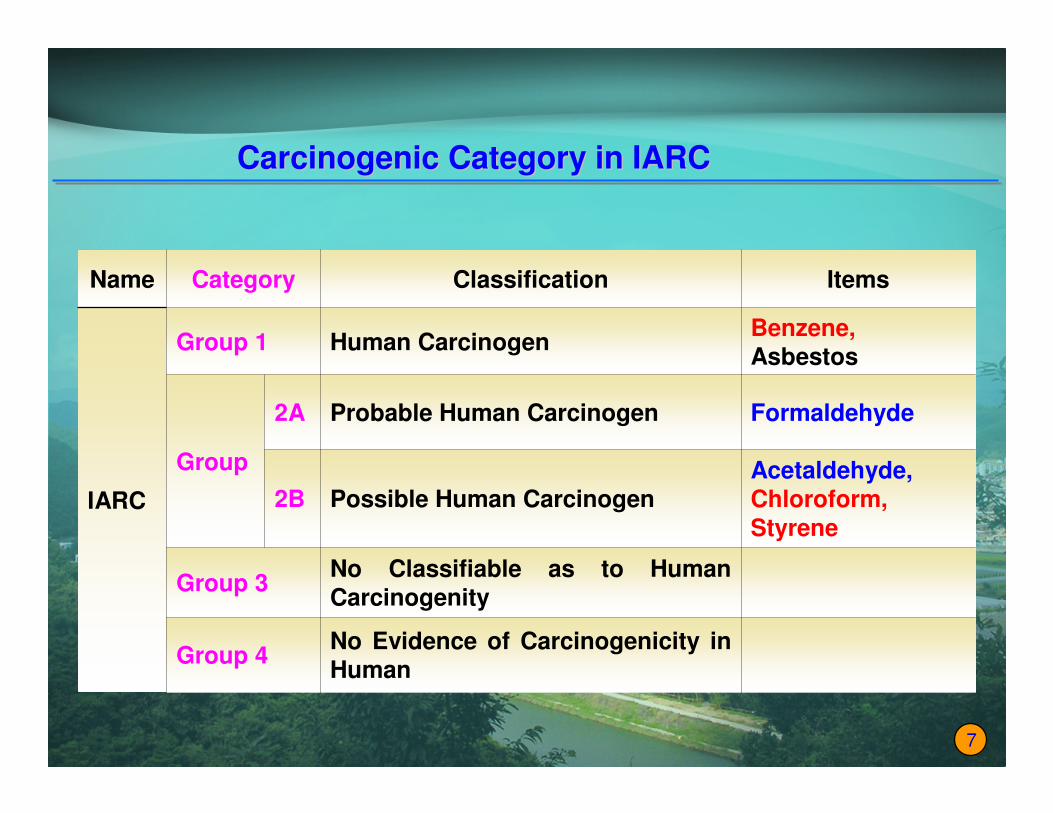
Carcinogenic Category in IARCCarcinogenic Category in IARC
Name Category Classification Items
IARC
Group 1 Human CarcinogenBenzene, Asbestos
Group
2A Probable Human Carcinogen Formaldehyde
2B Possible Human CarcinogenAcetaldehyde, Chloroform,
Styrene
Group 3No Classifiable as to Human
Carcinogenity
Group 4No Evidence of Carcinogenicity in
Human
7

Typical Classroom in Elementary Schools

Construction Construction
AgeAgeConstruction Construction
YearYearNo. of No. of
schoolsschoolsLower/Higher Lower/Higher
school yearschool yearTotal: Total: 28 28
classroomsclassrooms
Newly BuiltNewly Built 20072007 22 2 / 22 / 2 88
3 to 5 years3 to 5 years 2003 2003 -- 20052005 33 2 / 22 / 2 1212
above 10 above 10
yearsyears1972, 19861972, 1986 22 2 / 22 / 2 88
8
Study Areas Study Areas andand SamplingSampling
Þ Sampling period: Spring (April), Summer(July), Winter(Nov., Dec.)
Þ 6 Aldehydes and Ketones (Formaldehyde, Acetaldehyde, Acetone,
Propionaldehyde, MethylEthylKetone, Acrolein)
Þ 5 VOCs (Benzene, Toluene, Ethylbenzene, m,p-Xylene, Styrene)
Lower school year (1Lower school year (1stst & 2& 2ndnd) on 1&2 F and Higher school year (5) on 1&2 F and Higher school year (5thth & 6& 6thth) on 4&5 F.) on 4&5 F.

Newly Built SchoolsNewly Built Schools
AgeSchool Name
Open-ing year
gradeClass-room
FloorDirec-tion
Floor material
Cooling/Heating system
Number of desk
No. of students(girl/boy)
note
Newly Buit
A 2007
lower
A1 1st South wood A/C 26 13/13
A2 1st S wood A/C 26 14/12
higher
A3 5th S wood A/C 28 12/15
A4 5th S wood A/C 28 11/17
B 2007
lower
B1 1st S wood A/C 37 19/18
B2 1st S wood A/C 37 17/20
higher
B3 4th S wood A/C 32 16/16
B4 4th S wood A/C 32 14/18 30.8
13
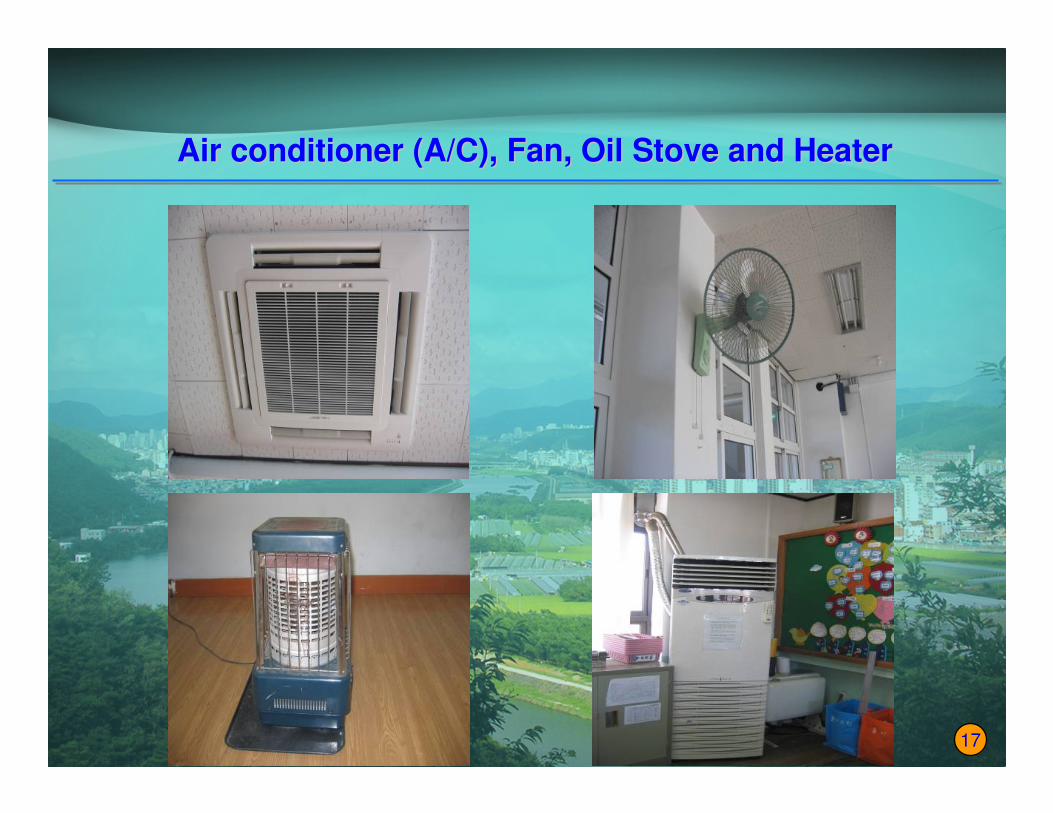
Air conditioner (A/C), Fan, Oil Stove and HeaterAir conditioner (A/C), Fan, Oil Stove and Heater
17

Classroom EnvironmentClassroom Environment
20
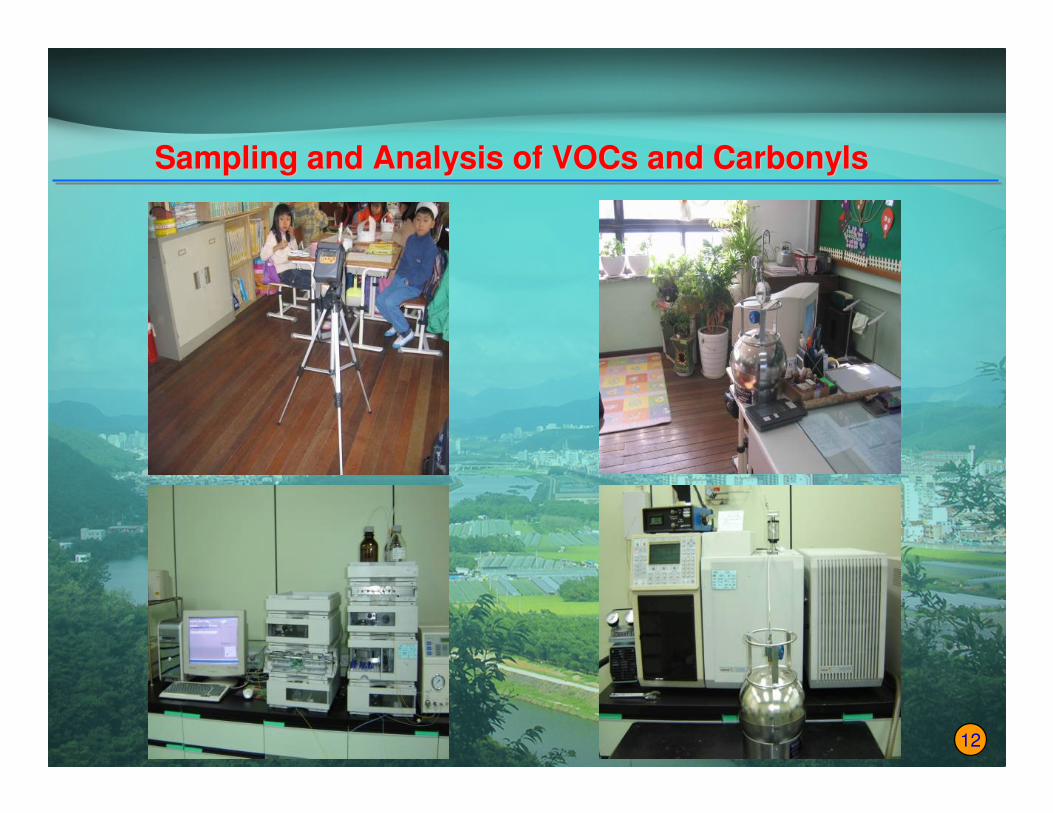
Sampling and Analysis of VOCs and CarbonylsSampling and Analysis of VOCs and Carbonyls
12

Results and DiscussionResults and Discussion
Temperature, Humidity and PressureTemperature, Humidity and Pressure
Item Spring Summer Winter
Temperature (℃℃℃℃)
Avg. 19 26 20
Newly built 20 25 20
3 to 5 years 19 25 19
Over 10 years 20 28 20
Lower grade 19 26 20
Higher grade 20 26 19
Relative Humidity
(%)
Avg. 46 61 33
Newly built 54 60 32
3 to 5 years 45 61 32
Over 10 years 48 62 34
Lower grade 49 66 32
Higer grade 48 55 34
Pressure (mmHg) Avg 753 746 76121

Carbonyls and VOCs of School Classrooms (unit: ㎍㎍㎍㎍/㎥㎥㎥㎥,
n=84) Compounds mean S.D. median min max
Formaldehyde 44.9 43.7 32.3 10.1 335.2
Acetaldehyde 7.2 6.1 6.1 1.7 55.1
Acetone 39.4 36.8 29.4 3.4 285.0
Acrolein 0.0 0.0 0.0 0.0 0.0
Propionaldehyde 1.3 1.7 1.1 0.0 11.6
MEK 11.9 16.6 5.8 0.0 88.6
Benzene 3.5 3.2 2.4 0.0 14.3
Toluene 93.8 92.0 56.0 7.4 357.2
Ehtylbenzene 14.8 14.9 11.2 1.27 85.7
m,p-xylene 15.5 12.7 11.6 1.5 50.5
styrene 6.2 10.6 3.4 0.0 61.8
22

Carbonyls and VOCs Carbonyls and VOCs (unit: (unit: ㎍㎍㎍㎍㎍㎍㎍㎍//㎥㎥㎥㎥㎥㎥㎥㎥, n=84) , n=84)
Benzene Toluene Ethylbenzene m,p-Xylene Styrene
0
100
200
300
400
VOCs
FA AA Acetone PA MEK
§¶/§
©
0
100
200
300
400
Aldehydes
23

Carbonyls & VOCs Conc. by construction ageCarbonyls & VOCs Conc. by construction age ((unit: unit: ㎍㎍㎍㎍㎍㎍㎍㎍//㎥㎥㎥㎥㎥㎥㎥㎥, ,
n=84n=84) ) Compounds
Newly built 3~5 years over 10 years
Mean ±SD Mean ±SD Mean ±SD
Formaldehyde 65.3±68.3 40.7±27.8 31.0±19.9
Acetaldehyde 10.0±10.3 6.3±3.1 5.8±2.1
Acetone 66.8±58.1 31.0±13.2 24.7±10.7
Acrolein 0.0±0.0 0.0±0.0 0.0±0.0
Propion aldehyde 2.0±2.5 1.1±1.1 0.7±0.9
Methyl Ethyl Ketone 29.3±23.0 5.0±3.5 4.9±2.7
Benzene 2.8±1.8 3.7±3.3 3.7±4.0
Toluene 182.6±116.0 65.0±61.3 67.0±63.5
Ehtyl Benzene 24.6±20.6 14.2±11.8 8.0±9.2
m,p-Xylene 26.1±13.5 11.7±8.3 13.0±13.3
Styrene 16.0±17.9 4.4±3.9 1.3±1.5
24

Concentrations by Built AgeConcentrations by Built Age ((unit: unit: ㎍㎍㎍㎍㎍㎍㎍㎍//㎥㎥㎥㎥㎥㎥㎥㎥, n=84, n=84) )
Aldehydes
0.0
20.0
40.0
60.0
80.0
FA AA Acetone Acrolein PA MEK
㎍/㎥
new3- 5 yearsover 10 years
VOCs
0.0
50.0
100.0
150.0
200.0
Benzene Toluene E-Benzene m,p- Xylene Styrene
㎍/㎥
new3-5 yearsover 10 years
26

Percentage of Carbonyls & VOCs Percentage of Carbonyls & VOCs ((unit: unit: ㎍㎍㎍㎍㎍㎍㎍㎍//㎥㎥㎥㎥㎥㎥㎥㎥, n=84, n=84) )
Percentage of Aldeydes
MEK11%
PA1%
AA7%
Acrolein0%
FA43%
Acetone38%
Percentage of VOCs
Toluene69%
E- Benzene11%
m,p- Xylene12%
Styrene5% Benzene
3%
25

Seasonal Concentrations Seasonal Concentrations ((unit: unit: ㎍㎍㎍㎍㎍㎍㎍㎍//㎥㎥㎥㎥㎥㎥㎥㎥, n=84, n=84) )
CompoundsSpring Summer Winter
mean±SD mean±SD mean±SD
Formaldehyde 37.9±16.5 79.5±59.3 17.4±4.0
Acetaldehyde 7.4±2.2 9.4±9.9 4.8±1.4
Acetone 39.5±22.2 44.1±52.7 34.6±29.0
Acrolein 0.0±0.0 0.0±0.0 0.0±0.0
Propionaldehyde 1.8±0.8 1.9±2.4 0.2±0.5
Methyl Ethyl Ketone 16.9±23.3 13.2±15.3 5.6±2.9
Benzene 2.5±1.0 1.2±0.7 6.8±3.5
Toluene 88.5±79.7 115.0±124.5 76.6±54.4
Ehtyl Benzene 7.5±47 16.6±20.2 19.5±12.3
m,p-xylene 13.6±9.6 8.9±10.1 24.1±13.1
styrene 4.0±5.3 10.4±164 3.9±2.9
27
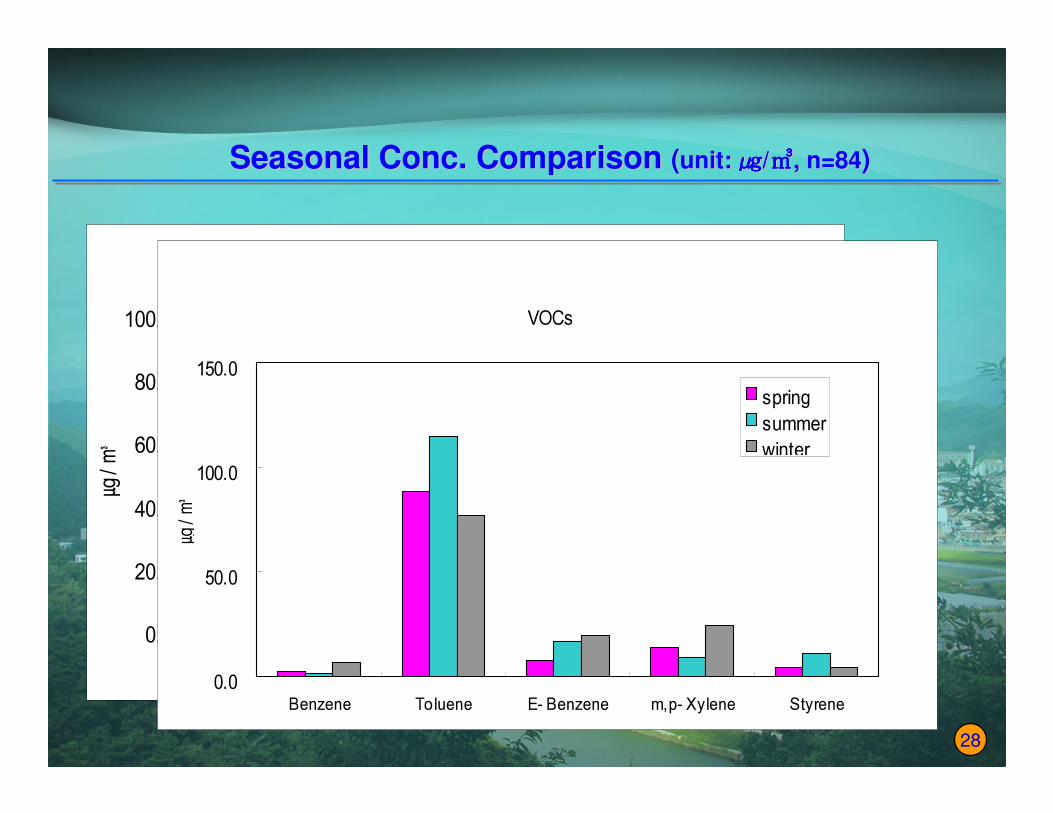
Seasonal Conc. ComparisonSeasonal Conc. Comparison ((unit: unit: ㎍㎍㎍㎍㎍㎍㎍㎍//㎥㎥㎥㎥㎥㎥㎥㎥, n=84, n=84) )
Aldehydes
0.0
20.0
40.0
60.0
80.0
100.0
FA AA Acetone Ac rolein PA MEK
㎍/㎥
springsummerwinter
VOCs
0.0
50.0
100.0
150.0
Benzene Toluene E- Benzene m,p- Xylene Styrene
㎍/㎥
springsummerwinter
28

Total VOCs by seasonal Total VOCs by seasonal ((unit: unit: ㎍㎍㎍㎍㎍㎍㎍㎍//㎥㎥㎥㎥㎥㎥㎥㎥, n=84, n=84) )
VOCs
0.0
50.0
100.0
150.0
200.0
Spring Summer Winter
㎍/㎥
Benzene Toluene E-Benzene m,p- Xylene Styrene29

Concentration by grade Concentration by grade ((unit: unit: ㎍㎍㎍㎍㎍㎍㎍㎍//㎥㎥㎥㎥㎥㎥㎥㎥, ,
n=84n=84) )
*indicates that lower grade and upper grade are significantly different at a level of 0.05
CompoundsLower grades Higher grades p-
value
(High
/Low)mean S.D. mean S.D
Formaldehyde 40.5 24.7 49.3 56.8 0.228 1.2
Acetaldehyde 5.7 2.2 8.7 8.2 0.011 1.5*
Acetone 31.6 21.1 47.2 46.5 0.027 1.5*
Acrolein 0.0 0.0 0.0 0.0 - -
Propionaldehyde 1.1 1.2 1.5 2.0 0.195 1.3
Methyl Ethyl Ketone 9.5 10.6 14.3 20.9 0.019 1.5*
Benzene 3.6 3.5 3.4 2.9 0.725 0.9
Toluene 85.5 89.9 103.28 94.9 0.157 1.21
Ehtyl Benzene 10.7 9.4 19.47 18.5 0.001 1.8*
m,p-xylene 13.0 11.8 18.45 13.3 0.001 1.4*
styrene 3.0 2.8 10.00 14.5 0.004 3.4*
30

** Correlation is significant at the 0.01 level(2-tailed). * Correlation is significant at the 0.05 level(2-tailed).
Aldehyde FA AA Acetone PA M E K Temp RH
Form Al 1.000
Acet Al .840(**) 1.000
Acetone .666(**) .795(**) 1.000
Propion Al .761(**) .797(**) .639(**) 1.000
MEK .468(**) .479(**) .525(**) .431(**) 1.000
Temp .479(**) .201 .044 .214 .041 1.000
RH .481(**) .194 .062 .407(**) .233(*) .611(**) 1.000
CorrelationsCorrelations of Carbonyls of Carbonyls ((unit: unit: ㎍㎍㎍㎍㎍㎍㎍㎍//㎥㎥㎥㎥㎥㎥㎥㎥, n=84, n=84) )
31

** Correlation is significant at the 0.01 level(2-tailed). * Correlation is significant at the 0.05 level(2-tailed).
CorrelationsCorrelations of VOCs of VOCs ((unit: unit: ㎍㎍㎍㎍㎍㎍㎍㎍//㎥㎥㎥㎥㎥㎥㎥㎥, n=84, n=84) )
BenzeneToluene Ethylbenzene
m,p-
XyleneStyrene Temp RH
Benzene 1.000
Toluene .121 1.000
Ethylbenzene .232(*) .644(**) 1.000
m,p-Xylene .239(*) .643(**) .544(**) 1.000
Styrene -.213(*) .612(**) .760(**) .606(**) 1.000
Temp .054 .078 -.328(**) -.025 .078 1.000
RH -.077 .126 -.150 -.354(**) -.140 .198 1.000
32

ConclusionsConclusions
As the As the construction age construction age of schools increases, the concentrations of schools increases, the concentrations
of the aldehydes and ketones in the classrooms of the aldehydes and ketones in the classrooms decreasedecrease..
The mean values of formaldehyde and benzene were 44.9 and 3.5 The mean values of formaldehyde and benzene were 44.9 and 3.5 μμμμμμμμg/mg/m33, resp. , resp.
The The highest highest concentrations of concentrations of aldehydes, ketones, toluene and aldehydes, ketones, toluene and
styrenstyrene were observed in e were observed in summer summer sampling periods followed sampling periods followed
by spring and winter, in turn.by spring and winter, in turn.
33

ConclusionsConclusions
The concs of the The concs of the aldehydes and ketones and the VOCs aldehydes and ketones and the VOCs (ethybenzene, (ethybenzene,
m,pm,p--xylenes, styrene) in the xylenes, styrene) in the higher gradehigher grade classrooms were classrooms were 1.2~1.5 1.2~1.5
and 1.4~3.4 times, and 1.4~3.4 times, respectively, as high as those in the respectively, as high as those in the low grade low grade
ones.ones.
To get good IAQ for classrooms, proper ventilation should be done periodically.
34