Embed Size (px)
Citation preview

Analysis of Waste & Recyclable Materials Collection Arrangements
Minnesota Pollution Control AgencyPresented by Jeff Schneider4-16-2009
Presentation Topics
•
1. Purpose of Study & Scope of Work
•
2. Types & Prevalence of “Systems”
•
3. System Cost / Rates Comparison
•
4. Impacts on Program Outcomes
•
5. Impacts on Roads
•
6. Greenhouse Gas & Fuel Consumption
Common Terminology
•
Only Addressing Curbside Residential Collection Services
•
“Open Collection”
Systems –
Household Chooses any City Licensed Hauler
•
“Organized Collection”
Systems –
City or County Either Contracts w/ a Private Hauler or Collects w/ Municipal Trucks / Crews
•
Sometimes Applied to MSW & Recycling Separately

1.
Purpose of Study
•
Develop “Quantifiable”
Data Comparing Open & Organized MSW & Recyclables Collection Related to:
•
Economics, Rates / Costs
•
Impacts on the Environment
•
Efficiency & Effectiveness Program Outcomes
•
Related to MPCA Objectives for GHG & Energy Reductions

1.
Scope of Work
•
Literature Review & Analysis of Past Efforts to Organize Collection
•
Survey of MN Cities with 10,000+ Population
•
Comparison & In-Depth Analysis of 10 Select Cities –
5 Open Compared to 5 Organized
•
Conclusions Related to Above
•
Information Development Only –•
No Recommendations or Policy Options

2.
Prevalence of Collection Arrangements
•
Open Collection is Prevalent in Minnesota•
Statewide Estimate for Open Collection ~•
65% to 80% have Open MSW•
40% to 50% have Open Recycling
•
National Reports Suggest Organized is more Common Outside of Minnesota•
Survey of Cities Est. ~ 72% Organized•
Survey of 100 Largest Cities in US Found ~ 80% Organized

2.
Use of the Organized Collection Statute
•
Several Examples Follow a Typical Process
•
City expresses interest in organizing•
Staff work along with a committee•
Haulers involved, generally opposed•
Rallying of the “troops”, slanted messages•
Residents express desire for freedom of “Choice”•
Councils decline to proceed
•
Study found no city that changed from open to organized collection since ~ 1991

2.
Typical Municipal Goals & Objectives
“City expresses interest in organizing”
because…
•
Reduce Amount of Truck Traffic & Related Impacts
•
Reduce Monthly Cost / Rates per Household
•
Improve Program Outcomes & Standardize Services
•
Improve Management of Waste According to SWM Plans & Hierarchy

2.
Waste Hauler Goals & Objectives
Hauler Involvement, Rallying of the Troops…
•
Haulers oppose organized collection to protect their business interests
•
Favor free market –
customer choice
•
Risk loss of customers, limits growth, limits company value
•
Raise issue of “Just Compensation/Inverse Condemnation”

2.
Public Entity Association Goals & Objectives
•
Maintaining ability to organize collection
•
Opposed to Inverse Condemnation
3.
Costs
•
Cost Issues Addressed from Multiple Approaches•
Literature Review for historical information•
Municipal surveys/in-depth analysis with follow up billing surveys
•
Review of contracts•
Review of websites

3.
Costs
•
While there are exceptions, and cost related issues can be complex –
•
Residents in Organized Collection Systems Can & Do Pay Less

3.
Costs
•
Literature review found examples of surveys from organized collection studies
•
Consistent conclusions by those cities is that organized cities show a lower cost across 30 to 60 to 90 gallon service

CityType 30 Gal 60 Gal 90 Gal
Falcon Heights (average of 6 companies) Open $13.59 $15.56 $17.17
Roseville (average of 7 companies) Open $12.85 $14.90 $16.84
Maplewood (average of 9 haulers) Open $12.19 $14.11 $16.08
North St. Paul, 2003 Organized $8.07 $8.86 $10.39
Shakopee, 2004-2005 Organized $8.60 $10.65 $12.24
Little Canada, 2002 (most recent rates listed) Organized $8.29 $9.77 $11.29
White Bear Lake Organized $7.50 $11.00 $15.00
Stillwater, 3 years ending 12/31/05 Organized $8.16 $10.06 $12.03
3. Historical Rate Survey Example

3.
Literature Review Costs
•
Similar results •
Oakdale survey (2001)•
1993 Metro Area Study (GBB Report)
•
Important to identify variables that affect rates•
Service levels•
Distances•
Tipping fees•
Taxes and surcharges•
Impact of bulky waste costs

3.
2008 Municipal Rate Survey
•
Rate information collected as part of survey included:
•
Billing survey sought rate breakdown for:
•
Garbage service levels at 30 –
60 –
90 gallons•
Taxes•
Surcharges•
Recycling•
Yard Waste•
Bulky Wastes
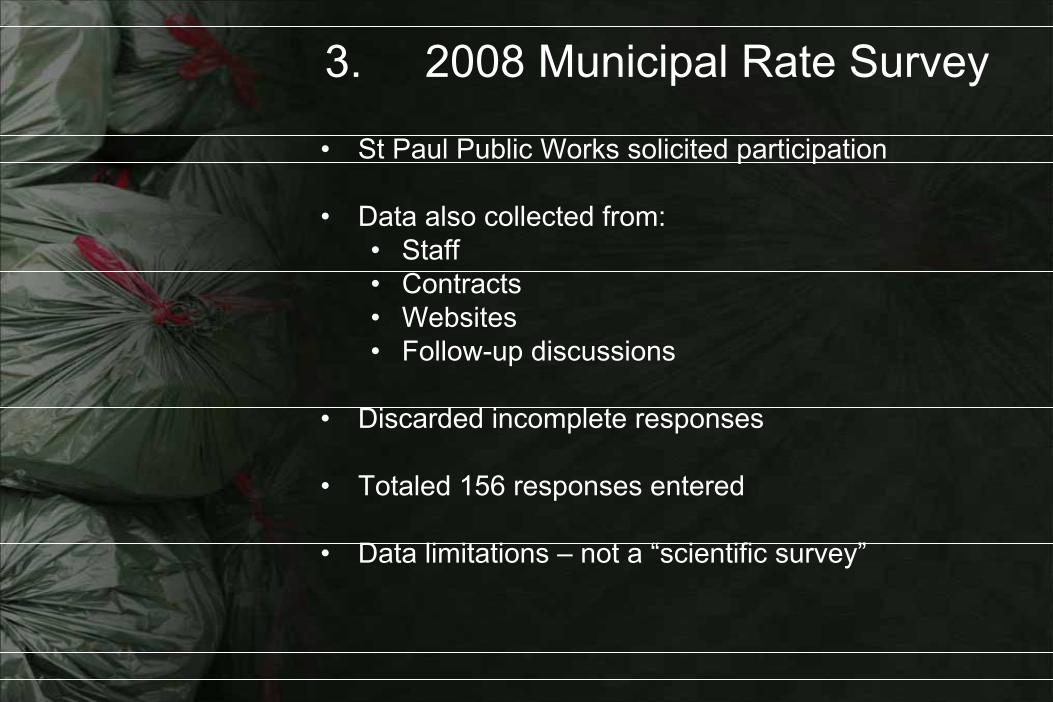
3.
2008 Municipal Rate Survey
•
St Paul Public Works solicited participation
•
Data also collected from:•
Staff•
Contracts•
Websites•
Follow-up discussions
•
Discarded incomplete responses
•
Totaled 156 responses entered
•
Data limitations –
not a “scientific survey”

3.
Rates Varied for Same Hauler in Same City
MSW Hauler 30 Gallon 60 Gallon 90 Gallon
Eagan –
Hauler A $16.98
Hauler A -- $30.06 --
St. Paul –
Hauler B $24.63
Hauler B $29.80 -- --
St. Paul –
Hauler C $36.99 $47.76 $39.08
Hauler C $22.87 $48.32 $29.75
Hauler C $21.50 $18.29 --
Hauler C $43.25
St. Paul –
Hauler D $25.08 $32.97
Hauler D $9.60 --
Woodbury-Hauler E $13.92 $21.18
Hauler E -- $18.12 $25.22
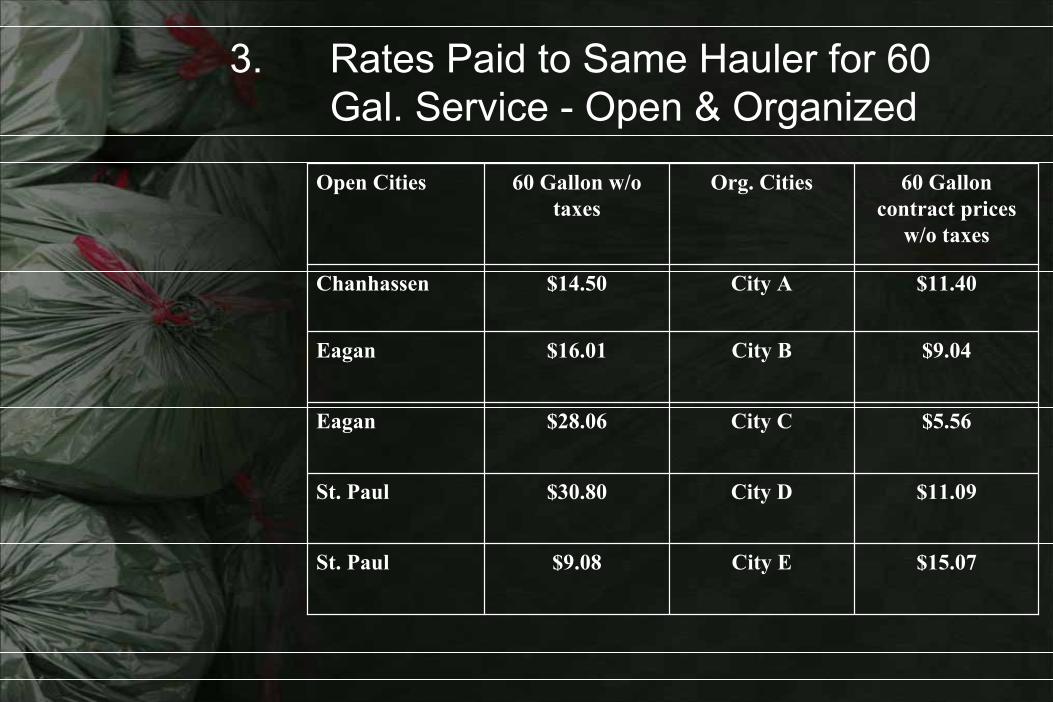
3.
Rates Paid to Same Hauler for 60 Gal. Service -
Open & Organized
Open Cities 60 Gallon w/o taxes
Org. Cities 60 Gallon contract prices
w/o taxes
Chanhassen $14.50 City A $11.40
Eagan $16.01 City B $9.04
Eagan $28.06 City C $5.56
St. Paul $30.80 City D $11.09
St. Paul $9.08 City E $15.07

3.
Overall Survey – Average Monthly
Rates Charged to Residents
Collection System
Average Monthly Rate
30 Gallon 60 Gallon 90 Gallon
Open MSW $22.64 $25.46 $25.46
Organized MSW $14.83 $16.98 $22.23
Difference $7.81 $8.48 $4.27
% Change +53% +50% +19%

3.
Average Monthly Service Rates Credited to Haulers
Collection SystemAverage Monthly Rate
30 Gallon 60 Gallon 90 Gallon
Open MSW without taxes $19.25 $20.86 $21.53
Organized MSW (contract prices) $12.19 $13.22 $17.29
Difference $7.06 $7.64 $4.24
% Change +58% +58% +25%
3.
Factors Affecting Rates
•
There can be many variables included or not included in “Monthly Rates”
•
One of most critical are charges for “extra services”
such as bulky waste collection
•
In some open systems, haulers choose not to charge for extra service to avoid causing the customer to change haulers

3.
Factors Affecting Rates
•
Some organized systems have rate schedules for extras that can be high
•
Some organized systems manage the extra costs very well, controlling extra costs within the base rate

3.
Example - City of Robbinsdale
System
2008 Rate Schedule
Average Monthly Rate Paid to Contractor
30 Gallon 60 Gallon 90 Gallon
Organized MSW $7.09 $8.52 $9.94
Yard Waste $2.53 $2.53 $2.53
Recycling $2.57 $2.57 $2.57
TOTAL $12.19 $13.62 $15.04

3.
City of Robbinsdale Contract Service Scope of Services
•
Weekly garbage collection
•
Every other week recycling
•
Unlimited yard waste collection April to November
•
Dispose one Christmas tree
•
Bulky waste collection (except for white goods)
•
Hauler pays disposal costs
•
“Free”
service at 6 city facilities

3.
Example - City of Robbinsdale
System
2008 Rate Schedule
City Billing vs
Monthly Rate Paid to Contractor
30 Gallon 60 Gallon 90 Gallon
City Monthly Billing $19.19 $21.81 $24.61
Total Paid to Hauler $12.19 $13.62 $15.04
Difference $7.00 $8.19 $9.57
3.
Example - City of Robbinsdale
System
•
Additional funds cover•
State taxes, county taxes, administrative cost
•
Operation of a drop-off facility
•
Code enforcement related to solid wastes
•
Payment to annual CIP for road improvements ($150,000 in 2008)

3.
Example - City of Robbinsdale
System
•
Additional highlights•
Fuel adjustment clause built into contract
•
City receives management reports
•
City directs MSW according to County Plan
•
Contracted rate increases over contract term for yard waste and recycling

3.
Robbinsdale Summary
•
Cost effective base rates•
Weekly garbage•
Unlimited yard waste
•
Every other week recycling
•
Bulky item collection•
City utility bill fees cover other costs
•
Collect management data
•
No added cost for city facilities
•
Contracted rate increases
•
Built in, step based fuel adjustment clause

3.
Fuel Cost Adjustments
•
There was a wide range for fuel surcharges reported in open cities
•
Where reported in open cities, the range was $0.59 to $6.02 per month.
•
In organized cities, some contracts are “silent”
on fuel adjustments. Hence, negotiable
•
Some like Robbinsdale cover fuel escalation in the contract (in 2008, calculated to $0.82 for 60 gallon service)

4.
Organized Collection Impacts on Program Outcomes
•
Analysis of SWMCB Re-TRACTM
data found an increase in recycling pounds per household in cities with organized recycling collection (95% significance)
•
Open MSW/Open recycling = 510 pounds
•
Open MSW/Org. recycling = 583 pounds
•
Org. MSW/Org. recycling = 573 pounds
•
Average for Org. recycling = 579 pounds
4.
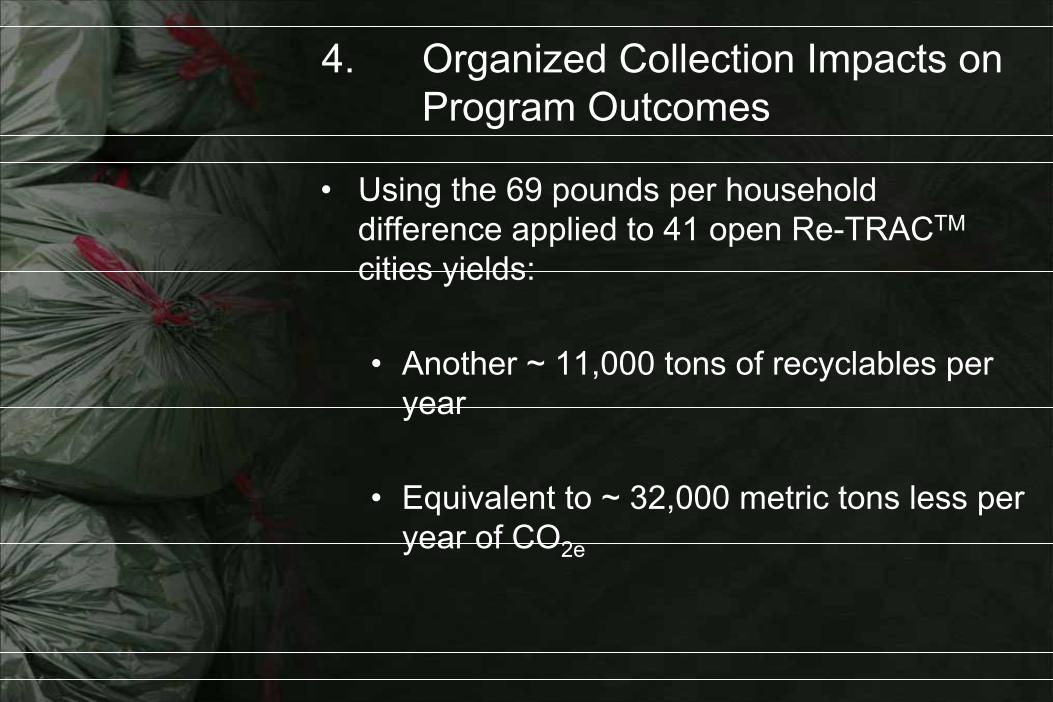
Organized Collection Impacts on Program Outcomes
•
Using the 69 pounds per household difference applied to 41 open Re-TRACTM
cities yields:
•
Another ~ 11,000 tons of recyclables per year
•
Equivalent to ~ 32,000 metric tons less per year of CO2e

5.
Impact on Roads
•
Commonly stated concern for municipalities with open systems•
City engineers and/or public works directors
•
Literature Review and follow-up did not find much documented, quantifiable data on actual residential streets in MN
•
Relative impact is likely variable based on street type and relative amount of garbage truck traffic to other traffic

5.
Impact on Roads
•
Data available relating a garbage truck to other types of vehicles•
Equivalent Single Axle Load (ESAL)•
MnDOT uses a formula of one garbage truck equivalent to 1,000 car trips
•
City of Falcon Heights attributed the impact of garbage trucks on roads as •
High in alleys (~86% of impact due to garbage trucks)•
Low in heavily traveled areas (~8% due to garbage trucks)

5.
Impact on Roads
•
Design loads of residential streets plays a factor
•
City of Arden Hills memo that while reducing the number of heavy trucks should be positive, there are environmental factors generally responsible for majority of pavement deterioration on City’s 9 ton load designed streets

5.
Impact on Roads
•
Cost estimates of road impacts for cities
•
Open systems:
•
City of Roseville noted $20 to $40 per household per year from garbage trucks ($188,000 to $376,000)
•
City of Oakdale reported an estimate of $120,000 to $300,000 per year
•
Organized systems:
•
City of Robbinsdale set aside $150,000 from solid waste fees for roads in 2008
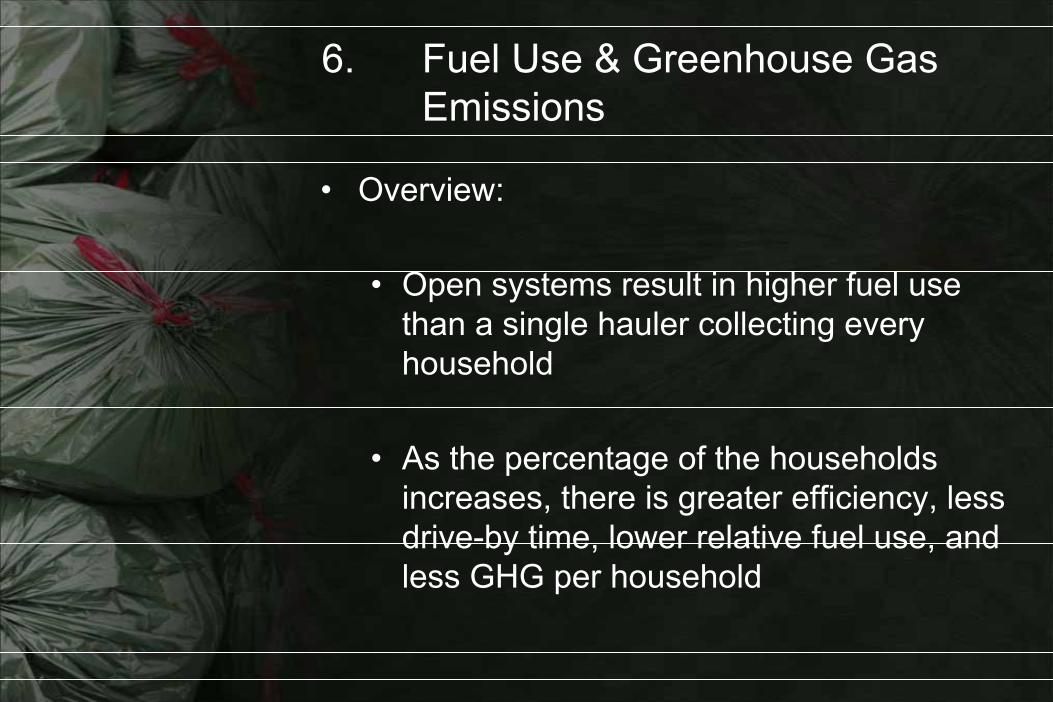
6.
Fuel Use & Greenhouse Gas Emissions
•
Overview:
•
Open systems result in higher fuel use than a single hauler collecting every household
•
As the percentage of the households increases, there is greater efficiency, less drive-by time, lower relative fuel use, and less GHG per household

6.
Fuel Use & Greenhouse Gas Emissions
•
Field work was conducted to measure fuel consumed at different distances between stops and while loading (on route time)
•
Fuel consumption measurements assumed a standard truck
•
The analysis demonstrates relative differences between servicing every household versus serving a lower percentage

6.
Developing Field Trial Data
•
Base line fuel use data was established by actual field test results
•
A 20 cubic yard, tandem axle, packer truck was used to replicate field conditions and collect fuel consumption data
•
Engine management data was collected for the different distances

6.
Developing Field Trial Data
•
Field fuel use measurements were collected for following distances in feet:•
100•
220•
330•
500•
600•
Plus, idle time fuel use to replicate loading

6.
Field Trial Fuel Consumption
0
1
2
3
4
5
6
70
100
200
300
400
500
600
700
Feet per Stop
Oun
ces
of F
uel C
onsu
med

6.
Field Observations
•
Trucks were followed on sample routes in the in-depth cities
•
Measurements included the average distance between all potential stops and the average distance between households actually serviced
•
The key data is the average distance between all potential stops

6. Field Observations
291
586
315
275
582
112 83.7123
86118
0
50
100
150
200
250
300
350
400
450
500
550
600
650
Eagan Duluth Rochester Woodbury St Paul
Feet
Distance per household serviced
Actual Distance per Household Totalroute

6.
Market Share Data
•
Estimates of the market share for haulers operating in the five open cities in the in-
depth analysis were developed
•
County hauler reporting data
•
Discussions with county or WLSSD staff of their knowledge combined with available data
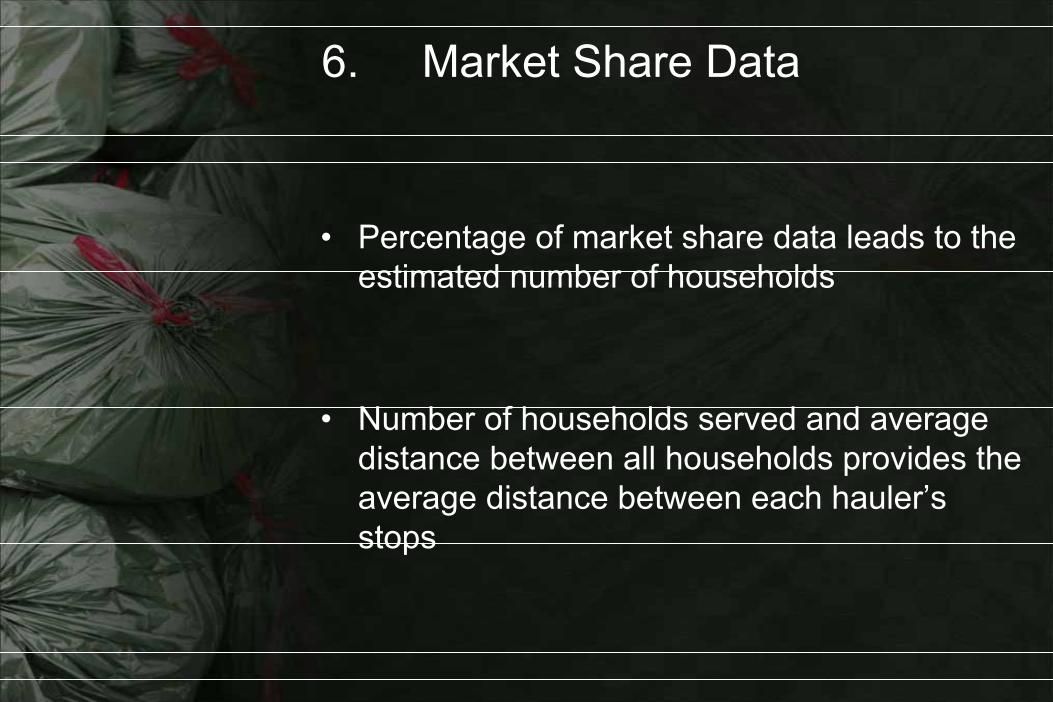
6.
Market Share Data
•
Percentage of market share data leads to the estimated number of households
•
Number of households served and average distance between all households provides the average distance between each hauler’s stops
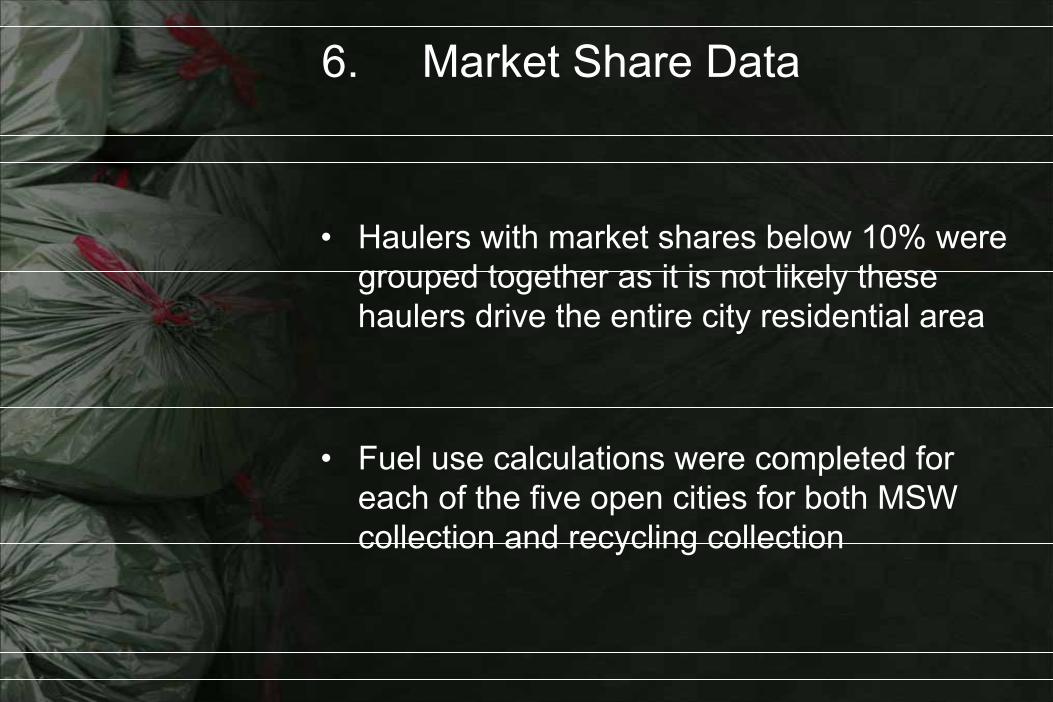
6.
Market Share Data
•
Haulers with market shares below 10% were grouped together as it is not likely these haulers drive the entire city residential area
•
Fuel use calculations were completed for each of the five open cities for both MSW collection and recycling collection

6.
Percentage of Increased Fuel Use
Increased Fuel Use –
Existing System vs
a Single Hauler for MSW
% More Fuel
City
Eagan Duluth Roch. Wdbry. St.Paul
216% 294% 250% 355% 437%
6.
Factors Affecting Increased Fuel Use
•
City of Eagan has one hauler with over a 60% market share resulting in relatively lower relative fuel use
•
City of St. Paul has the most haulers with relatively lower market shares (highest ~25%) resulting in higher relative fuel use

6.
Greenhouse Gas Differences
•
Converting the increased fuel use to GHG provides the following for the five open cities:
•
MSW
=
2,347 metric tons of CO2e
•
Recycling =
998 metric tons of CO2e
•
Total
=
3,345 metric tons of CO2e

6.
Greenhouse Gas Differences
•
Calculating a difference on a household basis and applying it to the 30 municipal survey cities households with open systems provides an estimated additional 6,070 metric tons.
•
Total estimate = 9,415 metric tons of CO2e

Public Comment Being Sought Now!
•
www.pca.state.mn.us
•
Waste Collection Service Arrangements…
•
Check it out!!!!
•
Jeffrey Schneider•
507-529-8830

Questions•
Answers