Embed Size (px)
Citation preview
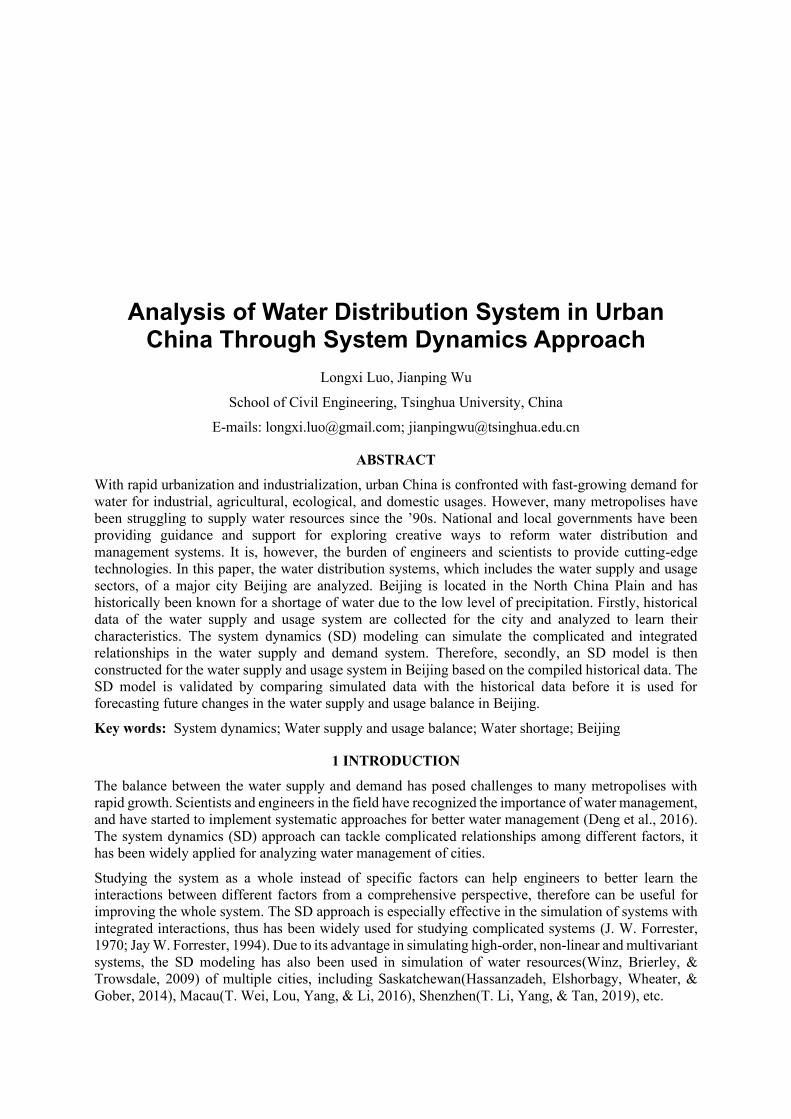
Analysis of Water Distribution System in Urban China Through System Dynamics Approach
Longxi Luo, Jianping Wu
School of Civil Engineering, Tsinghua University, China
E-mails: [email protected]; [email protected]
ABSTRACT
With rapid urbanization and industrialization, urban China is confronted with fast-growing demand for
water for industrial, agricultural, ecological, and domestic usages. However, many metropolises have
been struggling to supply water resources since the ’90s. National and local governments have been
providing guidance and support for exploring creative ways to reform water distribution and
management systems. It is, however, the burden of engineers and scientists to provide cutting-edge
technologies. In this paper, the water distribution systems, which includes the water supply and usage
sectors, of a major city Beijing are analyzed. Beijing is located in the North China Plain and has
historically been known for a shortage of water due to the low level of precipitation. Firstly, historical
data of the water supply and usage system are collected for the city and analyzed to learn their
characteristics. The system dynamics (SD) modeling can simulate the complicated and integrated
relationships in the water supply and demand system. Therefore, secondly, an SD model is then
constructed for the water supply and usage system in Beijing based on the compiled historical data. The
SD model is validated by comparing simulated data with the historical data before it is used for
forecasting future changes in the water supply and usage balance in Beijing.
Key words: System dynamics; Water supply and usage balance; Water shortage; Beijing
1 INTRODUCTION
The balance between the water supply and demand has posed challenges to many metropolises with
rapid growth. Scientists and engineers in the field have recognized the importance of water management,
and have started to implement systematic approaches for better water management (Deng et al., 2016).
The system dynamics (SD) approach can tackle complicated relationships among different factors, it
has been widely applied for analyzing water management of cities.
Studying the system as a whole instead of specific factors can help engineers to better learn the
interactions between different factors from a comprehensive perspective, therefore can be useful for
improving the whole system. The SD approach is especially effective in the simulation of systems with
integrated interactions, thus has been widely used for studying complicated systems (J. W. Forrester,
1970; Jay W. Forrester, 1994). Due to its advantage in simulating high-order, non-linear and multivariant
systems, the SD modeling has also been used in simulation of water resources(Winz, Brierley, &
Trowsdale, 2009) of multiple cities, including Saskatchewan(Hassanzadeh, Elshorbagy, Wheater, &
Gober, 2014), Macau(T. Wei, Lou, Yang, & Li, 2016), Shenzhen(T. Li, Yang, & Tan, 2019), etc.
Beijing is a fast-growing city and the capital of China, but it has historically been short of water. It was
found that there was a big gap between the available water resources and the water demand for meeting
the fast growth in Beijing(D. Wei, 2005; S. Wei & Gnauck, 2007). To solve this difficulty, it was
suggested local water resources needed to be explored at the maximum capacity and outside water
should be diverted to Beijing. Beijing has initiated plans to relieve the shortage of water such as
improving waste water utilization(W. Li, Shi, Gao, Liu, & Cai, 2013; Sun, Deng, Huang, Shen, & Yu,
2008; Wang, Qiao, Liu, & Zhu, 2012) and diverting water from southern China(Y. Li, Xiong, Zhang,
Wang, & Wang, 2016; D. Wei, 2005; Zhu, Zhang, Chen, & Zhao, 2008). The South to North water
diversion project now provides much-needed water to Beijing though its impact on the ecological system
has been under debate(Zhang, 2009; Zhu et al., 2008).
To identify and solve possible challenges facing the water supply in Beijing, it is necessary to analyze
the characteristics of its water supply and usage balances. At first, to study the past behaviors of the
water balances in Beijing, the water supply and demand information from 2006 to 2017 is collected and
studied. Thanks to the convenience of the Internet, some data can be found on the World Wide Web.
Collected data is then pre-processed and complied for easier understanding. From analyses of the
historical data, characteristics in the water supplies and usages become clear. Major factors affecting the
water balance are identified and the reasons behind the changes are studied.
Since the water supply and usage system is complicated in Beijing as will be shown in this study, an SD
model is constructed for systematic simulation of the water supply and demand balance in Beijing.
Parameters in the SD model are selected by studying major elements in the water cycle of the city and
variables that determine the values of the major elements. Functions that represent the relationships
between the parameters are formulated based on regression or averaging of the historical data. In the SD
model, relationships related to the waste water utilization are the most complicated since they are
connected to both demand and supply sectors. Accuracy of the parameters and functions in the SD model
are evaluated by comparing the simulation data with the historical data. Afterward, future changes in
the water supply and demand balance are forecasted based on the SD model. Possible challenges are
identified for policymakers and engineers to use as a reference. Solutions to the challenges are discussed
based on the analytical results.
This paper is organized as follows: In section 2, the historical data of the water distribution system in
Beijing are analyzed and compared. In section 3, the formulation of the SD model of the water supply
and usage balance in Beijing is explained. In section 4, the SD model is validated and used for
forecasting future changes in the water balances in Beijing. Section 5 concludes this study.
2 HISTORICAL DATA OF WATER SUPPLY AND DEMAND BALANCE
Beijing is the second biggest city in China in terms of population with more than 20 million residents.
The best educational and political resources of China are concentrated in Beijing, therefore is one of the
ultimate destinations of young Chinese elites of every generation. But, being an inland city and located
in the low rainfall zone with monsoon climate of medium latitudes, Beijing is known for its shortage of
water resources. Therefore, the growing demand for water is a continuing challenge for this metropolis.
2.1 Water supplies in Beijing
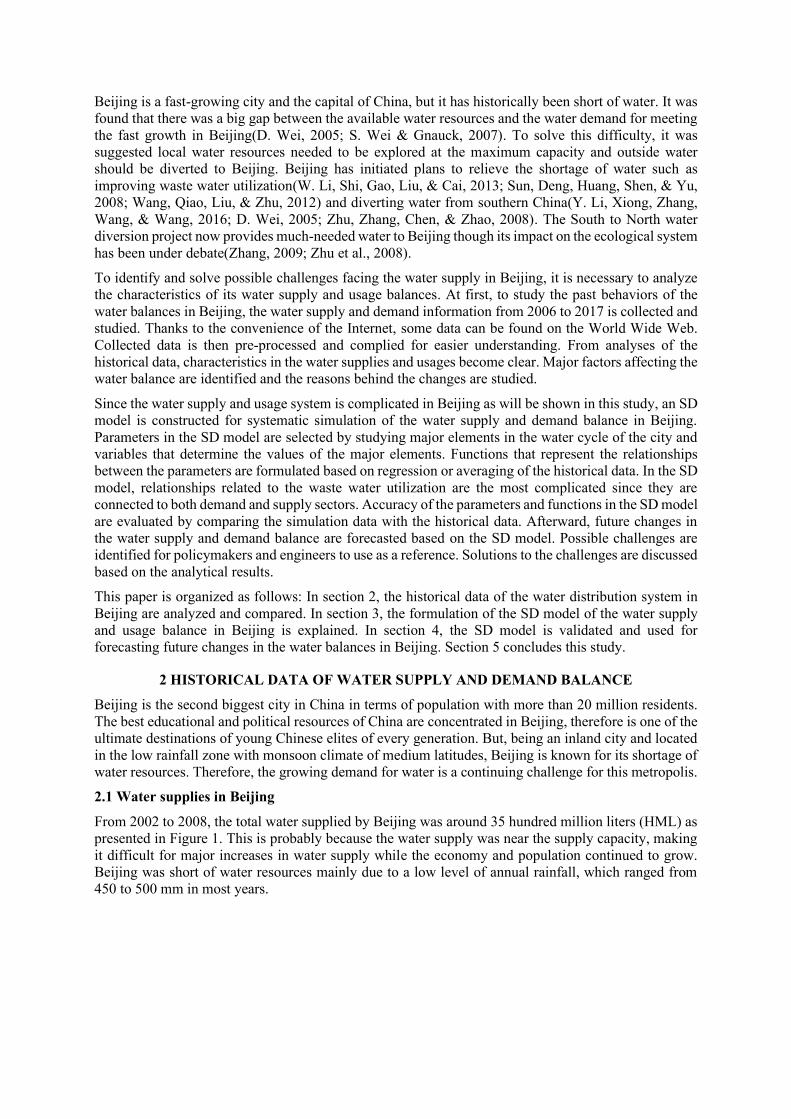
From 2002 to 2008, the total water supplied by Beijing was around 35 hundred million liters (HML) as
presented in Figure 1. This is probably because the water supply was near the supply capacity, making
it difficult for major increases in water supply while the economy and population continued to grow.
Beijing was short of water resources mainly due to a low level of annual rainfall, which ranged from
450 to 500 mm in most years.
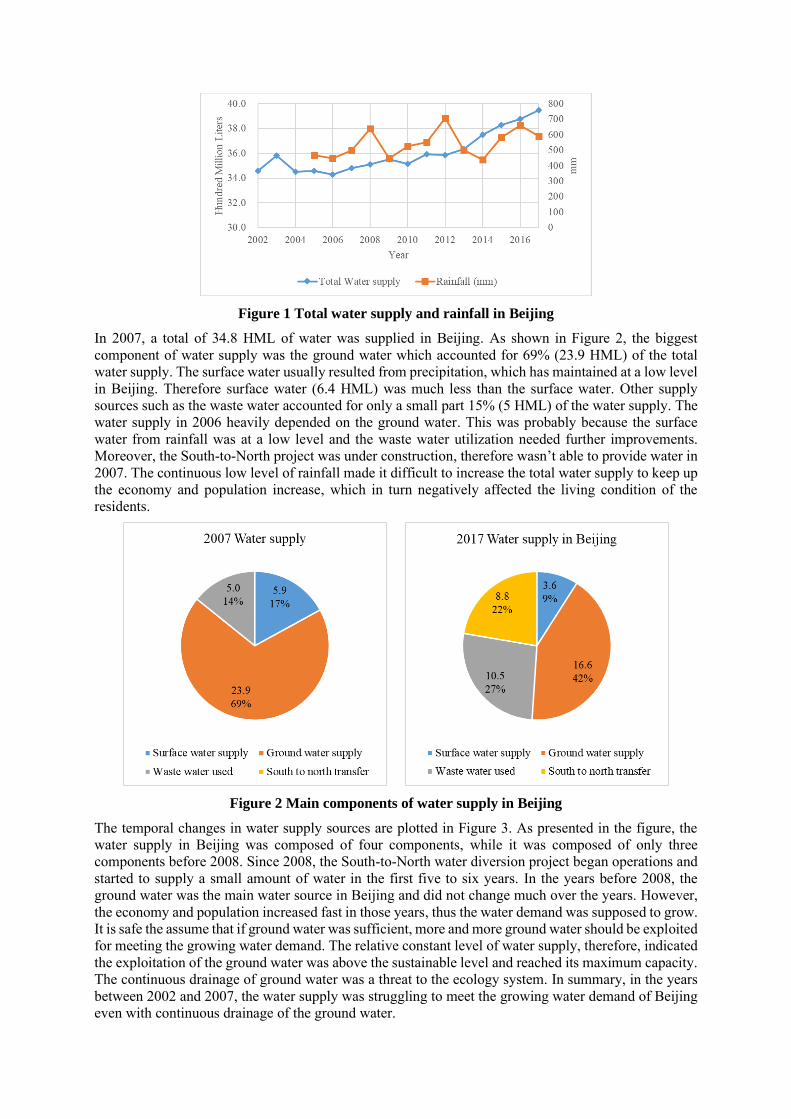
Figure 1 Total water supply and rainfall in Beijing
In 2007, a total of 34.8 HML of water was supplied in Beijing. As shown in Figure 2, the biggest
component of water supply was the ground water which accounted for 69% (23.9 HML) of the total
water supply. The surface water usually resulted from precipitation, which has maintained at a low level
in Beijing. Therefore surface water (6.4 HML) was much less than the surface water. Other supply
sources such as the waste water accounted for only a small part 15% (5 HML) of the water supply. The
water supply in 2006 heavily depended on the ground water. This was probably because the surface
water from rainfall was at a low level and the waste water utilization needed further improvements.
Moreover, the South-to-North project was under construction, therefore wasn’t able to provide water in
2007. The continuous low level of rainfall made it difficult to increase the total water supply to keep up
the economy and population increase, which in turn negatively affected the living condition of the
residents.
Figure 2 Main components of water supply in Beijing
The temporal changes in water supply sources are plotted in Figure 3. As presented in the figure, the
water supply in Beijing was composed of four components, while it was composed of only three
components before 2008. Since 2008, the South-to-North water diversion project began operations and
started to supply a small amount of water in the first five to six years. In the years before 2008, the
ground water was the main water source in Beijing and did not change much over the years. However,
the economy and population increased fast in those years, thus the water demand was supposed to grow.
It is safe the assume that if ground water was sufficient, more and more ground water should be exploited
for meeting the growing water demand. The relative constant level of water supply, therefore, indicated
the exploitation of the ground water was above the sustainable level and reached its maximum capacity.
The continuous drainage of ground water was a threat to the ecology system. In summary, in the years
between 2002 and 2007, the water supply was struggling to meet the growing water demand of Beijing
even with continuous drainage of the ground water.
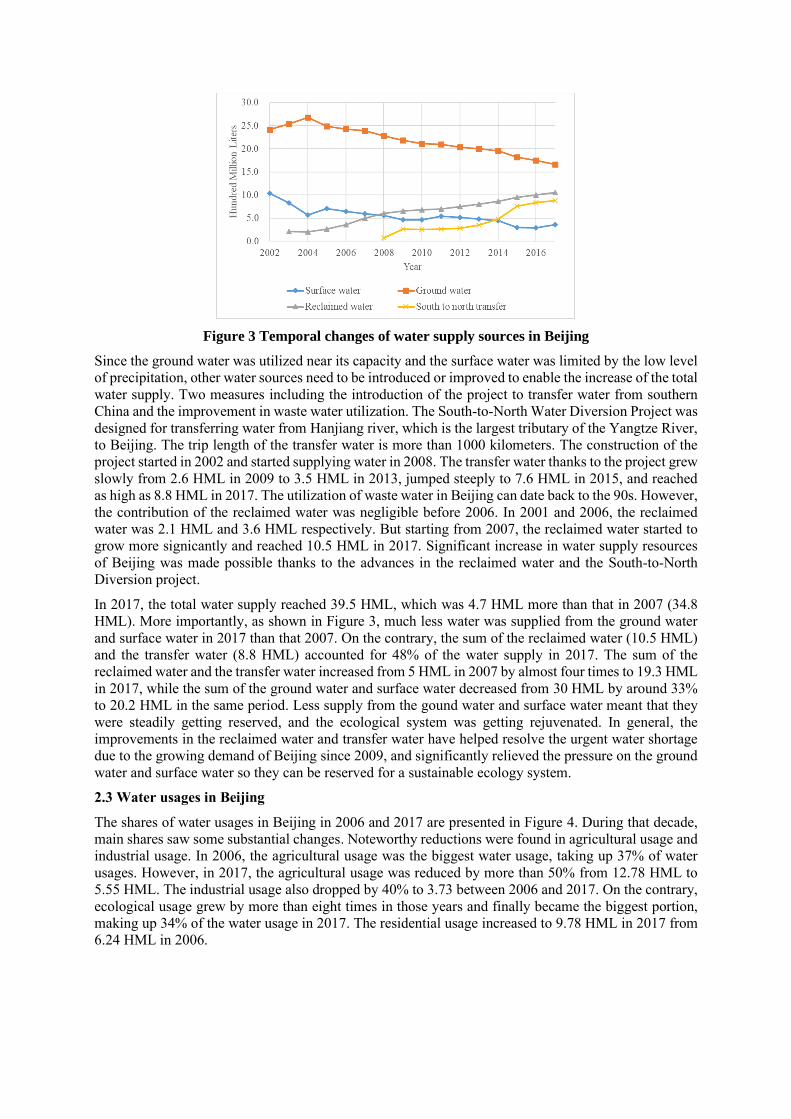
Figure 3 Temporal changes of water supply sources in Beijing
Since the ground water was utilized near its capacity and the surface water was limited by the low level
of precipitation, other water sources need to be introduced or improved to enable the increase of the total
water supply. Two measures including the introduction of the project to transfer water from southern
China and the improvement in waste water utilization. The South-to-North Water Diversion Project was
designed for transferring water from Hanjiang river, which is the largest tributary of the Yangtze River,
to Beijing. The trip length of the transfer water is more than 1000 kilometers. The construction of the
project started in 2002 and started supplying water in 2008. The transfer water thanks to the project grew
slowly from 2.6 HML in 2009 to 3.5 HML in 2013, jumped steeply to 7.6 HML in 2015, and reached
as high as 8.8 HML in 2017. The utilization of waste water in Beijing can date back to the 90s. However,
the contribution of the reclaimed water was negligible before 2006. In 2001 and 2006, the reclaimed
water was 2.1 HML and 3.6 HML respectively. But starting from 2007, the reclaimed water started to
grow more signicantly and reached 10.5 HML in 2017. Significant increase in water supply resources
of Beijing was made possible thanks to the advances in the reclaimed water and the South-to-North
Diversion project.
In 2017, the total water supply reached 39.5 HML, which was 4.7 HML more than that in 2007 (34.8
HML). More importantly, as shown in Figure 3, much less water was supplied from the ground water
and surface water in 2017 than that 2007. On the contrary, the sum of the reclaimed water (10.5 HML)
and the transfer water (8.8 HML) accounted for 48% of the water supply in 2017. The sum of the
reclaimed water and the transfer water increased from 5 HML in 2007 by almost four times to 19.3 HML
in 2017, while the sum of the ground water and surface water decreased from 30 HML by around 33%
to 20.2 HML in the same period. Less supply from the gound water and surface water meant that they
were steadily getting reserved, and the ecological system was getting rejuvenated. In general, the
improvements in the reclaimed water and transfer water have helped resolve the urgent water shortage
due to the growing demand of Beijing since 2009, and significantly relieved the pressure on the ground
water and surface water so they can be reserved for a sustainable ecology system.
2.3 Water usages in Beijing
The shares of water usages in Beijing in 2006 and 2017 are presented in Figure 4. During that decade,
main shares saw some substantial changes. Noteworthy reductions were found in agricultural usage and
industrial usage. In 2006, the agricultural usage was the biggest water usage, taking up 37% of water
usages. However, in 2017, the agricultural usage was reduced by more than 50% from 12.78 HML to
5.55 HML. The industrial usage also dropped by 40% to 3.73 between 2006 and 2017. On the contrary,
ecological usage grew by more than eight times in those years and finally became the biggest portion,
making up 34% of the water usage in 2017. The residential usage increased to 9.78 HML in 2017 from
6.24 HML in 2006.
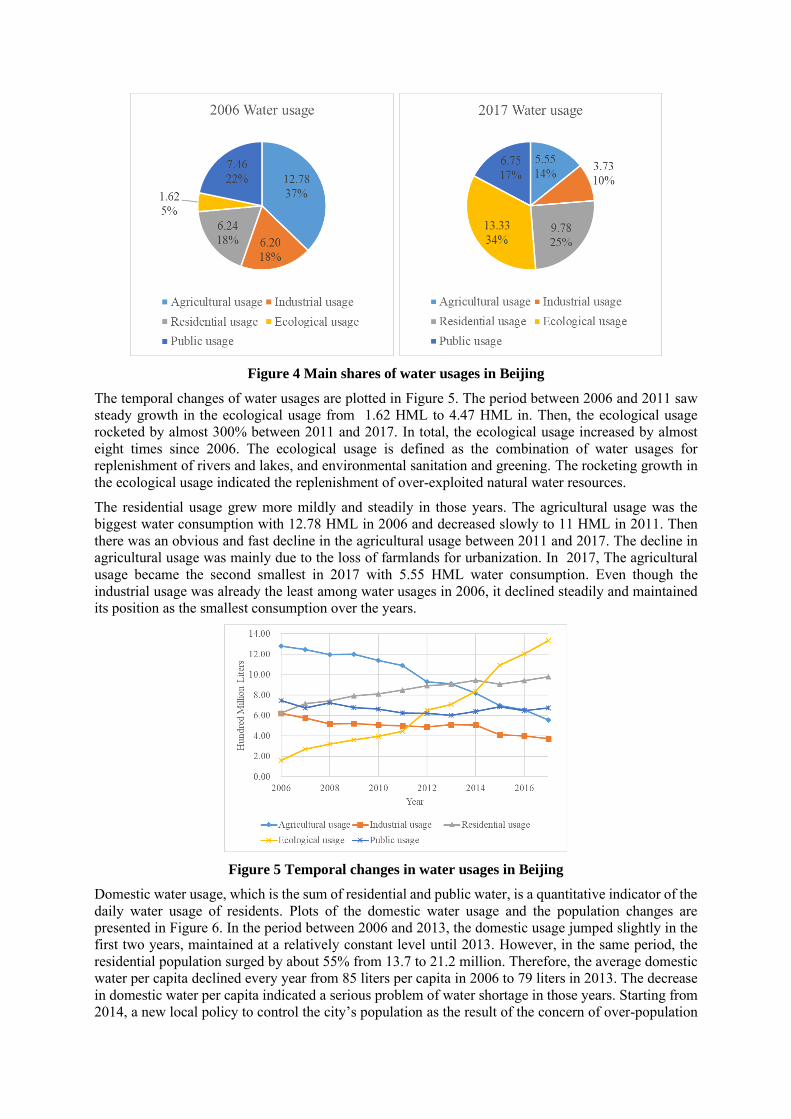
Figure 4 Main shares of water usages in Beijing
The temporal changes of water usages are plotted in Figure 5. The period between 2006 and 2011 saw
steady growth in the ecological usage from 1.62 HML to 4.47 HML in. Then, the ecological usage
rocketed by almost 300% between 2011 and 2017. In total, the ecological usage increased by almost
eight times since 2006. The ecological usage is defined as the combination of water usages for
replenishment of rivers and lakes, and environmental sanitation and greening. The rocketing growth in
the ecological usage indicated the replenishment of over-exploited natural water resources.
The residential usage grew more mildly and steadily in those years. The agricultural usage was the
biggest water consumption with 12.78 HML in 2006 and decreased slowly to 11 HML in 2011. Then
there was an obvious and fast decline in the agricultural usage between 2011 and 2017. The decline in
agricultural usage was mainly due to the loss of farmlands for urbanization. In 2017, The agricultural
usage became the second smallest in 2017 with 5.55 HML water consumption. Even though the
industrial usage was already the least among water usages in 2006, it declined steadily and maintained
its position as the smallest consumption over the years.
Figure 5 Temporal changes in water usages in Beijing
Domestic water usage, which is the sum of residential and public water, is a quantitative indicator of the
daily water usage of residents. Plots of the domestic water usage and the population changes are
presented in Figure 6. In the period between 2006 and 2013, the domestic usage jumped slightly in the
first two years, maintained at a relatively constant level until 2013. However, in the same period, the
residential population surged by about 55% from 13.7 to 21.2 million. Therefore, the average domestic
water per capita declined every year from 85 liters per capita in 2006 to 79 liters in 2013. The decrease
in domestic water per capita indicated a serious problem of water shortage in those years. Starting from
2014, a new local policy to control the city’s population as the result of the concern of over-population
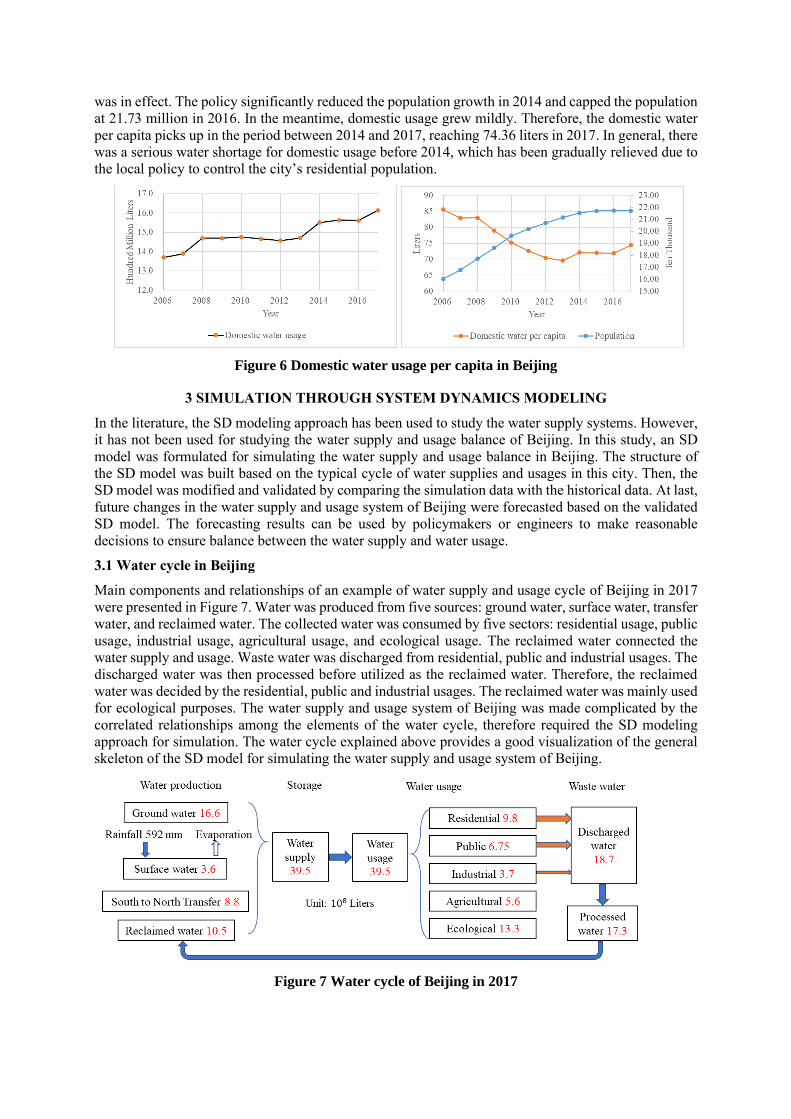
was in effect. The policy significantly reduced the population growth in 2014 and capped the population
at 21.73 million in 2016. In the meantime, domestic usage grew mildly. Therefore, the domestic water
per capita picks up in the period between 2014 and 2017, reaching 74.36 liters in 2017. In general, there
was a serious water shortage for domestic usage before 2014, which has been gradually relieved due to
the local policy to control the city’s residential population.
Figure 6 Domestic water usage per capita in Beijing
3 SIMULATION THROUGH SYSTEM DYNAMICS MODELING
In the literature, the SD modeling approach has been used to study the water supply systems. However,
it has not been used for studying the water supply and usage balance of Beijing. In this study, an SD
model was formulated for simulating the water supply and usage balance in Beijing. The structure of
the SD model was built based on the typical cycle of water supplies and usages in this city. Then, the
SD model was modified and validated by comparing the simulation data with the historical data. At last,
future changes in the water supply and usage system of Beijing were forecasted based on the validated
SD model. The forecasting results can be used by policymakers or engineers to make reasonable
decisions to ensure balance between the water supply and water usage.
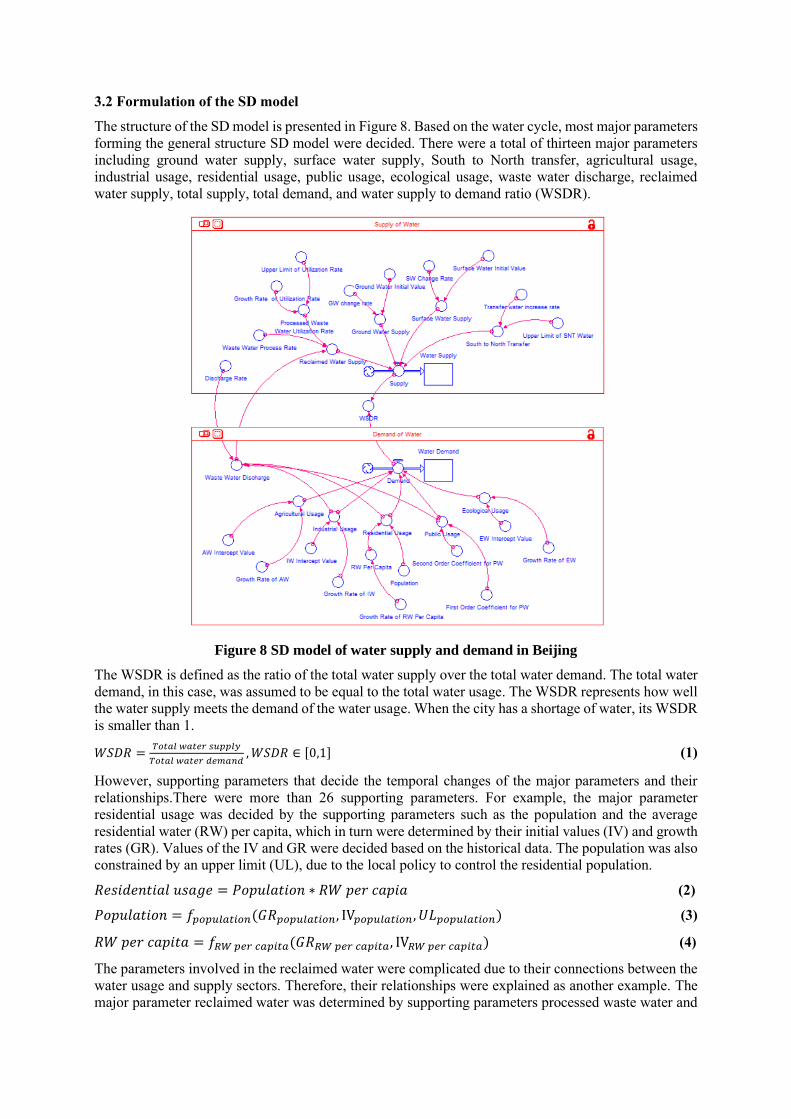
3.1 Water cycle in Beijing
Main components and relationships of an example of water supply and usage cycle of Beijing in 2017
were presented in Figure 7. Water was produced from five sources: ground water, surface water, transfer
water, and reclaimed water. The collected water was consumed by five sectors: residential usage, public
usage, industrial usage, agricultural usage, and ecological usage. The reclaimed water connected the
water supply and usage. Waste water was discharged from residential, public and industrial usages. The
discharged water was then processed before utilized as the reclaimed water. Therefore, the reclaimed
water was decided by the residential, public and industrial usages. The reclaimed water was mainly used
for ecological purposes. The water supply and usage system of Beijing was made complicated by the
correlated relationships among the elements of the water cycle, therefore required the SD modeling
approach for simulation. The water cycle explained above provides a good visualization of the general
skeleton of the SD model for simulating the water supply and usage system of Beijing.
Figure 7 Water cycle of Beijing in 2017
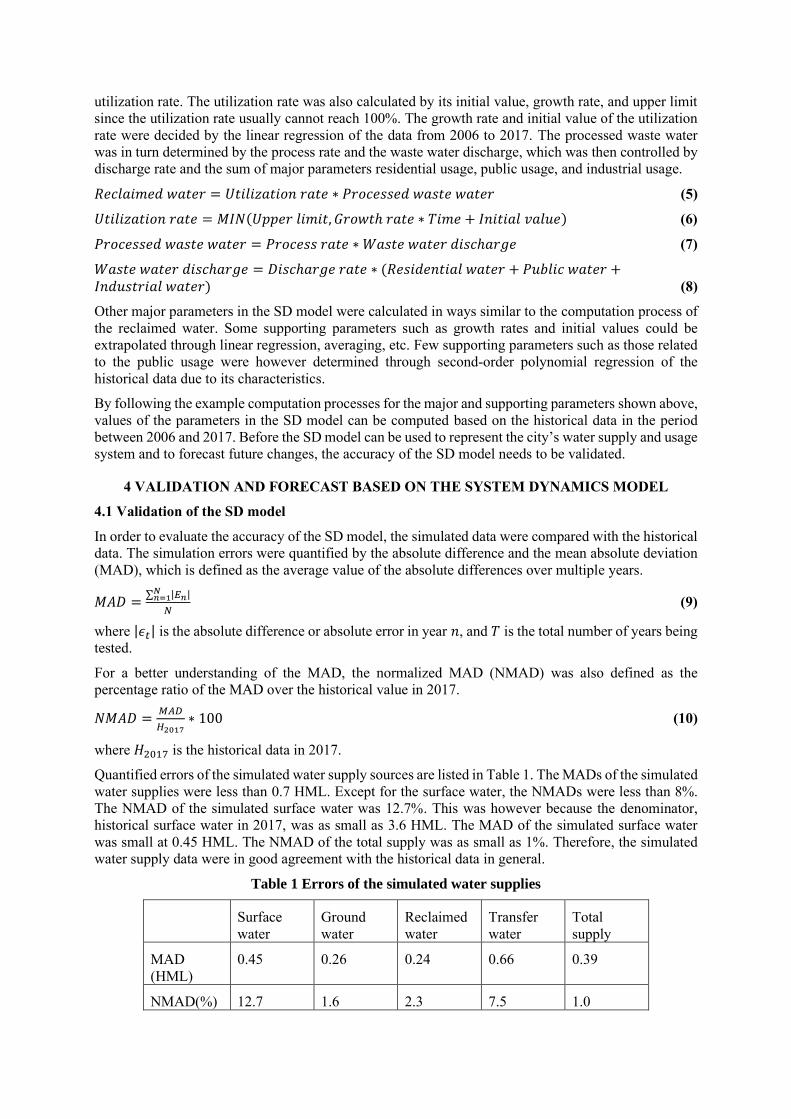
3.2 Formulation of the SD model
The structure of the SD model is presented in Figure 8. Based on the water cycle, most major parameters
forming the general structure SD model were decided. There were a total of thirteen major parameters
including ground water supply, surface water supply, South to North transfer, agricultural usage,
industrial usage, residential usage, public usage, ecological usage, waste water discharge, reclaimed
water supply, total supply, total demand, and water supply to demand ratio (WSDR).
Figure 8 SD model of water supply and demand in Beijing
The WSDR is defined as the ratio of the total water supply over the total water demand. The total water
demand, in this case, was assumed to be equal to the total water usage. The WSDR represents how well
the water supply meets the demand of the water usage. When the city has a shortage of water, its WSDR
is smaller than 1.
𝑊𝑆𝐷𝑅 =𝑇𝑜𝑡𝑎𝑙 𝑤𝑎𝑡𝑒𝑟 𝑠𝑢𝑝𝑝𝑙𝑦
𝑇𝑜𝑡𝑎𝑙 𝑤𝑎𝑡𝑒𝑟 𝑑𝑒𝑚𝑎𝑛𝑑, 𝑊𝑆𝐷𝑅 ∈ [0,1] (1)
However, supporting parameters that decide the temporal changes of the major parameters and their
relationships.There were more than 26 supporting parameters. For example, the major parameter
residential usage was decided by the supporting parameters such as the population and the average
residential water (RW) per capita, which in turn were determined by their initial values (IV) and growth
rates (GR). Values of the IV and GR were decided based on the historical data. The population was also
constrained by an upper limit (UL), due to the local policy to control the residential population.
𝑅𝑒𝑠𝑖𝑑𝑒𝑛𝑡𝑖𝑎𝑙 𝑢𝑠𝑎𝑔𝑒 = 𝑃𝑜𝑝𝑢𝑙𝑎𝑡𝑖𝑜𝑛 ∗ 𝑅𝑊 𝑝𝑒𝑟 𝑐𝑎𝑝𝑖𝑎 (2)
𝑃𝑜𝑝𝑢𝑙𝑎𝑡𝑖𝑜𝑛 = 𝑓𝑝𝑜𝑝𝑢𝑙𝑎𝑡𝑖𝑜𝑛(𝐺𝑅𝑝𝑜𝑝𝑢𝑙𝑎𝑡𝑖𝑜𝑛, IV𝑝𝑜𝑝𝑢𝑙𝑎𝑡𝑖𝑜𝑛, 𝑈𝐿𝑝𝑜𝑝𝑢𝑙𝑎𝑡𝑖𝑜𝑛) (3)
𝑅𝑊 𝑝𝑒𝑟 𝑐𝑎𝑝𝑖𝑡𝑎 = 𝑓𝑅𝑊 𝑝𝑒𝑟 𝑐𝑎𝑝𝑖𝑡𝑎(𝐺𝑅𝑅𝑊 𝑝𝑒𝑟 𝑐𝑎𝑝𝑖𝑡𝑎, IV𝑅𝑊 𝑝𝑒𝑟 𝑐𝑎𝑝𝑖𝑡𝑎) (4)
The parameters involved in the reclaimed water were complicated due to their connections between the
water usage and supply sectors. Therefore, their relationships were explained as another example. The
major parameter reclaimed water was determined by supporting parameters processed waste water and
utilization rate. The utilization rate was also calculated by its initial value, growth rate, and upper limit
since the utilization rate usually cannot reach 100%. The growth rate and initial value of the utilization
rate were decided by the linear regression of the data from 2006 to 2017. The processed waste water
was in turn determined by the process rate and the waste water discharge, which was then controlled by
discharge rate and the sum of major parameters residential usage, public usage, and industrial usage.
𝑅𝑒𝑐𝑙𝑎𝑖𝑚𝑒𝑑 𝑤𝑎𝑡𝑒𝑟 = 𝑈𝑡𝑖𝑙𝑖𝑧𝑎𝑡𝑖𝑜𝑛 𝑟𝑎𝑡𝑒 ∗ 𝑃𝑟𝑜𝑐𝑒𝑠𝑠𝑒𝑑 𝑤𝑎𝑠𝑡𝑒 𝑤𝑎𝑡𝑒𝑟 (5)
𝑈𝑡𝑖𝑙𝑖𝑧𝑎𝑡𝑖𝑜𝑛 𝑟𝑎𝑡𝑒 = 𝑀𝐼𝑁(𝑈𝑝𝑝𝑒𝑟 𝑙𝑖𝑚𝑖𝑡, 𝐺𝑟𝑜𝑤𝑡ℎ 𝑟𝑎𝑡𝑒 ∗ 𝑇𝑖𝑚𝑒 + 𝐼𝑛𝑖𝑡𝑖𝑎𝑙 𝑣𝑎𝑙𝑢𝑒) (6)
𝑃𝑟𝑜𝑐𝑒𝑠𝑠𝑒𝑑 𝑤𝑎𝑠𝑡𝑒 𝑤𝑎𝑡𝑒𝑟 = 𝑃𝑟𝑜𝑐𝑒𝑠𝑠 𝑟𝑎𝑡𝑒 ∗ 𝑊𝑎𝑠𝑡𝑒 𝑤𝑎𝑡𝑒𝑟 𝑑𝑖𝑠𝑐ℎ𝑎𝑟𝑔𝑒 (7)
𝑊𝑎𝑠𝑡𝑒 𝑤𝑎𝑡𝑒𝑟 𝑑𝑖𝑠𝑐ℎ𝑎𝑟𝑔𝑒 = 𝐷𝑖𝑠𝑐ℎ𝑎𝑟𝑔𝑒 𝑟𝑎𝑡𝑒 ∗ (𝑅𝑒𝑠𝑖𝑑𝑒𝑛𝑡𝑖𝑎𝑙 𝑤𝑎𝑡𝑒𝑟 + 𝑃𝑢𝑏𝑙𝑖𝑐 𝑤𝑎𝑡𝑒𝑟 +𝐼𝑛𝑑𝑢𝑠𝑡𝑟𝑖𝑎𝑙 𝑤𝑎𝑡𝑒𝑟) (8)
Other major parameters in the SD model were calculated in ways similar to the computation process of
the reclaimed water. Some supporting parameters such as growth rates and initial values could be
extrapolated through linear regression, averaging, etc. Few supporting parameters such as those related
to the public usage were however determined through second-order polynomial regression of the
historical data due to its characteristics.
By following the example computation processes for the major and supporting parameters shown above,
values of the parameters in the SD model can be computed based on the historical data in the period
between 2006 and 2017. Before the SD model can be used to represent the city’s water supply and usage
system and to forecast future changes, the accuracy of the SD model needs to be validated.
4 VALIDATION AND FORECAST BASED ON THE SYSTEM DYNAMICS MODEL
4.1 Validation of the SD model
In order to evaluate the accuracy of the SD model, the simulated data were compared with the historical
data. The simulation errors were quantified by the absolute difference and the mean absolute deviation
(MAD), which is defined as the average value of the absolute differences over multiple years.
𝑀𝐴𝐷 =∑ |𝐸𝑛|𝑁
𝑛=1
𝑁 (9)
where |𝜖𝑡| is the absolute difference or absolute error in year 𝑛, and 𝑇 is the total number of years being
tested.
For a better understanding of the MAD, the normalized MAD (NMAD) was also defined as the
percentage ratio of the MAD over the historical value in 2017.
𝑁𝑀𝐴𝐷 =𝑀𝐴𝐷
𝐻2017∗ 100 (10)
where 𝐻2017 is the historical data in 2017.
Quantified errors of the simulated water supply sources are listed in Table 1. The MADs of the simulated
water supplies were less than 0.7 HML. Except for the surface water, the NMADs were less than 8%.
The NMAD of the simulated surface water was 12.7%. This was however because the denominator,
historical surface water in 2017, was as small as 3.6 HML. The MAD of the simulated surface water
was small at 0.45 HML. The NMAD of the total supply was as small as 1%. Therefore, the simulated
water supply data were in good agreement with the historical data in general.
Table 1 Errors of the simulated water supplies
Surface
water
Ground
water
Reclaimed
water
Transfer
water
Total
supply
MAD
(HML)
0.45 0.26 0.24 0.66 0.39
NMAD(%) 12.7 1.6 2.3 7.5 1.0
Errors of the simulated water usages are listed in Table 2. The NMADs of the simulated water usages
were less than 7%. The MADs of the simulated water usages except the ecological usage were smaller
than 0.4 HML. The MAD for the simulated ecological usage was 0.81 HML, but the error was acceptable
since the denominator (the historical ecological usage in 2017) was large, resulting in small NMAD
(6.6%). The MAD and NMADof the simulated total usage were 0.41 HML and 1.1% respectively.
Therefore, the simulated errors of the water usage parameters were small as well. Overall, the accuracies
of the major parameters in the SD model were validated.
Table 2 Errors of the simulated water usages
Agricultura
l usage
Industrial
usage
Residential
usage
Ecological
usage
Public
usage
Total usage
MAD
(HML)
0.36 0.21 0.19 0.81 0.20 0.41
NMAD (%) 6.1 5.4 2.0 6.6 2.9 1.1
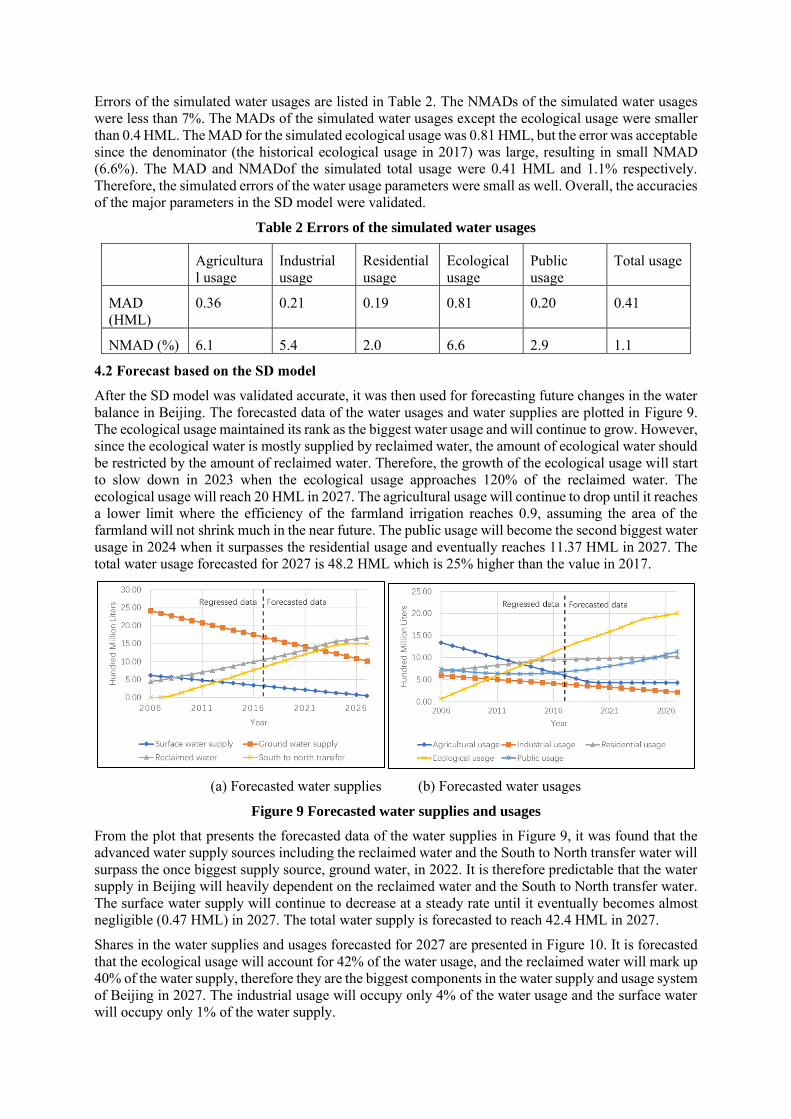
4.2 Forecast based on the SD model
After the SD model was validated accurate, it was then used for forecasting future changes in the water
balance in Beijing. The forecasted data of the water usages and water supplies are plotted in Figure 9.
The ecological usage maintained its rank as the biggest water usage and will continue to grow. However,
since the ecological water is mostly supplied by reclaimed water, the amount of ecological water should
be restricted by the amount of reclaimed water. Therefore, the growth of the ecological usage will start
to slow down in 2023 when the ecological usage approaches 120% of the reclaimed water. The
ecological usage will reach 20 HML in 2027. The agricultural usage will continue to drop until it reaches
a lower limit where the efficiency of the farmland irrigation reaches 0.9, assuming the area of the
farmland will not shrink much in the near future. The public usage will become the second biggest water
usage in 2024 when it surpasses the residential usage and eventually reaches 11.37 HML in 2027. The
total water usage forecasted for 2027 is 48.2 HML which is 25% higher than the value in 2017.
(a) Forecasted water supplies (b) Forecasted water usages
Figure 9 Forecasted water supplies and usages
From the plot that presents the forecasted data of the water supplies in Figure 9, it was found that the
advanced water supply sources including the reclaimed water and the South to North transfer water will
surpass the once biggest supply source, ground water, in 2022. It is therefore predictable that the water
supply in Beijing will heavily dependent on the reclaimed water and the South to North transfer water.
The surface water supply will continue to decrease at a steady rate until it eventually becomes almost
negligible (0.47 HML) in 2027. The total water supply is forecasted to reach 42.4 HML in 2027.
Shares in the water supplies and usages forecasted for 2027 are presented in Figure 10. It is forecasted
that the ecological usage will account for 42% of the water usage, and the reclaimed water will mark up
40% of the water supply, therefore they are the biggest components in the water supply and usage system
of Beijing in 2027. The industrial usage will occupy only 4% of the water usage and the surface water
will occupy only 1% of the water supply.
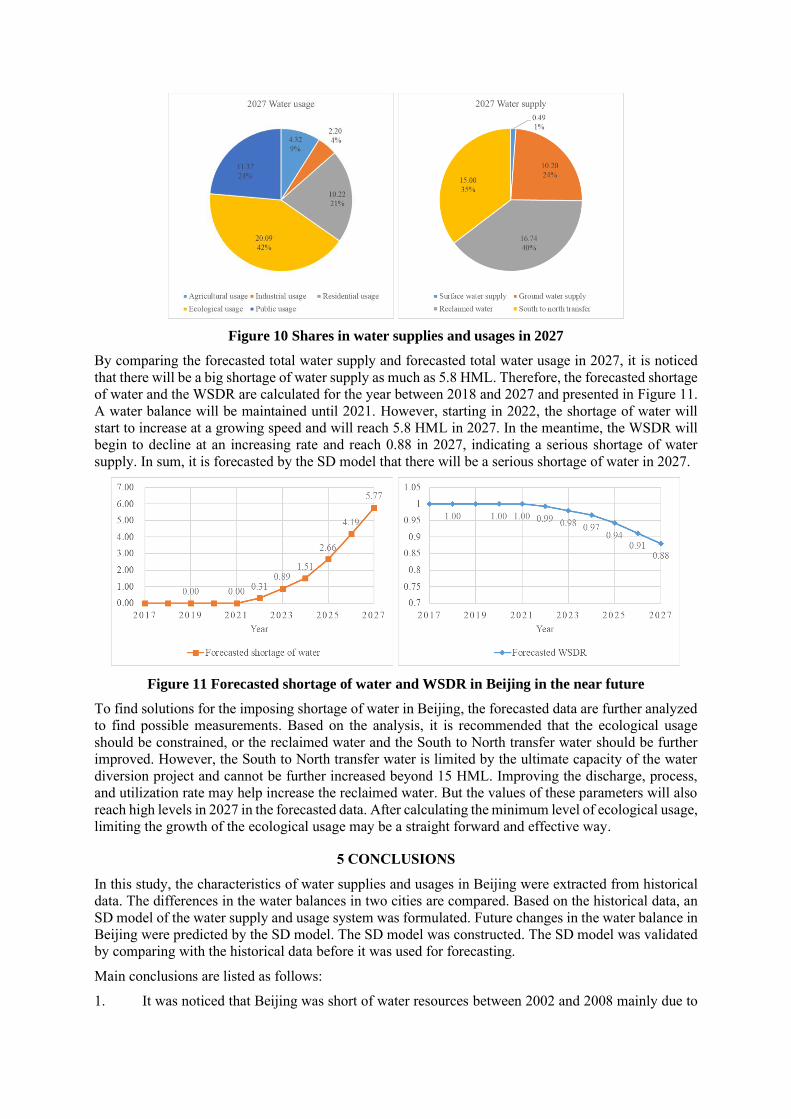
Figure 10 Shares in water supplies and usages in 2027
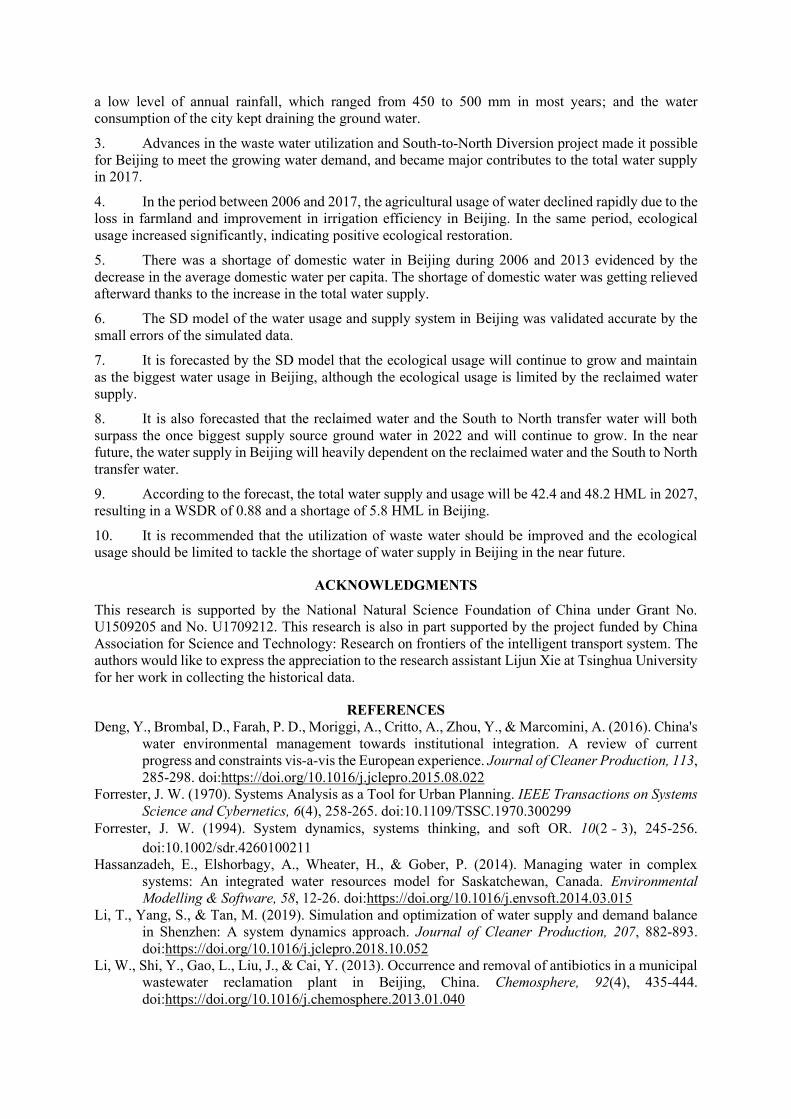
By comparing the forecasted total water supply and forecasted total water usage in 2027, it is noticed
that there will be a big shortage of water supply as much as 5.8 HML. Therefore, the forecasted shortage
of water and the WSDR are calculated for the year between 2018 and 2027 and presented in Figure 11.
A water balance will be maintained until 2021. However, starting in 2022, the shortage of water will
start to increase at a growing speed and will reach 5.8 HML in 2027. In the meantime, the WSDR will
begin to decline at an increasing rate and reach 0.88 in 2027, indicating a serious shortage of water
supply. In sum, it is forecasted by the SD model that there will be a serious shortage of water in 2027.
Figure 11 Forecasted shortage of water and WSDR in Beijing in the near future
To find solutions for the imposing shortage of water in Beijing, the forecasted data are further analyzed
to find possible measurements. Based on the analysis, it is recommended that the ecological usage
should be constrained, or the reclaimed water and the South to North transfer water should be further
improved. However, the South to North transfer water is limited by the ultimate capacity of the water
diversion project and cannot be further increased beyond 15 HML. Improving the discharge, process,
and utilization rate may help increase the reclaimed water. But the values of these parameters will also
reach high levels in 2027 in the forecasted data. After calculating the minimum level of ecological usage,
limiting the growth of the ecological usage may be a straight forward and effective way.
5 CONCLUSIONS
In this study, the characteristics of water supplies and usages in Beijing were extracted from historical
data. The differences in the water balances in two cities are compared. Based on the historical data, an
SD model of the water supply and usage system was formulated. Future changes in the water balance in
Beijing were predicted by the SD model. The SD model was constructed. The SD model was validated
by comparing with the historical data before it was used for forecasting.
Main conclusions are listed as follows:
1. It was noticed that Beijing was short of water resources between 2002 and 2008 mainly due to
a low level of annual rainfall, which ranged from 450 to 500 mm in most years; and the water
consumption of the city kept draining the ground water.
3. Advances in the waste water utilization and South-to-North Diversion project made it possible
for Beijing to meet the growing water demand, and became major contributes to the total water supply
in 2017.
4. In the period between 2006 and 2017, the agricultural usage of water declined rapidly due to the
loss in farmland and improvement in irrigation efficiency in Beijing. In the same period, ecological
usage increased significantly, indicating positive ecological restoration.
5. There was a shortage of domestic water in Beijing during 2006 and 2013 evidenced by the
decrease in the average domestic water per capita. The shortage of domestic water was getting relieved
afterward thanks to the increase in the total water supply.
6. The SD model of the water usage and supply system in Beijing was validated accurate by the
small errors of the simulated data.
7. It is forecasted by the SD model that the ecological usage will continue to grow and maintain
as the biggest water usage in Beijing, although the ecological usage is limited by the reclaimed water
supply.
8. It is also forecasted that the reclaimed water and the South to North transfer water will both
surpass the once biggest supply source ground water in 2022 and will continue to grow. In the near
future, the water supply in Beijing will heavily dependent on the reclaimed water and the South to North
transfer water.
9. According to the forecast, the total water supply and usage will be 42.4 and 48.2 HML in 2027,
resulting in a WSDR of 0.88 and a shortage of 5.8 HML in Beijing.
10. It is recommended that the utilization of waste water should be improved and the ecological
usage should be limited to tackle the shortage of water supply in Beijing in the near future.
ACKNOWLEDGMENTS
This research is supported by the National Natural Science Foundation of China under Grant No.
U1509205 and No. U1709212. This research is also in part supported by the project funded by China
Association for Science and Technology: Research on frontiers of the intelligent transport system. The
authors would like to express the appreciation to the research assistant Lijun Xie at Tsinghua University
for her work in collecting the historical data.
REFERENCES
Deng, Y., Brombal, D., Farah, P. D., Moriggi, A., Critto, A., Zhou, Y., & Marcomini, A. (2016). China's
water environmental management towards institutional integration. A review of current
progress and constraints vis-a-vis the European experience. Journal of Cleaner Production, 113,
285-298. doi:https://doi.org/10.1016/j.jclepro.2015.08.022
Forrester, J. W. (1970). Systems Analysis as a Tool for Urban Planning. IEEE Transactions on Systems
Science and Cybernetics, 6(4), 258-265. doi:10.1109/TSSC.1970.300299
Forrester, J. W. (1994). System dynamics, systems thinking, and soft OR. 10(2 ‐ 3), 245-256.
doi:10.1002/sdr.4260100211
Hassanzadeh, E., Elshorbagy, A., Wheater, H., & Gober, P. (2014). Managing water in complex
systems: An integrated water resources model for Saskatchewan, Canada. Environmental
Modelling & Software, 58, 12-26. doi:https://doi.org/10.1016/j.envsoft.2014.03.015
Li, T., Yang, S., & Tan, M. (2019). Simulation and optimization of water supply and demand balance
in Shenzhen: A system dynamics approach. Journal of Cleaner Production, 207, 882-893.
doi:https://doi.org/10.1016/j.jclepro.2018.10.052
Li, W., Shi, Y., Gao, L., Liu, J., & Cai, Y. (2013). Occurrence and removal of antibiotics in a municipal
wastewater reclamation plant in Beijing, China. Chemosphere, 92(4), 435-444.
doi:https://doi.org/10.1016/j.chemosphere.2013.01.040
Li, Y., Xiong, W., Zhang, W., Wang, C., & Wang, P. (2016). Life cycle assessment of water supply
alternatives in water-receiving areas of the South-to-North Water Diversion Project in China.
Water Research, 89, 9-19. doi:https://doi.org/10.1016/j.watres.2015.11.030
Sun, Q., Deng, S., Huang, J., Shen, G., & Yu, G. (2008). Contributors to estrogenic activity in
wastewater from a large wastewater treatment plant in Beijing, China. Environmental
Toxicology and Pharmacology, 25(1), 20-26. doi:https://doi.org/10.1016/j.etap.2007.08.003
Wang, Y., Qiao, M., Liu, Y., & Zhu, Y. (2012). Health risk assessment of heavy metals in soils and
vegetables from wastewater irrigated area, Beijing-Tianjin city cluster, China. Journal of
Environmental Sciences, 24(4), 690-698. doi:https://doi.org/10.1016/S1001-0742(11)60833-4
Wei, D. (2005). Beijing water resources and the south to north water diversion project. Canadian
Journal of Civil Engineering, 32(1), 159-163. doi:10.1139/l04-113
Wei, S., & Gnauck, A. (2007, 2007//). Water Supply and Water Demand of Beijing — A Game Theoretic
Approach for Modeling. Paper presented at the Information Technologies in Environmental
Engineering, Berlin, Heidelberg.
Wei, T., Lou, I., Yang, Z., & Li, Y. (2016). A system dynamics urban water management model for
Macau, China. Journal of Environmental Sciences, 50, 117-126.
doi:https://doi.org/10.1016/j.jes.2016.06.034
Winz, I., Brierley, G., & Trowsdale, S. (2009). The Use of System Dynamics Simulation in Water
Resources Management. Water Resources Management, 23(7), 1301-1323.
doi:10.1007/s11269-008-9328-7
Zhang, Q. (2009). The South-to-North Water Transfer Project of China: Environmental Implications
and Monitoring Strategy1. 45(5), 1238-1247. doi:10.1111/j.1752-1688.2009.00357.x
Zhu, Y. P., Zhang, H. P., Chen, L., & Zhao, J. F. (2008). Influence of the South–North Water Diversion
Project and the mitigation projects on the water quality of Han River. Science of The Total
Environment, 406(1), 57-68. doi:https://doi.org/10.1016/j.scitotenv.2008.08.008
BIOGRAPHY
Longxi Luo, PhD and Postdoctoral Research Fellow in the School of Civil Engineering at Tsinghua
University, China. Main research interests include: Data Processing/Mining; Modeling and Simulations;
Remote sensing; Smart city; Intelligent Transportation. He is supported by the Tsinghua University
postdoctoral support program type A for young outstanding researchers graduated from top international
universities.
Jianping Wu, PhD and Professor in the School of Civil Engineering at Tsinghua University, China,
Director of Tsinghua - Cambridge - MIT Center for Future Transport Research, China Ministry of
Education the "Cheung Kong Scholar" Distinguished Professor. Main research interests: i) Smart city
and smart transport, ii) Traffic modeling and simulation, and iii) Sustainable transport system. He has
been the main investigator for over 50 research projects and authored and co-authored over 300 papers
in international journals and conferences.