Embed Size (px)
Citation preview
Analysis of Water Transport inside a Plant Xylem Vessel with Pitted Thickening
Tianyu Xu and Lixiang Zhang*
Faculty of Civil Engineering and Mechanics, Kunming University of Science and Technology, Kunming, 650500, China*Corresponding Author: Lixiang Zhang. Email: [email protected]
Received: 09 January 2020; Accepted: 24 March 2020
Abstract: In this article, computational fluid dynamics (CFD) are used to explorethe dynamics of water transport inside the pitted thickening of a plant xylem ves-sel. A pitted thickening model combined with the Bernoulli equation is used toanalyze the influence of various factors (namely, the inner diameter, thickeningwidth, thickening height, thickening spacing, number of laps and adjacent pitaxial rotation). The pressure drop and the flow resistance coefficient are the vari-able parameters for our analysis. The results show that these two parameters areproportional to the thickening height and thickening width, and inversely propor-tional to the inner diameter, thickening spacing and number of laps. Three differ-ent wall thickening structures of the vessel are compared and the pitted thickeningvessel is shown to provide the largest structural flow resistance, the annular thick-ening vessel has the second largest resistance and the helical thickening vesselcorresponds to the smallest resistance of the three structures.
Keywords: Pitted thickening; water transport; Bernoulli equation; pressure drop;flow resistance coefficient
1 Introduction
Water plays an important role in the physiological ecology of plants and can directly or indirectly affectvarious physiological activities during plant growth and development. The mechanism of water transport hasalways been an active research area [1]. The xylem is the main water transport channel that connects the rootsystem and the canopy. Water passes from the roots to the leaves through the xylem, using the vessels andtracheids distributed throughout the xylem as the transport channels [2,3]. The length of the vessels vary buttheir inner diameter is generally in the micron scale, which makes it difficult to calculate the water transfercapabilities of each vessel [4,5]. Currently, experimental observation is the main method used [6,7].
To address the deficiencies of experimental observation, some scholars have explored the flowcharacteristics of a xylem vessel by constructing a xylem vessel model and using the ComputationalFluid Dynamics (CFD) method [8]. Roth [9] has established a two-dimensional simplified model of avessel which analyzed the flow characteristics of the ring thickenings and concluded that water flowcharacteristics are related to the two closest adjacent thickenings. Schulte [10] has analyzed the waterflow characteristics of a 20-hole perforated plate of xylem tube using experiments and simulations. Theexperimental results showed that the water flow resistance of the perforated plate accounted for 21% ofthe total water transport resistance and the simulated value was 23%. Ai [11] has simulated the pressure
This work is licensed under a Creative Commons Attribution 4.0 International License, whichpermits unrestricted use, distribution, and reproduction in any medium, provided the originalwork is properly cited.
Fluid Dynamics & Materials ProcessingDOI:10.32604/fdmp.2020.09618
Article
echT PressScience

distribution and velocity distribution of the ladder-shaped perforated plate based on the k-ε model anddiscovered that the number of holes in the perforated plate is proportional to the total pressure drop. Mostof the previous study models are based on analysis of ring thickenings and the perforated plate. Differentthickening types appear in an ontogenetic sequence with annular thickening occurring first, followed inorder by helical and pitted thickening [12,13], which have different water transport characteristics [14–16]. The influence of pitted thickening on water transport has not been previously studied [17,18].Therefore, this paper investigates the influence of a pitted thickening vessel on water transport andanalyzes the relationship between the resistance for the same parameters with annular or helicalthickening [19–22].
In this paper, a pitted thickening structured distribution model is proposed that simulates the effect ofxylem vessel thickening on water transport. Combined with Bernoulli’s equation, the influence of factorssuch as the inner diameter, thickening width, thickening height, thickening spacing, number of laps andadjacent pit axial rotation of pitted thickening on the micro-flow inside the vessel were analyzed byvarying the flow resistance coefficient to evaluate the effect of xylem vessel thickening on water transportin the vessels during the process of plant growth.
2 Pitted Thickening Vessel Model
2.1 Pitted Thickening ModelThe type of secondary wall thickening can be determined by the dimension (diameter) of the vessel and
the maturity and growth stage of the plant (ontogeny). Pitted thickening is the most complicated type ofthickening of the three possible structures (Fig. 1). The literature contains many descriptions of secondarywall patterns which analyze water transport characteristics of vessels with pitted thickening, but do notprovide an exact model. The problem of water transport in a pitted thickening vessel is described in thenext section and a possible explanation for the observed behavior is provided.
2.2 Different Secondary Wall Thickening Patterns of a Pitted Thickening Model for Different Vessel TypesSeveral 3D models of plant xylem vessels have been established in the literature [11,15,16] were
established to compare the water transport characteristics of different pitted thickening patterns of thexylem, as shown in Fig. 2. Since pitted thickening can have different parameters in different vessels, amodel of each vessel is required for analysis. The models contain a flow region with wall thickeningpatterns of length 150 μm. To avoid effects at the entrance and exit, an extended smooth segment withlength 20 μm is added at both ends of the vessel. In Fig. 3, d is the inner diameter, h is the pitted
Figure 1: Different secondary wall thickening patterns. (a) Annular thickening; (b) Helical thickening;(c) Pitted thickening
526 FDMP, 2020, vol.16, no.3

thickening height, w is the pitted thickening width, s is the pitted thickening spacing, n is the number of lapsand θ is the adjacent pit axial rotation.
2.3 Governing EquationsThe steady-state conservation equations for mass and momentum in fluid are given as follows [23,24]:
Continuity equation:
@u
@xþ @v
@yþ @w
@z¼ 0 (1)
Momentum equation:
q u@u
@xþ v
@u
@yþ w
@u
@z
� �¼ � @P
@xþ l
@2u
@x2þ @2u
@y2þ @2u
@z2
� �
q u@v
@xþ v
@v
@yþ w
@v
@z
� �¼ � @P
@yþ l
@2v
@x2þ @2v
@y2þ @2v
@z2
� �
q u@w
@xþ v
@w
@yþ w
@w
@z
� �¼ � @P
@zþ l
@2w
@x2þ @2w
@y2þ @2w
@z2
� �
8>>>>>>><>>>>>>>:
(2)
where, u, v and w are the components of the velocity vector along the x, y and z-directions, respectively, ρ isthe fluid density, P is the fluid pressure and µ is the dynamic viscosity.
2.4 Bernoulli Equation ModelFig. 4 provides a schematic cross-sectional view showing the distribution of the pitted thickening model
along the inner wall, with the arrow representing the direction of water movement. For the mathematicalmodel, there were several assumptions used for a more reasonable and simpler analysis:
1. The flow is steady and laminar.
2. The fluid is incompressible, Newtonian and viscous.
3. There is a non-slip velocity.
Figure 2: 3D model of pitted thickening
Figure 3: Different parameters of pitted thickening patterns
FDMP, 2020, vol.16, no.3 527

The energy conservation law of liquid flow (the Bernoulli equation) can be used on the model to analyzethe fluid flow in the pitted thickening vessel. It is assumed that the flow between arbitrary sections satisfiesthe Bernoulli equation, which can be written for each section Z1, Z2, Zn from the inlet to the exit as:
P1
qgþ V 2
1
2gþ z1 ¼ P2
qgþ V 2
2
2gþ z2 þ n1
V 22
2gþ �
l1V 22
2DgP2
qgþ V 2
2
2gþ z1 ¼ P3
qgþ V 2
3
2gþ z3 þ n2
v232g
þ �l2V 2
3
2Dg� � � � ��� � � � ��
Pn�1
qgþ V 2
n�1
2gþ zn�1 ¼ Pn
qgþ V 2
n
2gþ zn þ nn�1
V 2n
2gþ �
ln�1V 2n
2Dg
(3)
where Pn and Vn are the average pressure and the flow velocity in section n, ρ is the fluid density, g is theacceleration due to gravity, Zn is the elevation head in the section, ξn−1 is the local loss coefficientbetween section n-1 to section n, λ is friction factor of the head loss and ln−1 is the length between twoadjacent sections.
The two sides of the equations in Eq. (3) can be summed in order to obtain:
P1 � Pn
qg¼ zn � z1 þ n1
V 22
2gþ n2
V 23
2gþ � � � þ nn�1
V 2n
2gþ �
ðzn � z1ÞV 2n
2Dg(4)
It is known by the continuity equation that:
V1A1 ¼ V2A2 ¼ V3A3 ¼ � � � ¼ VnAn (5)
In Eq. (5), Ai (i = 1, 2…, n) is the flow area of the corresponding section. Substituting Eq. (5) into Eq. (4)gives:
DP
qg¼ Lþ �
A1
An
� �2 L
DþXn�1
i¼1
niA1
Aiþ1
� �2" #
V12
2g(6)
where:
n ¼ �A1
An
� �2 L
DþXn�1
i¼1
niA1
Aiþ1
� �2
(7)
Eq. (6) can be simplified to:
Figure 4: Schematic of water flow in a pitted thickening vessel
528 FDMP, 2020, vol.16, no.3

DP
qg¼ Lþ n
V 21
2g(8)
which can be expressed as:
n ¼ 2
V 21
DP
q� Lg
� �(9a)
which can be expressed in terms of the flow rate:
n ¼ p2D4
8Q2
DP
q� Lg
� �(9b)
In Eqs. (9a) and (9b), ξ is the flow resistance coefficient, L = zn-z1 is the vessel length (the verticalheight) and Q is the average flow rate in the vessel. Obviously, ξ reflects the influence of the pittedthickening inside the vessel and its geometrical characteristics on the flow. A larger value of ξ indicates alarger vessel resistance, and a smaller ξ value indicates a smaller vessel resistance. Eqs. (9a) and (9b)represent the physical and mechanical relationships between the plant vessel geometrical characteristicsand the water transport force and driving force, reflecting the mechanism of water transport in plantxylem vessels.
2.5 Initial Condition and GridA finite volume method with non-staggered grid technique is used for spatial discretization and a second
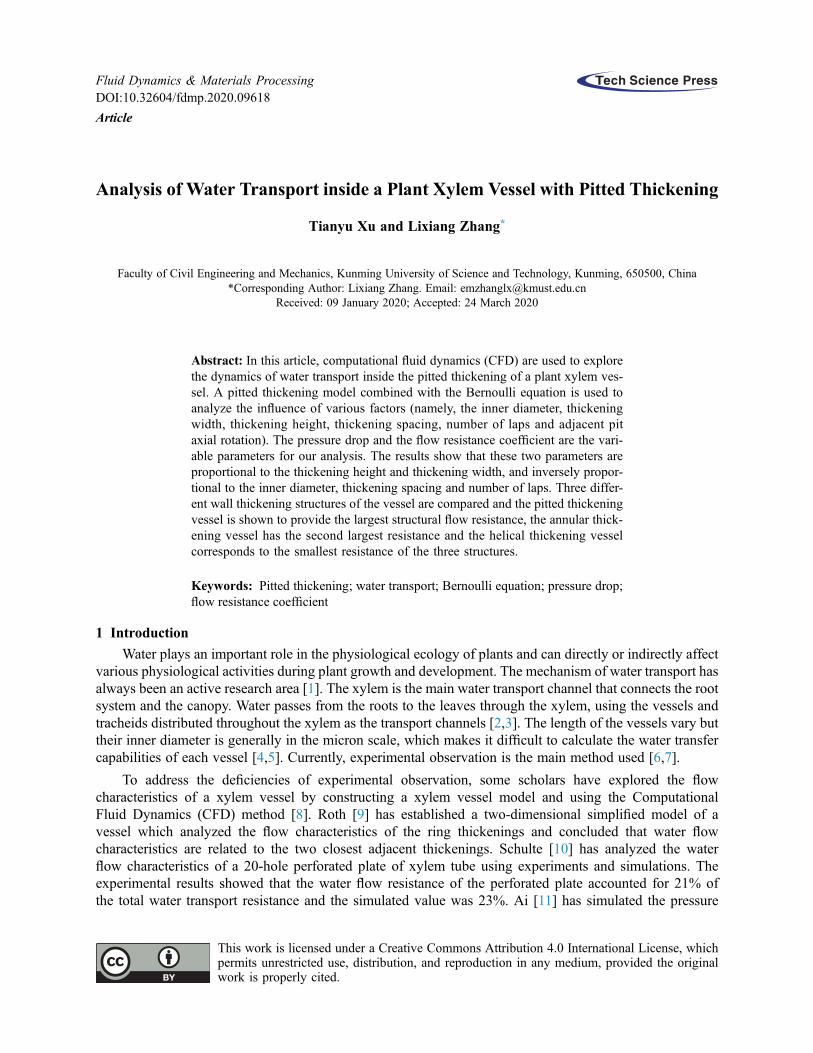
order implicit scheme is used to discretize time. The SIMPLEC scheme is chosen to achieve a couplingsolution for the pressure and velocity equations. The second order scheme is used for the pressure term,and a second order upwind scheme is used for the momentum term. The residuals have convergencecriteria of 1 × 10⁻⁵ and the maximum number of iterations per time-step is set to 150. The uniformfluid velocity specified at the inlet is 0.3 mm·s−1. For this step, the scale of the mesh is based on theprediction accuracy of the inlet/outlet pressure drop, and so a mesh size independence test is performedwith results shown in Tab. 1. The difference in pressure drop between a standard mesh and a fine meshis 0.21% and so the number of meshes has no effect on the calculation results. Therefore, a standardnumber of meshes is used. The total number of meshes in a pitted thickening vessel is approximately0.6 million. The distribution pattern of the pitted thickening wall is shown in Fig. 5. The maximumelement size is 1.22 × 10⁻³ mm and the minimum element size is 2.24 × 10⁻⁴ mm. Since thecalculation scale can be considered to be small, the simulations are conducted using a PowerCube-S01cloud cube high performance computing system for parallel computing, based at Kunming Universityof Science and Technology.
Table 1: Mesh size independence test
Mesh number Pressure drop difference
Very Coarse 114521 –
Coarse 317541 1.18%
Standard 601524 0.46%
Fine 1557854 0.21%
FDMP, 2020, vol.16, no.3 529
3 Result and Discussion
3.1 Influence of the Pitted Thickening PatternsTo facilitate a comparative analysis, the model focuses on the pitted thickening patterns and investigates
the influence of the inner diameter, thickening width, thickening height, thickening spacing, number of lapsand adjacent pit axial rotation on the pressure drop and the flow resistance coefficient of the vessel model.
3.1.1 Influence of the Inner DiameterFor this simulation, the pitted thickening patterns have dimensions of w = 2.3 μm, h = 2.3 μm, s = 4 μm,
n = 4 and the axial rotation is 45°. The inner diameter is varied from 20 μm to 30 μm. Tab. 2 shows theinfluence of the inner diameter on the pressure drop and the flow resistance coefficient.
From Tab. 2, it can be seen that as the inner diameter increases, the pressure drop and the flow resistancecoefficient decrease while the mean flow increases. When the inner diameter is increased to 30 μm, thepressure drop reduces by approximately 60.56% and the flow resistance coefficient reduces byapproximately 87.21%. This is mainly because the flow area in the vessel increases as the inner diameterincreases, resulting in an increase in the mean flow which greatly decreases the pressure drop.
3.1.2 Influence of the Pitted Thickening HeightFor this simulation, the pitted thickening patterns have dimensions of w = 2.3 μm, d = 30 μm, s = 4 μm,
n = 4 and the axial rotation is 45°. The pitted thickening height is varied from 2.3 μm to 4 μm. Tab. 3 showsthe influence of the pitted thickening height on the pressure drop and the flow resistance coefficient.
Figure 5: Pitted thickening wall mesh distribution
Table 2: Effect of inner diameter of vessel on the pressure drop and the flow resistance coefficient
Inner diameterof vessel/μm
Pressure dropΔP/Pa
Mean flowQ/(10−13 m3·s−1)
Flow resistancecoefficient ξ
20 5.954 0.550 290345
25 3.534 0.971 103858
30 2.348 1.510 37128
Table 3: Effect of pitted thickening height on pressure drop and flow resistance coefficient
Inner diameterof vessel/μm
Pressure dropΔP/Pa
Mean flowQ/(10−13 m3·s−1)
Flow resistancecoefficient ξ
2.3 2.348 1.510 37128
3.0 2.600 1.347 60522
3.5 2.823 1.236 86452
4.0 3.065 1.130 122352
530 FDMP, 2020, vol.16, no.3

From Tab. 3, it can be seen that as the pitted thickening height increases, the pressure drop and the flowresistance coefficient increase while the mean flow decreases. When the pitted thickening height is increasedto 4 μm, the pressure drop increases by approximately 30.54% and the flow resistance coefficient increasesby approximately 229.54%. This is mainly because the flow area in the vessel increases due to a reduction inthe inner diameter of the fluid domain as the pitted thickening height increases, resulting in an increase in themean flow and a rapid increase in the pressure drop.
3.1.3 Influence of the Pitted Thickening WidthFor this simulation, the dimensions of the pitted thickening patterns are h = 2.3 μm, d = 30 μm, s = 4 μm,
n = 4 and the axial rotation is 45°. The pitted thickening width is varied from 2.3 μm to 5.0 μm. Tab. 4 showsthe influence of the pitted thickening width on the pressure drop and the flow resistance coefficient.
From Tab. 4, it can be seen that as the pitted thickening width increases, the pressure drop and the flowresistance coefficient increase while the mean flow stays constant. When the pitted thickening width isincreased to 5 μm, the pressure drop increases by approximately 0.17%, and the flow resistancecoefficient increases by approximately 0.47%. This is mainly because the smooth area in the vesseldecreases as the pitted thickening width increases, resulting in an increase in the pressure drop and theflow resistance coefficient in the vessel.
3.1.4 Influence of the Pitted Thickening SpacingFor this simulation, the dimensions of the pitted thickening patterns are w = 2.3 μm, h = 2.3 μm, d = 30 μm,
n = 4 and the axial rotation is 45°. The pitted thickening spacing is varied from 2.4 μm to 4.8 μm. Tab. 5 showsthe influence of the pitted thickening spacing on the pressure drop and the flow resistance coefficient.
From Tab. 5, it can be seen that as the pitted thickening spacing increases, the pressure drop and flowresistance coefficient decrease while the mean flow stays constant. When pitted thickening spacing isincreased to 4.8 μm, the pressure drop decreases by approximately 1.69%, and the flow resistancecoefficient decreases by approximately 4.60%. This is mainly because the number of pits in the same area
Table 4: Effect of pitted thickening width on pressure drop and flow resistance coefficient
Pitted thickeningwidth/μm
Pressure dropΔP/Pa
Mean flowQ/(10−13 m3·s−1)
Flow resistancecoefficient ξ
2.3 2.348 1.510 37128
3.0 2.350 1.510 37215
4.0 2.351 1.510 37259
5.0 2.352 1.510 37303
Table 5: Effect of pitted thickening spacing on pressure drop and flow resistance coefficient
Pitted thickeningwidth/μm
Pressure dropΔP/Pa
Mean flowQ/(10−13 m3·s−1)
Flow resistancecoefficient ξ
2.4 2.369 1.510 38047
3.2 2.358 1.510 37565
4.0 2.348 1.510 37128
4.8 2.329 1.510 36296
FDMP, 2020, vol.16, no.3 531

decreases as the pitted thickening spacing increases, resulting in an increase in the pressure drop and the flowresistance coefficient in the vessel.
3.1.5 Influence of the Number of LapsFor this simulation, the dimensions of the pitted thickening patterns are w = 2.3 μm, h = 2.3 μm, s =
4 μm, d = 30 μm and the axial rotation is 0°. The number of laps is varied from 4 to 8. Tab. 6 shows theinfluence of the number of laps on the pressure drop and the flow resistance coefficient.
From Tab. 6, it can be seen that as the number of laps increases, the pressure drop and the flow resistancecoefficient decrease while the mean flow stays constant. When the number of laps is increased to 8, thepressure drop decreases by approximately 1.45%, and the flow resistance coefficient decreases byapproximately 4.02%. This is mainly because the equivalent radius of the vessel increases as the numberof laps increases, so the pressure drop in the vessel increases and the flow resistance coefficientdecreases. This also explains the reason for the large number of pits in the vessel.
3.1.6 Influence of the Adjacent Pit Axial RotationFor this simulation, the dimensions of the pitted thickening patterns are w = 2.3 μm, h = 2.3 μm, s =
4 μm, n = 4 and d = 30 μm. The adjacent pit axial rotation is varied from 0° to 45°. Tab. 7 shows theinfluence of the adjacent pit axial rotation on the pressure drop and the flow resistance coefficient.
From Tab. 7, it can be seen that as the adjacent pit axial rotation increases, the pressure drop and the flowresistance coefficient firstly decrease and then increase while the mean flow stays constant. When thepressure drop is at its maximum, the adjacent pit axial rotation θ is 30° and the pressure drop hasincreased by approximately 0.34%, and the flow resistance coefficient increases by approximately 0.95%.This is mainly because the disturbance effect firstly decreases and then increases as the adjacent pit axialrotation increases, so the maximum pressure drop and flow resistance coefficient values occur at 30°.
3.2 Analysis of Flow Characteristics of Pitted ThickeningA pitted thickening vessel was selected to analyze the flow characteristics. For this model, the
dimensions of the pitted thickening patterns are w = 2.3 μm, h = 2.3 μm, s = 4.8 μm, n = 4, d = 30 μmand the axial rotation is 45°. It can be seen from Fig. 6 that the pressure at the inlet wall is large, and the
Table 6: Effect of the number of laps on pressure drop and flow resistance coefficient
Number of laps Pressure drop ΔP/Pa Mean flow Q/(10−13 m3·s−1) Flow resistance coefficient ξ
4 2.348 1.510 37128
6 2.327 1.510 36208
8 2.311 1.510 35508
Table 7: Effect of adjacent pit axial rotation on pressure drop and flow resistance coefficient
Adjacent pitaxial rotation
Pressure dropΔP/Pa
Mean flowQ/(10−13 m3·s−1)
Flow resistancecoefficient ξ
axial rotation 0° 2.345 1.510 36996
axial rotation 15° 2.341 1.510 36821
axial rotation 30° 2.349 1.510 37171
axial rotation 45° 2.348 1.510 37128
532 FDMP, 2020, vol.16, no.3

pressure uniformly reduces with fluid flow. When a convex portion is encountered on a nearby wall surface,the local energy loss increases due to encountering resistance to the flow, and a pressure difference occursbefore and after the convex portion. Fig. 7 shows that the overall flow velocity of the fluid along thevessel wall surface is very small. Due to the existence of pitted thickening, a local low velocity vortexflow is produced on the convex wall surface, causing the effective inner diameter to be smaller than theactual inner diameter of the vessel.
3.3 Analysis of Resistance between Different Vessel Wall Thickening Patterns and Smooth VesselsThe different vessel wall thickening patterns and smooth vessels were compared and analyzed in order to
study the water transport efficiency of a xylem vessel. The structural flow resistance of different thickenedstructures is calculated using:
F ¼ n� nsð Þ=n (10)
where F is the structural flow resistance, ξ is the flow resistance coefficient for different vessel wallthickening patterns and ξs is smooth vessel flow resistance coefficient. It is obvious that the closer thestructural flow resistance value is to 1, the closer the transmission efficiency of the wall thickeningpattern is to an ideal vessel.
For this simulation, the three different thickening patterns have a flow region length of 150 μm and w =2.3 μm, h = 2.3 μm and s = 4 μm. The resulting vessel pressure drops are shown in Tab. 8, which shows thatthe helical thickening and the annular thickening have a larger mean flow than the pitted thickening for thesame inner diameter, since the pitted thickening has the largest area which means that the overall flow of theflow path is decreased.
The flow resistance coefficient of the different vessel thickening structures are shown in Tab. 9 and areobtained using Eq. (9). The relationship between the inner diameter and the structural flow resistance iscalculated using Eq. (10), as shown in Fig. 8.
As shown in Fig. 8, the calculations show that the structural flow resistance of different wall thickeningpatterns is proportional to the size of the inner diameter of the vessel. Comparing the three types of wall
Figure 6: Pressure distribution of fluid in a reticulated thickened vessel
Figure 7: Schematic of fluid flow along the wall of a vessel
FDMP, 2020, vol.16, no.3 533

thickening vessel structures, the pitted thickening vessel has the largest structural flow resistance, the annularthickening vessel has the second largest resistance and the helical thickening catheter has the smalleststructural flow resistance. This indicates that the pitted thickening vessel is closest to the ideal vessel,which also explains the evolution of the wall thickening. As the inner diameter of the vessel increases,the structural flow resistance increases for all three types of wall thickening structures. This confirms theconclusions drawn by Tyree [2] and Chen [16] who observed that a vessel with a larger inner diameterwould have a water transport efficiency that is much closer to an ideal vessel, since changes to thestructural features of a vessel has less effect when the size of the vessel is large.
4 Conclusions
1. The flow resistance coefficient and the pressure drop were both found to be proportional to the thickeningheight, and thickening width, and inversely proportional to the inner diameter, thickening spacing andnumber of laps.
2. As the inner diameter was increased, the pressure drop reduced by approximately 60.56% and the flowresistance coefficient reduced by approximately 87.21%. As the pitted thickening height wasincreased, the pressure drop increased by approximately 30.54% and flow resistance coefficient
Table 8: Calculation of pressure drop of vessels with different thickening structures and smooth vessels
Inner Diameterof vessel D/μm
Helical thickeningvessel pressure drop ΔP/Pa
Annular thickeningvessel pressure drop ΔP/Pa
Smooth vesselpressure drop ΔP/Pa
Mean flow Q/(10−13 m3·s−1)
20 μm 7.162 7.169 3.692 0.933
25 μm 3.920 3.962 2.403 1.463
30 μm 2.484 2.562 1.692 2.109
Table 9: Flow resistance coefficient of different vessel thickening structures
InnerDiameter ofvessel D/μm
Pitted thickeningvessel flow resistancecoefficient ξ
Helical thickeningvessel flow resistancecoefficient ξ
Annular thickeningvessel flow resistancecoefficient ξ
Smooth vesselflow resistancecoefficient ξ
20 μm 290345 128261 128419 49655
25 μm 103858 54432 55377 20288
30 μm 37128 22045 23836 4309
Figure 8: Relationship between structural flow resistance and inner diameter of different thickened vesselstructures
534 FDMP, 2020, vol.16, no.3

increased by approximately 229.54%. As the pitted thickening width was increased, the pressure dropincreased by approximately 0.17% and the flow resistance coefficient increased by approximately0.47%. As the pitted thickening spacing was increased, the pressure drop decreased by approximately1.69% and the flow resistance coefficient decreased by approximately 4.60%. As the number of lapswas increased, the pressure drop decreased by approximately 1.45% and the flow resistance coefficientdecreased by approximately 4.02%. The maximum pressure drop occurred when the adjacent pit axialrotation was 30° and the pressure drop increased by approximately 0.34% and the flow resistancecoefficient increased by approximately 0.95%.
3. The structural flow resistance is an indicator of the water transmission efficiency i.e., the closer thestructural flow resistance is to 1, the closer the transmission efficiency of the wall thickening pattern isto an ideal vessel. The pitted thickening vessel has the largest structural flow resistance, whichindicates that the pitted thickening vessel is closer to an ideal vessel and the structural flow resistanceof the wall thickening is proportional to the inner diameter of the vessel.
Acknowledgement: We would like to thank professor Hongming Zhang for additional high performancecomputing and storage resources that we used in our analysis.
Funding Statement: This work was supported by the National Natural Science Foundation of China (GrantNos. 51279071, 51969009) and the Foundation of the Ministry of Education of China for Ph.D candidates inUniversity (Grant No. 2013531413002).
Conflicts of Interest: The authors declare that they have no conflicts of interest to report regarding thepresent study.
References1. Bai, D. Z., Deng, X. P., Huang, M. L. (2003). Water transportation and regulation in plants. Acta Botanica Boreali-
Occidentalia Sinica, 23(9), 1637–1643.
2. Tyree, M. T., Zimmermann, M. H. (2002). Xylem structure and the ascent of sap. Berlin Heidelberg: Springer.
3. Lucas, W. J., Groover, A., Lichtenberger, R., Furuta, K., Yadav, S. et al. (2013). The plant vascular system:evolution, development and functions. Journal of Integrative Plant Biology, 55(4), 294–388. DOI 10.1111/jipb.12041.
4. Wan, X. C., Meng, P. (2007). Physiological and ecological mechanisms of long-distance water transport in plants: areview of recent issues. Chinese Journal of Plant Ecology, 31(5), 804–813. DOI 10.17521/cjpe.2007.0102.
5. Xiao, Y. J., Guo, C. Y., Chen, T., Xue, J. W. (2010). Primary analysis of plant water transportation model. ChineseJournal of Applied Mechanic, 27(4), 751–754.
6. Ellerby, D. J., Ennos, A. R. (1998). Resistances to fluid flow of model xylem vessels with simple and scalariformperforation plates. Journal of Experimental Botany, 49(323), 979–985. DOI 10.1093/jxb/49.323.979.
7. Kizilova, N. (2008). Long-distance liquid transport in plants. Proceedings of the National Academy of Sciences ofthe United States of America, 57(3), 179–203.
8. Han, Y. D., Chen, D. W., Liu, S. Q., Xu, G. (2020). An investigation into the effects of the Reynolds number onhigh-speed trains using a low temperature wind tunnel test facility. Fluid Dynamics & Materials Processing, 16(1),1–19. DOI 10.32604/fdmp.2020.06525.
9. Roth, A. (1996). Water transport in xylem conduits with ring thickenings. Plant, Cell and Environment, 19(5),622–629. DOI 10.1111/j.1365-3040.1996.tb00397.x.
10. Schulte, P. J. (1999). Water flow through a 20-pore perforation plate in vessels of Liquidambar styraciflua. Journalof Experimental Botany, 50(336), 1179–1187. DOI 10.1093/jxb/50.336.1179.
11. Ai, Q. L., Xu, F., Chen, Q., Chen, J., Wang, P. (2011). Flow resistance characteristics of scalariform perforationplates in plant xylem vessels. Transactions of the Chinese Society for Agricultural Machinery, 42(8), 143–148.
FDMP, 2020, vol.16, no.3 535

12. Karam, G. N. (2005). Biomechanical model of the xylem vessels in vascular plants. Annals of Botany, 95(7), 1179–1186. DOI 10.1093/aob/mci130.
13. Wooding, F. B. P., Northcote, D. H. (1964). The development of the secondary wall of the xylem in Acerpseudoplatanus. Journal of Cell Biology, 23(2), 327–337. DOI 10.1083/jcb.23.2.327.
14. Bierhorst, D. W., Zamora, P. M. (1965). Primary xylem elements and element associations of Angiosperms.American Journal of Botany, 52(7), 657–710. DOI 10.1002/j.1537-2197.1965.tb07236.x.
15. Carlquist, S. (2012). How wood evolves: a new synthesis. Botany, 90(10), 901–940. DOI 10.1139/b2012-048.
16. Chen, Q., Xu, F., Ai, Q. L., Zhang, L. B. (2015). Hydrodynamic model and flow resistance characteristics of plantvessel wall thickenings. Transactions of the Chinese Society of Agricultural Engineering, 31(19), 1–8.
17. Luo, Y., Liu, W., Wang, L., Xie, W. (2016). Heat and mass transfer characteristics of leaf-vein-inspiredmicrochannels with wall thickening patterns. International Journal of Heat and Mass Transfer, 101, 1273–1282. DOI 10.1016/j.ijheatmasstransfer.2016.05.120.
18. Rand, R. H. (1983). Fluid mechanics of green plants. Annual Review of Fluid Mechanics, 15(1), 29–45. DOI10.1146/annurev.fl.15.010183.000333.
19. Jeje, A. A. (1985). Flow models of microcapillaries of living plants. Physical Hydrodynamics, 115, 15–26.
20. Datta, A., Sanyal, D., Das, A. K. (2016). Numerical investigation of heat transfer in microchannel using inclinedlongitudinal vortex generator. Applied Thermal Engineering, 108, 1008–1019. DOI 10.1016/j.applthermaleng.2016.07.165.
21. Ebrahimi, A., Roohi, E., Kheradmand, S. (2015). Numerical study of liquid flow and heat transfer in rectangularmicrochannel with longitudinal vortex generators. Applied Thermal Engineering, 78, 1576–1583. DOI 10.1016/j.applthermaleng.2014.12.006.
22. Schulte, P. J. (2012). Computational fluid dynamics models of conifer bordered pits show how pit structure affectsflow. New Phytologist, 193(3), 721–729. DOI 10.1111/j.1469-8137.2011.03986.x.
23. Nouri, S., Abderrahmane, G., Said, A., Pierre, S. (2018). A numerical study of the transitions of laminar naturalflows in a square cavity. Fluid Dynamics & Materials Processing, 14(2), 121–135.
24. Cherfi, R., Sadaoui, D., Sahi, A., Mouloud, S. (2019). Numerical simulation of double diffusive mixed convectionin a horizontal annulus with finned inner cylinder. Fluid Dynamics & Materials Processing, 15(2), 153–169. DOI10.32604/fdmp.2019.04294.
536 FDMP, 2020, vol.16, no.3


![Scaling of Xylem Vessel Diameter with Plant Size: Causes, … · formed by the superposition of vessel elements to form con-tinuous conduits [7]. In contrast with gymnosperm wood,](https://img.pdfslide.net/doc/110x75/5f50852d9933890c9b67e257/scaling-of-xylem-vessel-diameter-with-plant-size-causes-formed-by-the-superposition.jpg)