Embed Size (px)
Citation preview
Journal of Sensor Technology, 2019, 9, 1-11 http://www.scirp.org/journal/jst
ISSN Online: 2161-1238 ISSN Print: 2161-122X
Analysis of Yellow Water in Liquor Fermentation with Sensor Array
Bo Chen , Yi Yao, Haijiao Luo
School of Automation and Information Engineering, Sichuan University of Technology, Zigong, China
Abstract Yellow water is a by-product of liquor in the solid state fermentation process, and contains a large amount of nutrients, such as acids, esters, alcohols and aldehydes produced by fermentation. The components in the yellow water re-flect the fermentation information to a certain extent, so the fermentation process can be monitored by detecting the yellow water component online. A sensor array detection device is designed for detecting yellow water. In addi-tion, chemical titration is used to obtain data such as acidity, reducing sugar and starch of yellow water. Principal component analysis and discriminant function analysis were performed on the data; and a multivariate linear re-gression was used to establish a prediction model for the data. The results showed that the prediction bias for acidity and alcohol was small, 0.39 and 0.43, respectively.
Keywords Yellow Water, Sensor Array, PCA, Multiple Linear Regression, Liquor
1. Introduction
Yellow water is a by-product of the brewing process of Luzhou-flavor liquor. It is also known as yellow pulp water. Its characteristics are: brownish yellow viscous liquid, and rich in beneficial microorganisms, such as alcohols, aldehydes, acids, esters etc. [1] [2]. At present, the main research and utilization of yellow water in the wine industry is as follows: 1) Judging the quality of fermentation by using the content of yellow water; 2) Esterifying liquid for fermentation; 3) for mixing new earthworms after mixing with mud and mother grains; 4) direct distillation to obtain base wine [3] [4] [5].
The content of yellow water not only reflects the information of fermentation;
How to cite this paper: Chen, B., Yao, Y. and Luo, H.J. (2019) Analysis of Yellow Water in Liquor Fermentation with Sensor Array. Journal of Sensor Technology, 9, 1-11. https://doi.org/10.4236/jst.2019.91001 Received: December 10, 2018 Accepted: January 4, 2019 Published: January 7, 2019 Copyright © 2019 by author(s) and Scientific Research Publishing Inc. This work is licensed under the Creative Commons Attribution International License (CC BY 4.0). http://creativecommons.org/licenses/by/4.0/
Open Access
DOI: 10.4236/jst.2019.91001 Jan. 7, 2019 1 Journal of Sensor Technology
B. Chen et al.
in addition, it also contains extremely rich organic matter, which has a very high utilization value. The detection and analysis of the yellow water component is beneficial to more comprehensive monitoring of the fermentation process and to promote the full utilization of yellow water.
At present, for the yellow water detection, chemical titration and liquid chro-matography [6], gas chromatography and mass spectrometry are mainly used [7]. Their disadvantages are that other solvents need to be configured, the detec-tion time is long, and the sample pretreatment is cumbersome [8].
The sensor detects information about a specific object, such as temperature, light, pressure, etc., and reacts them into electrical signals according to certain rules. When the detected object changes, it will cause a change in the resistance value of the sensor, and the output voltage signal will also be different. In addi-tion, the response signals of different sensors are also different, so it is possible to construct a sensor array, such as an electronic tongue [9] [10]. The sensor’s response signal is conditioned and output, and the relationship between the sample object and the response electrical signal is analyzed through signal processing and pattern recognition, thereby quickly detecting the sample. Its characteristics are: the sample does not need pre-treatment, the sample con-sumption is small, the operation is simple, and the measurement is convenient and fast. It can comprehensively evaluate the taste information of the sample to identify the sample, and also quantitatively analyze some components.
The main research progress in the field of sensor arrays is as follows. Tian et al. used a multi-frequency pulse Sensor array to detect and analyze wines of dif-ferent ages to predict the age of wine, using principal component analysis (PCA) and partial least squares-discrimination analysis (PLS-DA) for pattern recogni-tion to distinguish between different age samples [11]. Rudnitskaya et al. used electronic tongue combined with high performance liquid chromatography (HPLC) to predict and analyze the age of wine and the acids and esters con-tained in it. PCA regression model was used to show that the electronic tongue can be compared. Goodly detect its concentration [12]. Winquist et al. estab-lished an online detection system for milk using an electronic tongue, using PCA to distinguish milk of different quality and origin [13]. Du Hongfu et al. used the electronic tongue combined with HPLC to analyze the fermentation process of vinegar, and used BP neural network to establish a prediction model for acetic acid and lactic acid, the main components of vinegar [14]. At present, the elec-tronic tongue has been widely used in the food industry, such as Chinese vine-gar, red wines, and organic acids [15] [16] [17], but there are few studies on the parameter detection and analysis of yellow water.
2. Materials and Methods 2.1. Instruments and Equipment
During the fermentation of liquor, the dissolved oxygen is gradually reduced, and the starch in the wine cell is converted into glucose, yeast, lactic acid bacteria
DOI: 10.4236/jst.2019.91001 2 Journal of Sensor Technology
B. Chen et al.
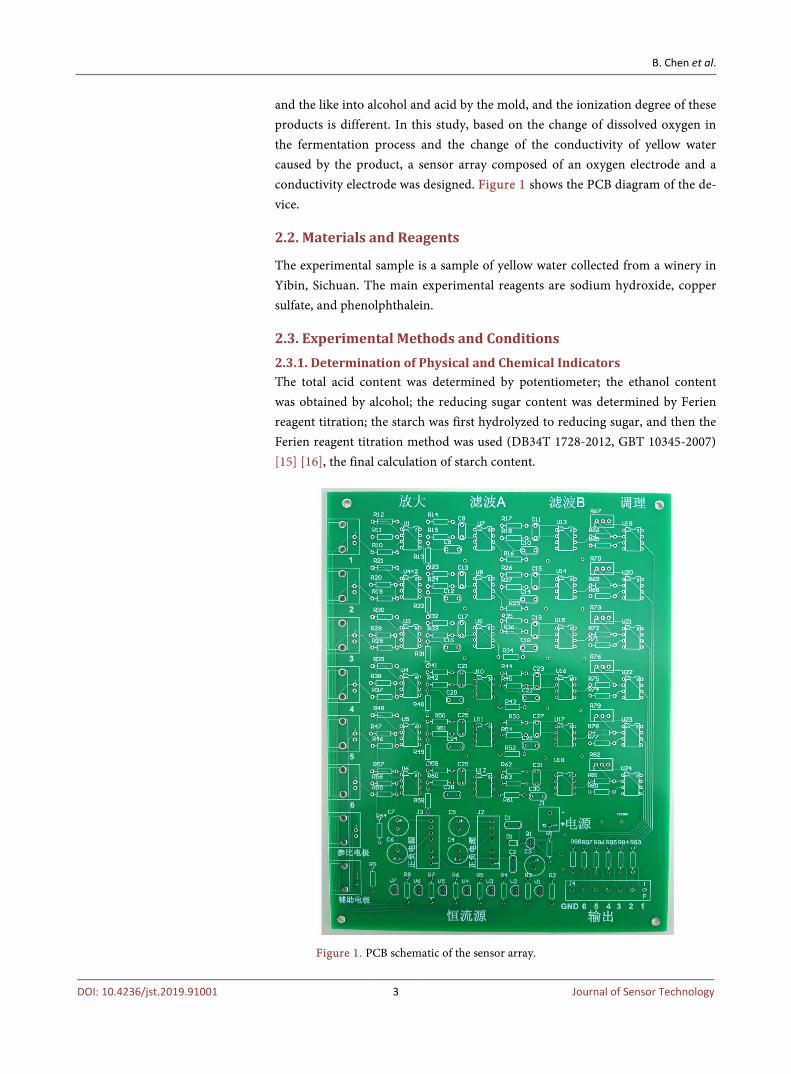
and the like into alcohol and acid by the mold, and the ionization degree of these products is different. In this study, based on the change of dissolved oxygen in the fermentation process and the change of the conductivity of yellow water caused by the product, a sensor array composed of an oxygen electrode and a conductivity electrode was designed. Figure 1 shows the PCB diagram of the de-vice.
2.2. Materials and Reagents
The experimental sample is a sample of yellow water collected from a winery in Yibin, Sichuan. The main experimental reagents are sodium hydroxide, copper sulfate, and phenolphthalein.
2.3. Experimental Methods and Conditions 2.3.1. Determination of Physical and Chemical Indicators The total acid content was determined by potentiometer; the ethanol content was obtained by alcohol; the reducing sugar content was determined by Ferien reagent titration; the starch was first hydrolyzed to reducing sugar, and then the Ferien reagent titration method was used (DB34T 1728-2012, GBT 10345-2007) [15] [16], the final calculation of starch content.
Figure 1. PCB schematic of the sensor array.
DOI: 10.4236/jst.2019.91001 3 Journal of Sensor Technology
B. Chen et al.
2.3.2. Sensor Array Measurement The sensor array was preheated in a 3.5 mol/L KCl solution prior to detection. The pretreated sample was then tested and the electrode was washed with 0.01 mol/L KCl solution before each measurement. The sensor array detection para-meter setting is set to start from +1 V, the step-down voltage is 0.2 V until −1 V; the precision is set to 10−3; and the parallel measurement is performed at 3 fre-quencies of 1 Hz, 10 Hz, 100 Hz, repeated three times, recorded and saved data.
2.4. Analysis Method 2.4.1. Principal Component Analysis Principal component analysis (PCA) is the linear transformation of multiple va-riables into a small number of integrated variables to represent the raw data. The advantage is to eliminate the impact of correlation and fully extract effective in-formation and reduce workload. The disadvantage is that the accuracy of the expression is reduced, and only the main component dimension is significantly reduced and a large amount of original information is retained to reflect the ad-vantages of PCA.
Principles and steps of PCA: Assume that the number of samples is m, each with n features, DATA (m ∙ n).
1) Standardization: Find the mean and standard deviation of each feature sep-arately. The normalized matrix DATA adjust (m ∙ n) is obtained by subtracting the average value of each data in DATA and dividing by each standard deviation, and the origin is located at the center of each sample point.
2) Find the covariance matrix C. 3) Find the eigenvalue of the covariance matrix C, λ. Combined with the maximum variance theory, the eigenvector corresponding
to the largest eigenvalues is the projection direction containing the most signals. The largest pre-k bits are selected, the eigenvectors are calculated and norma-lized, and k eigenvectors are obtained as eigenvector matrices composed of column vectors Eigencector (n ∙ k).
4) Mapping the original data to obtain dimensionally reduced data.
2.4.2. Discriminant Function Analysis Discriminant function analysis (DFA) is a statistical method for discriminating the type of sample. The data obtained by the sensor detection samples are re-combined to maximize the difference between the components while keeping the difference within the group small, so that the distance between the centers of the groups is maximized, thereby establishing a discriminant function for dis-criminating and distinguishing the samples. DFA classification is good and easy to implement. It is one of the commonly used pattern recognition methods for electronic nose and sensor arrays.
Commonly used discriminating methods are: distance discriminant method, Fisher discriminant method, Bayes discriminant method, stepwise discriminant analysis, and the like. The discriminant analysis method of distance has no spe-
DOI: 10.4236/jst.2019.91001 4 Journal of Sensor Technology
B. Chen et al.
cific requirements for various types of distribution, and is judged according to various center of gravity (average of each group). For a given observation, if it is closest to the center of the i-th class, it is determined to be from the i-th class.
The discriminant function analysis based on the distance from the sample to each parent has the advantages of less discriminant function and simple calcula-tion. And there is no special requirement for the data as a whole, so this paper chooses the distance discriminant function for sample analysis.
3. Results and Analysis 3.1. Test Results
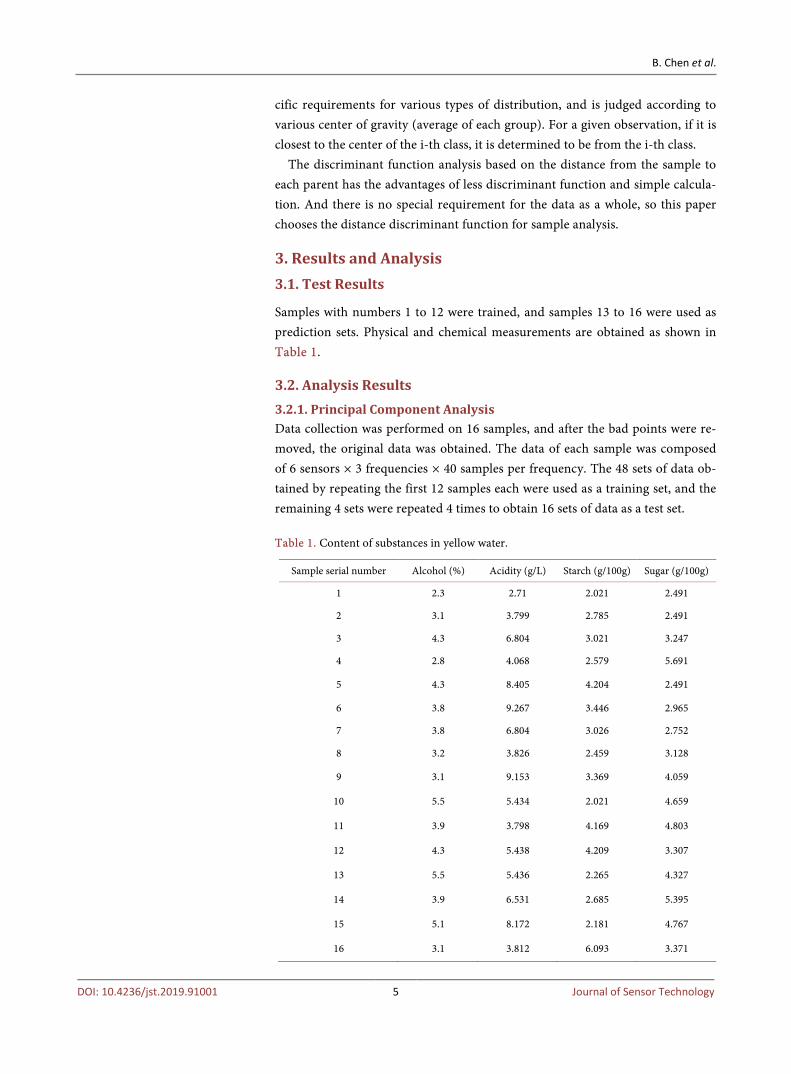
Samples with numbers 1 to 12 were trained, and samples 13 to 16 were used as prediction sets. Physical and chemical measurements are obtained as shown in Table 1.
3.2. Analysis Results 3.2.1. Principal Component Analysis Data collection was performed on 16 samples, and after the bad points were re-moved, the original data was obtained. The data of each sample was composed of 6 sensors × 3 frequencies × 40 samples per frequency. The 48 sets of data ob-tained by repeating the first 12 samples each were used as a training set, and the remaining 4 sets were repeated 4 times to obtain 16 sets of data as a test set. Table 1. Content of substances in yellow water.
Sample serial number Alcohol (%) Acidity (g/L) Starch (g/100g) Sugar (g/100g)
1 2.3 2.71 2.021 2.491
2 3.1 3.799 2.785 2.491
3 4.3 6.804 3.021 3.247
4 2.8 4.068 2.579 5.691
5 4.3 8.405 4.204 2.491
6 3.8 9.267 3.446 2.965
7 3.8 6.804 3.026 2.752
8 3.2 3.826 2.459 3.128
9 3.1 9.153 3.369 4.059
10 5.5 5.434 2.021 4.659
11 3.9 3.798 4.169 4.803
12 4.3 5.438 4.209 3.307
13 5.5 5.436 2.265 4.327
14 3.9 6.531 2.685 5.395
15 5.1 8.172 2.181 4.767
16 3.1 3.812 6.093 3.371
DOI: 10.4236/jst.2019.91001 5 Journal of Sensor Technology
B. Chen et al.
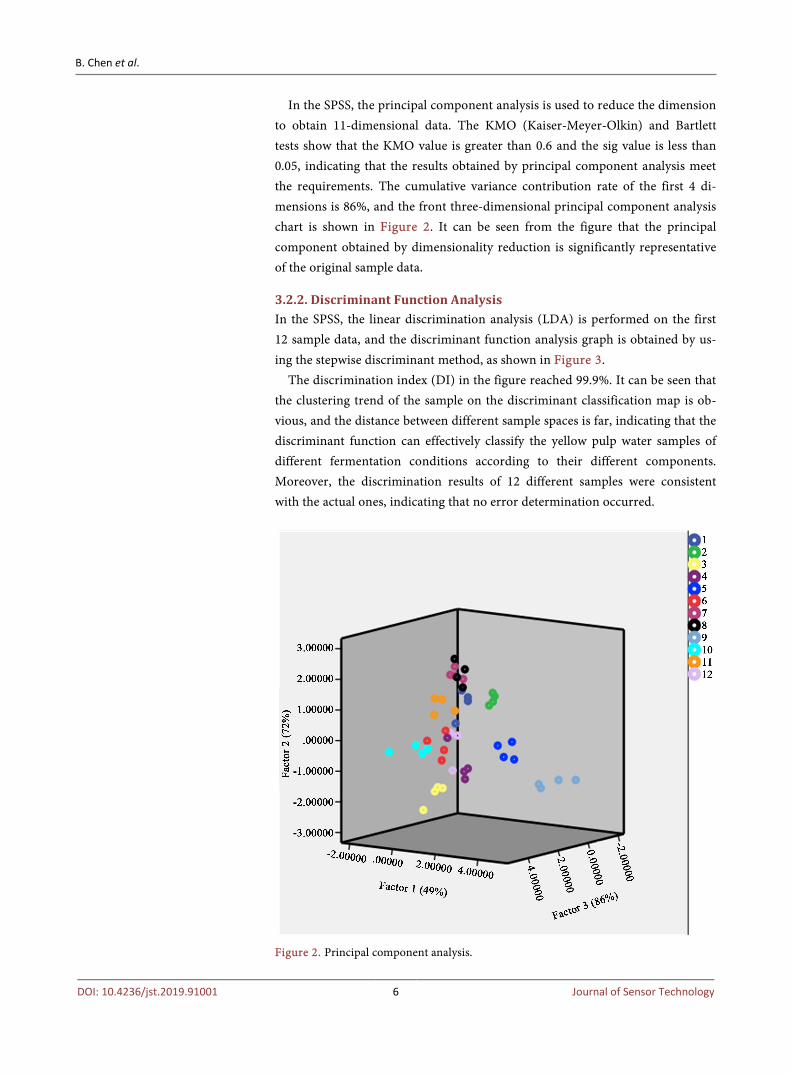
In the SPSS, the principal component analysis is used to reduce the dimension to obtain 11-dimensional data. The KMO (Kaiser-Meyer-Olkin) and Bartlett tests show that the KMO value is greater than 0.6 and the sig value is less than 0.05, indicating that the results obtained by principal component analysis meet the requirements. The cumulative variance contribution rate of the first 4 di-mensions is 86%, and the front three-dimensional principal component analysis chart is shown in Figure 2. It can be seen from the figure that the principal component obtained by dimensionality reduction is significantly representative of the original sample data.
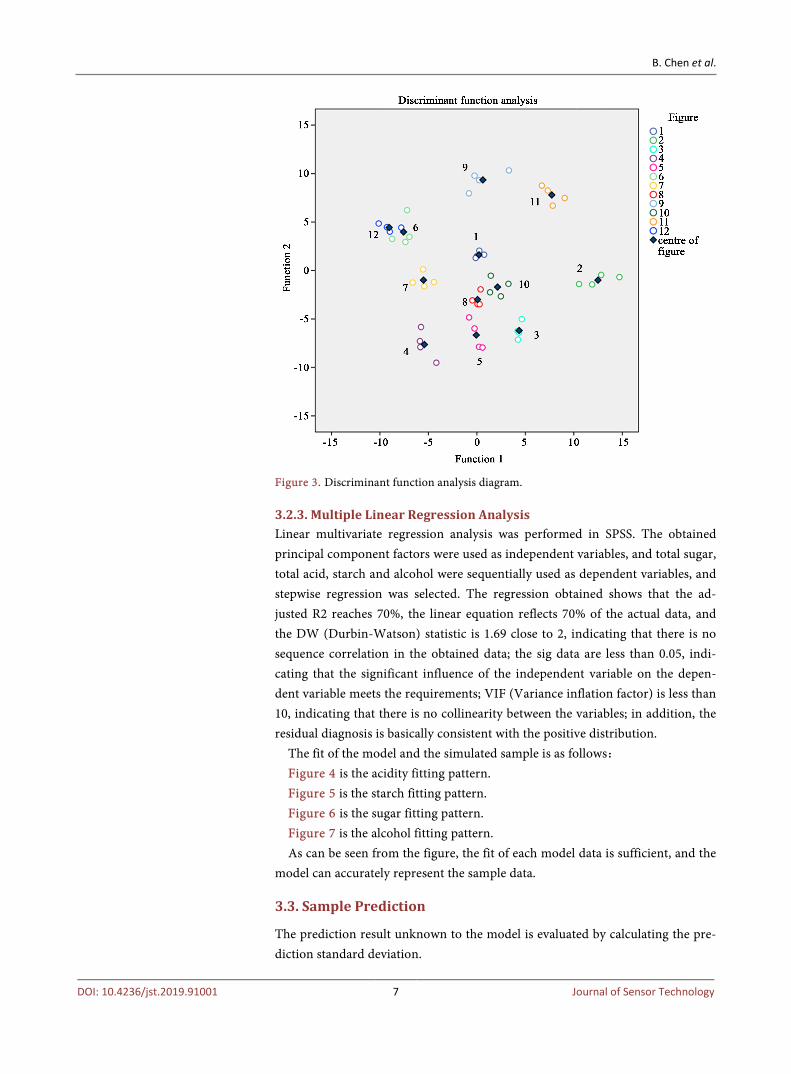
3.2.2. Discriminant Function Analysis In the SPSS, the linear discrimination analysis (LDA) is performed on the first 12 sample data, and the discriminant function analysis graph is obtained by us-ing the stepwise discriminant method, as shown in Figure 3.
The discrimination index (DI) in the figure reached 99.9%. It can be seen that the clustering trend of the sample on the discriminant classification map is ob-vious, and the distance between different sample spaces is far, indicating that the discriminant function can effectively classify the yellow pulp water samples of different fermentation conditions according to their different components. Moreover, the discrimination results of 12 different samples were consistent with the actual ones, indicating that no error determination occurred.
Figure 2. Principal component analysis.
DOI: 10.4236/jst.2019.91001 6 Journal of Sensor Technology
B. Chen et al.
Figure 3. Discriminant function analysis diagram.
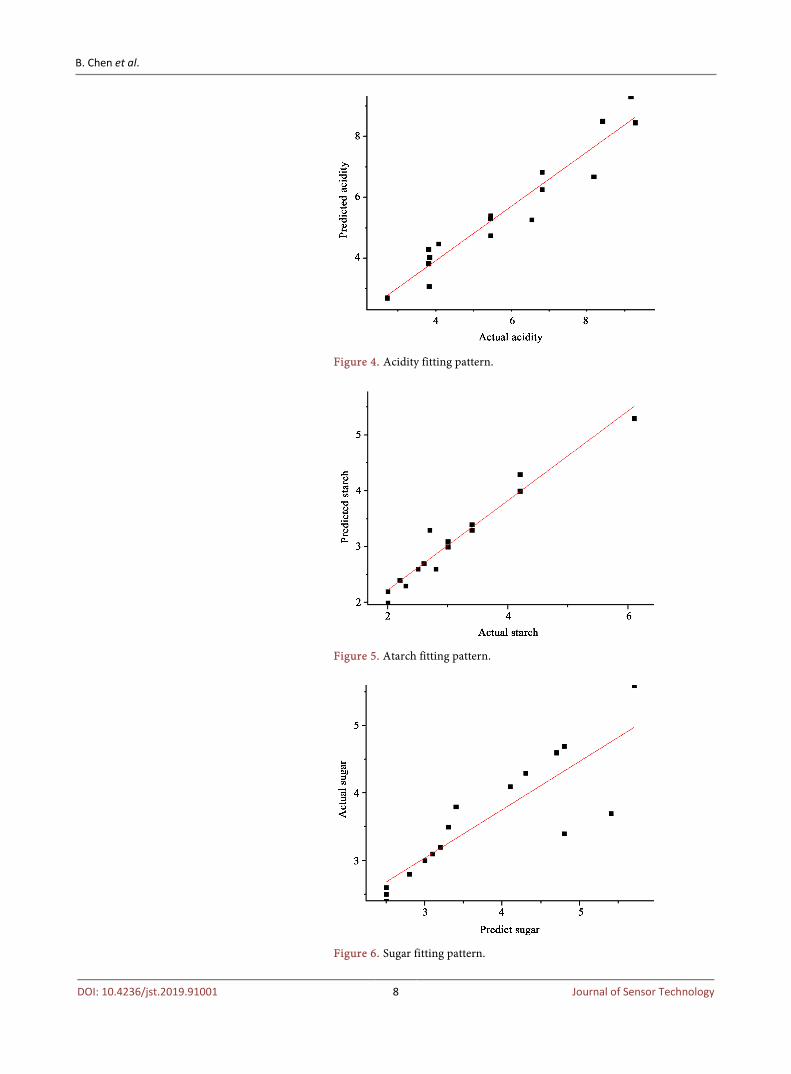
3.2.3. Multiple Linear Regression Analysis Linear multivariate regression analysis was performed in SPSS. The obtained principal component factors were used as independent variables, and total sugar, total acid, starch and alcohol were sequentially used as dependent variables, and stepwise regression was selected. The regression obtained shows that the ad-justed R2 reaches 70%, the linear equation reflects 70% of the actual data, and the DW (Durbin-Watson) statistic is 1.69 close to 2, indicating that there is no sequence correlation in the obtained data; the sig data are less than 0.05, indi-cating that the significant influence of the independent variable on the depen-dent variable meets the requirements; VIF (Variance inflation factor) is less than 10, indicating that there is no collinearity between the variables; in addition, the residual diagnosis is basically consistent with the positive distribution.
The fit of the model and the simulated sample is as follows: Figure 4 is the acidity fitting pattern. Figure 5 is the starch fitting pattern. Figure 6 is the sugar fitting pattern. Figure 7 is the alcohol fitting pattern. As can be seen from the figure, the fit of each model data is sufficient, and the
model can accurately represent the sample data.
3.3. Sample Prediction
The prediction result unknown to the model is evaluated by calculating the pre-diction standard deviation.
DOI: 10.4236/jst.2019.91001 7 Journal of Sensor Technology
B. Chen et al.
Figure 4. Acidity fitting pattern.
Figure 5. Atarch fitting pattern.
Figure 6. Sugar fitting pattern.
DOI: 10.4236/jst.2019.91001 8 Journal of Sensor Technology
B. Chen et al.
( )2
1
n
i ii
y yREMSEP
n=
−=
∑ (1)
among them: iy —Fit or predicted value; n —Fit the number of samples; iy—Sample measured value.
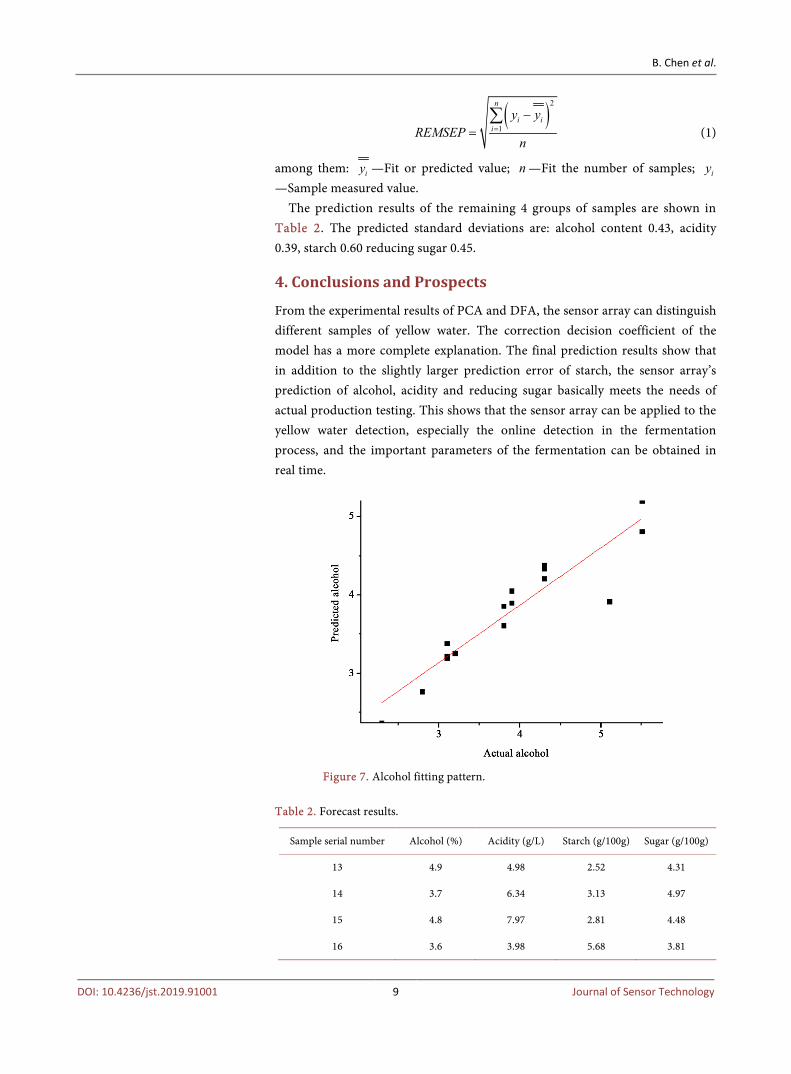
The prediction results of the remaining 4 groups of samples are shown in Table 2. The predicted standard deviations are: alcohol content 0.43, acidity 0.39, starch 0.60 reducing sugar 0.45.
4. Conclusions and Prospects
From the experimental results of PCA and DFA, the sensor array can distinguish different samples of yellow water. The correction decision coefficient of the model has a more complete explanation. The final prediction results show that in addition to the slightly larger prediction error of starch, the sensor array’s prediction of alcohol, acidity and reducing sugar basically meets the needs of actual production testing. This shows that the sensor array can be applied to the yellow water detection, especially the online detection in the fermentation process, and the important parameters of the fermentation can be obtained in real time.
Figure 7. Alcohol fitting pattern.
Table 2. Forecast results.
Sample serial number Alcohol (%) Acidity (g/L) Starch (g/100g) Sugar (g/100g)
13 4.9 4.98 2.52 4.31
14 3.7 6.34 3.13 4.97
15 4.8 7.97 2.81 4.48
16 3.6 3.98 5.68 3.81
DOI: 10.4236/jst.2019.91001 9 Journal of Sensor Technology
B. Chen et al.
Conflicts of Interest
The authors declare no conflicts of interest regarding the publication of this pa-per.
References [1] Xu, Y.C., Sheng, J., Liu, A.J., et al. (2017) Antibacterial Characteristics and Stability
of Liquor by-product of Liquor Fermentation. Food Science, 38, 122-126.
[2] Guo, W. (2010) Comprehensive Utilization of Yellow Wine, a By-Product of Liquor Fermentation. Northwest University, Xi’an.
[3] Feng, X.Z., Deng, J., Xie, J., et al. (2017) Analysis on the Status Quo of Comprehen-sive Utilization of Yellow Wine By-Product of Liquor Brewing. China Brewing, 36, 6-9.
[4] Xu, C.H., Yu, Y.G. and Zhang, W.W. (2014) Progress in Physical and Chemical Analysis and Application of Huangshui. Journal of Food Safety and Quality, No. 12, 4011-4017.
[5] Liu, Q. and Zhang, Y.T. (2001) Comprehensive Utilization of Yellow Water, a by-product of Winemaking. Journal of Brewery, 28, 39-42.
[6] Yin, L.G., Feng, X.Y., Xu, D.F., et al. (2014) Analysis and Application of Trace Mat-ter in Wuliang Luzhou-flavor Liquor Yellow Water. Journal of Brewing Science, No. 4, 83-85.
[7] Sheng, J., Xu, Y.C., Ji, H.Y., et al. (2017) Analysis of Organic Components in Yellow Water Fermentation by-products of Liquor. Food Science and Technology, 38, 231-235.
[8] Xian, Y.H. and Li, X.M. (2015) Liquor Analysis and Detection Technology. China Light Industry Press, Beijing, 152-155.
[9] Legin, A., Rudnitskaya, A., et al. (2015) Application of Electronic Tongue for Quan-titative Analysis of Mineral Water and Wine. Electroanalysis, 11, 814-820. https://doi.org/10.1002/(SICI)1521-4109(199907)11:10/11<814::AID-ELAN814>3.0.CO;2-7
[10] Rudnitskaya, A., Nieuwoudt, H.H., Muller, N., et al. (2010) Instrumental Measure-ment of Bitter Taste in Red Wine Using an Electronic Tongue. Analytical & Bio-analytical Chemistry, 397, 3051-3060. https://doi.org/10.1007/s00216-010-3885-3
[11] Tian, S.Y., Deng, S.P., Ding, C.H., et al. (2007) Discrimination of Red Wine Age Using Voltammetric Electronic Tongue Based on Multifrequency Large-Amplitude Voltammetry and Pattern Recognition Method. Sensors and Materials, 19, 287-298.
[12] Rudnitskaya, A., Rocha, S.M., Legin, A., Pereira, V. and Marques, J.C. (2010) Evalu-ation of the Feasibility of the Electronic Tongue as a Rapid Analytical Tool for Wine Age Prediction and Quantification of the Organic Acids and Phenolic Compounds. The Case-Study of Madeira Wine. Analytica Chimica Acta, 662, 82-89. https://doi.org/10.1016/j.aca.2009.12.042
[13] Winquist, F., Bjorklund, R., Krantz-Rülcker, C., Lundström, I., Stergren, K. and Skoglund, T. (2005) An Electronic Tongue in the Dairy Industry. Sensors and Actu-ators B: Chemical, 111, 299-304. https://doi.org/10.1016/j.snb.2005.05.003
[14] Zhang, W., Jia, H.F., Li, W., et al. (2012) Study on the Identification and Differen-tiation of Vinegar Quality by Electronic Tongue. Chinese Condiment, 37, 1-3.
[15] Liu, M., Wang, M., Wang, J., et al. (2013) Comparison of Random Forest, Support Vector Machine and Back Propagation Neural Network for Electronic Tongue Data
DOI: 10.4236/jst.2019.91001 10 Journal of Sensor Technology
B. Chen et al.
Classification: Application to the Recognition of Orange Beverage and Chinese Vi-negar. Actuators B Chemical, 177, 970-980. https://doi.org/10.1016/j.snb.2012.11.071
[16] Diako, C., Vixie, K. and Ross, C.F. (2016) Electronic Tongue Analysis of Red Wines: Prediction and Correlation with Human Sensory Evaluation. NSBE, National Con-vention.
[17] Du, H.F., Dong, A.J., Nie, Z.Q., et al. (2015) Solid-State Fermentation Process of Shanxi Old Vinegar and Prediction of Main Organic Acids by Electronic Tongue. Food and Fermentation Industry, 41, 196-201.
DOI: 10.4236/jst.2019.91001 11 Journal of Sensor Technology