Embed Size (px)
Citation preview
The Impact of Electronic Payments on Economic GrowthIntroduction
Greater worldwide card use raises a number of questions. Foremost, do electronic payments bring macroeconomic benefits?
Moody’s Analytics attempted to answer this question by analyzing macroeconomic data for 70 countries between 2011 and 2015. By calculating the impact of card usage on per capita consumption, Moody’s Analytics was able to extrapolate the effect that the increase in spending on goods and services had on consumption and thereby GDP.
Specifically, Moody’s Analytics estimated that higher card usage contributed an additional $296 billion to consumption between 2011 and 2015, or a 0.1% cumulative increase in global GDP during the sample time period. That equals about a $74 billion contribution to GDP each year. Real consumption grew at an average of 2.3% in the same period, of which 0.01 percentage point is attributable to increased card penetration. This implies that card usage accounted for about 0.4% of growth in consumption, as well as an average increase of 2.6 million jobs over 2011-2015.
ANALYSIS
Prepared by
Mark [email protected] Economist
Sophia [email protected] Director
Virendra [email protected]
Paul [email protected]
Contact Us
Email [email protected]
U.S./Canada +1.866.275.3266
EMEA +44.20.7772.5454 (London) +420.224.222.929 (Prague)
Asia/Pacific +852.3551.3077
All Others +1.610.235.5299
Web www.economy.com www.moodysanalytics.com
MOODY’S ANALYTICS
2 FEBRUARY 2016
Table of ContentsExecutive Summary ..............................................................................................................................................................1
Part I: Introduction: The Macroeconomic Impact of Electronic Payment Usage .............................................................. 3
Part II: The Value of Electronic Payments: Less Friction, More Efficiency ......................................................................... 4
Part III: Model Estimation ................................................................................................................................................... 6
Part IV: Contribution of Card Usage on Consumption and GDP .........................................................................................7
Part V: Contribution of Card Usage on Employment ........................................................................................................10
Part VI: Ongoing Effects on GDP of Greater Card Penetration: Measuring Elasticity by Country ..................................12
Part VII: The Evolution of the Report’s Methodology .......................................................................................................14
Part VIII: Conclusion ...........................................................................................................................................................15
Appendix .............................................................................................................................................................................16
MOODY’S ANALYTICS
1 FEBRUARY 2016
Executive SummaryRising Card Payments Drive Economic Growth
Payment cards are not just convenient but also play a crucial role in stimulat-ing economic growth in countries around the world.
Over the last 50 years, the rapid prolifera-tion of electronic payments—in particular credit, debit and prepaid cards—has changed how consumers pay for goods and services, how merchants manage their businesses, and how governments make and collect all sorts of payments. Electronic payments pro-vide consumers with convenient and secure access to their funds, reduce cash and check handling for merchants, and expand the pool of customers who are guaranteed to pay. Im-portantly, they also promote greater finan-cial inclusion, giving those without access to the formal banking system an introduc-tion to formal financial services. Electronic payments also give governments a greater ability to collect additional tax revenue by reducing the number of unreported transac-tions in the gray economy.
All of this reduces friction in the overall economy and leads to increased spending on goods and services. That, in turn, creates a virtuous economic cycle whereby increased consumption translates into increased production, more jobs, higher incomes and greater economic prosperity.
But just how much has the expansion of electronic payments contributed to global economic growth in recent years? What has been the impact on GDP and employment, and has this impact differed between devel-oped countries and emerging markets?
Moody’s Analytics set out to answer these questions by examining the impact that the migration toward electronic payments has had on 70 countries around the globe over a five-year period between 2011 and 2015.
Together, these economies make up almost 95% of world gross domestic product. Over-all, Moody’s Analytics found that:
» Electronic payments added $296 billion in real (U.S.) dollars to GDP in the 70 countries studied between 2011 and 2015. That is equivalent to the creation of about 2.6 million jobs on average per year over the five-year period, or about 0.4% of total em-ployment in the 70 countries.
» Countries with the largest increases in card usage experienced the big-gest contributions to growth. For example big increases in GDP were recorded in Hungary (0.25%), the United Arab Emirates (0.23%), Chile (0.23%), Ireland (0.2%), Poland (0.19%) and Australia (0.19%). In most countries, card usage increased regardless of economic performance. Only in the case of Finland, Greece and Tunisia did card usage decline when economic performance deterio-rated or other macro events affected activity. As a result, consumption was weaker than it would have been had card penetration increased or remained unchanged.
» Increased electronic payments resulted in roughly the same per-centage increase in GDP between 2011 and 2015 for emerging markets (0.11%) as for developed countries (0.08%). However, when card usage increases by 1% across countries, de-veloped countries experience a larger percentage increase in GDP (0.04%) than do emerging markets (0.02%). This suggests there is a compounding benefit for advanced countries as elec-tronic payments usage deepens.
» The expansion of electronic pay-ments could have a significant, positive effect on future economic growth. Across the 70 countries in the study, we found that each 1% increase in usage of electronic payments pro-duces, on average, an annual increase of approximately $104 billion in the consumption of goods and services, or a 0.04% increase in GDP, assuming all other factors remain the same.
» Electronic payments could also have a significant improvement on spending habits. Given recent card penetration rates, growth rates and the additive effects, Moody’s Analytics calculated that consumption was 0.4% higher between 2011 and 2015 than it would have been if electronic payments had not increased; total consumption increased on average by 2.3% over the sample period. Because consumption growth is on average faster in emerging economies, emerging economies have more to gain by increasing electronic payments usage to speed consump-tion growth even further. Consumption growth in both emerging economies and developed countries benefits from additional card usage.
This study marks the third time that Moody’s Analytics has conducted this analysis and the results suggest again that both emerging economies and developed countries benefit from increasing electronic payments. However, penetration in and of itself will not necessarily spur growth. Suc-cessful penetration goes hand in hand with a well-developed financial system and a healthy economy.
This study found that developed coun-tries had a larger dollar increase in GDP

MOODY’S ANALYTICS
2 FEBRUARY 2016
than did emerging markets. On a cautionary note, slippage in electronic payments usage, such as that seen in Finland and Greece, is estimated to have reduced the resilience of consumer spending in these countries to the downturn in their economies.
While this study provides a comprehen-sive look at the impact of electronic pay-ments on economic growth between 2011 and 2015, it does not consider as exogenous variables in our model a country’s fiscal poli-cies nor the strength of a country’s financial system such as the stability of the banking sector or prevalence of financial infrastruc-ture such as ATMs. The study also does not analyze the effects of mobile phone pay-ments—such as payments through cell phone apps, which are not directly tied to a credit, debit or prepaid card—which through wide-spread usage in emerging markets could in-crease penetration rates. That is, if anything, for emerging markets, the positive impact of electronic payments is conservative and po-tentially an underestimate. Still, the findings definitively highlight the important contribu-
tion that migration to electronic payments has made on economic growth and suggest that policies that speed card adoption would benefit economic growth across the globe.
The report is structured as follows: Part I provides an introduction to the report and briefly highlights the findings. Part II will dis-cuss the various channels in which electronic payments usage can help the macroecono-my. Part III will discuss the methodology and provide an econometric model capturing the effects of card usage. Part IV will calculate and analyze the additional consumption and GDP brought about by rising card usage. Part V will analyze labor productivity and calcu-late the increase in jobs due to increases in card use. Part VI poses a hypothetical ques-tion to calculate the elasticity of electronic payments usage on consumption. Part VII outlines the evolution of the methodology between this and previous versions of this study. Part VIII concludes that there are significant economic gains to increased elec-tronic payments penetration and thus there are also policy implications for governments.
Study MethodologyThis study focused on the impact of
increased card penetration on real private consumption in 70 countries over five years between 2011 and 2015. The results were then extrapolated to estimate the impact that increased consumption had on eco-nomic output, as measured by GDP, and on job creation.
Real private consumption was modeled as a function of real disposable income, real interest rates and card penetration, defined as spending using credit, debit and prepaid cards as a share of overall consumer expenditures. The data were pooled for all countries to cre-ate a data set with over 325 observations; a statistical technique called “pooled cross-section time series estimation” was used to estimate the model parameters.
Once the model was specified, this study calculated various measures to isolate the impact of card use on consumption, labor and GDP. To isolate the impact of usage, the change in card penetration between 2011 and 2015 was used.

MOODY’S ANALYTICS
3 FEBRUARY 2016
Part I: Introduction: The Macroeconomic Impact of Electronic Payment Usage
Sixty years ago, most consumers used cash or checks to buy goods and services, with cash predominately used for smaller purchases and checks for more costly transactions. While cash remains the pre-dominate form of payment in some places in the world, it has become a less common method of transaction as the advent of general purpose payment cards has allowed consumers and businesses to buy and sell with greater convenience. Today, consumers can make electronic payments with credit, debit and prepaid cards—and more recently, using all kinds of devices, from watches to mobile phones.
Greater worldwide card use raises a num-ber of questions. Foremost, do electronic payments bring macroeconomic benefits?
Moody’s Analytics attempted to answer this question by analyzing macroeconomic data for 70 countries between 2011 and 2015. By calculating the impact of card us-age on per capita consumption, Moody’s Analytics was able to extrapolate the ef-
fect that the increase in spending on goods and services had on consumption and thereby GDP.
Specifically, Moody’s Analytics estimated that higher card usage contributed an addi-tional $296 billion to consumption between 2011 and 2015, or a 0.1% cumulative in-crease in global GDP during the sample time period. That equals about a $74 billion con-tribution to GDP each year. Real consump-tion grew at an average of 2.3% in the same period, of which 0.01 percentage point is at-tributable to increased card penetration. This implies that card usage accounted for about 0.4% of growth in consumption, as well as an average increase of 2.6 million jobs over 2011-2015.
The impact of card usage on consump-tion and economic growth varied consider-ably across the 70 countries that were stud-ied. This reflects differing economic growth rates, penetration, and financial systems. Financial systems conducive to the growth in electronic payments include control over
inflation and the money supply, a wide network of stable and read-ily accessible banks, insurance companies and pension funds, the existence of mar-kets such as stock exchanges, and the availability of such financial
infrastructure as ATMs. Card usage increased consumption the most in Russia (0.64%), the United Arab Emirates (0.52%), Qatar (0.47%), Ireland (0.42%), and Hungary (0.4%). Card penetration rates increased by over 7 percentage points in each of these countries between 2011 and 2015.
Declining card usage decreased consump-tion by 0.003% in Greece and 0.04% in Finland. Severe recessions in both countries during the time period in addition to higher tax rates likely led to decreased card usage.
Additionally, the report includes a hypo-thetical study of the impact of a 1% increase per year in the card penetration rate in each country. Every 1% increase in card usage across the 70 countries produces an annual increase of approximately $104 billion in the consumption of goods and services, or a 0.04% increase in GDP, assuming all other factors remain the same.
The estimated GDP elasticity, or respon-siveness of GDP to increases in card pen-etration, for developed countries is higher than it is for emerging markets, because the card penetration rate is nearly three times the size for developed countries, where it averages almost 42%, as it is for emerging economies, where penetration averages 16%. This is not surprising considering that developed countries are places that have more established payment networks, con-sumers who are more comfortable using cards, and environments where cards are ac-cepted by most merchants. By comparison, cash payments are still more prevalent in emerging economies.
Economy | Average contribution to GDP
0.10%

MOODY’S ANALYTICS
4 FEBRUARY 2016
Part II: The Value of Electronic Payments: Less Friction, More EfficiencyElectronic Payments Benefit All Parties Involved in Many Ways
Within the electronic payments ecosys-tem there are two main end-parties: buyers (consumers) and sellers (merchants). The evolution to electronic payments from cash and checks has changed the behavior of, and in some cases the relationship between, con-sumers and merchants.
The availability of electronic payment systems leads to a virtuous economic cycle whereby increased consumption leads to increased production, more jobs, greater income, and, ultimately, stronger economic growth.
Although the study does not specifically explore the reasons for the incremental growth in GDP attributable to card usage, there are a number of plausible explana-tions: The advent of electronic payments has greatly aided consumers’ ability to optimize consumption decisions by giving them secure and immediate access to all of their funds on deposit (debit cards) or a line of credit (credit cards). Merchants also benefit because there
is less cash and check handling in the system, and they have access to a large pool of cus-tomers with guaranteed payment. Electronic payments play a critical role in the rapidly expanding e-commerce environment where payment by cash or check is not usually an option.
Benefits to Consumers and Merchants » Electronic payments provide access
to financial resources. Consumers using cash or checks may be limited in the amount of funds they have for particular transactions. With cash, consumers are limited to the funds they have on hand. Merchants may be reluctant to accept checks for big-ger transactions because of the risk of nonpayment. Electronic payments address both of these issues: They provide consumers with access to all available funds or lines of credit for a given transaction and they give mer-chants peace of mind about payment
guarantees, provided they follow ap-propriate payment procedures.
» Access to credit helps calibrate periodic income with continuous consumption. Wages and salaries are typically paid weekly, biweekly or monthly. Consumer spending, how-ever, has no time profile. Putting food on the table or fixing a broken-down vehicle should not have to wait for the next paycheck. Credit smooths out the consumption of durable and nondurable goods by lessening the need to wait for paydays. In obtain-ing credit, consumers generally have three options: bank loans, store credit or credit cards. Credit cards are more convenient and offer lower consumer transaction costs, as the former two involve paperwork, hassle and a po-tential transaction-by-transaction waiting period.
» Cards provide consumers the means to participate in the digital econo-my. In most cases, online shoppers are
Consumption Decline in Inventory Increased Production
More JobsGreater Income

MOODY’S ANALYTICS
5 FEBRUARY 2016
required to use cards for purchases. Cardholders thereby have a larger va-riety of goods and vendors to choose from and a broader international marketplace is made available to con-sumers. Opportunities are limited for consumers using cash. Since online shopping is also completed with “the click of a button,” the economy imme-diately receives a jolt to consumption and GDP.
Security » Trust in electronic transactions
further drives consumption. With electronic payments, consumers have recourse for fraudulent transactions. The peace of mind that merchants have with guaranteed payment also extends to consumers, who feel more comfortable making purchases when
they can pay with a card. This trust in the payment system eases friction, bolstering consumption and thereby GDP growth.
Convenience » Cards provide convenience and low-
er business costs. Consumers cite the convenience of electronic payments, whether it means not having to visit the ATM to obtain cash or not having to count out the cash at the point of transaction. This convenience benefits merchants as well. For instance, when consumers use their own cards at the self-service gasoline pump or super-market, it lowers labor costs for mer-chants. Each small portion of friction that electronic payments eliminate from the system contributes to higher consumption and GDP.
Transparency » Electronic payments reduce central
bank costs in providing currency. By reducing paper transactions, electronic payments can reduce the cost to cen-tral banks of providing notes and coins or to Treasury or Finance departments of processing paper money, thereby improving overall efficiency in com-merce and the economy.
» Electronic transactions eliminate a substantial portion of the gray economy. Retailers who do not re-port some or all of their transactions to avoid paying certain taxes usually prefer cash transactions. Electronic transactions, on the other hand, are “above board” and create an audit trail that greatly reduces unre-ported transactions, thereby raising tax revenues.
MOODY’S ANALYTICS
6 FEBRUARY 2016
Part III: Model EstimationElectronic Payments, Private Consumption and GDP
The level of consumption and card usage is highly correlated. Consumers in developed countries with more robust card infrastruc-ture have the opportunity to use cards more often than in emerging markets. A natural question is: How much does greater card usage or card penetration contribute to con-sumption and GDP?
Essentially, the impact of card usage on GDP is a function of three factors:
» Card penetration as a percent of total personal consumption expenditures (PCE);
» The growth of card usage year-over-year relative to PCE; and
» The actual percentage of GDP that is represented by personal consumption.
Methodology This study estimated the impact of in-
creased card penetration on consumption in 70 countries over a five-year period. Those
results were used to estimate the impact that the changes in consumption had on job creation and economic growth, as measured by GDP.
In order to find the effect of card use, card penetration (spending using cards as a per-centage of overall consumer expenditures) was included as an explanatory variable in an equation for consumption. Real private consumption (consumption adjusted for inflation) was modeled as a function of three factors: real disposable income, real interest rates, and card penetration. See the Appen-dix for the exact specification used and the results of the estimation.
The effect of card usage varies depending on the wealth of an economy. To capture this effect in the current study (as well as in previous reports), countries were divided into two groups—developed and emerg-ing—based on International Monetary Fund status. We create interaction terms between the country group and card us-age, disposable income and interest rates,
to isolate the effect of each variable on a specific group.
By developing a model that estimates how consumption is directly affected by credit card usage, we can then construct a method to estimate the effect into the labor market and GDP.
In summary, the methodology is as follows:
» The model uses real disposable in-come and interest rates from 2011 to 2014, using an estimate for the 2015 value.
» Card penetration was reported for 2011 through 2015.
» To measure the impact of card usage on GDP, the consumption figure was multiplied by the portion of GDP that is represented by consumer spending in each country. The model can there-fore estimate the impact of card usage on the overall economy.
More details regarding the model can be found in the Appendix.

MOODY’S ANALYTICS
7 FEBRUARY 2016
Part IV: Contribution of Card Usage on Consumption and GDP
Card usage plays an outsize role in driving consumption and economic growth in large part because card usage begets more card usage. As more cards are issued and more merchants accept cards, transaction volume grows. That is because consumers feel more comfortable using their cards for a larger percentage of their overall transactions once a critical mass of merchant locations is reached. At the same time, merchants want access to the growing pool of cardholders with guaranteed payment. In other words, a more robust payment ecosystem produces a multiplier effect that can result in significant increases in consumption.
GlobalElectronic payments added $296 billion
in real (U.S.) dollars to GDP in the 70 coun-tries studied between 2011 and 2015. That is equivalent to the creation of about 2.6 mil-lion jobs on average per year over the five-year period, or about 0.4% of total employ-ment in the 70 countries. This corresponds to an average 0.18% increase in consumption per annum and a 0.1% increase in GDP per
annum between 2011 and 2015. Card usage increased around 4 percentage points on average across the 70 sampled countries be-tween 2011 and 2015, and led to the positive contribution to GDP.
Emerging Markets and Developed Countries
Both emerging markets and developed countries experienced gains in consumption due to higher card usage. Increased card us-age added 0.2% to consumption in emerging markets, compared with 0.14% in developed countries between 2011 and 2015. The cor-responding figures for GDP were 0.11% for emerging economies and 0.08% for the developed countries. All figures are averages weighted by GDP over the countries and the sample period.
The increase in consumption levels and GDP growth attributed to higher card usage was far closer between emerging markets and developed countries than when Moody’s Analytics previously conducted this analysis; however, as in the 2012 report, the impact of card usage on consumption in this report is
slightly greater for emerging markets coun-tries than for developed countries.
The likely reason for the differing effects between the two groups of countries is the time period of the study. Specifically, the previous Moody’s Analytics study included the Great Recession and the recovery. Re-cessions result in a contraction in domestic consumer spending. The Great Recession was particularly severe because it enveloped much of the global economy and especially affected higher-income economics. As such, the decline in consumption was exacerbated by weakened international flows of funds and goods. The recovery period saw gener-ally lower consumption and disposable income growth than in non-recessionary periods because of the persistent debt crisis. During the period of the current study the majority of countries were in recovery or expansion. Consequently, the increase in consumption due to increased card usage for developed countries has a similar impact as for emerging markets.
However, the results from both studies suggest that it is not just the mature markets
2012 2013 2014 2015
Economy | Contribution to GDP growth
0
$295.99bn$80bn
$40bn
$-40bn

MOODY’S ANALYTICS
8 FEBRUARY 2016
that benefit from increases in consumption due to increases in card usage. In recent years, emerging economies have reported sharp increases in card use. In developed economies, where card usage has matured, card use is increasing more slowly. The im-pact of the Great Recession slowed growth more among developed countries than it did for emerging economies. That being the case, emerging markets can have a larger impact on GDP by further increasing their card pen-etration rates. This could be achieved by de-veloping the retail payments infrastructure of emerging economies to match that of de-veloped countries, such as making electronic payments mechanisms more prevalent and available by giving merchants ways to accept electronic payments.
Regional ImpactsResults were not uniform across regions
of the world. The Summary Table below gives the breakdown on average increases in con-sumption and GDP by region of the world.
South America and Oceania (Australia and New Zealand) experienced the largest gains in GDP due to increased card usage. Specifically, South America’s GDP grew by an average of 0.2% per annum because of increased card usage, while Oceania experi-enced an average GDP growth of 0.12% per annum over the five-year period. Increased card usage contributed 0.12% per annum in North America and 0.1% per annum in Europe. Because of the somewhat lower pen-etration, card usage added 0.09% to GDP in the Middle East and 0.06% to GDP per an-num in Asia.
As outlined, South American countries, with an average GDP increase of 0.2%
resulting from increased card usage, out-performed all other regional averages. The results for the region are supported by par-ticularly high results from a few countries. For example, there was a 0.23% weighted average increase in GDP in Chile as card us-age increased by around 7 percentage points. Improving Chilean banking services provide one likely explanation for the increased card usage. In Venezuela, which experienced a 0.3% weighted average increase in GDP, high inflation spurred more electronic pay-ment utilization ahead of the expectation of even higher prices. Electronic payments also eliminated the need to carry large amounts of cash.
Oceania had the second largest average increase in GDP due to increased card us-age of 0.12%. This was entirely due to the influence of Australia’s 0.19% increase. New Zealand experienced a more modest 0.06% increase in GDP due to an increase in card usage. This region stands out because it is predominantly made up of developed coun-tries and because of its extremely high card usage rate, which, at around 60% for coun-tries included in the sample, is higher than the card usage rate in any other region.
African countries experienced on average a 0.05% increase in GDP due to increased card penetration. Many African countries are at early stages of developing their financial systems with appropriate infrastructure to support electronic payments. In coming years the increase in the use of mobile phone technologies to make payments is expected to increase electronic payments penetration. We note that South Africa, the most devel-oped economy on the African continent, recorded an average 0.18% increase in GDP
from additional card usage, three times the regional average. This illustrates the strong benefits of electronic payments that accom-pany a developed financial services system.
Market-Level ResultsLooking at national results for the 70
countries included in the study, there are notable success stories and some markets where there is clearly room for improvement. A subset of the results can be found in Table 1B below, and more details regarding the amount of GDP added per year by country due to increased card penetration in relation to consumption and GDP can be found in Tables 1, 1A and 1B in the Appendix.
Russia recorded the biggest percentage rise in GDP of 0.33% as a result of increased card penetration. Card penetration rates in Russia increased by over 10 percentage points between 2011 and 2015, and led to an additional $26 billion in consumption for the country during that period. Hungary also performed well during this time period, as it experienced a 0.25% increase in GDP due to increased card penetration. The country’s card usage rate rose by over 7 percentage points during the five years in the sample, and helped the country increase consump-tion by $1.4 billion over this time period. Other top performers include Australia, the United Arab Emirates, Chile, Ireland, Mexico, Peru, South Africa, Argentina, Poland and Uruguay. Of this group, it is worth not-ing that the UAE, Chile and Argentina each recorded a 0.23% increase in GDP due to increased card usage during the time period. Like the other notable markets, these three countries experienced over a 6 percentage point increase in card usage. As these results display, countries in all regions benefited from increased card usage, but it was the emerging economies primarily that had the largest increases.
Meanwhile, at the other end of the scale, declining card penetration rates re-duced consumption by 0.04% in Finland, by 0.003% in Greece, and by 0.0005% in Tunisia. These declines were also due to the very low or negative relative growth rates in these countries during the period with all three economies enduring deep downturns.
Summary Table: Average Increase in GDP from Increased Card Usage, %
Region Average Weighted by GDP Average Weighted by ConsumptionSouth America 0.20 0.33Oceania 0.12 0.22North America 0.12 0.18Europe 0.10 0.18Middle East 0.09 0.23Asia 0.06 0.12Africa 0.05 0.08

MOODY’S ANALYTICS
9 FEBRUARY 2016
In some cases other macro events such as acute political upheaval and changes in taxation policies played a role. The decline in penetration rates exacerbated the weak-ness in consumption due to the economic struggles in these countries.
As the graph above shows, there is a strong correlation between larger increases in card usage and card contribution to GDP. This correlation held for both emerging markets (orange) and developed countries (green). Russia, an emerging economy, ap-pears in the top-right part of the graph, while Finland, a developed country, appears at the bottom-left part of the graph. Of note is the one emerging economy outlier, Qatar, which despite increasing card penetration by almost 10 percentage points, experienced only a 0.07% contribution to GDP from in-creased card usage. This compares to Ireland, a developed country that had almost a 10 percentage point increase in card usage but an estimated 0.2% increase in GDP due to increased card penetration. While both coun-
tries experienced between a 0.4% to 0.5% increase in consumption due to increased card usage, consumption makes up a much larger share of GDP in Ireland (45%) than it
does in Qatar (15%) because of Qatar’s huge share of oil exports. Consequently, the boost to consumption had a larger relative impact on GDP in Ireland than it did in Qatar.
Table 1B: Card Usage’s Contribution to GDP% average between 2011-2015 weighted by GDP
Argentina 0.23 Greece -0.00 Netherlands 0.08 South Korea 0.04Australia 0.19 Hong Kong 0.09 New Zealand 0.06 Spain 0.01Austria 0.09 Hungary 0.25 Nigeria 0.03 Sri Lanka 0.04Azerbaijan 0.03 India 0.07 Norway 0.05 Sweden 0.03Belgium 0.04 Indonesia 0.05 Oman 0.10 Switzerland 0.06Brazil 0.17 Ireland 0.20 Peru 0.21 Taiwan 0.09Cambodia 0.05 Israel 0.00 Philippines 0.01 Thailand 0.19Canada 0.10 Italy 0.12 Poland 0.19 Tunisia -0.00Chile 0.23 Japan 0.04 Portugal 0.09 Turkey 0.22China 0.05 Jordan 0.03 Puerto Rico 0.09 UAE 0.23Colombia 0.11 Kazakhstan 0.02 Qatar 0.07 UK 0.11Czech Republic 0.11 Kenya 0.03 Russia 0.33 Ukraine 0.07Denmark 0.14 Kuwait 0.04 Rwanda 0.02 Uruguay 0.18Egypt 0.01 Lebanon 0.05 Saudi Arabia 0.12 USA 0.12Finland -0.02 Malaysia 0.04 Serbia 0.12 Venezuela 0.30France 0.03 Mexico 0.16 Singapore 0.10 Vietnam 0.14Germany 0.08 Morocco 0.04 Slovakia 0.11 Emerging Markets 0.11Ghana 0.03 Myanmar 0.02 South Africa 0.18 Developed Countries 0.08
Developed MarketEmerging Market
"#""%
0.02 0.04 0.06 0.08 0.10 0.12 0.140-0.02
0.05
0.10
0.15
0.20
0.25
0.30
0
More card usage provides a bigger boost to GDP
"#""%
Card
con
trib
utio
n to
GD
P, %
Change in card penetration, %
Finland
Russia
Venezuela
Ireland
Qatar

MOODY’S ANALYTICS
10 FEBRUARY 2016
Part V: Contribution of Card Usage on Employment
As consumers spend more, firms increase hiring to accommodate the additional de-mand for goods and services. Consequently, we can calculate the number of jobs created as a result of the additional GDP from elec-tronic payment usage.
Increased card usage added almost 2.6 million jobs per year across the countries sampled between 2011 and 2015. That cor-responds to a 0.001% average boost to jobs per year between 2011 and 2015.
Countries with the largest number of job gains per year were also the largest coun-tries. Notably, the two countries with the greatest average job increases were China (427,000 jobs added) and India (337,000 jobs added), which both had large gains in employment because of the combination of fast growing labor productivity and in-creasing card usage. Led by these emerging markets, the emerging markets group aver-aged a greater number of jobs added per year (43,600) than did developed countries (14,800).
As was the case with GDP gains, job gains were not uniform across regions in the world. Here, North America had the highest average job gains per year (69,000), followed closely by Asia (62,000). Africa had the fewest aver-age number of jobs added per year from in-creased card usage (8,000), which is not sur-prising given the region’s low usage rates and developing financial infrastructure to allow for electronic payments to be more widely accepted. The Middle East had the second lowest average jobs added per year (9,000), but this was likely a result of the relatively smaller population than in the other regions.
Table 2 below provides a subset of our results. More details regarding job addi-
tions can be found in Table 2A and Table 2 in the Appendix.
For the majority of countries, card usage drove higher consumption and in turn GDP regardless of the size of the economy, card penetration or growth rate. So while country size matters, countries with higher card us-age rates tended to outperform countries with lower card usage rates.
The additional GDP accompanied in-creases in employment depending on the labor productivity of the country. Developed countries tend to have higher labor produc-tivity than emerging markets, primarily be-cause developed countries tend to be more industrialized. This includes better infrastruc-ture, a faster rise in technological change, and a sturdier financial system made up of
2012 2013 2014 2015
Employment | Jobs supported, 000s
0
2,616,4303,000
1,500
-1,500
"#""%
Africa
Middle East
EuropeOceania
South America
North America
Asia
20 40 60 800
Regional Impacts
Average number of jobs added, 000s
0.05
0.10
0.20
0.25
0
0.15
Ave
rage
wei
ghte
d by
GD
P, %

MOODY’S ANALYTICS
11 FEBRUARY 2016
stable, higher capital banks. Countries like the United States that have abundant ac-cess to ATMs, large and small banks that can support the financing of their cardholders, as well as steady GDP growth tend to get more out of card usage than countries that do not have any of those qualifications.
Some emerging economies have also experienced notable increases in productiv-ity. For example, increased card penetration raised GDP in Vietnam by 0.14%. Vietnam-ese labor productivity also rose by 18% between 2011 and 2015, resulting in a total impact of around 75,000 jobs gained per
year. Serbia, an emerging market, which had an estimated 0.12% increase in GDP due to increased card penetration, expe-rienced a 1% decline in labor productivity between 2011 and 2015. Job gains were lower, as a result, around 3,000 on average each year.
Table 2: Jobs Added Due to Increased Card Penetration Average between 2011-2015, ths
Argentina 41.29 Greece (0.08) Netherlands 6.45 South Korea 10.96 Australia 21.36 Hong Kong 3.29 New Zealand 1.33 Spain 1.11 Austria 3.65 Hungary 9.86 Nigeria 16.88 Sri Lanka 3.42 Azerbaijan 1.13 India 336.93 Norway 1.39 Sweden 1.49 Belgium 1.76 Indonesia 62.96 Oman 1.90 Switzerland 2.56 Brazil 169.13 Ireland 3.74 Peru 33.49 Taiwan 9.98 Cambodia 4.73 Israel 0.14 Philippines 3.46 Thailand 75.73 Canada 17.61 Italy 25.95 Poland 30.42 Tunisia (0.01)Chile 18.40 Japan 27.84 Portugal 4.04 Turkey 56.62 China 427.10 Jordan 0.44 Puerto Rico 0.88 UAE 14.17 Colombia 11.02 Kazakhstan 2.08 Qatar 1.05 UK 34.51 Czech Republic 5.23 Kenya 5.33 Russia 235.05 Ukraine 13.52 Denmark 3.60 Kuwait 0.90 Rwanda 1.02 Uruguay 2.80 Egypt 2.30 Lebanon 0.72 Saudi Arabia 12.47 USA 180.85 Finland (0.52) Malaysia 4.75 Serbia 2.93 Venezuela 37.44 France 6.81 Mexico 77.54 Singapore 3.38 Vietnam 74.84 Germany 33.25 Morocco 4.01 Slovakia 2.66 Total 2,616.43 Ghana 2.82 Myanmar 4.92 South Africa 26.55

MOODY’S ANALYTICS
12 FEBRUARY 2016
Part VI: Ongoing Effects on GDP of Greater Card Penetration: Measuring Elasticity by Country
The steady migration from paper to elec-tronic forms of payment around the world raises another interesting question: What effect would continued growth in card pene-tration have on overall consumption, and ul-timately, economic growth across countries?
The simulation results in the following table measure consumption elasticity, or the impact that a 1% increase in card us-age rates has on private consumption and GDP, assuming that all other variables are held constant.
Overall, a 1% increase in card usage in every country produced:
» About a $104 billion, or 0.06%, in-crease in consumption between 2011 and 2015.
» This accounts for a 0.04% increase in GDP between 2011 and 2015.
For developed countries, a 1% increase in card usage produced:
» About a $75 billion, or a 0.07%, in-crease in consumption between 2011 and 2015.
» This accounts for a 0.04% increase in GDP between 2011 and 2015.
For emerging markets, a 1% increase in card usage produced:
» About a $29 billion, or a 0.03% increase in consumption between 2011 and 2015.
» This accounts for a 0.02% increase in GDP between 2011 and 2015.
The estimated elasticity shows wide variation across countries (see Table 3B
below). In general, developed countries have higher elasticities than emerging markets because consumers in developed countries use electronic payments much more (42%) than consumers in emerging economies (16%). This is not surprising be-cause developed countries are places that have well-established payment networks, consumers who are more comfortable using electronic payments, and environ-ments where electronic payments are likely more readily accepted by merchants. Cash, on the other hand, is still more prevalent in emerging economies. Table 3B below provides a summary of our find-ings. More details regarding the estimated consumption elasticity and GDP elastic-
Table 3B: GDP Elasticity w.r.t. Card Penetration (Percent)% increase in GDP due to a 1% increase in card usage, Weighted Average 2012-2015
Argentina 0.0263 Greece 0.0057 Netherlands 0.0346 South Korea 0.0617Australia 0.0572 Hong Kong 0.0765 New Zealand 0.0646 Spain 0.0189Austria 0.0195 Hungary 0.0246 Nigeria 0.0010 Sri Lanka 0.0041Azerbaijan 0.0028 India 0.0044 Norway 0.0420 Sweden 0.0477Belgium 0.0431 Indonesia 0.0093 Oman 0.0086 Switzerland 0.0310Brazil 0.0407 Ireland 0.0399 Peru 0.0176 Taiwan 0.0243Cambodia 0.0043 Israel 0.0442 Philippines 0.0135 Thailand 0.0192Canada 0.0667 Italy 0.0197 Poland 0.0191 Tunisia 0.0022Chile 0.0343 Japan 0.0170 Portugal 0.0487 Turkey 0.0542China 0.0405 Jordan 0.0127 Puerto Rico 0.0207 UAE 0.0259Colombia 0.0142 Kazakhstan 0.0031 Qatar 0.0101 UK 0.0715Czech Republic 0.0160 Kenya 0.0047 Russia 0.0169 Ukraine 0.0097Denmark 0.0479 Kuwait 0.0226 Rwanda 0.0007 Uruguay 0.0158Egypt 0.0031 Lebanon 0.0091 Saudi Arabia 0.0153 USA 0.0479Finland 0.0489 Malaysia 0.0225 Serbia 0.0124 Venezuela 0.0468France 0.0417 Mexico 0.0184 Singapore 0.0319 Vietnam 0.0125Germany 0.0160 Morocco 0.0050 Slovakia 0.0155 Emerging Market 0.0158Ghana 0.0008 Myanmar 0.0004 South Africa 0.0343 Developed Country 0.0393

MOODY’S ANALYTICS
13 FEBRUARY 2016
ity can be found in Tables 3, 3A and 3B in the Appendix.
Notably, Hong Kong (0.08%), the United Kingdom (0.07%), and Canada (0.07%) re-corded the three highest percent increases in GDP following a 1% increase in card penetra-tion, and are also among the highest users of cards across the 70 countries. Myanmar (0.0004%), Rwanda (0.0007%), and Ghana (0.0008%) displayed the lowest percent increase in GDP due to a 1% increase in card penetration, and were also among the least frequent card users. Such countries, mostly emerging markets, should however antici-pate a steady increase to the responsiveness of GDP to card penetration as penetration
grows and deepens. That is, markets with very low card penetration rates could see sizable returns to GDP from rapid adoption of cards provided that the proper financial infrastructure were in place.
In light of this, there are significant impli-cations for policymakers. Notably, as a coun-try becomes wealthier and capital infrastruc-ture improves, benefits from deepening card usage compound. Knowing this, policymak-ers, in close coordination with merchants, can encourage widespread use of electronic payments. Measures such as tax incentives to use electronic payments, using electronic payments for government disbursements, and government support for lower-cost card
readers that can be used with mobile phones or tablets could also play a role in increasing card usage. Such technology would reduce the need to invest in costly cash registers and the relevant software and limit financial costs associated with cash.
Consumption Growth and Card Penetration
How much increased card penetration can lift consumption growth is a key ques-tion from a growth-accounting perspective. This is calculated as the difference between the growth in observed consumption and the growth in consumption without increased card penetration. The results are presented in Table 4 in the Appendix.
While income and the proportion of in-come that is spent (marginal propensity to consume) are by far the main determinants of consumption, the report found that addi-tional card penetration increased the average global annual real consumption growth rate by 0.4% in 2015. Global real consumption grew by about 2.3% per year during this time period, so card usage added an aver-age 0.01% (=0.4%*2.3%) to consumption growth for 2015. The addition to the con-sumption growth rate due to increased card usage ranged tremendously across countries.
Electronic payment usage, particularly credit card usage, enables consumers to spend even when cash flow may be limited and to repay over some period of time. Card penetration and usage consequently provided an important boost to global economies. Other factors that help boost consumption include the presence of af-fordable retail establishments, competition that drives down prices, and the availability of a developed transportation network that improves access to retail. Unlike these fac-tors, cards help individuals track the amount they spend and somewhat dampen the impact of price increases or income changes on consumers’ ability to maintain consump-tion patterns. Thus, electronic payment usage, especially credit card usage, can sup-port and smooth out consumption during economic fluctuations.
Experiment on GDP Elasticity Using Mexico and Vietnam as an Example The impact of different hypothetical card penetration rates on a country’s economy is
measured using Mexico and Vietnam, two of the world’s fastest growing emerging econo-mies. In 2015, Mexican and Vietnamese card usage rates ranked among the bottom 25 across the 70 countries in the sample. In this experiment, we examine the effect on GDP of a 1% increase in card usage. In order to do this, we replace actual card penetration rates in Mexico and Vietnam with the median and maximum card usage rates across countries for every year of the sample. All other Mexican and Vietnamese economic variables such as consumption, GDP and real disposable income per person are unchanged at their actual values. The table below shows the resulting GDP elasticity, including the results obtained using the actual card usage rates for Mexico and Vietnam for reference.
For instance, the second row states that if Mexico (or Vietnam) consistently had the median observed card penetration rate in each year, a 1% increase in card penetration each year would raise GDP by about 0.0258% (or 0.0246%). This corresponds to almost a $1.3 billion increase in GDP in Mexico and a $152 million increase in GDP for Vietnam over the sample period. The final row shows if instead Mexico (or Vietnam) consistently had the highest observed card penetration rate, GDP would receive a 0.0917% (or .0875%) boost were penetration to increase by a 1% each year. This translates to almost a $4.6 bil-lion increase in GDP for Mexico over the sample period (or a $541 million increase in GDP for Vietnam). Therefore, using Mexico and Vietnam, the benefits to GDP of higher card us-age are clearly illustrated.
Experiment Table: Increase in GDP from a 1% Increase in Card Usage
Mexico VietnamCard penetration % U.S. $bil, change % U.S. $bil, changeActual 0.0184 0.9217 0.0125 0.0774Sample Median 0.0258 1.2892 0.0246 0.1521Sample Maximum 0.0917 4.5911 0.0875 0.5406

MOODY’S ANALYTICS
14 FEBRUARY 2016
Part VII: The Evolution of the Report’s Methodology
Overall, the methodology to calculate the increase in consumption and GDP from increases in card usage is consistent with the methodology of earlier reports.
The 2012 report, which included 56 coun-tries, showed that payments made using credit and debit cards as a percent of total spending increased GDP by $534 billion in emerging economies and by $449 billion in developed countries. This study, which included 70 countries, found a $125 billion increase in emerging economies and a $171 billion increase in developed countries.
Emerging markets benefited more in the 2012 report largely due to the role of China, which experienced exponential growth in card usage during the previous sample period and consequently significantly impacted the total contribution to GDP for emerging markets. Specifically, increased card usage in China correlated with an increase in GDP of an estimated $374.5 billion, which accounted for about 70% of the emerging economies’ share of increase in GDP. In this study, as the Chinese market has matured significantly, it experienced a more modest benefit of a $17.8 billion increase in GDP from increased card us-age. As such, China accounted for only 14% of emerging markets’ total increase in GDP.
The graph above illustrates the differ-ences between the results in the two reports for the countries covered in both reports but excluding large outliers, namely China and the United States. Increases in GDP were larger during the 2012 study for the major-ity of countries in the sample. However, countries that had larger estimates for the increase in GDP from increased card usage in the 2012 study also had larger estimates for
the increase in GDP from increased card us-age in the current study. The difference in the relative size of the increase in GDP comes from a change in methodology. The 2012 study methodology calculated the contribu-tion to GDP based on a country’s card usage in a year relative to its minimum card usage, whereas this study looks at the contribution of card usage based on the aggregation of yearly changes in card usage.
The economic gains from higher card us-age remained the same in both reports. The 2012 study found a 1% increase in card pen-etration increased GDP by 0.03%, and the current study estimated a 0.04% increase in GDP. A 1% increase in card usage increased consumption by 0.06% of total consump-tion during both the earlier report and the most recent report. Countries still in reces-sion during the recent sample period would experience declining employment and GDP,
even though, in some cases, card penetration continued to increase.
While the calculation for increases in consumption and GDP due to increases in card usage remained consistent among reports, the calculation for job creation has evolved. Building upon the methodology used for the 2012 report, which calculated the cumulative labor productivity over 2008-2012, the current study additionally assumes that labor productivity remains constant in economies during each specific year. We can then estimate the number of jobs created by calculating the ratio of the increase in GDP due to credit card usage to the country’s labor productivity year by year and taking the average across the sample. Because of the change in methodology, the estimated number of jobs added in this re-port are not comparable to the estimates in the 2012 study.
20 30 40 50 60 70 80100
5
10
15
20
25
0
Increase in GDP due to card usage
"#""%
2015
Stu
dy
2012 Study
45° Line
Russia
UK
France
Brazil

MOODY’S ANALYTICS
15 FEBRUARY 2016
Part VIII: ConclusionIncreasing use of electronic payments—
which include credit, debit and prepaid cards in this report—boosts consumption and GDP. Moreover, the impact increases as penetration rises.
In the sample of 70 countries, which make up 95% of global GDP, card usage added $296 billion cumulatively to real GDP from 2011 to 2015. This amounts to 0.1% of total GDP per year for the 70 coun-tries over this period. For all economies and markets analyzed, there is a positive corre-lation between card penetration and usage and economic growth.
Increased use of electronic payments makes the economy more efficient as well. Increased usage reduces transac-tion costs and thus improves the flow of
goods and services. It helps consumers by making purchasing more convenient and efficient. Merchants in turn can manage their businesses better and benefit from higher sales.
Electronic payments usage also pro-motes consumer confidence and improves access to credit for the population. It also promotes financial inclusion for the most vulnerable by enabling those without access to the formal banking system a safe and efficient payment al-ternative to cash. Electronic payment usage also benefits governments, which can potentially collect more tax revenue thanks to a clear electronic trail and more transparent transactions that can be taxed more readily. This would be espe-
cially helpful in countries with a weak tax collection infrastructure.
Therefore, policy measures that promote open and market-driven electronic pay-ment solutions for consumers and a level and competitive acceptance and issuance landscape for electronic payment companies, merchants, and the banking sector could improve the economic environment at the market level. A sustainable payments system is not just about technology, but about driv-ing incentives for others to participate in it and derive value from doing so. Encouraging the growth of electronic payments gives consumers and merchants a choice and in-creases competition. When countries allow for competition and a level playing field, banks and consumers benefit.

MOODY’S ANALYTICS
16 FEBRUARY 2016
AppendixModel
Dependent Variable: Log(Real consumption per capita)Method: Pooled Least SquaresSample: 2011 2015Included observations: 5Cross-sections included: 70Total pool (balanced) observations: 350
Variable Coefficient Std. Error t-Statistic Prob. Constant 0.35 0.13 2.66 0.01Card Penetration, Developed Countries 0.18 0.19 0.93 0.35Card Penetration, Emerging Markets 0.2 0.15 1.37 0.17Log(Real Disposable income per capita), Developed Countries 0.64 0.1 6.26 0Log(Real Disposable income per capita), Emerging Markets 0.77 0.03 25.2 0Real interest rate, Developed Countries 0 0 -0.39 0.7Real interest rate, Emerging Markets 0 0 1.08 0.28Trend, Emerging Markets 0.01 0 4.4 0Fixed Effects (Cross)Fixed Effects (Period)
Effects SpecificationCross-section fixed (dummy variables)Period fixed (dummy variables)
R-squared 0.99961 Mean dependent var 1.9375Adjusted R-squared 0.9995 S.D. dependent var 1.18613S.E. of regression 0.02644 Akaike info criterion -4.23653Sum squared resid 0.19081 Schwarz criterion -3.38778Log likelihood 818.392 Hannan-Quinn criter. -3.8987F-statistic 9239.861 Durbin-Watson stat 1.23219Prob(F-statistic) 0

MOODY’S ANALYTICS
17 FEBRUARY 2016
Tables
Country 2012 2013 2014 2015 TotalUAE 1.44 0.73 0.88 0.64 3.70Argentina 1.29 1.26 1.34 1.41 5.30Australia 1.91 3.26 3.45 3.31 11.93Austria 0.43 0.43 0.39 0.29 1.55Azerbaijan 0.00 0.02 0.02 0.03 0.07Belgium 0.51 0.34 0.01 -0.04 0.83Brazil 4.50 4.26 4.63 4.64 18.04Canada 1.43 1.16 2.41 2.50 7.50Switzerland 0.81 0.64 0.08 0.12 1.65Chile 0.70 1.16 0.36 0.38 2.60China 17.46 -3.11 1.64 1.79 17.79Colombia 0.41 0.41 0.39 0.38 1.59Czech Republic 0.36 0.21 0.20 0.19 0.95Germany 3.29 3.08 3.35 2.27 11.99Denmark 0.48 0.60 0.47 0.33 1.88Egypt 0.04 -0.00 0.03 0.02 0.10Spain 0.04 0.68 -0.25 -0.10 0.37Finland 0.13 0.01 -0.31 -0.06 -0.23France 0.84 0.63 1.16 0.42 3.06UK -0.61 6.07 1.91 5.05 12.42Ghana 0.02 0.00 0.01 0.01 0.05Greece -0.01 0.01 -0.00 -0.01 -0.02Hong Kong 0.39 0.21 0.21 0.11 0.92Hungary 0.63 0.29 0.25 0.23 1.41Indonesia 1.07 0.00 0.45 0.64 2.17India 0.97 1.30 1.65 2.16 6.08Ireland 0.45 0.37 0.72 0.47 2.01Israel -0.11 0.17 -0.03 0.01 0.04Italy 3.65 2.94 1.46 2.11 10.17Jordan 0.01 0.01 0.01 0.01 0.04Japan 1.88 2.94 2.49 3.43 10.74Kazakhstan 0.03 0.06 0.05 0.06 0.21Kenya 0.01 0.02 0.02 0.02 0.07Cambodia 0.01 0.01 0.01 0.01 0.03South Korea 0.61 0.24 0.77 0.62 2.23Kuwait -0.07 0.03 0.18 0.16 0.30Lebanon -0.01 0.02 0.03 0.03 0.08Sri Lanka 0.02 0.01 0.02 0.06 0.12Morocco 0.01 0.08 0.04 0.04 0.17Mexico 2.49 1.58 1.91 1.86 7.84Myanmar 0.00 0.01 0.02 0.01 0.04Malaysia -0.14 0.19 0.20 0.23 0.49Nigeria -0.00 0.16 0.20 0.27 0.64Netherlands 0.64 0.91 0.93 0.29 2.77Norway 0.47 -0.02 0.26 0.39 1.11New Zealand 0.02 0.17 0.13 0.10 0.42Oman 0.05 0.08 0.09 0.08 0.29Peru 0.15 0.85 0.32 0.28 1.61Philippines 0.01 0.04 0.04 0.01 0.10Poland 0.66 0.85 1.28 1.51 4.30Puerto Rico 0.31 -0.18 0.10 0.12 0.35Portugal 0.17 0.25 0.25 0.17 0.84
Country 2012 2013 2014 2015 TotalQatar 0.24 0.03 0.12 0.12 0.51Russia 6.71 7.35 6.51 5.36 25.93Rwanda 0.00 0.00 0.00 0.00 0.01Saudi Arabia 2.23 -0.40 0.85 0.74 3.43Singapore 0.25 0.35 0.33 0.23 1.17Serbia 0.05 0.07 0.05 0.05 0.23Slovakia 0.16 0.07 0.25 -0.01 0.46Sweden 1.01 0.06 -0.09 -0.26 0.71Thailand 1.10 0.67 0.71 0.71 3.18Tunisia 0.00 -0.00 0.00 0.00 -0.00Turkey 5.10 1.79 -0.24 0.86 7.51Taiwan 0.24 0.59 0.60 0.44 1.87Ukraine 0.24 0.13 0.07 0.02 0.46Uruguay 0.03 -0.01 0.07 0.29 0.38USA 0.17 25.60 27.13 28.65 81.55Venezuela 1.48 1.49 0.50 0.47 3.93Vietnam 0.23 0.19 0.23 0.23 0.88South Africa 0.96 0.91 0.69 0.56 3.11
Total 70.09 74.31 74.06 77.52 295.99
Table 1: Card Usage’s Contribution to GDP, constant 2011 U.S. $bil

MOODY’S ANALYTICS
18 FEBRUARY 2016
Country 2012 2013 2014 2015Average weighted by
Consumption, %UAE 0.87 0.42 0.48 0.34 0.52Argentina 0.34 0.32 0.34 0.36 0.34Australia 0.23 0.39 0.40 0.37 0.35Austria 0.19 0.19 0.18 0.13 0.17Azerbaijan 0.01 0.06 0.07 0.07 0.06Belgium 0.19 0.12 0.00 -0.01 0.07Brazil 0.28 0.25 0.27 0.28 0.27Canada 0.14 0.11 0.23 0.23 0.18Switzerland 0.21 0.16 0.02 0.03 0.10Chile 0.43 0.68 0.21 0.21 0.38China 0.62 -0.10 0.05 0.05 0.14Colombia 0.19 0.19 0.17 0.16 0.17Czech Republic 0.34 0.19 0.18 0.17 0.22Germany 0.16 0.15 0.16 0.10 0.14Denmark 0.30 0.37 0.29 0.20 0.29Egypt 0.02 -0.00 0.02 0.01 0.01Spain 0.00 0.08 -0.03 -0.01 0.01Finland 0.09 0.01 -0.21 -0.04 -0.04France 0.05 0.04 0.07 0.03 0.05UK -0.04 0.35 0.11 0.27 0.18Ghana 0.08 0.01 0.06 0.08 0.06Greece -0.01 0.01 -0.00 -0.01 -0.00Hong Kong 0.24 0.12 0.12 0.06 0.13Hungary 0.73 0.34 0.29 0.26 0.40Indonesia 0.21 0.00 0.08 0.10 0.10India 0.09 0.11 0.13 0.16 0.12Ireland 0.39 0.32 0.61 0.38 0.42Israel -0.07 0.11 -0.02 0.01 0.01Italy 0.27 0.22 0.11 0.16 0.19Jordan 0.05 0.03 0.03 0.03 0.04Japan 0.05 0.08 0.07 0.09 0.07Kazakhstan 0.04 0.06 0.06 0.07 0.06Kenya 0.02 0.05 0.05 0.04 0.04Cambodia 0.10 0.09 0.05 0.05 0.07South Korea 0.08 0.03 0.09 0.07 0.07Kuwait -0.16 0.06 0.42 0.38 0.18Lebanon -0.02 0.06 0.10 0.09 0.06Sri Lanka 0.06 0.03 0.05 0.15 0.07Morocco 0.01 0.12 0.06 0.07 0.07Mexico 0.31 0.19 0.22 0.21 0.23Myanmar 0.00 0.03 0.05 0.01 0.02Malaysia -0.09 0.12 0.12 0.13 0.07Nigeria -0.00 0.05 0.07 0.09 0.05Netherlands 0.16 0.23 0.24 0.07 0.17Norway 0.23 -0.01 0.12 0.18 0.13New Zealand 0.02 0.16 0.13 0.09 0.10Oman 0.21 0.34 0.39 0.32 0.32Peru 0.14 0.74 0.27 0.23 0.35Philippines 0.00 0.02 0.02 0.01 0.01Poland 0.21 0.26 0.39 0.44 0.33Puerto Rico 0.45 -0.25 0.14 0.17 0.13Portugal 0.11 0.17 0.16 0.11 0.14Qatar 1.02 0.10 0.43 0.41 0.47Russia 0.67 0.70 0.61 0.57 0.64Rwanda 0.01 0.03 0.03 0.04 0.03
Table 1A: Card Usage’s Contribution to Consumption, %
Country 2012 2013 2014 2015Average weighted by
Consumption, %Saudi Arabia 1.10 -0.19 0.39 0.32 0.40Singapore 0.25 0.34 0.31 0.21 0.27Serbia 0.17 0.22 0.19 0.19 0.19Slovakia 0.28 0.12 0.43 -0.02 0.20Sweden 0.38 0.02 -0.03 -0.09 0.07Thailand 0.53 0.32 0.34 0.33 0.38Tunisia 0.01 -0.01 0.00 0.00 -0.00Turkey 0.93 0.31 -0.04 0.14 0.32Taiwan 0.09 0.21 0.21 0.15 0.17Ukraine 0.20 0.10 0.06 0.02 0.10Uruguay 0.10 -0.04 0.19 0.77 0.26USA 0.00 0.23 0.24 0.25 0.18Venezuela 0.78 0.75 0.26 0.27 0.52Vietnam 0.25 0.20 0.23 0.21 0.22South Africa 0.38 0.34 0.26 0.20 0.29
Total 0.18 0.19 0.18 0.19 0.18

MOODY’S ANALYTICS
19 FEBRUARY 2016
Country 2012 2013 2014 2015Average Weighted
by GDP, %UAE 0.39 0.19 0.22 0.15 0.23Argentina 0.23 0.22 0.23 0.24 0.23Australia 0.12 0.21 0.21 0.20 0.19Austria 0.10 0.10 0.09 0.07 0.09Azerbaijan 0.00 0.03 0.03 0.03 0.03Belgium 0.10 0.06 0.00 -0.01 0.04Brazil 0.17 0.16 0.17 0.17 0.17Canada 0.08 0.06 0.13 0.13 0.10Switzerland 0.12 0.09 0.01 0.02 0.06Chile 0.26 0.42 0.13 0.13 0.23China 0.22 -0.04 0.02 0.02 0.05Colombia 0.12 0.11 0.10 0.10 0.11Czech Republic 0.16 0.09 0.09 0.08 0.11Germany 0.09 0.08 0.09 0.06 0.08Denmark 0.14 0.18 0.14 0.09 0.14Egypt 0.02 -0.00 0.01 0.01 0.01Spain 0.00 0.05 -0.02 -0.01 0.01Finland 0.05 0.00 -0.12 -0.02 -0.02France 0.03 0.02 0.04 0.01 0.03UK -0.02 0.23 0.07 0.18 0.11Ghana 0.04 0.01 0.02 0.03 0.03Greece -0.01 0.00 -0.00 -0.01 -0.00Hong Kong 0.16 0.08 0.08 0.04 0.09Hungary 0.46 0.21 0.17 0.16 0.25Indonesia 0.11 0.00 0.04 0.06 0.05India 0.05 0.06 0.08 0.09 0.07Ireland 0.19 0.15 0.28 0.17 0.20Israel -0.04 0.06 -0.01 0.00 0.00Italy 0.16 0.14 0.07 0.10 0.12Jordan 0.04 0.03 0.03 0.02 0.03Japan 0.03 0.05 0.04 0.06 0.04Kazakhstan 0.02 0.03 0.02 0.03 0.02Kenya 0.02 0.05 0.04 0.03 0.03Cambodia 0.08 0.07 0.04 0.04 0.05South Korea 0.05 0.02 0.06 0.05 0.04Kuwait -0.04 0.02 0.11 0.10 0.04Lebanon -0.01 0.05 0.08 0.07 0.05Sri Lanka 0.04 0.02 0.03 0.08 0.04Morocco 0.01 0.07 0.03 0.04 0.04Mexico 0.21 0.13 0.15 0.14 0.16Myanmar 0.00 0.02 0.04 0.01 0.02Malaysia -0.04 0.06 0.06 0.06 0.04Nigeria -0.00 0.04 0.04 0.05 0.03Netherlands 0.07 0.10 0.10 0.03 0.08Norway 0.09 -0.00 0.05 0.07 0.05New Zealand 0.01 0.10 0.07 0.05 0.06Oman 0.06 0.10 0.12 0.10 0.10Peru 0.08 0.45 0.16 0.14 0.21Philippines 0.00 0.01 0.01 0.00 0.01Poland 0.12 0.16 0.23 0.26 0.19Puerto Rico 0.31 -0.17 0.10 0.12 0.09Portugal 0.07 0.11 0.11 0.07 0.09Qatar 0.13 0.01 0.06 0.06 0.07Russia 0.34 0.37 0.33 0.28 0.33Rwanda 0.00 0.02 0.02 0.03 0.02
Table 1B: Card Usage’s Contribution to GDP, %
Country 2012 2013 2014 2015Average Weighted
by GDP, %Saudi Arabia 0.32 -0.06 0.11 0.10 0.12Singapore 0.09 0.12 0.11 0.07 0.10Serbia 0.11 0.14 0.12 0.12 0.12Slovakia 0.16 0.07 0.24 -0.01 0.11Sweden 0.18 0.01 -0.02 -0.04 0.03Thailand 0.28 0.16 0.17 0.17 0.19Tunisia 0.00 -0.01 0.00 0.00 -0.00Turkey 0.64 0.22 -0.03 0.10 0.22Taiwan 0.05 0.12 0.11 0.08 0.09Ukraine 0.15 0.08 0.05 0.01 0.07Uruguay 0.07 -0.02 0.13 0.52 0.18USA 0.00 0.16 0.16 0.17 0.12Venezuela 0.44 0.43 0.15 0.15 0.30Vietnam 0.16 0.13 0.15 0.14 0.14South Africa 0.23 0.21 0.16 0.12 0.18
Total 0.10 0.10 0.10 0.10 0.10

MOODY’S ANALYTICS
20 FEBRUARY 2016
Table 2A: Labor Productivity, Constant 2011 U.S. $bil per worker
Country 2011 2012 2013 2014 2015 UAE 60,918.69 63,269.42 64,825.69 66,892.19 67,999.30 Argentina 32,080.36 31,892.79 32,166.65 31,873.37 32,328.41 Australia 134,192.28 137,323.11 138,845.12 141,472.19 139,913.65 Austria 106,053.95 105,997.57 105,760.41 106,052.95 106,580.31 Azerbaijan 14,909.73 15,040.41 15,599.89 15,766.36 16,132.76 Belgium 117,278.92 117,274.39 117,565.08 118,430.93 119,681.88 Brazil 26,640.60 26,569.06 26,951.31 26,878.67 26,291.75 Canada 103,921.44 104,399.34 105,257.98 107,190.45 107,695.01 Switzerland 159,973.58 160,226.76 161,165.30 161,516.14 160,683.07 Chile 33,626.23 34,758.17 35,506.30 35,599.62 35,878.19 China 9,527.22 10,226.25 10,971.59 11,724.93 12,449.82 Colombia 34,766.33 34,976.30 35,984.41 36,512.46 37,000.43 Czech Republic 45,861.80 45,319.02 44,644.37 45,195.97 46,580.95 Germany 90,361.01 89,870.19 89,664.92 90,282.10 91,020.92 Denmark 129,443.09 130,432.93 130,090.22 130,871.38 131,556.08 Egypt 10,089.07 10,247.76 10,429.80 10,621.91 11,032.79 Spain 81,256.47 82,670.05 83,614.65 83,744.99 84,018.06 Finland 110,818.41 108,790.97 108,746.22 108,711.99 109,254.73 France 111,028.95 111,129.72 112,173.55 112,196.73 113,537.93 UK 88,304.33 88,381.94 89,249.45 89,832.07 90,715.87 Ghana 3,952.75 4,109.27 4,219.54 4,296.94 4,356.93 Greece 71,113.69 72,302.89 73,684.98 73,735.68 72,490.39 Hong Kong 69,570.36 69,199.39 69,991.54 71,248.19 71,920.83 Hungary 37,217.88 35,999.02 35,985.76 35,362.23 35,553.86 Indonesia 8,064.74 8,290.56 8,658.16 8,918.73 8,942.28 India 4,019.72 4,185.36 4,362.88 4,560.60 4,746.24 Ireland 130,924.77 131,921.75 130,744.98 135,197.58 139,118.60 Israel 81,056.75 80,223.57 80,650.92 80,365.18 80,051.47 Italy 101,048.46 98,225.82 98,081.63 97,563.02 97,535.40 Jordan 20,132.07 20,286.97 20,283.49 19,925.95 19,572.24 Japan 94,221.18 96,151.70 96,823.00 96,116.14 96,455.55 Kazakhstan 22,701.96 23,209.41 24,393.38 25,231.58 25,400.15 Kenya 2,905.45 2,939.14 3,005.51 3,072.85 3,179.43 Cambodia 1,591.94 1,668.47 1,754.80 1,840.89 1,930.98 South Korea 49,659.01 49,895.59 50,552.96 51,134.55 51,800.87 Kuwait 95,037.58 95,893.23 90,960.06 86,595.56 83,497.59 Lebanon 27,179.38 27,465.07 27,661.20 27,880.78 28,105.99 Sri Lanka 7,201.92 7,830.77 8,354.91 8,917.24 9,438.04 Morocco 9,623.68 9,926.51 10,277.88 10,469.94 10,921.07 Mexico 24,852.48 24,965.76 25,101.53 25,541.05 25,548.56 Myanmar 2,006.00 1,960.00 1,969.86 2,160.69 2,217.90 Malaysia 24,383.86 25,051.58 24,646.00 25,648.41 26,374.63 Nigeria 8,858.86 8,976.51 9,181.72 9,483.70 9,586.52 Netherlands 107,902.42 106,108.51 106,471.00 108,257.77 109,774.35 Norway 195,566.70 197,091.77 197,756.84 199,897.91 203,673.61 New Zealand 74,526.60 76,307.54 78,183.94 77,812.71 78,113.42 Oman 49,149.22 44,688.84 40,736.91 37,535.75 35,453.39 Peru 11,037.40 11,454.89 11,928.11 12,129.00 12,394.43 Philippines 6,019.34 6,350.39 6,894.68 7,121.96 7,390.86 Poland 33,753.64 34,281.43 34,763.36 35,276.81 36,100.97 Puerto Rico 98,650.54 98,101.12 100,516.07 102,692.09 101,699.30 Portugal 50,715.02 50,795.67 52,550.11 52,196.24 52,489.46 Qatar 120,371.88 119,689.78 120,450.22 121,866.67 124,242.60 Russia 26,825.35 27,478.73 27,885.68 28,002.60 26,800.06 Rwanda 1,229.89 1,303.41 1,325.73 1,378.72 1,428.59

MOODY’S ANALYTICS
21 FEBRUARY 2016
Table 2A: Labor Productivity, Constant 2011 U.S. $bil per worker (Cont.)
Country 2011 2012 2013 2014 2015 Saudi Arabia 67,385.13 68,744.39 67,814.94 68,236.60 68,688.44 Singapore 85,981.22 85,816.05 87,549.67 86,933.86 86,654.13 Serbia 19,307.81 19,313.68 19,367.23 19,018.83 19,111.23 Slovakia 42,180.23 42,605.88 43,208.06 43,617.57 43,882.59 Sweden 121,688.21 120,986.54 121,200.43 122,348.76 124,861.94 Thailand 9,542.67 10,116.92 10,398.13 10,720.09 11,023.24 Tunisia 14,635.01 14,739.08 14,653.61 14,586.17 14,345.00 Turkey 33,406.07 33,078.55 33,493.89 32,798.56 32,777.09 Taiwan 45,497.50 45,784.74 46,351.97 47,615.86 47,288.67 Ukraine 8,441.78 8,465.44 8,437.82 8,426.91 8,220.13 Uruguay 29,711.60 30,517.86 31,859.92 32,897.25 34,028.12 USA 110,936.19 111,345.24 111,853.54 112,712.52 113,560.75 Venezuela 26,247.07 27,252.22 26,846.87 25,145.48 23,151.08 Vietnam 2,653.53 2,740.79 2,857.22 2,988.60 3,141.78 South Africa 29,705.56 29,618.64 29,376.88 29,277.41 28,793.36
Total 27,692.57 28,084.61 28,463.76 28,853.74 29,111.63

MOODY’S ANALYTICS
22 FEBRUARY 2016
Country 2012 2013 2014 2015 Average UAE 22.84 11.21 13.16 9.47 14.17 Argentina 40.53 39.09 41.97 43.58 41.29 Australia 13.90 23.51 24.38 23.66 21.36 Austria 4.08 4.07 3.70 2.74 3.65 Azerbaijan 0.15 1.23 1.52 1.60 1.13 Belgium 4.36 2.92 0.11 (0.35) 1.76 Brazil 169.35 158.24 172.38 176.54 169.13 Canada 13.69 11.07 22.48 23.21 17.61 Switzerland 5.08 3.96 0.46 0.73 2.56 Chile 20.08 32.70 10.20 10.64 18.40 China 1,707.84 (283.86) 140.27 144.14 427.10 Colombia 11.79 11.47 10.65 10.16 11.02 Czech Republic 7.94 4.60 4.40 4.00 5.23 Germany 36.58 34.36 37.11 24.95 33.25 Denmark 3.67 4.61 3.63 2.50 3.60 Egypt 4.38 (0.06) 3.09 1.80 2.30 Spain 0.49 8.10 (2.95) (1.22) 1.11 Finland 1.20 0.07 (2.83) (0.53) (0.52) France 7.53 5.65 10.35 3.73 6.81 UK (6.87) 67.97 21.31 55.62 34.51 Ghana 4.44 0.74 2.71 3.40 2.82 Greece (0.19) 0.13 (0.05) (0.21) (0.08) Hong Kong 5.68 3.04 2.97 1.47 3.29 Hungary 17.59 8.15 7.12 6.60 9.86 Indonesia 129.30 0.57 50.85 71.13 62.96 India 232.53 297.63 362.37 455.20 336.93 Ireland 3.43 2.83 5.34 3.36 3.74 Israel (1.33) 2.10 (0.38) 0.16 0.14 Italy 37.20 30.02 14.97 21.63 25.95 Jordan 0.62 0.38 0.39 0.38 0.44 Japan 19.52 30.33 25.94 35.59 27.84 Kazakhstan 1.36 2.44 2.12 2.38 2.08 Kenya 2.61 6.97 6.05 5.68 5.33 Cambodia 6.70 5.78 3.30 3.14 4.73 South Korea 12.18 4.77 14.98 11.90 10.96 Kuwait (0.68) 0.29 2.05 1.94 0.90 Lebanon (0.20) 0.77 1.20 1.10 0.72 Sri Lanka 3.07 1.29 2.44 6.87 3.42 Morocco 0.66 7.57 3.69 4.11 4.01 Mexico 99.87 62.77 74.83 72.66 77.54 Myanmar 0.25 5.55 11.41 2.49 4.92 Malaysia (5.50) 7.83 7.89 8.77 4.75 Nigeria (0.16) 17.81 21.39 28.48 16.88 Netherlands 6.01 8.52 8.58 2.68 6.45 Norway 2.39 (0.08) 1.32 1.91 1.39 New Zealand 0.27 2.13 1.70 1.22 1.33 Oman 1.01 1.88 2.46 2.24 1.90 Peru 13.05 71.39 26.56 22.98 33.49 Philippines 1.12 5.33 5.47 1.93 3.46 Poland 19.22 24.43 36.21 41.84 30.42 Puerto Rico 3.14 (1.75) 0.94 1.20 0.88 Portugal 3.38 4.75 4.79 3.24 4.04 Qatar 2.01 0.21 1.01 0.99 1.05 Russia 244.06 263.49 232.59 200.07 235.05 Rwanda 0.25 1.25 0.95 1.64 1.02 Saudi Arabia 32.49 (5.97) 12.53 10.84 12.47
Table 2: Jobs Added Due to Increased Card Penetration, ths
Country 2012 2013 2014 2015 Average Singapore 2.96 4.05 3.81 2.68 3.38 Serbia 2.58 3.44 2.85 2.84 2.93 Slovakia 3.73 1.53 5.62 (0.22) 2.66 Sweden 8.36 0.47 (0.77) (2.08) 1.49 Thailand 108.58 63.98 66.13 64.22 75.73 Tunisia 0.11 (0.21) 0.07 0.00 (0.01) Turkey 154.03 53.37 (7.21) 26.28 56.62 Taiwan 5.26 12.72 12.61 9.32 9.98 Ukraine 28.06 15.47 8.31 2.24 13.52 Uruguay 1.07 (0.39) 2.11 8.41 2.80 USA 1.57 228.85 240.70 252.26 180.85 Venezuela 54.26 55.52 19.71 20.25 37.44 Vietnam 82.36 67.74 76.80 72.44 74.84 South Africa 32.50 30.90 23.50 19.29 26.55
Total 2,531.07 2,645.79 2,602.07 2,686.81 2,616.43

MOODY’S ANALYTICS
23 FEBRUARY 2016
Country 2012 2013 2014 2015 TotalUAE 0.0844 0.0953 0.1105 0.1202 0.4105Argentina 0.1283 0.1465 0.1591 0.1751 0.6089Australia 0.8386 0.8858 0.9445 1.0021 3.6710Austria 0.0792 0.0835 0.0874 0.0905 0.3405Azerbaijan 0.0014 0.0018 0.0022 0.0026 0.0080Belgium 0.2250 0.2292 0.2315 0.2355 0.9212Brazil 1.0121 1.0901 1.1509 1.1548 4.4080Canada 1.1848 1.2249 1.2800 1.3306 5.0203Switzerland 0.2131 0.2242 0.2279 0.2322 0.8974Chile 0.0787 0.0949 0.1007 0.1063 0.3806China 3.1686 3.3714 3.6664 3.9847 14.1911Colombia 0.0441 0.0500 0.0560 0.0616 0.2117Czech Republic 0.0325 0.0347 0.0372 0.0402 0.1446Germany 0.5604 0.5955 0.6351 0.6693 2.4603Denmark 0.1560 0.1624 0.1681 0.1752 0.6617Egypt 0.0077 0.0075 0.0077 0.0082 0.0310Spain 0.2749 0.2733 0.2740 0.2813 1.1034Finland 0.1318 0.1315 0.1291 0.1302 0.5227France 1.1831 1.1950 1.2144 1.2384 4.8309UK 1.8108 1.9053 1.9741 2.1000 7.7902Ghana 0.0003 0.0004 0.0004 0.0005 0.0016Greece 0.0151 0.0148 0.0148 0.0147 0.0594Hong Kong 0.1864 0.1971 0.2055 0.2166 0.8057Hungary 0.0307 0.0336 0.0367 0.0399 0.1409Indonesia 0.0843 0.0890 0.0982 0.1098 0.3812India 0.0633 0.0796 0.1009 0.1302 0.3740Ireland 0.0927 0.0961 0.1053 0.1133 0.4073Israel 0.1161 0.1224 0.1266 0.1328 0.4978Italy 0.4023 0.4211 0.4373 0.4622 1.7229Jordan 0.0036 0.0040 0.0040 0.0042 0.0157Japan 0.9856 1.0314 1.0464 1.0724 4.1358Kazakhstan 0.0055 0.0071 0.0064 0.0071 0.0262Kenya 0.0018 0.0021 0.0024 0.0027 0.0089Cambodia 0.0005 0.0006 0.0007 0.0008 0.0026South Korea 0.7619 0.7810 0.8046 0.8289 3.1763Kuwait 0.0349 0.0364 0.0390 0.0411 0.1514Lebanon 0.0035 0.0036 0.0040 0.0044 0.0155Sri Lanka 0.0024 0.0025 0.0029 0.0038 0.0116Morocco 0.0043 0.0053 0.0059 0.0066 0.0221Mexico 0.1967 0.2176 0.2409 0.2665 0.9217Myanmar 0.0000 0.0001 0.0004 0.0004 0.0009Malaysia 0.0689 0.0744 0.0783 0.0843 0.3059Nigeria 0.0015 0.0036 0.0056 0.0085 0.0193Netherlands 0.2979 0.3029 0.3122 0.3215 1.2345Norway 0.2104 0.2158 0.2222 0.2310 0.8794New Zealand 0.1071 0.1119 0.1168 0.1211 0.4568Oman 0.0048 0.0059 0.0072 0.0083 0.0262Peru 0.0232 0.0329 0.0375 0.0415 0.1350Philippines 0.0320 0.0342 0.0364 0.0389 0.1416Poland 0.0870 0.0957 0.1109 0.1295 0.4230Puerto Rico 0.0213 0.0196 0.0207 0.0220 0.0836Portugal 0.1101 0.1112 0.1162 0.1211 0.4586Qatar 0.0157 0.0179 0.0206 0.0228 0.0769Russia 0.2339 0.3189 0.3880 0.3946 1.3353Rwanda 0.0000 0.0000 0.0001 0.0001 0.0002Saudi Arabia 0.1033 0.1025 0.1168 0.1283 0.4508
Table 3: Change in Consumption due to 1% Increase in Card Usage Constant 2011 U.S. $bil
Country 2012 2013 2014 2015 TotalSingapore 0.0867 0.0933 0.0989 0.1049 0.3838Serbia 0.0049 0.0056 0.0059 0.0065 0.0230Slovakia 0.0140 0.0145 0.0173 0.0175 0.0634Sweden 0.2687 0.2743 0.2795 0.2835 1.1059Thailand 0.0669 0.0741 0.0817 0.0906 0.3134Tunisia 0.0011 0.0010 0.0011 0.0011 0.0042Turkey 0.4144 0.4535 0.4575 0.4849 1.8102Taiwan 0.1127 0.1212 0.1308 0.1374 0.5021Ukraine 0.0144 0.0167 0.0159 0.0123 0.0593Uruguay 0.0069 0.0071 0.0081 0.0111 0.0333USA 7.1633 7.5410 8.0153 8.5528 31.2724Venezuela 0.1413 0.1628 0.1617 0.1529 0.6186Vietnam 0.0149 0.0175 0.0207 0.0243 0.0774South Africa 0.1344 0.1474 0.1562 0.1645 0.6025
Total 23.9689 25.3260 26.7797 28.3157 104.3903

MOODY’S ANALYTICS
24 FEBRUARY 2016
Country 2012 2013 2014 2015Weighted
AverageUAE 0.0510 0.0551 0.0599 0.0633 0.0576Argentina 0.0340 0.0372 0.0406 0.0441 0.0390Australia 0.1014 0.1053 0.1093 0.1130 0.1074Austria 0.0354 0.0374 0.0391 0.0404 0.0381Azerbaijan 0.0053 0.0059 0.0067 0.0074 0.0064Belgium 0.0822 0.0834 0.0835 0.0833 0.0831Brazil 0.0620 0.0645 0.0672 0.0700 0.0660Canada 0.1163 0.1174 0.1196 0.1219 0.1189Switzerland 0.0551 0.0567 0.0569 0.0572 0.0565Chile 0.0485 0.0552 0.0573 0.0594 0.0553China 0.1117 0.1106 0.1111 0.1116 0.1113Colombia 0.0206 0.0224 0.0241 0.0257 0.0233Czech Republic 0.0303 0.0322 0.0340 0.0356 0.0331Germany 0.0267 0.0281 0.0297 0.0308 0.0288Denmark 0.0975 0.1012 0.1041 0.1061 0.1023Egypt 0.0040 0.0039 0.0041 0.0042 0.0041Spain 0.0329 0.0337 0.0334 0.0333 0.0333Finland 0.0892 0.0893 0.0872 0.0868 0.0881France 0.0743 0.0747 0.0754 0.0756 0.0750UK 0.1065 0.1100 0.1111 0.1138 0.1104Ghana 0.0013 0.0014 0.0020 0.0028 0.0018Greece 0.0081 0.0082 0.0082 0.0081 0.0081Hong Kong 0.1139 0.1151 0.1163 0.1169 0.1156Hungary 0.0353 0.0387 0.0415 0.0441 0.0400Indonesia 0.0161 0.0162 0.0169 0.0180 0.0168India 0.0056 0.0067 0.0080 0.0096 0.0076Ireland 0.0794 0.0825 0.0886 0.0924 0.0858Israel 0.0760 0.0771 0.0769 0.0770 0.0768Italy 0.0298 0.0321 0.0332 0.0348 0.0325Jordan 0.0155 0.0158 0.0161 0.0164 0.0160Japan 0.0270 0.0278 0.0285 0.0294 0.0281Kazakhstan 0.0062 0.0068 0.0074 0.0080 0.0071Kenya 0.0049 0.0055 0.0059 0.0064 0.0057Cambodia 0.0046 0.0055 0.0060 0.0065 0.0057South Korea 0.0944 0.0947 0.0956 0.0963 0.0953Kuwait 0.0874 0.0880 0.0922 0.0960 0.0910Lebanon 0.0101 0.0108 0.0118 0.0126 0.0113Sri Lanka 0.0062 0.0064 0.0070 0.0084 0.0070Morocco 0.0073 0.0086 0.0092 0.0098 0.0088Mexico 0.0242 0.0260 0.0283 0.0304 0.0273Myanmar 0.0000 0.0003 0.0008 0.0009 0.0005Malaysia 0.0449 0.0461 0.0473 0.0486 0.0468Nigeria 0.0006 0.0012 0.0018 0.0027 0.0016Netherlands 0.0749 0.0772 0.0796 0.0803 0.0780Norway 0.1013 0.1013 0.1025 0.1042 0.1024New Zealand 0.1088 0.1105 0.1117 0.1126 0.1110Oman 0.0226 0.0260 0.0299 0.0330 0.0281Peru 0.0213 0.0287 0.0314 0.0338 0.0290Philippines 0.0183 0.0185 0.0187 0.0187 0.0185Poland 0.0271 0.0297 0.0336 0.0380 0.0322Puerto Rico 0.0309 0.0284 0.0298 0.0315 0.0301Portugal 0.0721 0.0738 0.0754 0.0765 0.0745Qatar 0.0663 0.0672 0.0715 0.0756 0.0704Russia 0.0235 0.0304 0.0366 0.0423 0.0331
Table 3A: Consumption Elasticity w.r.t. Card Penetration, %
Country 2012 2013 2014 2015Weighted
AverageRwanda 0.0005 0.0008 0.0011 0.0015 0.0010Saudi Arabia 0.0507 0.0488 0.0526 0.0559 0.0521Singapore 0.0849 0.0883 0.0913 0.0934 0.0896Serbia 0.0168 0.0190 0.0210 0.0229 0.0199Slovakia 0.0250 0.0262 0.0305 0.0304 0.0281Sweden 0.1021 0.1023 0.1020 0.1010 0.1019Thailand 0.0323 0.0354 0.0388 0.0421 0.0372Tunisia 0.0037 0.0036 0.0037 0.0037 0.0037Turkey 0.0753 0.0784 0.0780 0.0794 0.0779Taiwan 0.0417 0.0438 0.0459 0.0475 0.0448Ukraine 0.0122 0.0133 0.0139 0.0141 0.0133Uruguay 0.0205 0.0202 0.0221 0.0297 0.0232USA 0.0660 0.0684 0.0708 0.0732 0.0697Venezuela 0.0746 0.0821 0.0847 0.0874 0.0821Vietnam 0.0162 0.0182 0.0204 0.0225 0.0195South Africa 0.0524 0.0558 0.0584 0.0604 0.0568
Total 0.0615 0.0635 0.0656 0.0679 0.0647

MOODY’S ANALYTICS
25 FEBRUARY 2016
Country 2012 2013 2014 2015Weighted
AverageUAE 0.0227 0.0245 0.0272 0.0287 0.0259Argentina 0.0228 0.0253 0.0273 0.0295 0.0263Australia 0.0538 0.0557 0.0579 0.0610 0.0572Austria 0.0183 0.0192 0.0200 0.0206 0.0195Azerbaijan 0.0022 0.0025 0.0031 0.0034 0.0028Belgium 0.0425 0.0432 0.0431 0.0435 0.0431Brazil 0.0379 0.0397 0.0418 0.0435 0.0407Canada 0.0651 0.0658 0.0671 0.0689 0.0667Switzerland 0.0302 0.0312 0.0311 0.0314 0.0310Chile 0.0297 0.0344 0.0358 0.0370 0.0343China 0.0404 0.0399 0.0404 0.0411 0.0405Colombia 0.0126 0.0136 0.0146 0.0156 0.0142Czech Republic 0.0146 0.0158 0.0166 0.0171 0.0160Germany 0.0148 0.0157 0.0165 0.0171 0.0160Denmark 0.0456 0.0476 0.0486 0.0498 0.0479Egypt 0.0032 0.0030 0.0030 0.0031 0.0031Spain 0.0189 0.0191 0.0189 0.0188 0.0189Finland 0.0488 0.0492 0.0485 0.0489 0.0489France 0.0412 0.0413 0.0419 0.0423 0.0417UK 0.0690 0.0711 0.0715 0.0743 0.0715Ghana 0.0007 0.0008 0.0008 0.0011 0.0008Greece 0.0056 0.0057 0.0057 0.0057 0.0057Hong Kong 0.0738 0.0757 0.0770 0.0793 0.0765Hungary 0.0222 0.0240 0.0253 0.0267 0.0246Indonesia 0.0089 0.0089 0.0094 0.0100 0.0093India 0.0033 0.0039 0.0046 0.0055 0.0044Ireland 0.0382 0.0391 0.0407 0.0415 0.0399Israel 0.0431 0.0440 0.0443 0.0455 0.0442Italy 0.0181 0.0193 0.0202 0.0212 0.0197Jordan 0.0122 0.0130 0.0127 0.0130 0.0127Japan 0.0164 0.0169 0.0171 0.0174 0.0170Kazakhstan 0.0028 0.0034 0.0029 0.0032 0.0031Kenya 0.0041 0.0045 0.0048 0.0052 0.0047Cambodia 0.0036 0.0042 0.0045 0.0048 0.0043South Korea 0.0619 0.0616 0.0615 0.0617 0.0617Kuwait 0.0210 0.0218 0.0233 0.0243 0.0226Lebanon 0.0085 0.0086 0.0093 0.0100 0.0091Sri Lanka 0.0038 0.0037 0.0040 0.0049 0.0041Morocco 0.0041 0.0049 0.0052 0.0056 0.0050Mexico 0.0162 0.0176 0.0191 0.0206 0.0184Myanmar 0.0000 0.0002 0.0006 0.0007 0.0004Malaysia 0.0219 0.0226 0.0224 0.0231 0.0225Nigeria 0.0003 0.0008 0.0011 0.0017 0.0010Netherlands 0.0337 0.0344 0.0351 0.0353 0.0346Norway 0.0412 0.0418 0.0421 0.0428 0.0420New Zealand 0.0630 0.0643 0.0651 0.0659 0.0646Oman 0.0067 0.0079 0.0093 0.0102 0.0086Peru 0.0128 0.0172 0.0191 0.0206 0.0176Philippines 0.0134 0.0134 0.0134 0.0136 0.0135Poland 0.0163 0.0177 0.0198 0.0223 0.0191Puerto Rico 0.0211 0.0194 0.0204 0.0218 0.0207Portugal 0.0468 0.0478 0.0495 0.0508 0.0487Qatar 0.0088 0.0096 0.0106 0.0112 0.0101Russia 0.0119 0.0160 0.0194 0.0204 0.0169Rwanda 0.0004 0.0006 0.0007 0.0010 0.0007
Table 3B: GDP Elasticity w.r.t. Card Penetration, %
Country 2012 2013 2014 2015Weighted
AverageSaudi Arabia 0.0146 0.0141 0.0156 0.0165 0.0153Singapore 0.0304 0.0314 0.0323 0.0336 0.0319Serbia 0.0107 0.0120 0.0128 0.0140 0.0124Slovakia 0.0141 0.0144 0.0168 0.0165 0.0155Sweden 0.0477 0.0481 0.0479 0.0470 0.0477Thailand 0.0169 0.0182 0.0199 0.0214 0.0192Tunisia 0.0023 0.0021 0.0021 0.0021 0.0022Turkey 0.0523 0.0549 0.0538 0.0554 0.0542Taiwan 0.0227 0.0238 0.0248 0.0259 0.0243Ukraine 0.0088 0.0102 0.0104 0.0093 0.0097Uruguay 0.0139 0.0137 0.0151 0.0201 0.0158USA 0.0452 0.0468 0.0486 0.0506 0.0479Venezuela 0.0417 0.0474 0.0487 0.0496 0.0468Vietnam 0.0105 0.0117 0.0131 0.0144 0.0125South Africa 0.0315 0.0337 0.0352 0.0366 0.0343
Total 0.0339 0.0350 0.0360 0.0372 0.0356

MOODY’S ANALYTICS
26 FEBRUARY 2016
Table 4
Consumption Without Card Contribution, Constant 2011 U.S. $bilRelative Change in Consumption with Changes in
Card Penetration vs No Change in PenetrationCountry 2012 2013 2014 2015 2015UAE 164.25 172.16 183.51 189.27 0.959Argentina 376.33 392.88 390.80 395.41 1.015Australia 824.82 837.89 860.63 883.23 0.994Austria 223.20 223.01 222.98 223.70 0.862Azerbaijan 26.97 29.71 33.17 34.51 1.001Belgium 273.23 274.33 277.22 282.65 0.990Brazil 1,628.16 1,685.43 1,707.45 1,644.35 1.000Canada 1,017.54 1,042.23 1,067.41 1,088.72 1.004Switzerland 385.94 394.78 400.54 405.92 1.008Chile 161.58 170.67 175.28 178.42 1.006China 2,820.40 3,050.59 3,297.54 3,567.69 1.001Colombia 214.13 222.38 232.10 239.66 0.998Czech Republic 106.84 107.73 109.32 112.51 0.996Germany 2,096.51 2,112.89 2,134.13 2,173.88 0.973Denmark 159.60 159.86 160.91 164.80 0.963Egypt 195.10 189.33 185.48 193.27 0.998Spain 836.26 810.01 820.28 845.27 1.006Finland 147.61 147.27 148.34 150.05 1.146France 1,592.39 1,600.01 1,609.99 1,636.90 0.973UK 1,700.84 1,725.95 1,775.21 1,840.06 1.048Ghana 23.04 25.86 18.63 19.28 1.005Greece 185.41 180.67 181.94 182.31 0.970Hong Kong 163.32 171.06 176.53 185.23 0.988Hungary 86.16 86.64 88.01 90.25 0.992Indonesia 521.16 550.63 579.29 609.89 1.006India 1,127.18 1,186.09 1,258.19 1,353.69 1.005Ireland 116.36 116.07 118.08 122.09 0.936Israel 152.75 158.56 164.60 172.46 1.006Italy 1,344.36 1,309.39 1,316.02 1,326.79 1.060Jordan 23.24 25.06 24.74 25.45 0.999Japan 3,650.74 3,710.50 3,675.30 3,644.97 0.969Kazakhstan 88.65 105.60 87.15 88.45 1.005Kenya 36.31 38.40 39.77 42.36 1.000Cambodia 10.92 11.29 11.76 12.58 1.000South Korea 806.28 824.33 840.56 859.69 0.992Kuwait 39.96 41.29 42.16 42.67 0.970Lebanon 34.72 33.56 33.97 34.65 0.996Sri Lanka 38.41 39.06 41.94 44.62 1.016Morocco 58.60 62.24 63.95 67.06 1.002Mexico 811.86 833.80 849.87 874.65 0.998Myanmar 41.71 42.51 47.33 49.32 0.990Malaysia 153.71 161.16 165.29 173.04 1.004Nigeria 239.87 308.19 306.37 318.43 1.006Netherlands 396.95 391.28 391.30 399.95 0.927Norway 207.14 213.15 216.50 221.25 1.026New Zealand 98.35 101.14 104.38 107.39 0.988Oman 21.29 22.68 23.86 24.92 0.988Peru 108.42 113.51 118.78 122.78 0.991Philippines 175.41 185.25 195.33 207.70 0.998Poland 320.34 320.95 328.90 339.08 1.023Puerto Rico 68.59 69.32 69.44 69.82 1.068Portugal 152.40 150.49 153.88 158.14 0.981Qatar 23.40 26.59 28.64 29.99 1.000
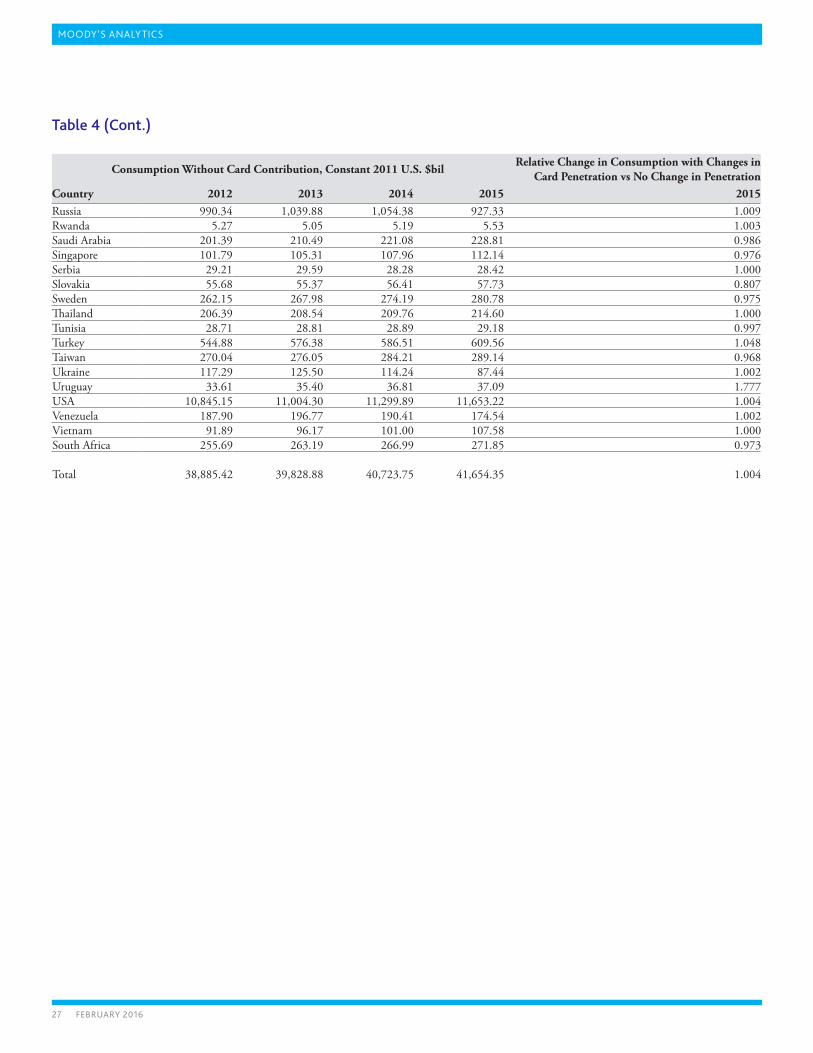
MOODY’S ANALYTICS
27 FEBRUARY 2016
Table 4 (Cont.)
Consumption Without Card Contribution, Constant 2011 U.S. $bilRelative Change in Consumption with Changes in
Card Penetration vs No Change in PenetrationCountry 2012 2013 2014 2015 2015Russia 990.34 1,039.88 1,054.38 927.33 1.009Rwanda 5.27 5.05 5.19 5.53 1.003Saudi Arabia 201.39 210.49 221.08 228.81 0.986Singapore 101.79 105.31 107.96 112.14 0.976Serbia 29.21 29.59 28.28 28.42 1.000Slovakia 55.68 55.37 56.41 57.73 0.807Sweden 262.15 267.98 274.19 280.78 0.975Thailand 206.39 208.54 209.76 214.60 1.000Tunisia 28.71 28.81 28.89 29.18 0.997Turkey 544.88 576.38 586.51 609.56 1.048Taiwan 270.04 276.05 284.21 289.14 0.968Ukraine 117.29 125.50 114.24 87.44 1.002Uruguay 33.61 35.40 36.81 37.09 1.777USA 10,845.15 11,004.30 11,299.89 11,653.22 1.004Venezuela 187.90 196.77 190.41 174.54 1.002Vietnam 91.89 96.17 101.00 107.58 1.000South Africa 255.69 263.19 266.99 271.85 0.973
Total 38,885.42 39,828.88 40,723.75 41,654.35 1.004

MOODY’S ANALYTICS
About the AuthorMark M. Zandi is chief economist of Moody’s Analytics, where he directs economic research. Moody’s Analytics, a subsidiary of Moody’s Corp., is a leading provider of economic research, data and analytical tools. Dr. Zandi is a cofounder of Economy.com, which Moody’s purchased in 2005.
Dr. Zandi’s broad research interests encompass macroeconomics, financial markets and public policy. His recent research has focused on mortgage finance reform and the determinants of mortgage foreclosure and personal bankruptcy. He has analyzed the economic impact of various tax and government spending policies and assessed the appropriate monetary policy response to bubbles in asset markets.
A trusted adviser to policymakers and an influential source of economic analysis for businesses, journalists and the public, Dr. Zandi frequently testifies before Congress on topics including the economic outlook, the nation’s daunting fiscal challenges, the merits of fiscal stimulus, financial regulatory reform, and foreclosure mitigation.
Dr. Zandi conducts regular briefings on the economy for corporate boards, trade associations and policymakers at all levels. He is on the board of directors of MGIC, the nation’s largest private mortgage insurance company, and The Reinvestment Fund, a large CDFI that makes investments in disadvantaged neighborhoods. He is often quoted in national and global publications and interviewed by major news media outlets, and is a frequent guest on CNBC, NPR, Meet the Press, CNN, and various other national networks and news programs.
Dr. Zandi is the author of Paying the Price: Ending the Great Recession and Beginning a New American Century, which provides an assessment of the monetary and fiscal policy response to the Great Recession. His other book, Financial Shock: A 360º Look at the Subprime Mortgage Implosion, and How to Avoid the Next Financial Crisis, is described by the New York Times as the “clearest guide” to the financial crisis.
Dr. Zandi earned his BS from the Wharton School at the University of Pennsylvania and his PhD at the University of Pennsylvania. He lives with his wife and three children in the suburbs of Philadelphia.
Sophia Koropeckyj is a managing director for Moody’s Analytics. Sophia oversees the firm’s publications and consulting projects, edits many of the publications, trains new staff members, and gives presentations to clients and trade groups. She covers labor markets, auto-related industries, and the Midwestern economy. Based in West Ches-ter PA, Sophia has been with Moody’s Analytics since 1994. Previously, she worked as an economist for the Great Lakes Trade Adjustment Assistance Center and WEFA. Sophia has completed all but the dissertation portion of her doctoral studies in economics at the University of Michigan. She earned a master’s degree in finance at Drexel University and a bachelor’s degree in economics and history at the University of Pennsylvania.
Virendra Singh is a director at Moody’s Analytics. He specializes in international economics and econometrics, and his recent work has focused on trade, capital flows and currency issues. Dr. Singh is responsible for the Moody’s Analytics global macroeconomic modeling and forecast. He writes on a variety of issues for the Dismal Scientist web site and the Regional Financial Review. Before joining Moody’s Analytics, Dr. Singh worked at the World Bank, the U.S. Treasury Department, and Global Insight. Dr. Singh received his PhD in economics from Temple University and his MA in economics from the Delhi School of Economics.
Paul Matsiras is an economist at Moody’s Analytics. He covers Connecticut along with several metropolitan regions. Internationally, Paul is responsible for the Netherlands and parts of Canada, and contributes to the World Forecast team. He earned a master’s degree in economics from the London School of Economics and has a bachelor’s degree in economics and statistics from the University of California, Berkeley.

MOODY’S ANALYTICS
About Moody’s Analytics
Moody’s Analytics helps capital markets and credit risk management professionals worldwide respond to an evolving
marketplace with confi dence. With its team of economists, the company offers unique tools and best practices for
measuring and managing risk through expertise and experience in credit analysis, economic research, and fi nancial
risk management. By offering leading-edge software and advisory services, as well as the proprietary credit research
produced by Moody’s Investors Service, Moody’s Analytics integrates and customizes its offerings to address specifi c
business challenges.
Concise and timely economic research by Moody’s Analytics supports fi rms and policymakers in strategic planning, product and sales forecasting, credit risk and sensitivity management, and investment research. Our economic research publications provide in-depth analysis of the global economy, including the U.S. and all of its state and metropolitan areas, all European countries and their subnational areas, Asia, and the Americas. We track and forecast economic growth and cover specialized topics such as labor markets, housing, consumer spending and credit, output and income, mortgage activity, demographics, central bank behavior, and prices. We also provide real-time monitoring of macroeconomic indicators and analysis on timely topics such as monetary policy and sovereign risk. Our clients include multinational corporations, governments at all levels, central banks, fi nancial regulators, retailers, mutual funds, fi nancial institutions, utilities, residential and commercial real estate fi rms, insurance companies, and professional investors.
Moody’s Analytics added the economic forecasting fi rm Economy.com to its portfolio in 2005. This unit is based in West Chester PA, a suburb of Philadelphia, with offi ces in London, Prague and Sydney. More information is available at www.economy.com.
Moody’s Analytics is a subsidiary of Moody’s Corporation (NYSE: MCO). Further information is available at www.moodysanalytics.com.
About Moody’s Corporation
Moody’s is an essential component of the global capital markets, providing credit ratings, research, tools and analysis that contribute to transparent and integrated fi nancial markets. Moody’s Corporation (NYSE: MCO) is the parent company of Moody’s Investors Service, which provides credit ratings and research covering debt instruments and securities, and Moody’s Analytics, which encompasses the growing array of Moody’s nonratings businesses, including risk management software for fi nancial institutions, quantitative credit analysis tools, economic research and data services, data and analytical tools for the structured fi nance market, and training and other professional services. The corporation, which reported revenue of $3.5 billion in 2015, employs approximately 10,400 people worldwide and maintains a presence in 36 countries.
© 2016, Moody’s Analytics Inc. and/or its licensors and affi liates (together, “Moody’s”). All rights reserved. ALL INFORMATION CONTAINED HEREIN IS PROTECTED BY COPYRIGHT LAW AND NONE OF SUCH INFORMATION MAY BE COPIED OR OTHERWISE REPRODUCED, REPACKAGED, FURTHER TRANSMITTED, TRANSFERRED, DISSEMINATED, REDISTRIBUTED OR RESOLD, OR STORED FOR SUBSEQUENT USE FOR ANY PURPOSE, IN WHOLE OR IN PART, IN ANY FORM OR MANNER OR BY ANY MEANS WHATSOEVER, BY ANY PERSON WITHOUT MOODY’S PRIOR WRITTEN CONSENT. All information contained herein is obtained by Moody’s from sources believed by it to be accurate and reliable. Because of the possibility of human and mechanical error as well as other factors, however, all information contained herein is provided “AS IS” without warranty of any kind. Under no circumstances shall Moody’s have any liability to any person or entity for (a) any loss or damage in whole or in part caused by, resulting from, or relating to, any error (negligent or otherwise) or other circumstance or contingency within or outside the control of Moody’s or any of its directors, offi cers, employees or agents in connection with the procurement, collection, compilation, analysis, interpretation, communication, publication or delivery of any such information, or (b) any direct, indirect, special, consequential, compensatory or incidental damages whatsoever (including without limitation, lost profi ts), even if Moody’s is advised in advance of the possibility of such damages, resulting from the use of or inability to use, any such information. The fi nancial reporting, analysis, projections, observations, and other information contained herein are, and must be construed solely as, statements of opinion and not statements of fact or recommendations to purchase, sell, or hold any securities. NO WARRANTY, EXPRESS OR IMPLIED, AS TO THE ACCURACY, TIMELINESS, COMPLETENESS, MERCHANTABILITY OR FITNESS FOR ANY PARTICULAR PURPOSE OF ANY SUCH OPINION OR INFORMATION IS GIVEN OR MADE BY MOODY’S IN ANY FORM OR MANNER WHATSOEVER. Each opinion must be weighed solely as one factor in any investment decision made by or on behalf of any user of the information contained herein, and each such user must accordingly make its own study and evaluation prior to investing.