Embed Size (px)
Citation preview

Analyst and Media Briefing FINANCIAL RESULTS AS OF SEPTEMBER 2016
15 November 2016

Jan to Sept 2016
HIGHLIGHTS FINANCIAL
GT Capital

Financial Highlights 9M 2016
Inclusive of non-recurring income and expenses
Consolidated Net Income +46%
Core Net Income +23%
Revenues +38%
Php12.3 billion
Php8.4 billion 9M 2015
Php9.3 billion
Php7.6 billion 9M 2015
Php157.1 billion
Php113.5 billion 9M 2015
TMP & TMBC - Auto Sales Php 129.7 billion +50%
GBP – Net Fees (up to May 31, 2016) Php 6.8 billion -23%
FLI & PCFI - Real Estate Sales and Interest income on Real Estate
Sales (PCFI revenue contribution Php3.8B or 41% of total)
Php 9.2 billion +46%
Equity in net income of associates (MPIC net income Php0.8B) Php 4.7 billion +14%
Gain on disposal of GBP (Php3.7B), CPAIC (Php0.23B) and TMBC
merger (Php0.14B)
Php 4.2 billion
3
*Total extraordinary gain of Php3.0B, net of tax
*Despite deconsolidating GBP

GT Capital 9M 2016 vs 9M 2015 Comparative in
Ph
p B
illio
n
Consolidated
Core and Non-Core Net Income
+46%
1Q 2015 1Q 2016
TMP +35%
MBTC -1%
AXA +15%
FLI +6%
GBPC NI contribution
Php451M (5 mos.)
MPIC NI contribution
Php809M (4 mos.)
PCFI NI contribution
Php188M*
Gain on sale of GBPC
(Php3.7B); sale of CPAIC
(Php0.23B) and TMBC
merger (Php0.14B)
12.3
9M 2015 9M 2016
8.4
4

GT Capital 9M 2016 vs 9M 2015 Comparative in
Ph
p B
illio
n
Consolidated
Core Net Income
+23%
7.6
9.3
9M 2015 9M 2016
5
TMP +35%
MBTC -1%
AXA +15%
FLI +6%
GBPC NI contribution
Php451M (5 mos.)
MPIC NI contribution
Php809M
PCFI NI contribution
Php188M*
*gross of Php149.3M amortization of FV adjustment

GT Capital Net Income Contribution
9M 2015 9M 2016
TMP
39.3%
MBT
33.5%
Fed
Land
10.8%
GBPC
10.2%
AXA
2.8%
TMBC
0.7% PCFI
0.2%
TMP
46.2%
MBT
27.5%
Fed
Land
9.8%
MPIC
7.0%
GBP
3.9%
AXA
2.8%
PCFI
1.6%
TFS
1.5% TMBC
1.2% CPA
-1.9%
6
TFS
1.6%


Peer Banks Highlights
Source: 17-Q Report of Banks as of 30 June 2016
1,816
1,321 1,250
BDO BPI MBT
1,479
965 931
BDO MBT BPI
Total Deposits (Php Billion)
Total Loans (Php Billion)
3.65% 3.25% 2.80%
MBT BDO BPI
Net Interest Margin – NIMs (%)
+14% +26% +19%
1,272 993
791
BDO BPI MBT
CASA Growth (Php Billion)
77.8
73.0
67.9
BDO MBT BPI
Loan to Deposit Ratio (%)
Source: 17-Q Report of Banks as of 30 September 2016; BDO, BPI press release
+17% industry growth
+21% +21% +16%
+17% industry growth

Peer Banks Highlights
Source: 17-Q Report of Banks as of 30 September 2016; BDO, BPI press release
2,208 1,712 1,591
BDO MBT BPI
215 201 166
BDO MBT BPI
17.6% 14.2%
12.9%
MBT BPI BDO
Total Equity (Php Billion)
Total Capital Adequacy Ratio (%)
Total Assets (Php Billion)
14.5% 13.3% 11.1%
MBT BPI BDO
Common Equity Tier 1 (CET1) Ratio (%)

10

+3%
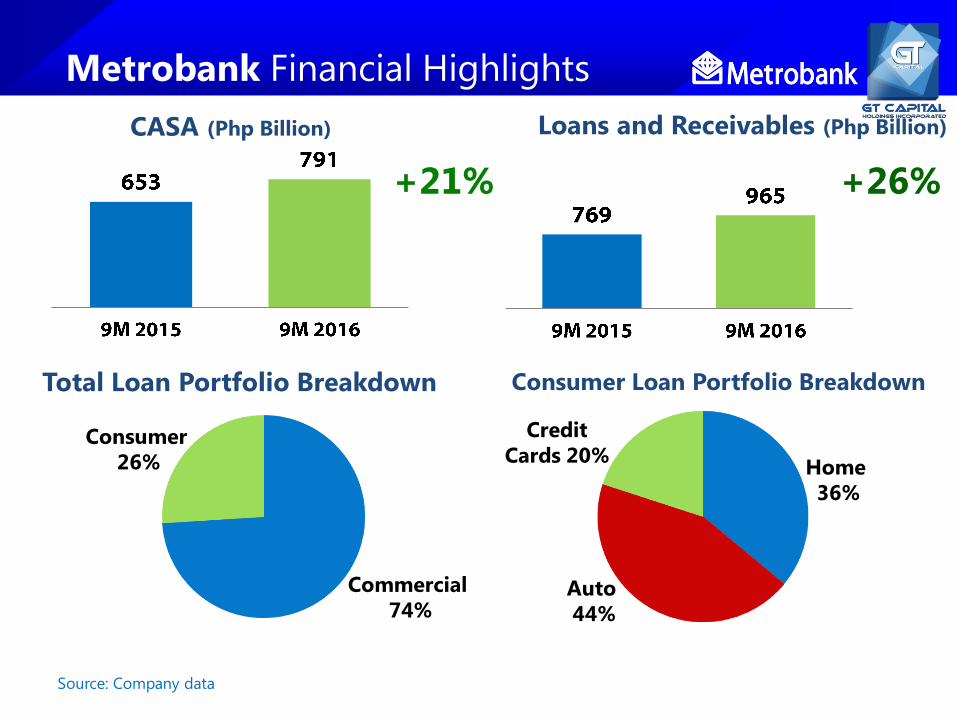
Total loan growth +26%
from Php769B to Php965B - Consumer +17%
- Commercial +29%
CASA deposit growth +21% from Php653B to Php791B - CASA ratio at 63.3% from 55.5%
NIMs at 3.65% from 3.59%
Provisions for credit and
impairment losses Php4.8B
Increase in OPEX from Php29B
to Php33B due to hiring of
front-line staff to improve
customer coverage and
investments in technology
Metrobank Financial Highlights
11
Revenues
in P
hp
Bil
lio
n
Net Income
in P
hp
Bil
lio
n -1%
36.3 39.0
14.1 17.4
9M 2015 9M 2016
9M 2015 9M 2016
+12%
0.5
13.3 12.6
Other Income +23%
Net Interest Income
+8%
50.4 56.4
Core Net Income
Other Income
12.8
Source: Company data
+21% +26%
Commercial
74%
Consumer
26%
Credit
Cards 20% Home
36%
Auto
44%
CASA (Php Billion) Loans and Receivables (Php Billion)
Total Loan Portfolio Breakdown Consumer Loan Portfolio Breakdown
Metrobank Financial Highlights


Quarterly reservation sales nationwide Growth still exists, but at a slower pace
Source: UBS Securities Philippines, Colliers International Philippines Research 14
0
10000
20000
30000
40000
50000
60000
70000
80000
90000
June2010
March2011
Dec2011
Sept2012
June2013
March2014
Dec2014
Sept2015
June2016
In m
illio
n p
eso
s
Reservation Sales
Overall Residential Php72B per quarter

New launches vs reservation sales in M. Manila Managed number of product launches to meet demand
Source: UBS Securities Philippines, Colliers International Philippines Research 15
Millio
ns
of
peso
s
Residential High-Rise
Reservation Sales

Office rental rates, Metro Manila More demand due to a growing macroeconomy
Source: Leechiu Property Consultants, October 2016 16

Federal Land is present where the demand is Grand Central Park BGC poised to take advantage
Source: Leechiu Property Consultants, October 2016 17
Percentage of property transactions
577,000 sqm
FY 2015 deals
transacted

18

Deliberate scaledown of project
launches in 2016
New projects launched: 2014 (5),
2015 (4) and 2016 (2) to date
Inventory -24% from 2,624 to
1,997 units
Real estate sales (Php5.9B) -2%
Rent Income +7% due to rate
escalation
7 New project launches for 2017
Gross Profit margin increased
from 30% to 36% (extensive cost
planning)
OPEX -8% due to operating
efficiencies in general and admin
costs
Revenues
in P
hp
Bil
lio
n
Net Income
in P
hp
Millio
n +6%
8.0 7.5
9M 2015 9M 2016
9M 2015 9M 2016
Federal Land Financial Highlights
19
-6%
1,072.5 1,139.8


Source: The Philippine Star
New developments in Cavite
21
Philippine Star (31 Oct 2016):
$50-B Cavite airport and
seaport project eyed
Sangley Point airport and port expansion
planned

Source: Metro Pacific
New developments in Cavite
22
LRT1 extension project
• Metro Pacific signed engineering, procurement, and construction (EPC)
agreement - signed February 12, 2016
• 11.7 km extension of LRT1 to Bacoor, Cavite
• Start of construction slated by 2017
• Php25B project finance loan in place, 64% earmarked for extension project

Source: MPIC
New developments in Cavite
23
C5 South Link
to Cavitex
• Expansion of Cavitex
project
• Groundbreaking was in
May 2016
• Php12.7 billion project;
7.6 km
• Construction expected to
start by Q1 2017; Target
completion in 2020

Source: MPIC
New developments in Cavite
24
CALAX • Ongoing preparation of
detailed engineering
design
• Right-of-way acquisition
50% accomplished
• Target completion 2020
• Start 1H 2017 for
Laguna portion
• Start 2H 2017 for
Cavite portion

CALAX
MCX
EPZA
EPZA
Alabang
Entertainment City
Cavitex
Daang-Hari
SLEX
Aveia
Federal Land/
Alveo
NAIA Expressway
C-5 South Link
Skyway Extension
LRT-1
Extension
LRT-6 CALAX
Exit
1,600 hectares
1
2
3
4
5
6 NLEX-SLEX Connector Road
25

26

Real estate sales -20% from Php4.3B to
Php 3.5B due to deliberate slowdown in
pre-selling to catch up with construction
backlog
House production increased from 2,925
units (9mo YTD2015) to 3,887 units
(9mo YTD2016) for a 33%
improvement, arising from shift in
construction process (assembly line)
Interest income from in-house financing
+303% from Php81M to Php328M due
to transfer of in-house financing
receivables from PFC to PCFI Group
effective August 2015
Commission, Selling, and Marketing -
36% from Php622M to Php397M due to
lower RES
Interest expense -29% due to
prepayment of loans
We anticipate a bump-up as POC
improvements will be realized by Q4
Revenues
in P
hp
Billio
n
Net Income
in P
hp
Millio
n
-14%
-8%
4.5
3.9
9M 2015 9M 2016
856.3
785.0
9M 2015 9M 2016
Pro-Friends Financial Highlights
27


Value of total insurance premiums, Philippines
2009-2018F, in billion USD Life and Non-life
Source: Swiss Re, June 2016 29
2.3 2.9
3.8
5.1 4.9
6.1
7.1
8.3
9.4
0
1
2
3
4
5
6
7
8
9
10
2010 2011 2012 2013 2014 2015 2016F 2017F 2018F
Val
ue
of
Gro
ss P
rem
ium
Wri
tte
n in
b
illio
n U
SD
Projected to grow to
USD9.4 billion in 2018
+15% average growth

Value of life insurance premiums, Philippines
2009-2018F, in billion USD Life
Source: Swiss Re, June 2016 30
1.6 2
2.7
3.9 3.5
4.6
5.4
6.3
7.2
0
1
2
3
4
5
6
7
8
2010 2011 2012 2013 2014 2015 2016F 2017F 2018F
Val
ue
of
Gro
ss P
rem
ium
Wri
tte
n
in b
illio
n U
SD
Projected to grow to
USD7.2 billion in 2018
+16% average growth

Value of non-life insurance premiums
2009-2018F, in billion USD Non-life
Source: Swiss Re, June 2016 31
0.8 0.9
1.1 1.2
1.3 1.5
1.7 1.9
2.2
0
0.5
1
1.5
2
2.5
2010 2011 2012 2013 2014 2015 2016F 2017F 2018F
Val
ue
of
Gro
ss P
rem
ium
Wri
tte
n
in b
illio
n U
SD
Projected to grow to over
USD2.0 billion in 2018
+13% average growth

Insurance Industry Updates
Source: Insurance Commission, November 2016 32
1,100
1,321
3Q 2015 3Q 2016
Total Assets in
Ph
p B
illio
n +21%
195
269
3Q 2015 3Q 2016
Total Equity (Net Worth)
in P
hp
Billio
n +38%
20.4 22.9
3Q 2015 3Q 2016
Total Net Income
in P
hp
Billio
n +12%
33

AXA in the Philippines
34
• Total bancassurance (Metrobank
and PSBank) branches: 925
• Persistency Ratio: 83% from 84%
• Agency Sales Force: 3,000
In B
illi
on
PH
P
+18%
Assets Under Management
73.7 87.0
9M 2015 9M 2016
from 2,700
out of 953 branches

Gross Premium
in P
hp
Bil
lio
n
Net Income
in P
hp
Billio
n
+5%
+14%
AXA Financial Highlights*
35
New Business (APE) at Php3.7B
in 2016 vs. Php3.6B in 2015
(+4%)
o Regular Premium +18%
o Single Premium -26% due
to lower demand for unit-
linked products
Single and Regular Premium
product mix - 67:33 to 54:46
Total premium margins +11%
AUM +18% Asset management
fees +23%
Realized gains Php251M
Unrealized loss on bonds and
equities Php85M
CPAIC net loss Php64M (6 mos.)
*includes CPAIC effective April 1, 2016
AXA -9%
AXA +20% 1.1
1.3
9M 2015 9M 2016
17.2
18.1
9M 2015 9M 2016


Public infrastructure-to-GDP ratio
Infrastructure is expected to lift GDP growth
Source: Bank of the Philippine Islands; Department of Budget and Management 37
Perc
en
tag
e (
%)
infr
a-t
o-G
DP
0
1
2
3
4
5
6
7
8
9
10
1991
1992
1993
1994
1995
1996
1997
1998
1999
2000
2001
2002
2003
2004
2005
2006
2007
2008
2009
2010
2011
2012
2013
2014
2015
2016
2017F
2018F
2019F
2020F
2021F
2022F
Administration target:
9% infra-to-GDP ratio
(2017-2022)


Metro Pacific Financial Highlights
Share in Operating Net Income (Core)
in P
hp
Billio
n +18%
Acquisition of GBPC through Beacon in May
2016
Meralco
Energy sales +9%
Increased direct equity stake from
32.5% to 41.2% effective June
Higher preferred dividend income
from Beacon; Php1.2B - 9M2016 (18
mos.) vs. Php0.41B - 9M2015 (6 mos.)
Water
Billed volume +4%
Expiration of ITH
Toll Roads
Increase in average daily traffic in
NLEX +9% , Cavitex +6%, and SCTEX
+16%, DMT & CII+11%
Hospitals
Increase in gross revenues from
existing and new hospitals +27%
Out-patient +34%
In-patient +26%
Equity accounting net income for GT Capital
for 4 months at Php809M
Core Net Income
in P
hp
Billio
n +13%
39
3.6 2.7
1.9 2.3 0.2 0.3 3.9 5.7 0.3 0.4
0.1
LRMC/AFPI
Hospitals
Meralco/Beacon/GBPC
DMT
MPTC/AIF
Maynilad
9.9 11.6
8.2
9.3
9M 2015 9M 2016


Industry car sales vs. gasoline prices Gasoline prices erratic; auto sales not as volatile
41 Source: PEP-BAML report, CAMPI, Bloomberg
0
10
20
30
40
50
60
70
80
90
100
0
10,000
20,000
30,000
40,000
50,000
60,000
70,000
80,000
90,000
100,000
Mar
2006
Sept
2007
Mar
2009
Sept
2010
Mar
2012
Sept
2013
Mar
2015
Sept
2016
PH
P p
er
lite
r o
f g
aso
lin
e
Ind
ust
ry c
ar
sale
s in
un
its
Industry Gasoline prices
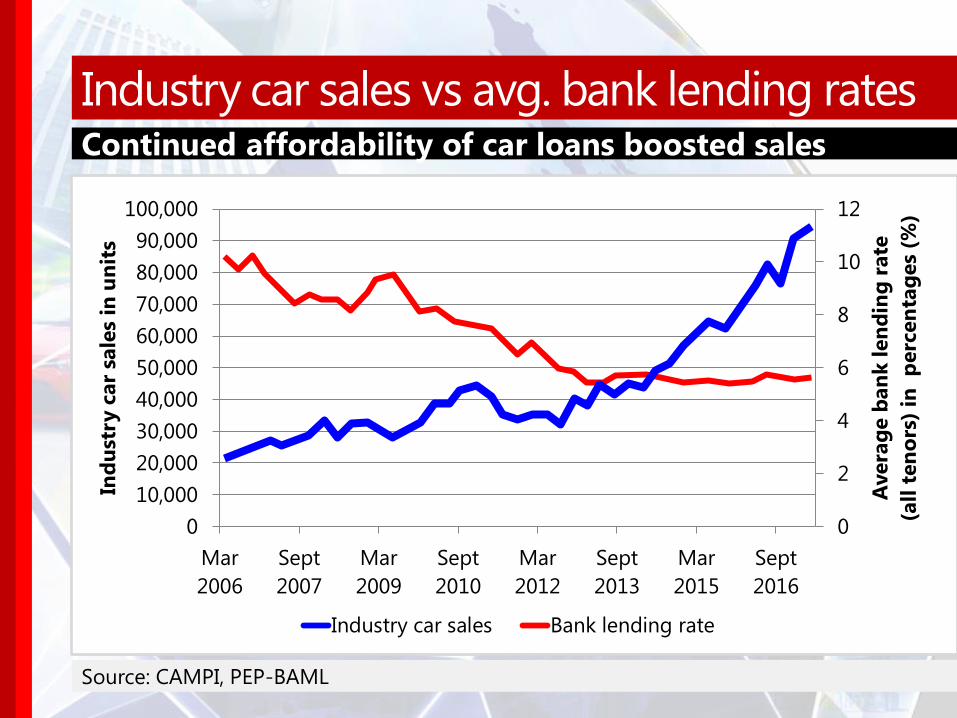
Industry car sales vs avg. bank lending rates Continued affordability of car loans boosted sales
42 Source: CAMPI, PEP-BAML
0
2
4
6
8
10
12
0
10,000
20,000
30,000
40,000
50,000
60,000
70,000
80,000
90,000
100,000
Mar
2006
Sept
2007
Mar
2009
Sept
2010
Mar
2012
Sept
2013
Mar
2015
Sept
2016
Avera
ge b
an
k l
en
din
g r
ate
(all
ten
ors
) in
p
erc
en
tag
es
(%)
Ind
ust
ry c
ar
sale
s in
un
its
Industry car sales Bank lending rate

Industry car sales vs. PH GDP per capita As the economy grows, more Filipinos buy cars
43 Source: CAMPI, PEP-BAML
0
500
1000
1500
2000
2500
3000
3500
0
10000
20000
30000
40000
50000
60000
70000
80000
90000
100000
Mar2008
Mar2010
Mar2012
Mar2014
Mar2016
Industry car sales GDP per capita
Units USD

44
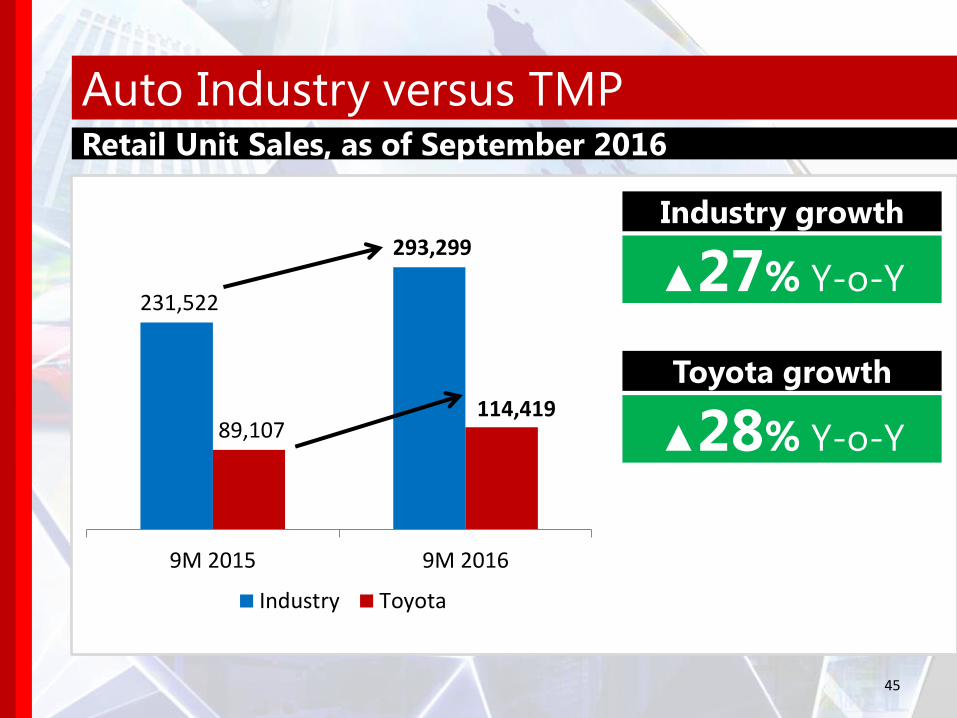
Auto Industry versus TMP Retail Unit Sales, as of September 2016
Toyota growth
▲28% Y-o-Y
Industry growth
▲27% Y-o-Y 231,522
293,299
89,107 114,419
9M 2015 9M 2016
Industry Toyota
45

Overall Market Share As of September 2016
MitsubishiFord
HyundaiIsuzu
HondaNissan
SuzukiOthers*
Kia
General MotorsMazdaSubaru
39%
16%
9% 9%
7% 6%
4% 4% 3%
2% 2% 1% 1%
From 35% in March
46
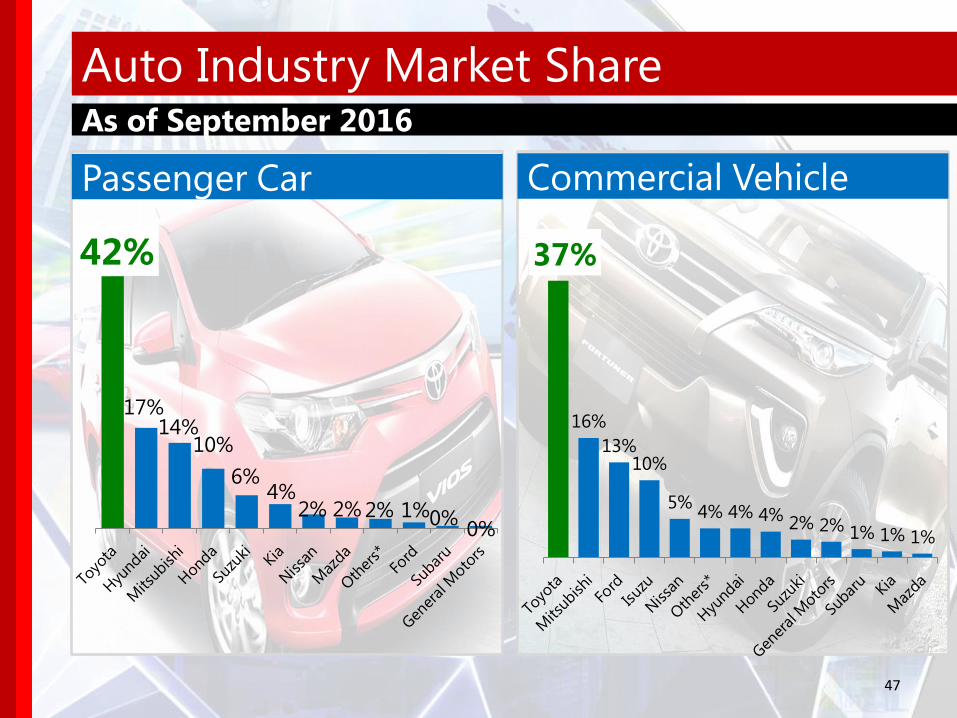
Auto Industry Market Share As of September 2016
42%
17% 14%
10%
6% 4%
2% 2% 2% 1% 0% 0%
37%
16%
13% 10%
5% 4% 4% 4% 2% 2% 1% 1% 1%
Passenger Car Commercial Vehicle
47

Revenues
in P
hp
Bil
lio
n
Net Income ATP
in P
hp
Bil
lio
n
+40%
+36%
81.9
9M 2015 9M 2016
7.7
10.5
9M 2015 9M 2016
TMP Financial Highlights
Wholesale volume +38%
120,136 units
Strong sales:
• PCs: Vios (+15%) and Wigo
(+52%)
• CVs: Hiace (+43%), Fortuner
(+80%), Innova (+14%),
Avanza (+80%) and Hilux
(+68%)
Overall market share 39% from
38.5%
Due to higher sales volume,
lower CKD parts cost (F/X
translation cost), and price
increases
48
115.0

INITIATIVES STRATEGIC

Metrobank Highlights
Investing
globally is now
within reach
with minimum
US$2,000
Metro World Equity Feeder Fund
• U.S. dollar-denominated
• for clients with an investment horizon of at least five years
• can tolerate a high degree of risk for superior capital growth
• available starting 21 Sept 2016

Federal Land New Launches
Six Senses Resort Tower 6: i-Imagine SEPTEMBER 2016
Peninsula Garden Midtown Homes
Tower 7: Mango JUNE 2016

New Products from AXA
The myAXA app • Manage your AXA account and take
your next step while on the go
• Access your account information
anytime, anywhere
• Connect with your AXA financial advisor
through mobile

New Products from AXA
• Comprehensive health plan that provides up to P150M annual
coverage anywhere in the world (renewable until age 99)
• Provides the customer the option to choose his/her own doctor and
have cashless transactions, plus other world-class services such as
international emergency medical assistance, road ambulance transport,
second medical opinion, 24/7 Health Support and a Global Concierge
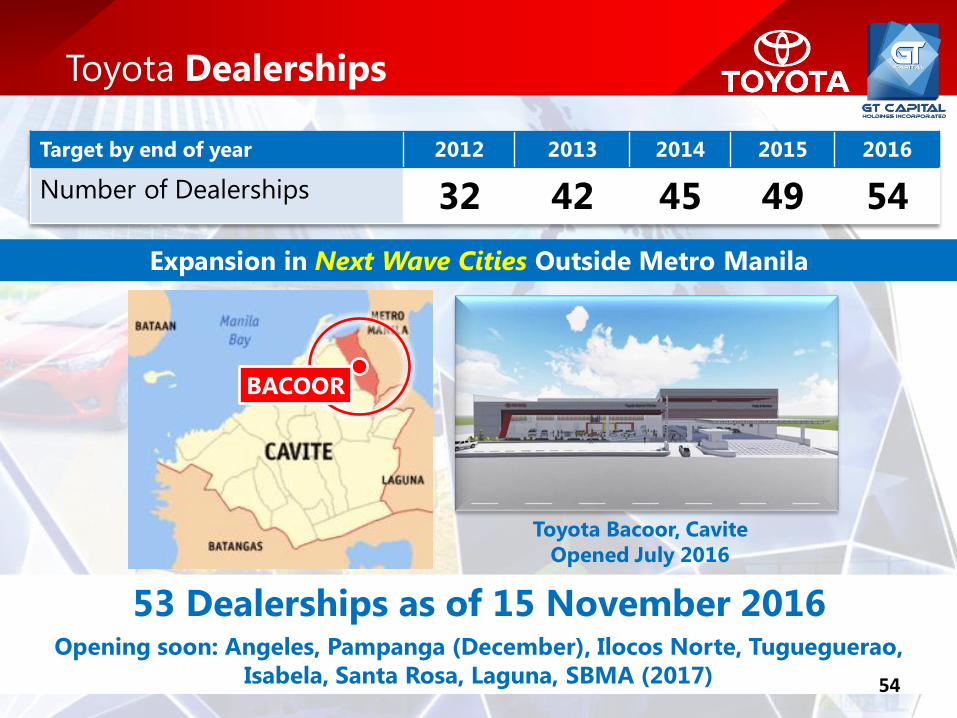
Toyota Dealerships
Target by end of year 2012 2013 2014 2015 2016
Number of Dealerships 32 42 45 49 54
Expansion in Next Wave Cities Outside Metro Manila
Toyota Bacoor, Cavite
Opened July 2016
54
53 Dealerships as of 15 November 2016 Opening soon: Angeles, Pampanga (December), Ilocos Norte, Tugueguerao,
Isabela, Santa Rosa, Laguna, SBMA (2017) 54
BACOOR

The New Toyota Vios
• New Dual VVT-I CVT
engine
• More fuel-efficient and
better performance

The New Lexus IS 350