Embed Size (px)
Citation preview
0
Analyst MeetingFY 2015
PTT Auditorium26 February 2016
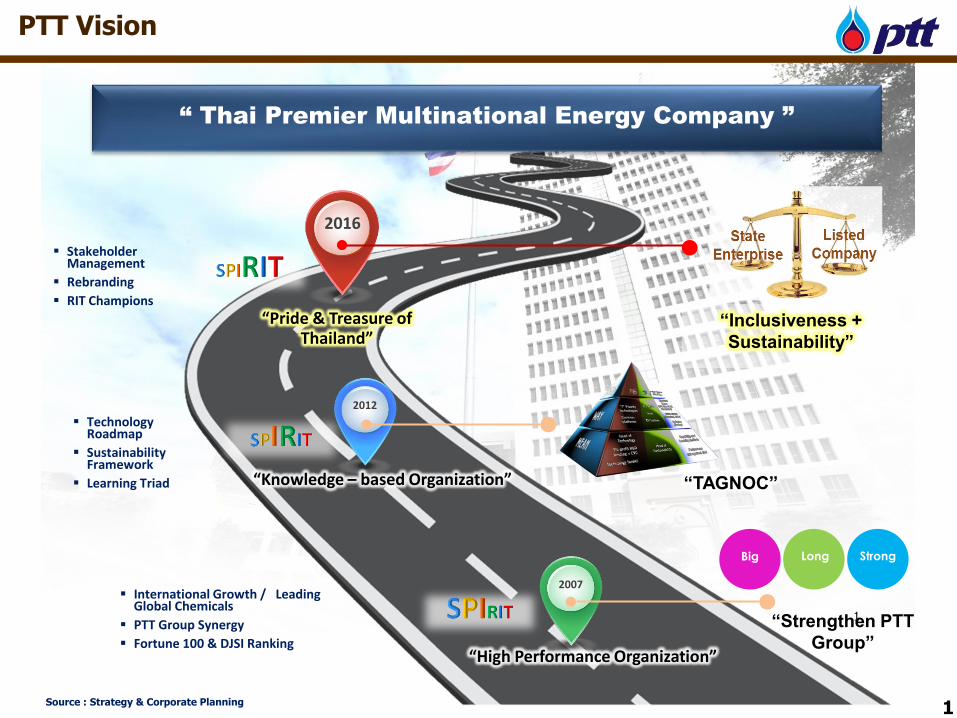
International Growth / Leading Global Chemicals
PTT Group Synergy
Fortune 100 & DJSI Ranking
“Strengthen PTT
Group”
Big Long Strong
2007
“High Performance Organization”
2012
“TAGNOC”“Knowledge – based Organization”
2016
Technology Roadmap
Sustainability Framework
Learning Triad
“Inclusiveness +
Sustainability”
Stakeholder Management
Rebranding
RIT Champions
“Pride & Treasure of Thailand”
“ Thai Premier Multinational Energy Company ”
1
Source : Strategy & Corporate Planning
PTT Vision
1
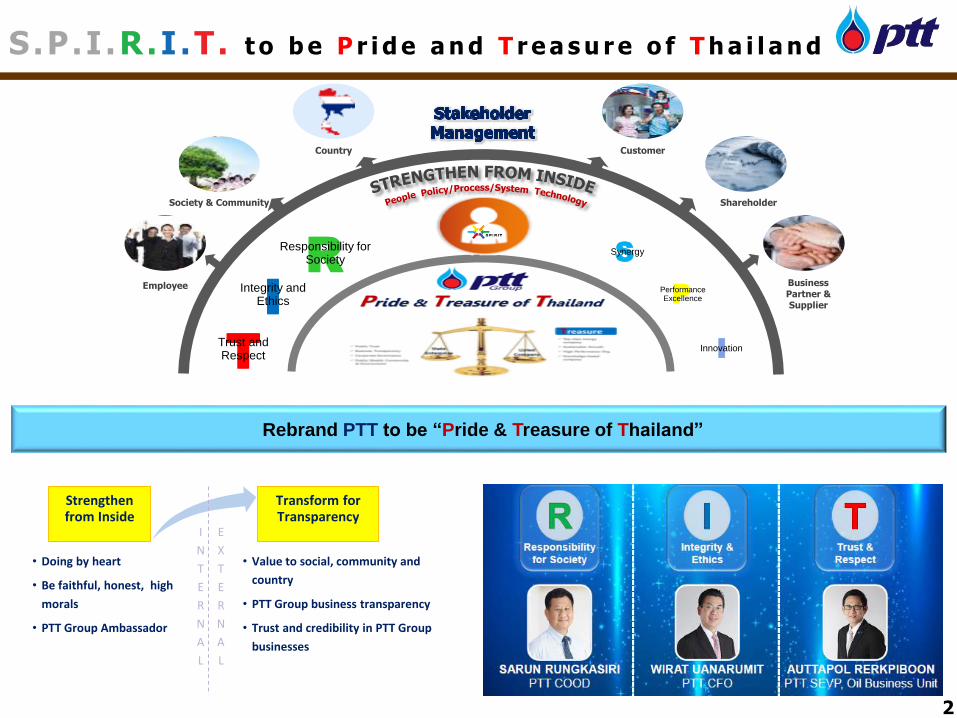
S.P.I .R.I .T . t o b e P r i d e a n d T r e a s u r e o f T h a i l a n d
2
Society & Community
CustomerCountry
Shareholder
Business Partner &Supplier
Employee
RResponsibility for
Society
IIntegrity and
Ethics
TTrust and Respect
SSynergy
PPerformanceExcellence
IInnovation
Rebrand PTT to be “Pride & Treasure of Thailand”
Strengthen from Inside
Transform for Transparency
• Doing by heart
• Be faithful, honest, high
morals
• PTT Group Ambassador
• Value to social, community and
country
• PTT Group business transparency
• Trust and credibility in PTT Group
businesses
I
N
T
E
R
N
A
L
E
X
T
E
R
N
A
L
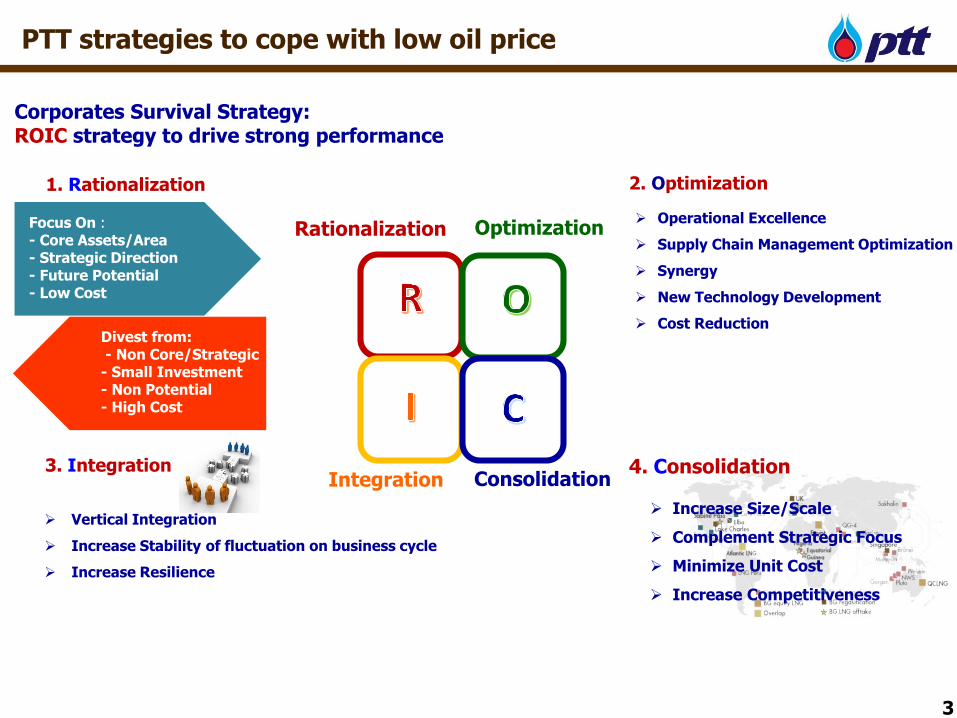
Corporates Survival Strategy:ROIC strategy to drive strong performance
Rationalization Optimization
Integration Consolidation
1. Rationalization
Focus On : - Core Assets/Area- Strategic Direction- Future Potential- Low Cost
Divest from: - Non Core/Strategic
- Small Investment- Non Potential- High Cost
2. Optimization
Operational Excellence
Supply Chain Management Optimization
Synergy
New Technology Development
Cost Reduction
3. Integration
Vertical Integration
Increase Stability of fluctuation on business cycle
Increase Resilience
4. Consolidation
Increase Size/Scale
Complement Strategic Focus
Minimize Unit Cost
Increase Competitiveness
3
PTT strategies to cope with low oil price
4
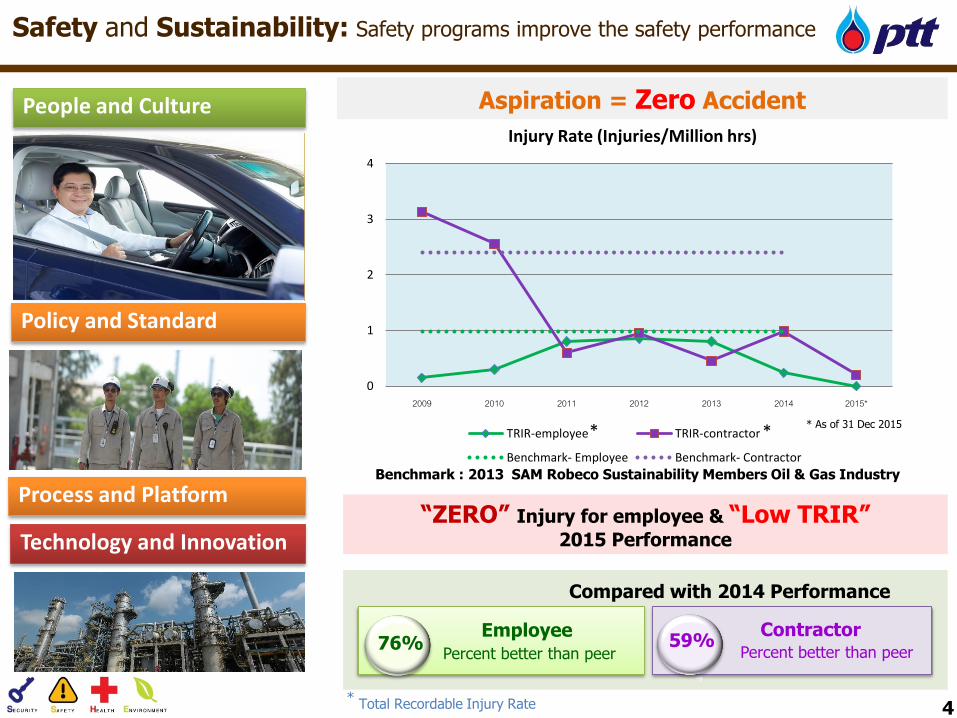
Safety and Sustainability: Safety programs improve the safety performance
Aspiration = Zero Accident
* Total Recordable Injury Rate
Benchmark : 2013 SAM Robeco Sustainability Members Oil & Gas Industry
Contractor76% 59%
EmployeePercent better than peer Percent better than peer
4
“ZERO” Injury for employee & “Low TRIR”2015 Performance
Compared with 2014 Performance
Policy and Standard
Process and Platform
Technology and Innovation
People and Culture
* ** As of 31 Dec 2015
0
1
2
3
4
2009 2010 2011 2012 2013 2014 2015*
Injury Rate (Injuries/Million hrs)
TRIR-employee TRIR-contractor
Benchmark- Employee Benchmark- Contractor
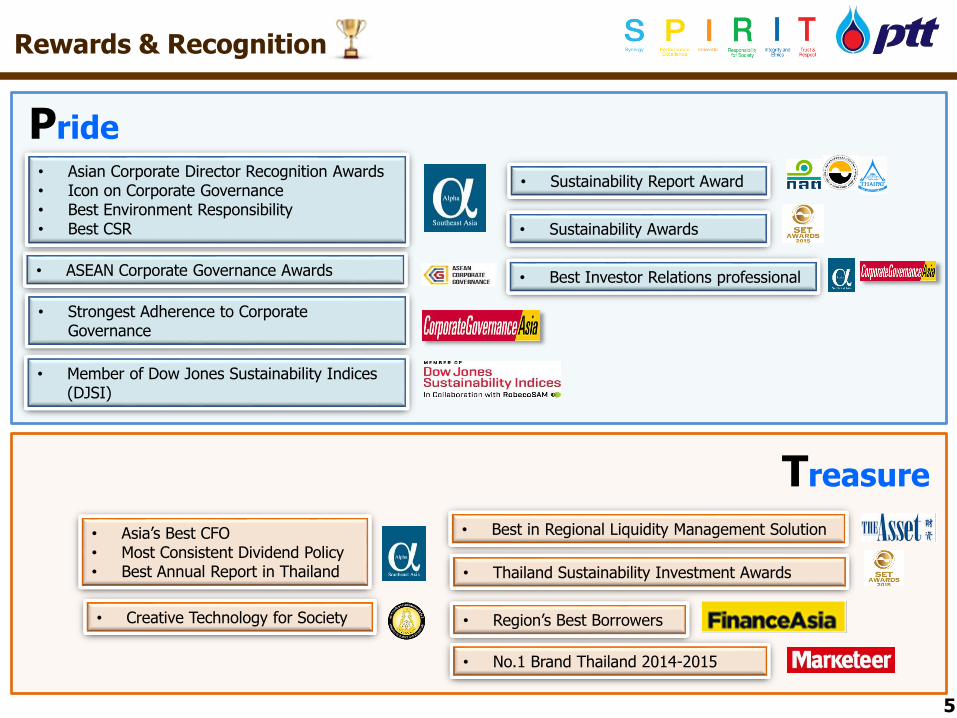
• Strongest Adherence to Corporate Governance
Rewards & Recognition
Pride
Treasure
• Member of Dow Jones Sustainability Indices (DJSI)
• Asia’s Best CFO• Most Consistent Dividend Policy• Best Annual Report in Thailand
• ASEAN Corporate Governance Awards
• Best in Regional Liquidity Management Solution
• Region’s Best Borrowers
• No.1 Brand Thailand 2014-2015
• Asian Corporate Director Recognition Awards • Icon on Corporate Governance• Best Environment Responsibility• Best CSR
• Thailand Sustainability Investment Awards
• Creative Technology for Society
• Sustainability Report Award
• Best Investor Relations professional
5
• Sustainability Awards
2015 Year in Review
Performance
2016 Outlook
2015 Year in Review Performance 2016 Outlook
Contents
6
0
20
40
60
80
100
120
Jan Feb Mar Apr May Jun Jul Aug Sep Oct Nov Dec
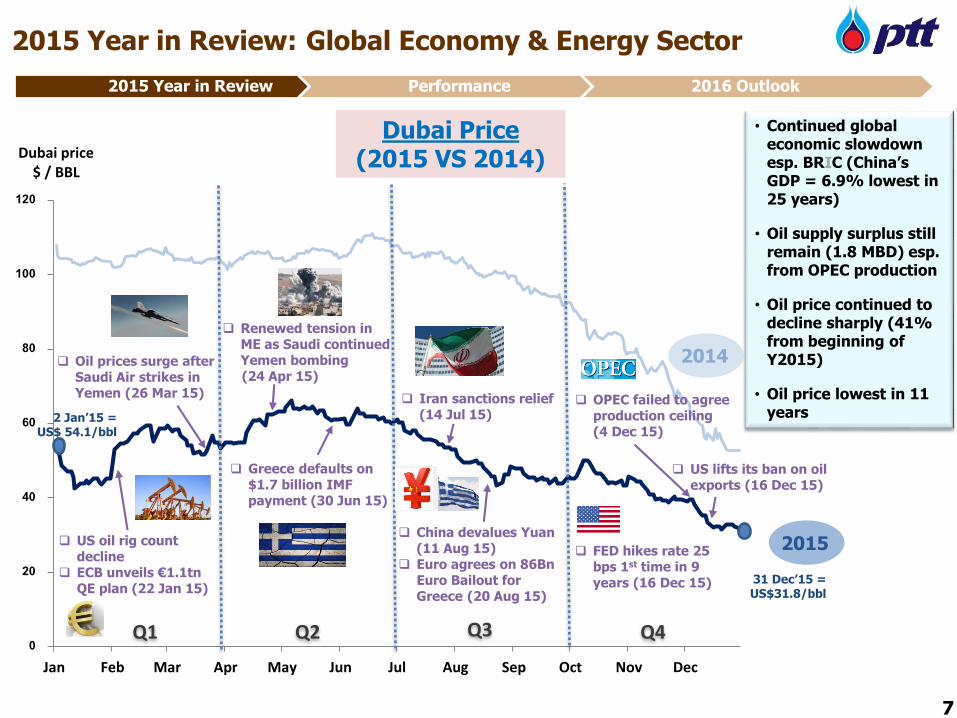
Dubai price$ / BBL
FED hikes rate 25 bps 1st time in 9 years (16 Dec 15)
OPEC failed to agree production ceiling (4 Dec 15)
Dubai Price(2015 VS 2014)
2015 Year in Review: Global Economy & Energy Sector
China devalues Yuan (11 Aug 15)
Euro agrees on 86Bn Euro Bailout for Greece (20 Aug 15)
Q3 Q4
• Continued global economic slowdown esp. BRIC (China’s GDP = 6.9% lowest in 25 years)
• Oil supply surplus still remain (1.8 MBD) esp. from OPEC production
• Oil price continued to decline sharply (41% from beginning of Y2015)
• Oil price lowest in 11 years
2014
2015
31 Dec’15 = US$31.8/bbl
2 Jan’15 = US$ 54.1/bbl
7
Q2Q1
US oil rig count decline
ECB unveils €1.1tn QE plan (22 Jan 15)
Iran sanctions relief (14 Jul 15)
Renewed tension in ME as Saudi continued Yemen bombing(24 Apr 15)
Oil prices surge after Saudi Air strikes in Yemen (26 Mar 15)
Greece defaults on $1.7 billion IMF payment (30 Jun 15)
2015 Year in Review Performance 2016 Outlook
US lifts its ban on oil exports (16 Dec 15)
7
Jan-15 Apr-15 Jul-15 Oct-15
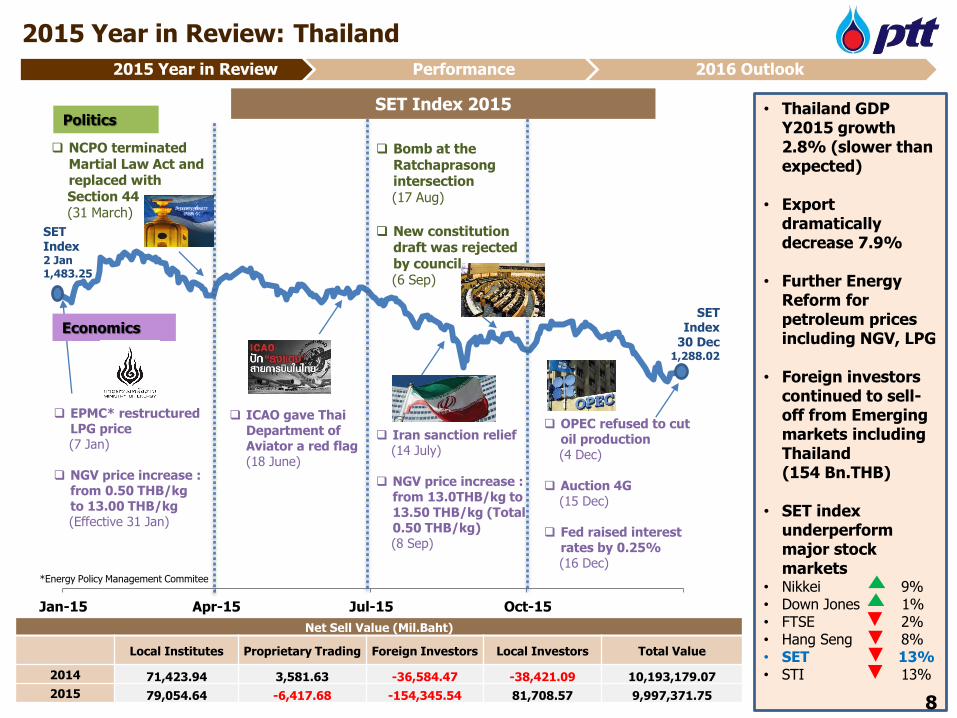
Bomb at the Ratchaprasongintersection(17 Aug)
New constitution draft was rejected by council (6 Sep)
2015 Year in Review: Thailand
SET Index2 Jan
1,483.25
SET Index
30 Dec1,288.02
Politics
Economics
Iran sanction relief (14 July)
NGV price increase : from 13.0THB/kg to 13.50 THB/kg (Total 0.50 THB/kg) (8 Sep)
• Thailand GDP Y2015 growth 2.8% (slower than expected)
• Export dramatically decrease 7.9%
• Further Energy Reform for petroleum prices including NGV, LPG
• Foreign investors continued to sell-off from Emerging markets including Thailand(154 Bn.THB)
• SET index underperform major stock markets
• Nikkei 9%• Down Jones 1%• FTSE 2%• Hang Seng 8% • SET 13% • STI 13%
SET Index 2015
8
OPEC refused to cut oil production (4 Dec)
Auction 4G (15 Dec)
Fed raised interest rates by 0.25% (16 Dec)
NCPO terminated Martial Law Act and replaced with Section 44(31 March)
ICAO gave Thai Department of Aviator a red flag (18 June)
EPMC* restructured LPG price (7 Jan)
NGV price increase : from 0.50 THB/kg to 13.00 THB/kg (Effective 31 Jan)
Net Sell Value (Mil.Baht)
Local Institutes Proprietary Trading Foreign Investors Local Investors Total Value
2014 71,423.94 3,581.63 -36,584.47 -38,421.09 10,193,179.07
2015 79,054.64 -6,417.68 -154,345.54 81,708.57 9,997,371.75
*Energy Policy Management Commitee
2015 Year in Review Performance 2016 Outlook
-60%
-50%
-40%
-30%
-20%
-10%
0%
10%
20%
30%
40%
9
2015 Year in Review: Thailand
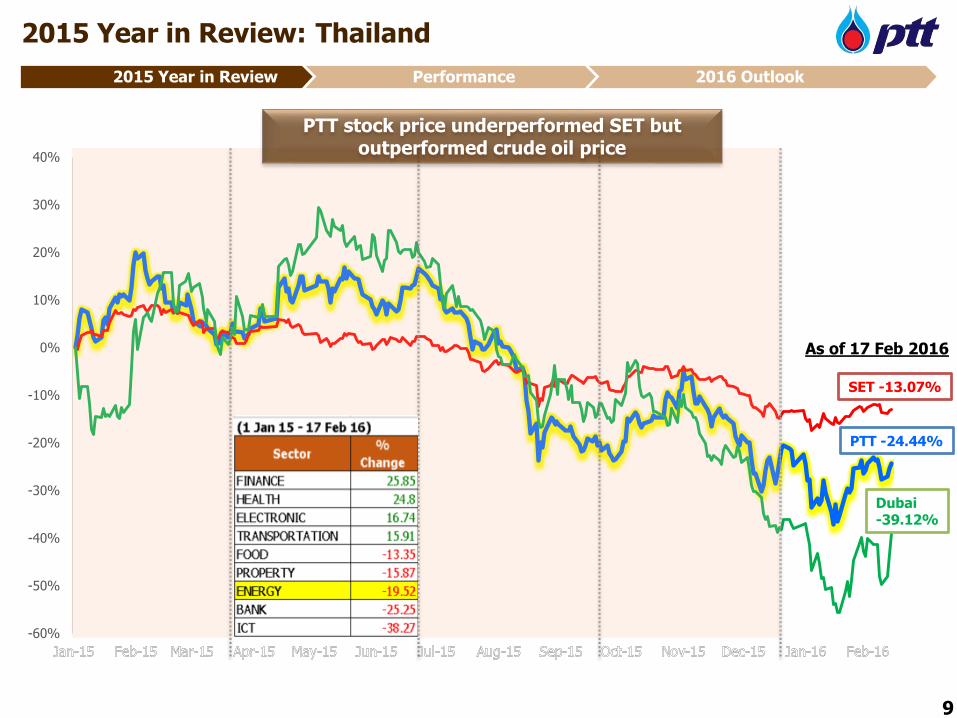
Dubai -39.12%
PTT -24.44%
SET -13.07%
As of 17 Feb 2016
2015 Year in Review Performance 2016 Outlook
9
PTT stock price underperformed SET but outperformed crude oil price
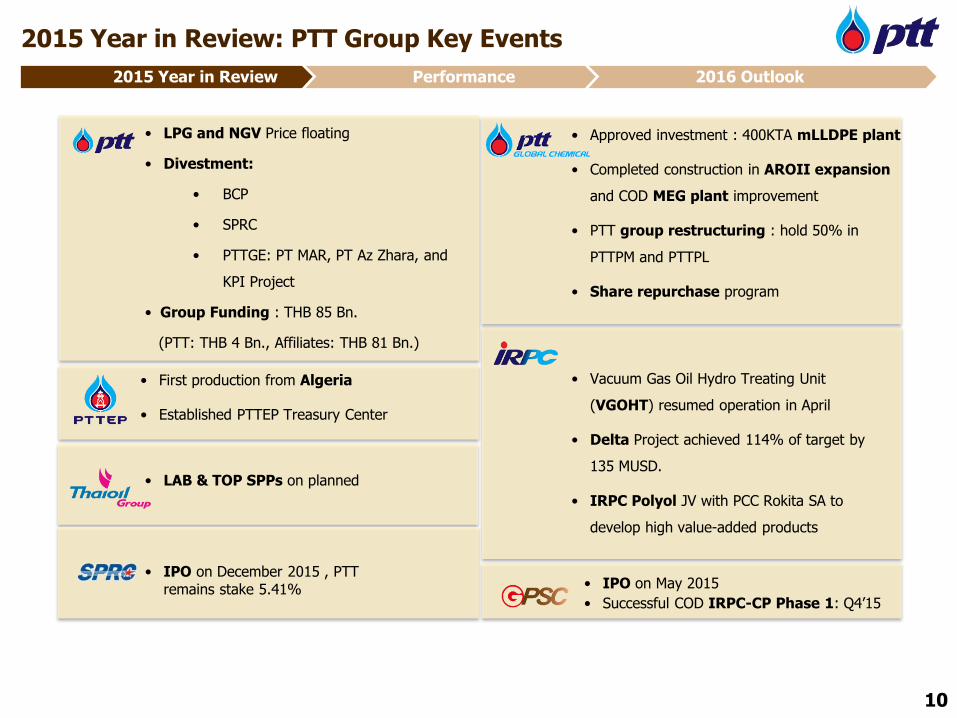
• First production from Algeria
• Established PTTEP Treasury Center
• IPO on May 2015
• Successful COD IRPC-CP Phase 1: Q4’15
2015 Year in Review: PTT Group Key Events
• LPG and NGV Price floating
• Divestment:
• BCP
• SPRC
• PTTGE: PT MAR, PT Az Zhara, and
KPI Project
• Group Funding : THB 85 Bn.
(PTT: THB 4 Bn., Affiliates: THB 81 Bn.)
• Vacuum Gas Oil Hydro Treating Unit
(VGOHT) resumed operation in April
• Delta Project achieved 114% of target by
135 MUSD.
• IRPC Polyol JV with PCC Rokita SA to
develop high value-added products
• LAB & TOP SPPs on planned
• IPO on December 2015 , PTT remains stake 5.41%
• Approved investment : 400KTA mLLDPE plant
• Completed construction in AROII expansion
and COD MEG plant improvement
• PTT group restructuring : hold 50% in
PTTPM and PTTPL
• Share repurchase program
10
2015 Year in Review Performance 2016 Outlook
0
5
10
15
20
25
Jan-14 Apr-14 Jul-14 Oct-14 Jan-15 Apr-15 Jul-15 Oct-15
LNG (JLC) ($/MMBTU) JKM Spot Avg. Pooled Gas ($/MMBTU)
31
32
33
34
35
36
37
Jan-14 Jul-14 Jan-15 Jul-15100
300
500
700
900
1100
Jan-14 Apr-14 Jul-14 Oct-14 Jan-15 Apr-15 Jul-15 Oct-15
HDPE-Naphtha Spread PX-Naphtha Spread
20
60
100
Jan-14 Apr-14 Jul-14 Oct-14 Jan-15 Apr-15 Jul-15 Oct-15
16.6
NG Prices ($/MMBTU)
* JLC = Japan LNG Cocktail : Landed LNG price in Japan
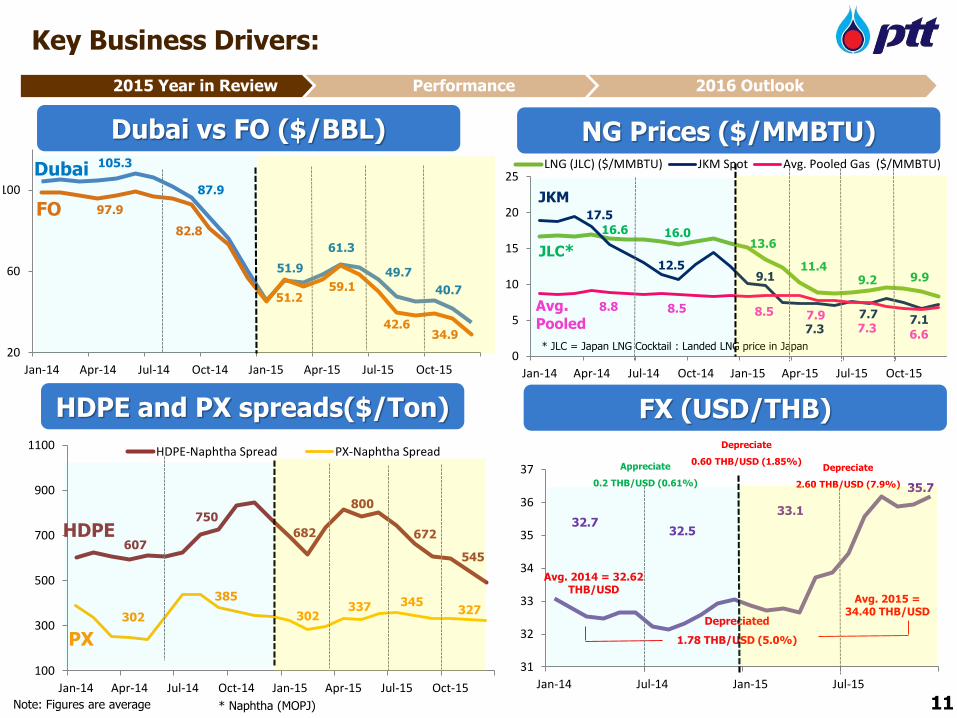
Key Business Drivers:
Note: Figures are average
607
Dubai vs FO ($/BBL)
HDPE and PX spreads($/Ton) FX (USD/THB)
Dubai
FO
HDPE
302
PX
87.9
82.8
750
385
16.0
JLC*
105.3
97.9
Avg. Pooled
8.58.8
51.9
51.2
682
302
13.6
8.5
17.5
12.5
JKM
9.1
32.733.1
11
Depreciated
1.78 THB/USD (5.0%)
Avg. 2014 = 32.62 THB/USD
Avg. 2015 = 34.40 THB/USD
Depreciate
2.60 THB/USD (7.9%)
7.37.7
9.249.7
42.6
672
345
11* Naphtha (MOPJ)
61.3
59.1
11.4
7.37.9
800
337
40.7
34.9
7.1
9.9
6.6
327
545
32.5
35.7
Appreciate
0.2 THB/USD (0.61%)
Depreciate
0.60 THB/USD (1.85%)
2015 Year in Review Performance 2016 Outlook
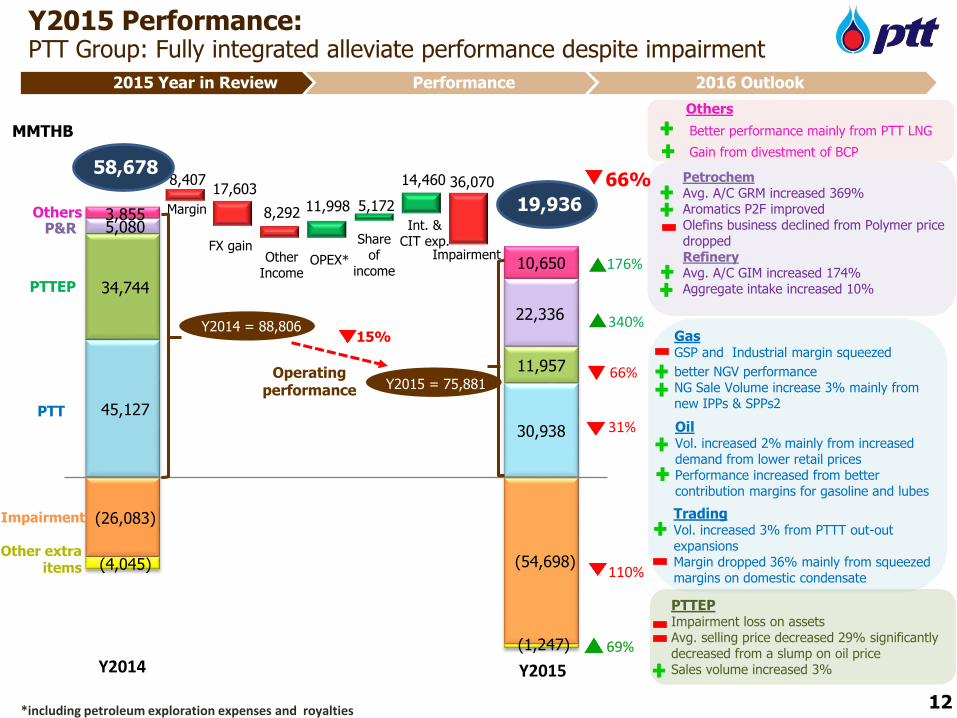
69%
110%
31%
340%
176%
66%
45,127
(54,698)
34,744
30,938
5,080
11,957
3,855
22,336
(26,083)
10,650
(4,045)
(1,247)
Y2015 Performance: PTT Group: Fully integrated alleviate performance despite impairment
12*including petroleum exploration expenses and royalties
OilVol. increased 2% mainly from increased demand from lower retail prices Performance increased from better contribution margins for gasoline and lubes
TradingVol. increased 3% from PTTT out-out expansionsMargin dropped 36% mainly from squeezed margins on domestic condensate
Better performance mainly from PTT LNG
Gain from divestment of BCP
Others
PTTEPImpairment loss on assets Avg. selling price decreased 29% significantly decreased from a slump on oil price Sales volume increased 3%
GasGSP and Industrial margin squeezed
better NGV performance NG Sale Volume increase 3% mainly from new IPPs & SPPs2
2015 Year in Review Performance 2016 Outlook
11,998 5,172
14,460 8,407 17,603
8,292
36,070 58,678
MMTHB
Margin
FX gainOPEX*
Share of
income
Int. & CIT exp.
Other Income
66%
19,936
Impairment
Y2014 Y2015
Y2015 = 75,881
Y2014 = 88,806
Operating performance
15%
PTTEP
PTT
OthersP&R
Impairment
Other extra items
PetrochemAvg. A/C GRM increased 369% Aromatics P2F improvedOlefins business declined from Polymer price dropped RefineryAvg. A/C GIM increased 174%Aggregate intake increased 10%
2015 Year in Review
Performance
2016 Outlook
13
2015 Year in Review Performance 2016 Outlook
Contents
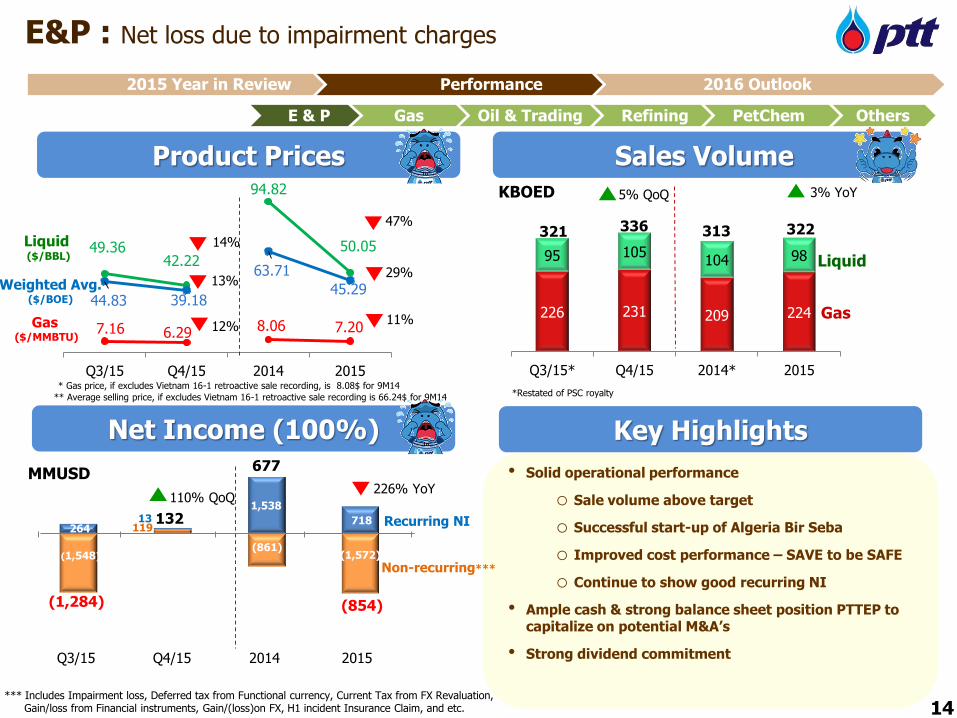
E&P : Net loss due to impairment charges
Product Prices
Net Income (100%)
Sales Volume
Key Highlights
7.16 6.29 8.06 7.20
49.3642.22
94.82
50.05
44.83 39.18
63.71
45.29
Q3/15 Q4/15 2014 2015
Liquid ($/BBL)
Gas($/MMBTU)
Weighted Avg.($/BOE)
MMUSD
226 231 209 224
95 105104 98
Q3/15* Q4/15 2014* 2015
336
Liquid
Gas
KBOED
321
14
* Gas price, if excludes Vietnam 16-1 retroactive sale recording, is 8.08$ for 9M14
** Average selling price, if excludes Vietnam 16-1 retroactive sale recording is 66.24$ for 9M14
313
Q4/15
14%
13%
3% YoY5% QoQ
2014
226% YoY110% QoQ
E & P Gas Oil & Trading Refining PetChem Others
12%
47%
29%
11%
322
2015
677
(854)(1,284)
132
*** Includes Impairment loss, Deferred tax from Functional currency, Current Tax from FX Revaluation, Gain/loss from Financial instruments, Gain/(loss)on FX, H1 incident Insurance Claim, and etc.
Q3/15
Non-recurring***
Recurring NI
*Restated of PSC royalty
• Solid operational performance
o Sale volume above target
o Successful start-up of Algeria Bir Seba
o Improved cost performance – SAVE to be SAFE
o Continue to show good recurring NI
• Ample cash & strong balance sheet position PTTEP to capitalize on potential M&A’s
• Strong dividend commitment
2015 Year in Review Performance 2016 Outlook
(1,548)(861)
(1,572)
718
1,53813
119264
15
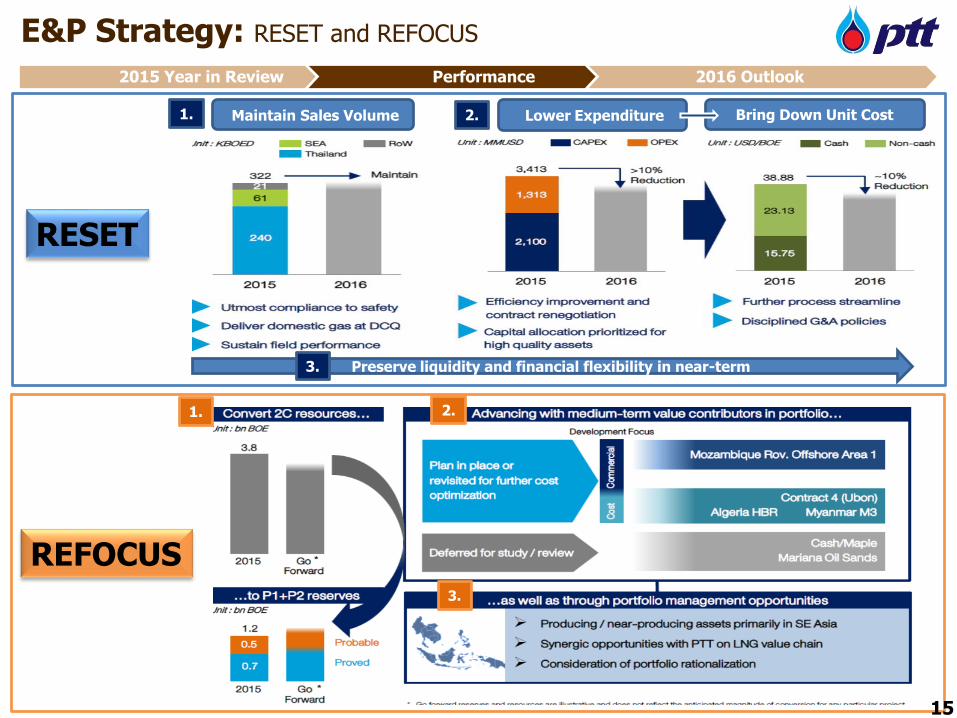
E&P Strategy: RESET and REFOCUS
2015 Year in Review Performance 2016 Outlook
RESET
REFOCUS
15
Maintain Sales Volume Lower Expenditure Bring Down Unit Cost
Preserve liquidity and financial flexibility in near-term
1. 2.
3.
1. 2.
3.
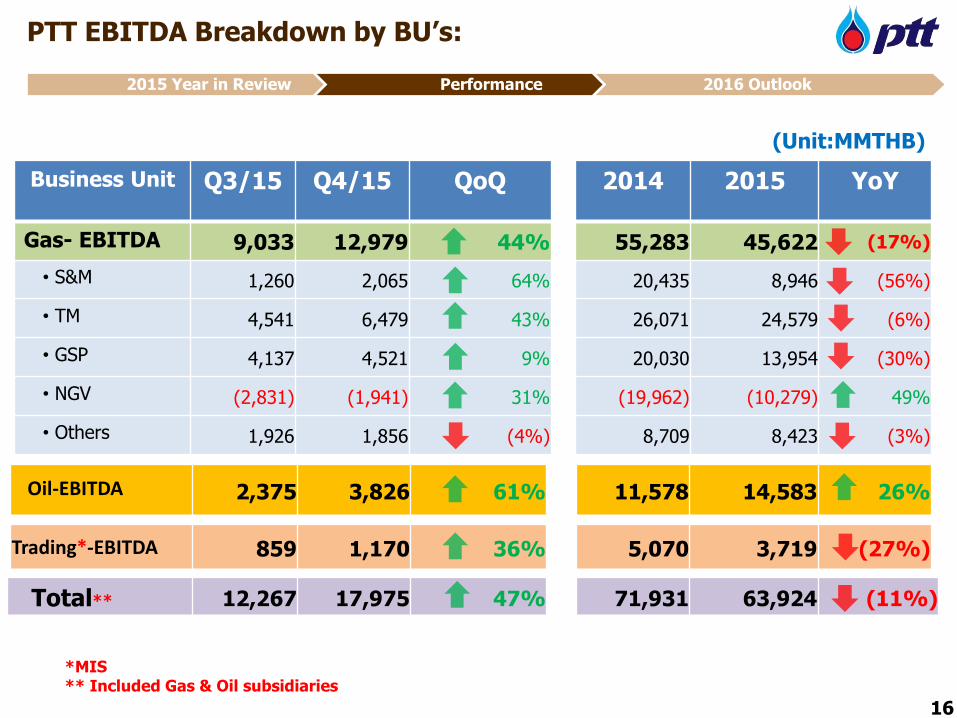
Business Unit Q3/15 Q4/15 QoQ 2014 2015 YoY
Gas- EBITDA 9,033 12,979 44% 55,283 45,622 (17%)
• S&M 1,260 2,065 64% 20,435 8,946 (56%)
• TM 4,541 6,479 43% 26,071 24,579 (6%)
• GSP 4,137 4,521 9% 20,030 13,954 (30%)
• NGV (2,831) (1,941) 31% (19,962) (10,279) 49%
• Others 1,926 1,856 (4%) 8,709 8,423 (3%)
(Unit:MMTHB)
2,375 3,826 61% 11,578 14,583 26%
859 1,170 36% 5,070 3,719 (27%)
*MIS** Included Gas & Oil subsidiaries
16
Oil-EBITDA
Trading*-EBITDA
Total** 12,267 17,975 47% 71,931 63,924 (11%)
PTT EBITDA Breakdown by BU’s:
2015 Year in Review Performance 2016 Outlook
8.6 9.2
8.6 8.5 8.5
7.9 7.3
6.6
610 607591
437
318377
265
217
-
100
200
300
400
500
600
700
5
7
9
11
13
15
Q1/14 Q2/14 Q3/14 Q4/14 Q1/15 Q2/15 Q3/15 Q4/15
8.35
8.04
8.82
8.45
Q3/15 Q4/15 2014 2015
4% QoQ
1,105 1,075 1,206 1,151
1,067 971 852 995
765 721 699 740
949 1,008 959 961
636 632 655 656300 289 317 304
Q3/15 Q4/15 2014 2015
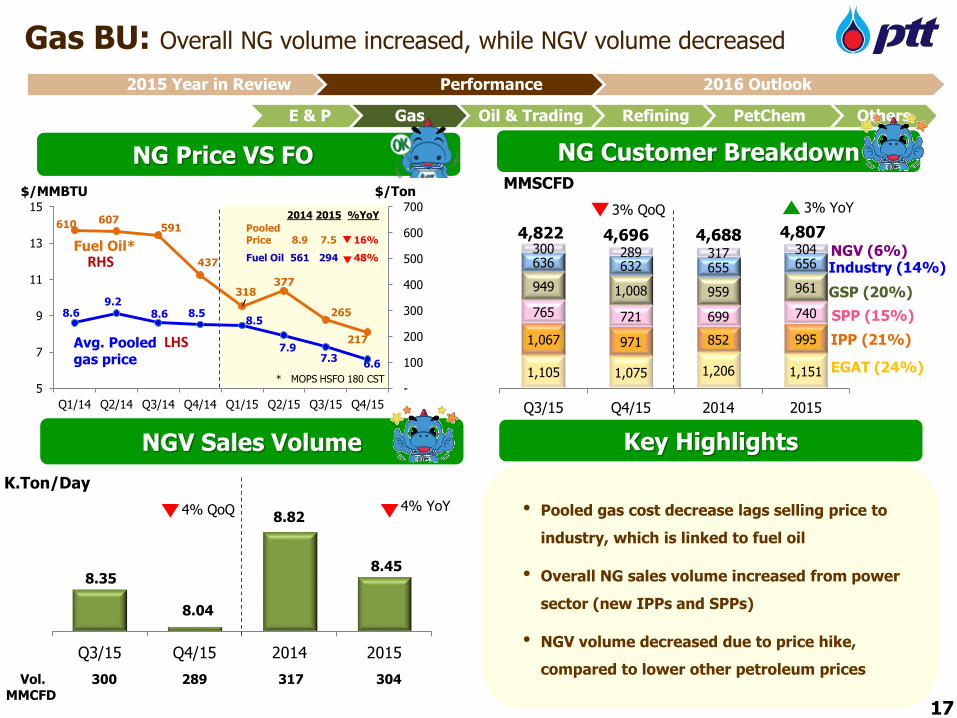
Gas BU: Overall NG volume increased, while NGV volume decreased
NG Price VS FO NG Customer Breakdown
$/MMBTU
EGAT (24%)
IPP (21%)
SPP (15%)
GSP (20%)
Industry (14%)NGV (6%)
MMSCFD
4,6884,822
3% YoY
NGV Sales Volume
Vol. MMCFD
300 289 317 304
• Pooled gas cost decrease lags selling price to
industry, which is linked to fuel oil
• Overall NG sales volume increased from power
sector (new IPPs and SPPs)
• NGV volume decreased due to price hike,
compared to lower other petroleum prices
Key Highlights
4,807
3% QoQ
ที่เพ่ิมข้ึนเป็นของ
K.Ton/Day
17
4% YoY
E & P Gas Oil & Trading Refining PetChem Others
4,696
2015 Year in Review Performance 2016 Outlook
$/Ton
Fuel Oil*
* MOPS HSFO 180 CST
Avg. Pooled gas price
LHS
RHS
2014 2015 %YoY
Pooled Price 8.9 7.5 16%
Fuel Oil 561 294 48%
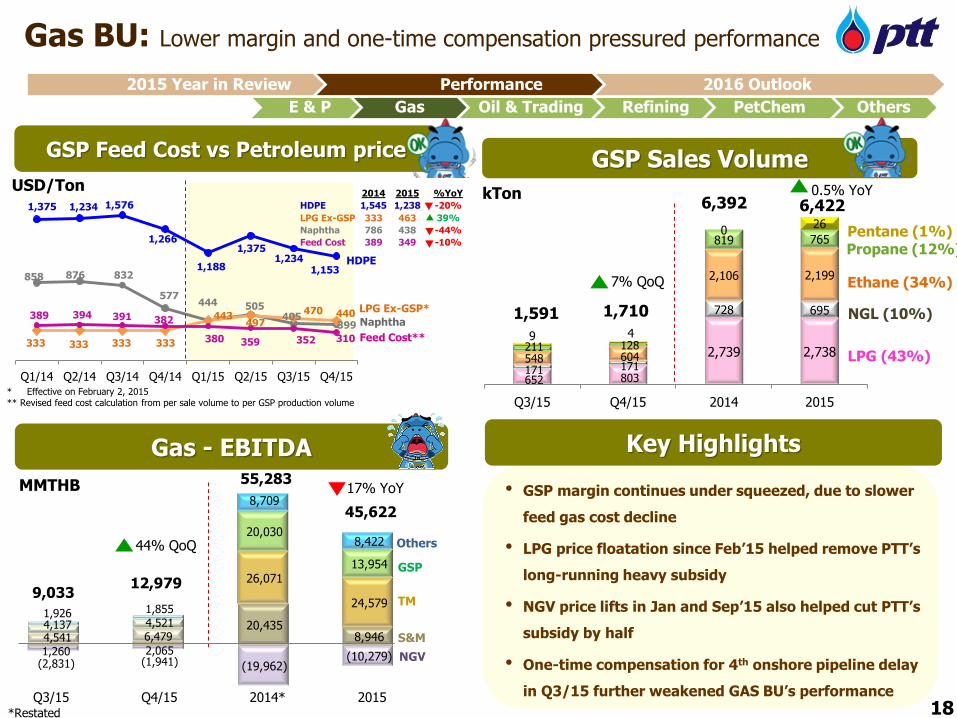
2014 2015 %YoY
HDPE 1,545 1,238 -20%
LPG Ex-GSP 333 463 39%
Naphtha 786 438 -44%
Feed Cost 389 349 -10%Propane (12%)
858 876 832
577 444 505
405 399
1,375 1,234 1,576
1,266
1,188
1,375 1,234
1,153
333 333 333 333
443 497
470 440 389 394 391 382
380 359 352 310
Q1/14 Q2/14 Q3/14 Q4/14 Q1/15 Q2/15 Q3/15 Q4/15
1,260 2,065
20,435 8,946 4,541 6,479
26,071
24,579
4,137 4,521
20,030
13,954
(2,831) (1,941) (19,962)(10,279)
1,926 1,855
8,709
8,422
Gas - EBITDA
MMTHB
Others
TM
GSP
12,9799,033
S&M
NGV
652 803
2,739 2,738
171 171
728 695
548 604
2,106 2,199
211 128
819 765
9 4
026
Q3/15 Q4/15 2014 2015
1,710
GSP Sales Volume
LPG (43%)
kTon
1,591
6,392
7% QoQ
0.5% YoY
Gas BU: Lower margin and one-time compensation pressured performance
NGL (10%)
Ethane (34%)
Key Highlights
44% QoQ
GSP Feed Cost vs Petroleum price
Naphtha
USD/Ton
Feed Cost**
LPG Ex-GSP*
* Effective on February 2, 2015** Revised feed cost calculation from per sale volume to per GSP production volume
55,283
Pentane (1%)
17% YoY
E & P Gas Oil & Trading Refining PetChem Others
6,422
45,622
18
HDPE
*Restated
Q3/15 Q4/15 2014* 2015
• GSP margin continues under squeezed, due to slower
feed gas cost decline
• LPG price floatation since Feb’15 helped remove PTT’s
long-running heavy subsidy
• NGV price lifts in Jan and Sep’15 also helped cut PTT’s
subsidy by half
• One-time compensation for 4th onshore pipeline delay
in Q3/15 further weakened GAS BU’s performance
2015 Year in Review Performance 2016 Outlook
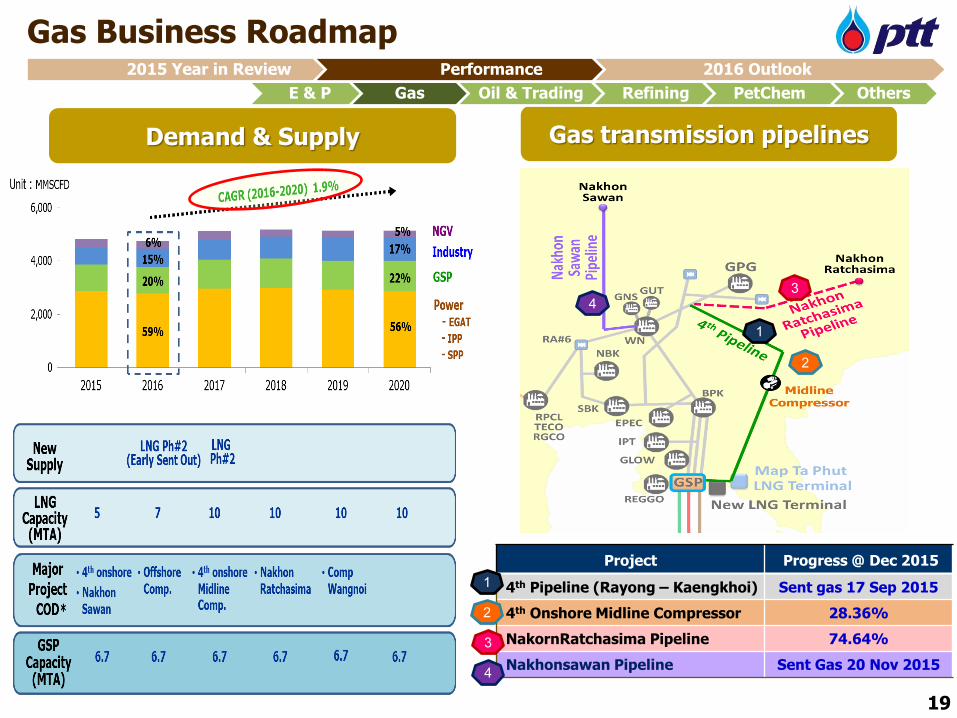
Gas Business Roadmap
Gas transmission pipelinesDemand & Supply
19
E & P Gas Oil & Trading Refining PetChem Others
2015 Year in Review Performance 2016 Outlook
34
1
2
Project Progress @ Dec 2015
4th Pipeline (Rayong – Kaengkhoi) Sent gas 17 Sep 2015
4th Onshore Midline Compressor 28.36%
NakornRatchasima Pipeline 74.64%
Nakhonsawan Pipeline Sent Gas 20 Nov 2015
3
4
1
2
0.0
0.2
0.4
0.6
Jul-14 Oct-14 Jan-15 Apr-15 Jul-15 Oct-150
5
10
15
Jul-14 Oct-14 Jan-15 Apr-15 Jul-15 Oct-15
Avg. Sales Vol. (K.Ton/day)Price (THB/Kg)
Industry Auto Household
-50
-40
-30
-20
-10
0
10
20
30
40
0
1,000
2,000
3,000
Jul-14 Oct-14 Jan-15 Apr-15 Jul-15 Oct-15
Sales vol. Export Price (RHS)
-200
-150
-100
-50
0
50
0
500
1,000
Jul-14 Oct-14 Jan-15 Apr-15 Jul-15 Oct-15
Sales Vol. Export Price (RHS)
2015
20
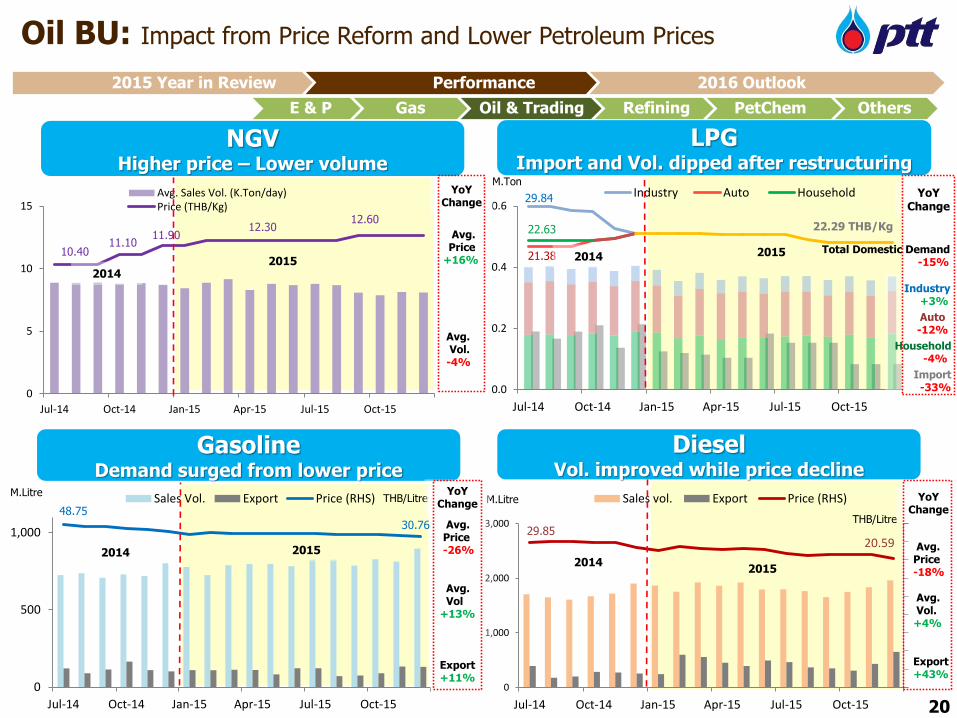
Avg. Price
+16%
Avg.Vol.
-4%
E & P Gas Oil & Trading Refining PetChem Others
Oil BU: Impact from Price Reform and Lower Petroleum Prices
NGV Higher price – Lower volume
M.Ton
DieselVol. improved while price decline
GasolineDemand surged from lower price
M.Litre
THB/Litre48.75
30.7629.85
20.59
10.40
12.30
M.LitreTHB/Litre
29.84
21.38
22.6311.10
11.90
LPG Import and Vol. dipped after restructuring
Avg. Price-26%
Avg.Vol
+13%
Export +11%
Avg. Price -18%
Avg.Vol.
+4%
Export +43%
22.29 THB/Kg
Industry +3%
Auto-12%
Household -4%
Import -33%
Total Domestic Demand -15%
12.60
YoYChange
YoYChange
YoYChange
YoYChange
2015
20152015
2014
2014
2014
2014
2015 Year in Review Performance 2016 Outlook
6,157 6,511
25,268
Q3/15 Q4/15 2014 2015
24,657
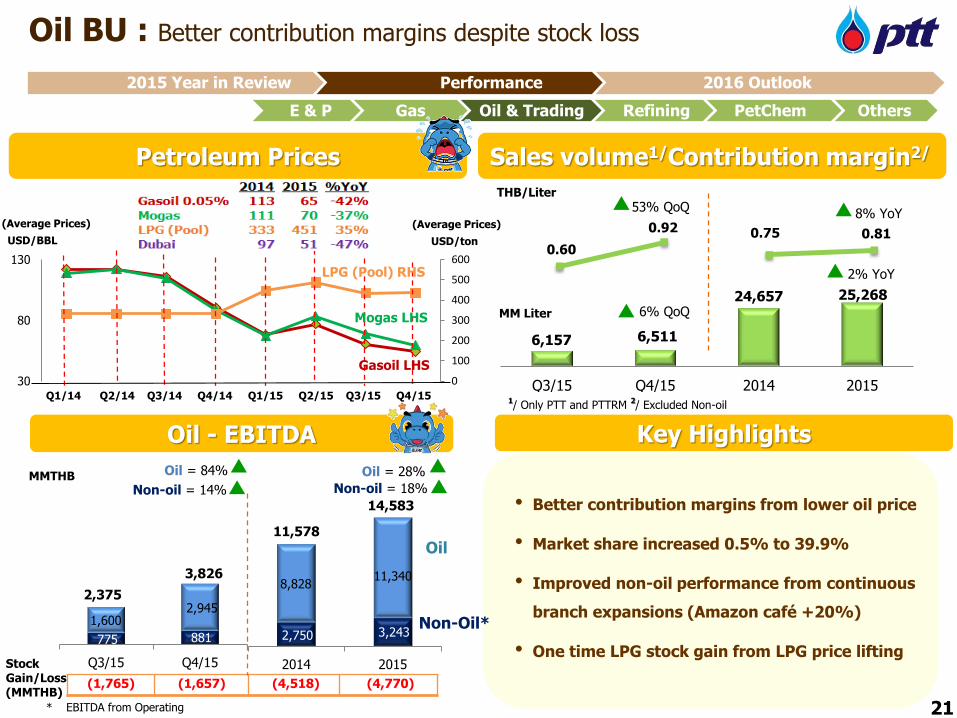
• Better contribution margins from lower oil price
• Market share increased 0.5% to 39.9%
• Improved non-oil performance from continuous
branch expansions (Amazon café +20%)
• One time LPG stock gain from LPG price lifting
0.60
0.92 0.75 0.81
2,750 3,243
8,828 11,340
2014 2015
11,578
14,583
Oil BU : Better contribution margins despite stock loss
MMTHB
THB/Liter
21
Oil
Non-Oil*
E & P Gas Oil & Trading Refining PetChem Others
* EBITDA from Operating
Sales volume1/Contribution margin2/
MM Liter
1/ Only PTT and PTTRM
2/ Excluded Non-oil
8% YoY
2% YoY
Oil = 28%
(1,765) (1,657) (4,518) (4,770)
Petroleum Prices
Stock Gain/Loss(MMTHB)
53% QoQ
6% QoQ
Oil - EBITDA
USD/BBL
(Average Prices)
Oil = 84%
0
100
200
300
400
500
600
30
80
130
Q1/14 Q2/14 Q3/14 Q4/14 Q1/15 Q2/15 Q3/15 Q4/15
2015 Year in Review Performance 2016 Outlook
Key Highlights
Non-oil = 18%Non-oil = 14%
USD/ton
(Average Prices)
Mogas LHS
Gasoil LHS
LPG (Pool) RHS
775 881
1,600 2,945
Q3/15 Q4/15
2,375
3,826
E & P Gas Oil & Trading Refining PetChem Others
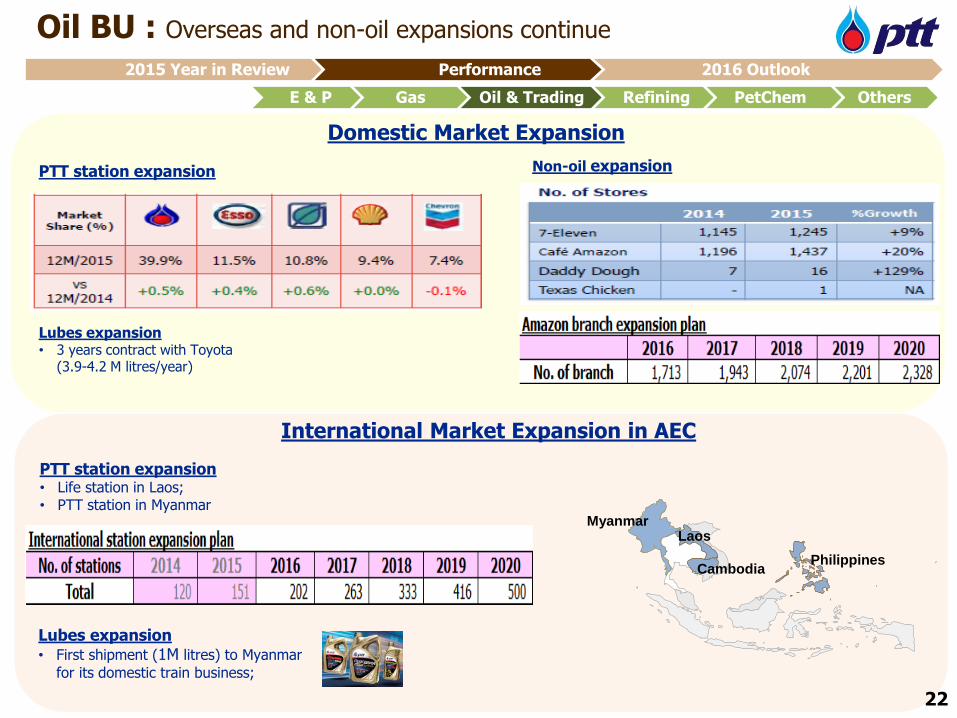
Oil BU : Overseas and non-oil expansions continue
22
Laos
CambodiaPhilippines
Myanmar
International Market Expansion in AEC
Domestic Market Expansion
Thailand
2015 Year in Review Performance 2016 Outlook
Lubes expansion• First shipment (1M litres) to Myanmar
for its domestic train business;
Lubes expansion• 3 years contract with Toyota
(3.9-4.2 M litres/year)
PTT station expansion• Life station in Laos;• PTT station in Myanmar
PTT station expansion Non-oil expansion
49.58 46.29
96.63
52.74
50% QoQ
0.06
0.09 0.10
0.07
Q3/15 Q4/15 2014 2015
30% YoY
* PTT only : FX Adjusted
859 1,170
5,070
3,719
Q3/15 Q4/15 2014 2015
19,532 20,438
78,595 81,285
Q3/15 Q4/15 2014 2015
5% QoQ
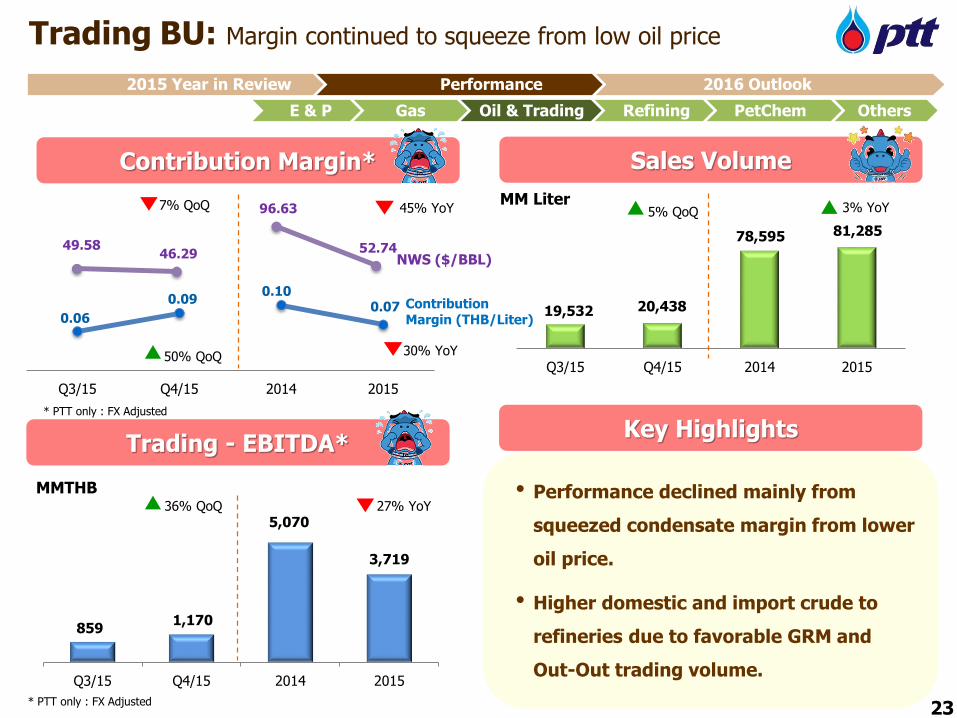
Trading BU: Margin continued to squeeze from low oil price
Contribution Margin*
Trading - EBITDA*
Sales Volume
Key Highlights
MMTHB
MM Liter
23
* PTT only : FX Adjusted
27% YoY
E & P Gas Oil & Trading Refining PetChem Others
Contribution Margin (THB/Liter)
NWS ($/BBL)
45% YoY 3% YoY7% QoQ
36% QoQ• Performance declined mainly from
squeezed condensate margin from lower
oil price.
• Higher domestic and import crude to
refineries due to favorable GRM and
Out-Out trading volume.
2015 Year in Review Performance 2016 Outlook
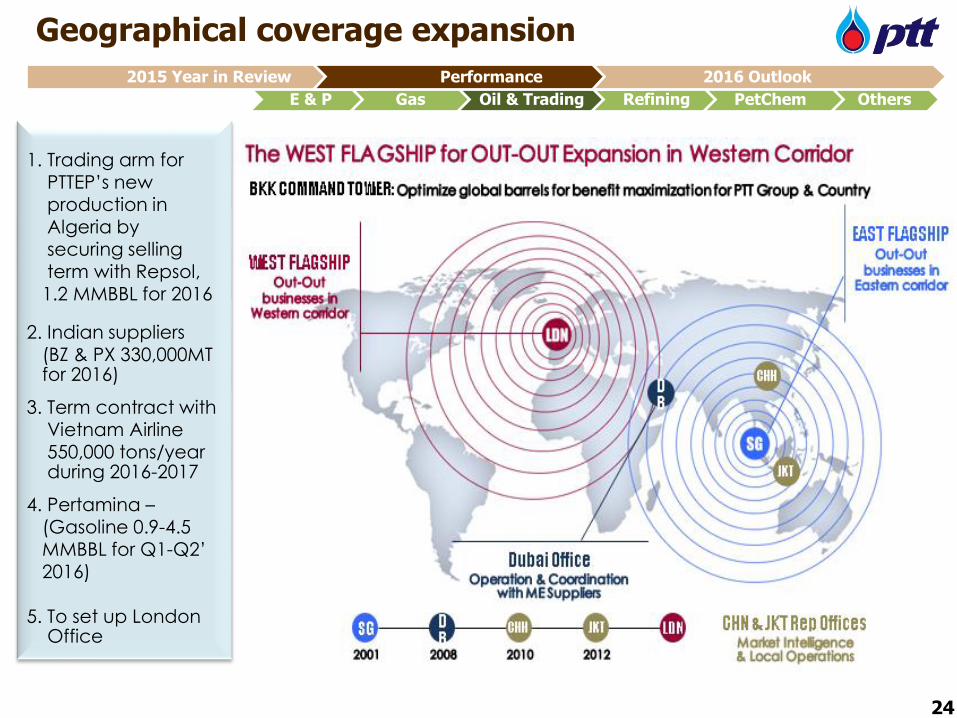
Geographical coverage expansion
24
E & P Gas Oil & Trading Refining PetChem Others
2015 Year in Review Performance 2016 Outlook
1. Trading arm for PTTEP’s new production in Algeria by securing selling term with Repsol, 1.2 MMBBL for 2016
2. Indian suppliers
(BZ & PX 330,000MT for 2016)
3. Term contract with Vietnam Airline 550,000 tons/year during 2016-2017
4. Pertamina –(Gasoline 0.9-4.5 MMBBL for Q1-Q2’ 2016)
5. To set up London Office
Stock gain/lossnet NRV
7,997 13,474
28,792
45,428
(10,013) (7,304)
(43,822)
(13,556)
Q3/15 Q4/15 2014 2015
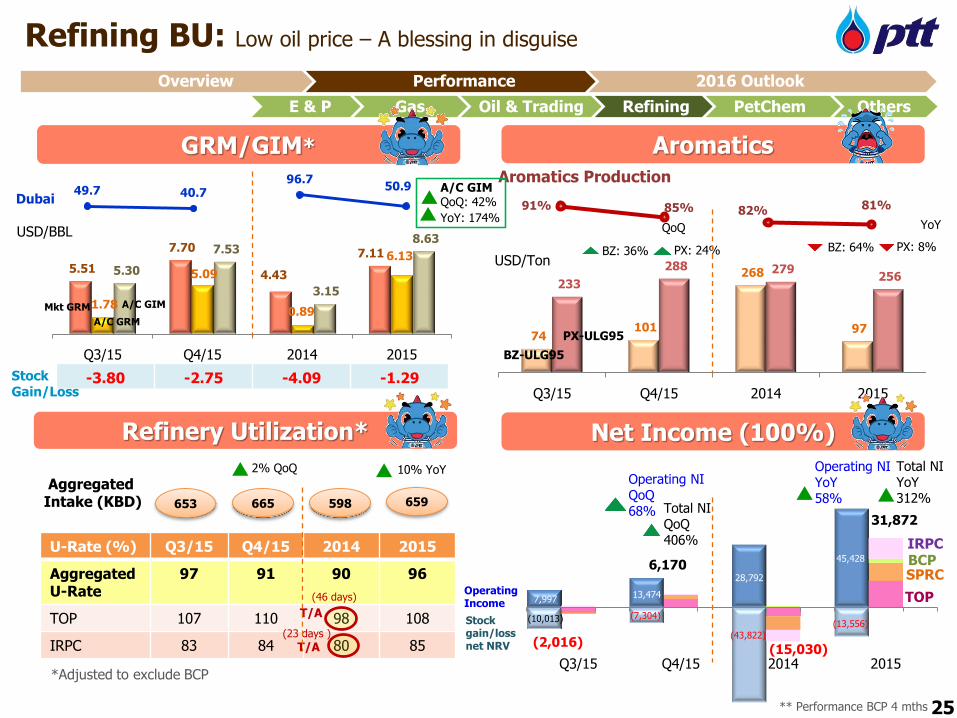
91% 85% 82% 81%
** Performance BCP 4 mths
74 101
268
97
233
288 279 256
Q3/15 Q4/15 2014 2015
49.7 40.796.7
50.9
5.51
7.70
4.43
7.11
1.78
5.09
0.89
6.13
5.30
7.53
3.15
8.63
Q3/15 Q4/15 2014 2015
GRM/GIM*
Refinery Utilization*
USD/BBL
A/C GRM
A/C GIMMkt GRM
Dubai
Net Income (100%)
U-Rate (%) Q3/15 Q4/15 2014 2015
Aggregated U-Rate
97 91 90 96
TOP 107 110 98 108
IRPC 83 84 80 85
Aggregated Intake (KBD) 665653
2% QoQ
598
AromaticsAromatics Production
BZ-ULG95
PX-ULG95
Refining BU: Low oil price – A blessing in disguise
25
BZ: 36%
QoQ
PX: 24%
-3.80 -2.75 -4.09 -1.29StockGain/Loss
T/A(23 days )
BZ: 64%
YoY
PX: 8%
E & P Gas Oil & Trading Refining PetChem Others
USD/Ton
659
10% YoY Total NIYoY312%
T/A
(46 days)
*Adjusted to exclude BCP
IRPC
TOP
SPRCBCP6,170
(2,016)
31,872Total NIQoQ406%
OperatingIncome
Operating NIYoY58%
Operating NIQoQ68%
A/C GIMQoQ: 42%
YoY: 174%
(15,030)
Overview Performance 2016 Outlook
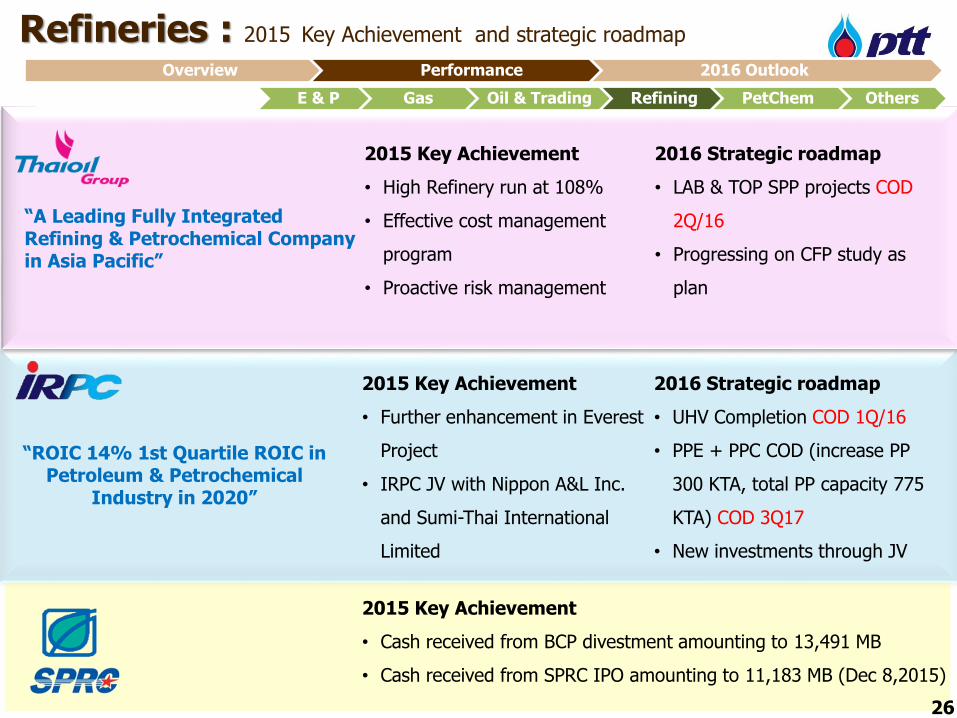
Refineries : 2015 Key Achievement and strategic roadmap
E & P Gas Oil & Trading Refining PetChem Others
Overview Performance 2016 Outlook
“ROIC 14% 1st Quartile ROIC in Petroleum & Petrochemical
Industry in 2020”
2015 Key Achievement
• Cash received from BCP divestment amounting to 13,491 MB
• Cash received from SPRC IPO amounting to 11,183 MB (Dec 8,2015)
2015 Key Achievement
• High Refinery run at 108%
• Effective cost management
program
• Proactive risk management
2016 Strategic roadmap
• LAB & TOP SPP projects COD
2Q/16
• Progressing on CFP study as
plan
2015 Key Achievement
• Further enhancement in Everest
Project
• IRPC JV with Nippon A&L Inc.
and Sumi-Thai International
Limited
2016 Strategic roadmap
• UHV Completion COD 1Q/16
• PPE + PPC COD (increase PP
300 KTA, total PP capacity 775
KTA) COD 3Q17
• New investments through JV
“A Leading Fully Integrated Refining & Petrochemical Company in Asia Pacific”
26
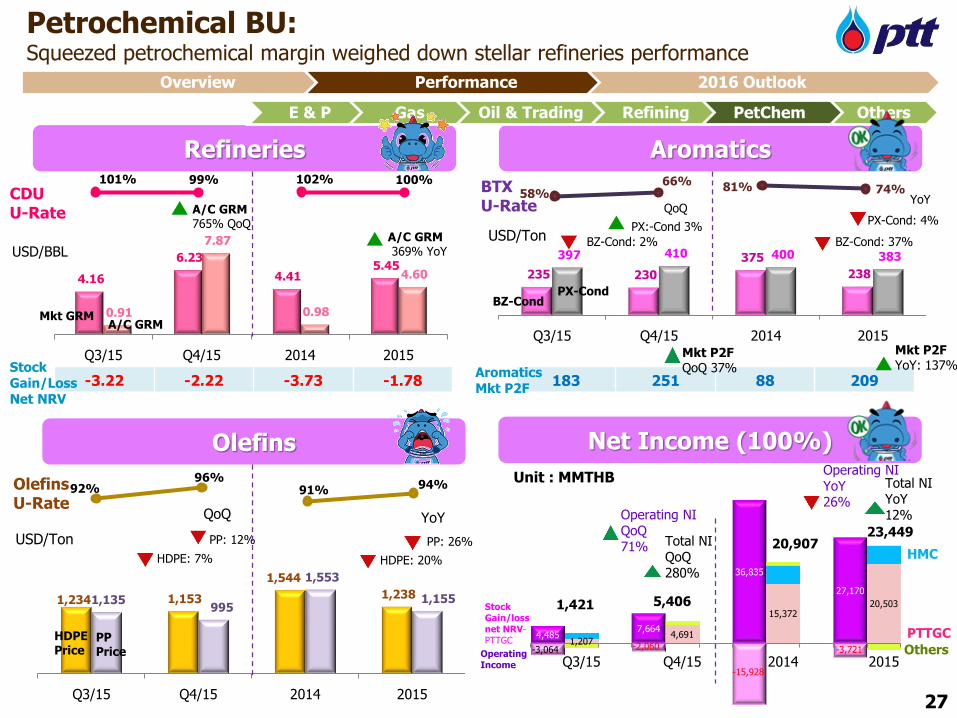
27
4.16
6.23
4.41 5.45
0.91
7.87
0.98
4.60
Q3/15 Q4/15 2014 2015
101% 99% 102% 100%58%
66% 81% 74%
1,234 1,153
1,544
1,238 1,135 995
1,553
1,155
Q3/15 Q4/15 2014 2015
235 230
375
238
397 410 400 383
Q3/15 Q4/15 2014 2015
Net Income (100%)
Aromatics
Unit : MMTHB
4,4851,207
7,6644,691
36,835
15,372
27,170
20,503
-3,064 -2,060
-15,928
-3,721
Q3/15 Q4/15 2014 2015
PTTGC
HMC
Others
5,406
Olefins U-Rate
92%96%
91% 94%
Olefins
USD/Ton
BTXU-Rate
Refineries
CDU U-Rate
A/C GRMMkt GRM
BZ-CondPX-Cond
-3.22 -2.22 -3.73 -1.78StockGain/LossNet NRV
Petrochemical BU: Squeezed petrochemical margin weighed down stellar refineries performance
1,421
HDPEPrice
PPPrice
HDPE: 7%
QoQ
PP: 12%
BZ-Cond: 2%
QoQ
PX:-Cond 3%
BZ-Cond: 37%
YoY
PX-Cond: 4%
HDPE: 20%
YoY
PP: 26%
E & P Gas Oil & Trading Refining PetChem Others
183 251 88 209
USD/TonUSD/BBL
Mkt P2FQoQ 37%Aromatics
Mkt P2F
A/C GRM 765% QoQ
Mkt P2FYoY: 137%
20,90723,449
Total NIYoY12%
Total NIQoQ280%
Operating Income
Stock Gain/loss net NRV-PTTGC
Operating NI YoY26%
Operating NI QoQ71%
A/C GRM 369% YoY
Overview Performance 2016 Outlook
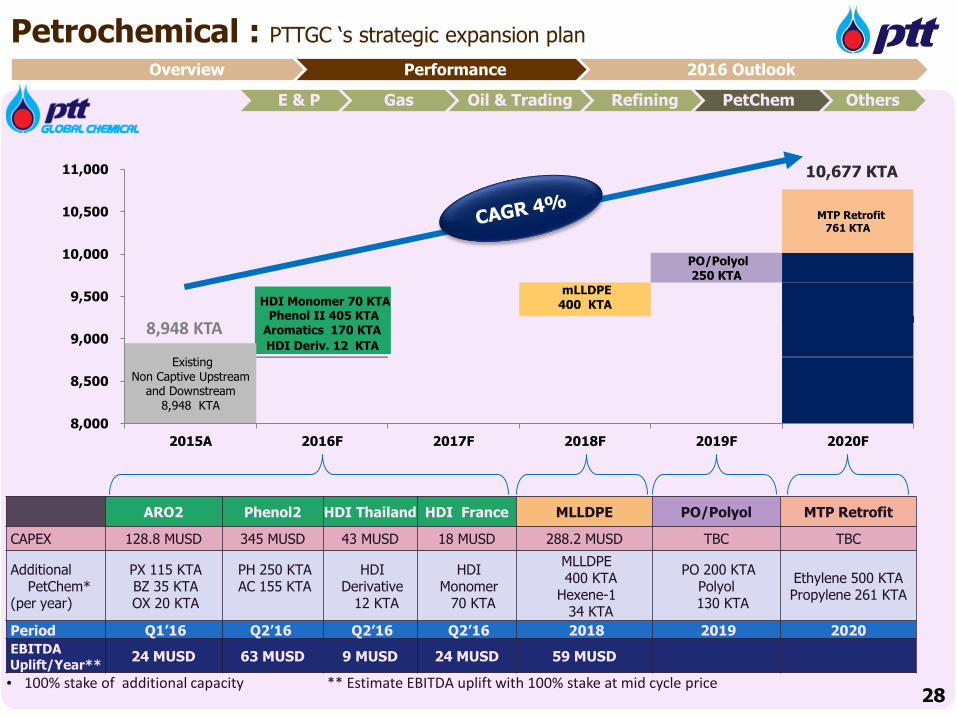
ARO2 Phenol2 HDI Thailand HDI France MLLDPE PO/Polyol MTP Retrofit
CAPEX 128.8 MUSD 345 MUSD 43 MUSD 18 MUSD 288.2 MUSD TBC TBC
Additional PetChem*
(per year)
PX 115 KTA BZ 35 KTAOX 20 KTA
PH 250 KTAAC 155 KTA
HDI Derivative
12 KTA
HDI Monomer
70 KTA
MLLDPE 400 KTA
Hexene-1 34 KTA
PO 200 KTAPolyol 130 KTA
Ethylene 500 KTAPropylene 261 KTA
Period Q1’16 Q2’16 Q2’16 Q2’16 2018 2019 2020
EBITDA Uplift/Year**
24 MUSD 63 MUSD 9 MUSD 24 MUSD 59 MUSD
• 100% stake of additional capacity ** Estimate EBITDA uplift with 100% stake at mid cycle price
Petrochemical : PTTGC ‘s strategic expansion plan
E & P Gas Oil & Trading Refining PetChem Others
Overview Performance 2016 Outlook
Existing Non Captive Upstream
and Downstream8,948 KTA
HDI Deriv. 12 KTA
Phenol II 405 KTAAromatics 170 KTA
HDI Monomer 70 KTAmLLDPE
400 KTA
PO/Polyol 250 KTA
MTP Retrofit761 KTA
8,000
8,500
9,000
9,500
10,000
10,500
11,000
2015A 2016F 2017F 2018F 2019F 2020F
8,948 KTA
10,677 KTA
28
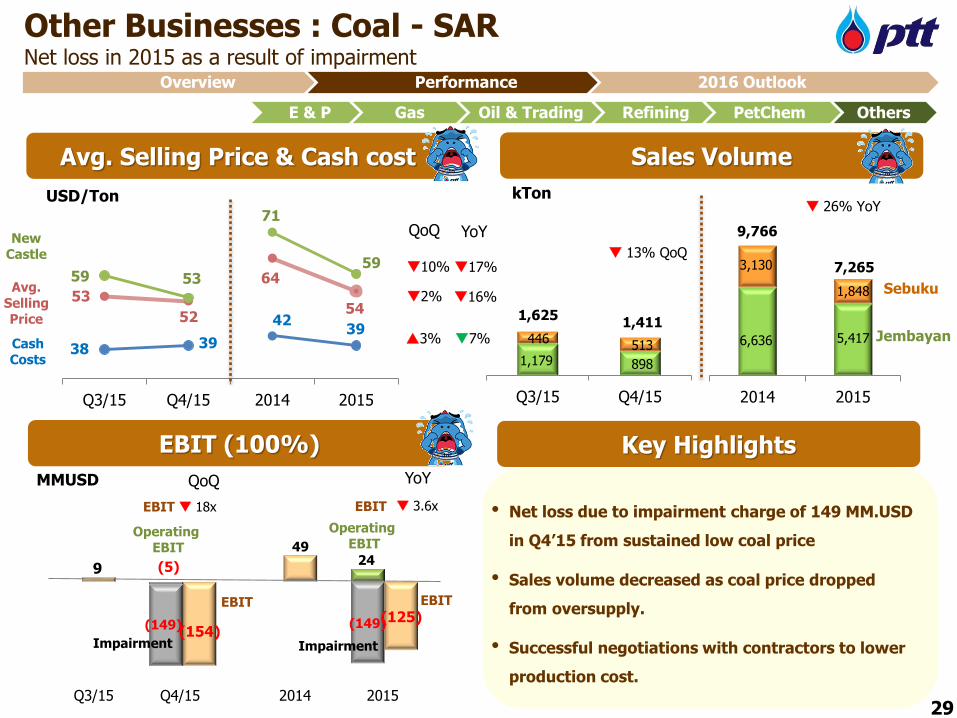
(5)
(149)(149)
24 9
(154)
49
(125)
Other Businesses : Coal - SAR Net loss in 2015 as a result of impairment
EBIT (100%)
Sales Volume
Key Highlights
MMUSD
USD/Ton
6,636 5,417
3,130
1,848
9,766
7,265
2014 2015
kTon
Jembayan
SebukuAvg. Selling Price
Cash Costs
13% QoQ
Avg. Selling Price & Cash cost
New Castle
2%
26% YoY
3.6x
Q3/15 Q4/15 2014 2015
Impairment
10%
3%
16%
17%
7%
•
29
EBIT 18x
QoQ YoY
YoYQoQ
E & P Gas Oil & Trading Refining PetChem Others
53
52
64
54
38 39
4239
59 53
71
59
Q3/15 Q4/15 2014 2015
Impairment
EBIT • Net loss due to impairment charge of 149 MM.USD
in Q4’15 from sustained low coal price
• Sales volume decreased as coal price dropped
from oversupply.
• Successful negotiations with contractors to lower
production cost.
Overview Performance 2016 Outlook
1,179 898
446 513
1,625 1,411
Q3/15 Q4/15
Operating EBIT
Operating EBIT
EBITEBIT
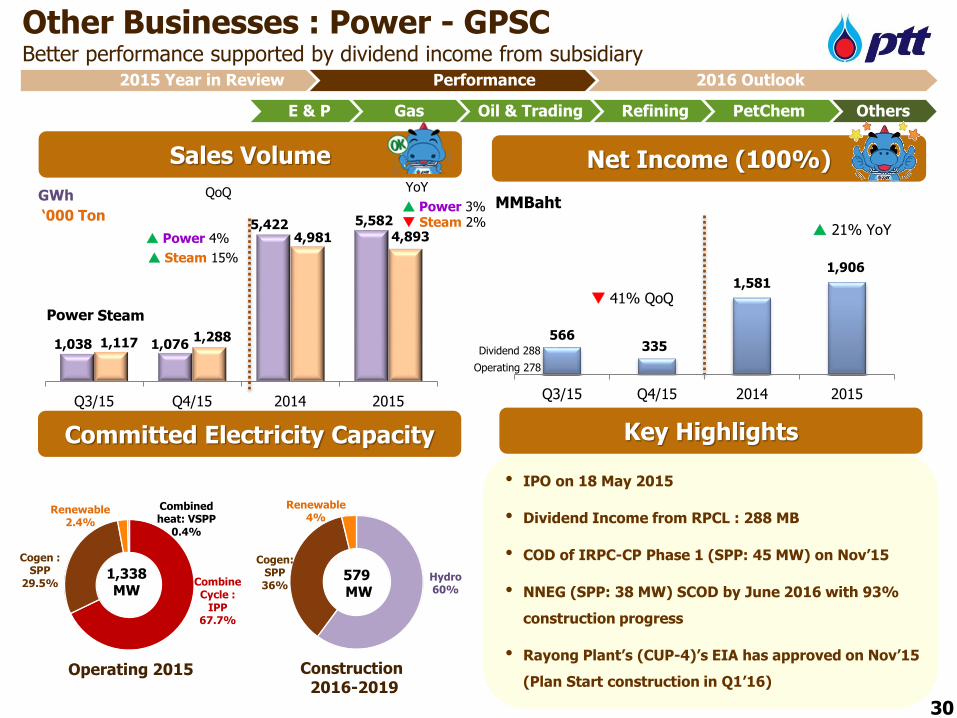
1,038 1,076
5,422 5,582
1,117 1,288
4,981 4,893
Q3/15 Q4/15 2014 2015
Net Income (100%)Sales Volume
Key Highlights
MMBahtGWh
Other Businesses : Power - GPSCBetter performance supported by dividend income from subsidiary
‘000 Ton
E & P Gas Oil & Trading Refining PetChem Others
Committed Electricity Capacity
Power Steam
30
QoQ YoY
Power 3%
Steam 15%
Steam 2%
Power 4%
566335
1,5811,906
Q3/15 Q4/15 2014 2015
21% YoY
41% QoQ
Operating 278
Dividend 288
Combine Cycle :
IPP67.7%
Cogen : SPP
29.5%
Renewable2.4%
Combined heat: VSPP
0.4%
Hydro60%
Cogen: SPP36%
Renewable4%
• IPO on 18 May 2015
• Dividend Income from RPCL : 288 MB
• COD of IRPC-CP Phase 1 (SPP: 45 MW) on Nov’15
• NNEG (SPP: 38 MW) SCOD by June 2016 with 93%
construction progress
• Rayong Plant’s (CUP-4)’s EIA has approved on Nov’15
(Plan Start construction in Q1’16)
2015 Year in Review Performance 2016 Outlook
Construction 2016-2019
Operating 2015
1,338 MW
579MW
99%
GA, 1%
Shareholding
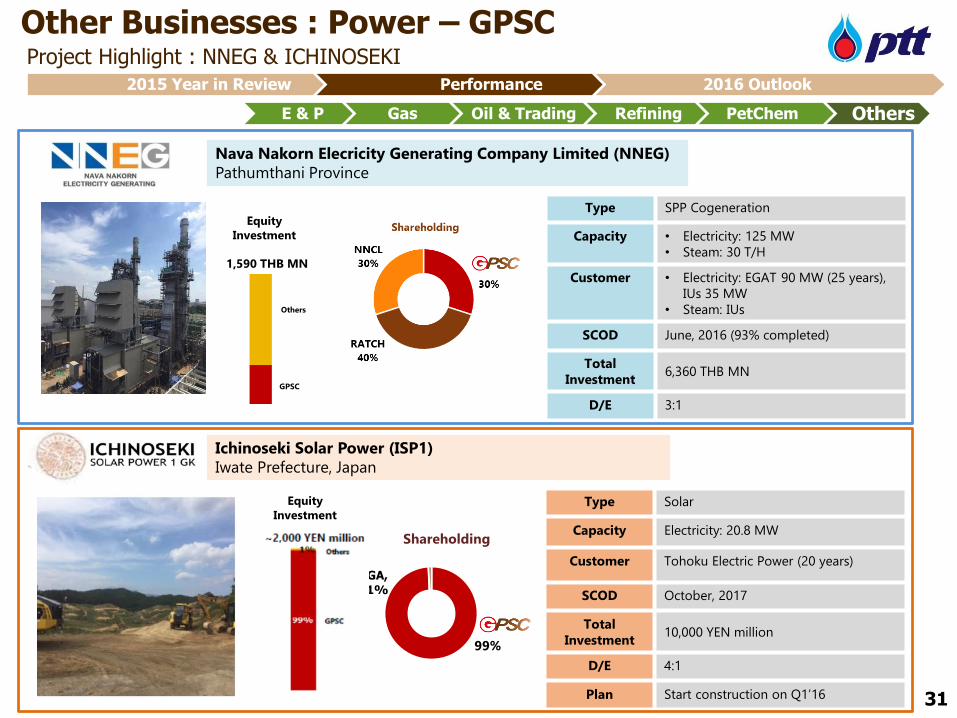
Other Businesses : Power – GPSC Project Highlight : NNEG & ICHINOSEKI
E & P Gas Oil & Trading Refining PetChem Others
31
Ichinoseki Solar Power (ISP1)
Iwate Prefecture, Japan
Type Solar
Capacity Electricity: 20.8 MW
Customer Tohoku Electric Power (20 years)
SCOD October, 2017
Total
Investment10,000 YEN million
D/E 4:1
Plan Start construction on Q1’16
Equity
Investment
2015 Year in Review Performance 2016 Outlook
Nava Nakorn Elecricity Generating Company Limited (NNEG)
Pathumthani Province
Equity
Investment
1,590 THB MN
GPSC
Others
Type SPP Cogeneration
Capacity • Electricity: 125 MW
• Steam: 30 T/H
Customer • Electricity: EGAT 90 MW (25 years),
IUs 35 MW
• Steam: IUs
SCOD June, 2016 (93% completed)
Total
Investment6,360 THB MN
D/E 3:1
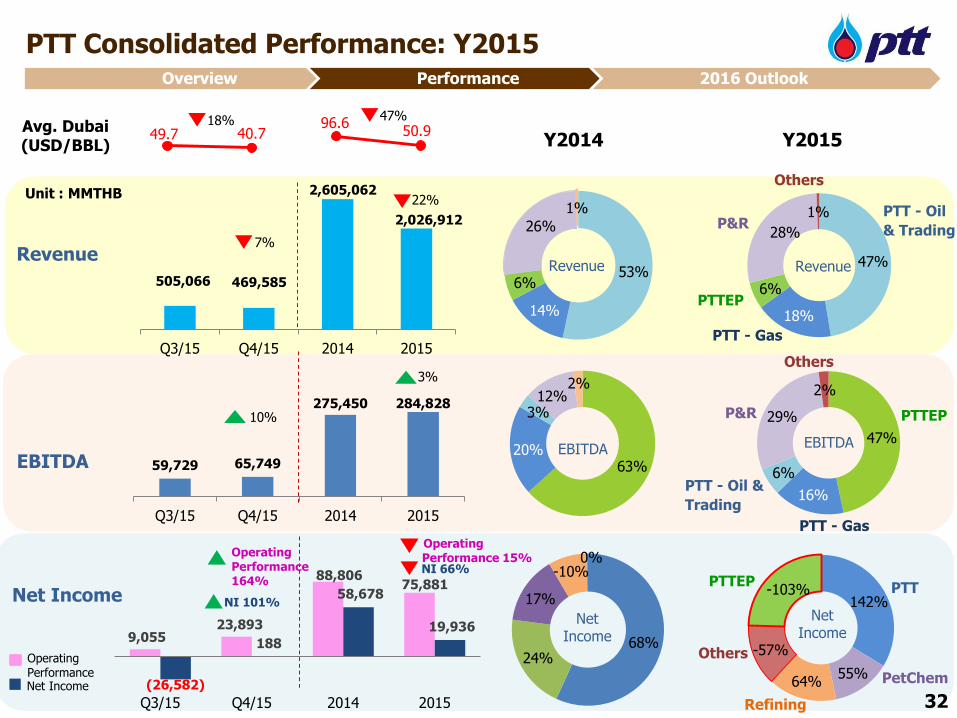
9,055 23,893
88,806 75,881
(26,582)
188
58,678
19,936
Q3/15 Q4/15 2014 2015
47%
18%
6%
28%
1% PTT - Oil
& Trading
PTT - Gas
Others
PTTEP
49.7 40.796.6
50.9
PTT Consolidated Performance: Y2015
Avg. Dubai (USD/BBL) Y2015Y2014
68%24%
17%
-10%0%
47%
16%
6%
29%
2%
PTT - Oil &
Trading
PTT - Gas
Others
PTTEP
505,066 469,585
2,605,062
2,026,912
Q3/15 Q4/15 2014 2015
142%
55%64%
-57%
-103% PTT
PetChem
Others
PTTEP
Refining
Net Income
Unit : MMTHB
EBITDA
Net Income
RevenueRevenue
EBITDA
53%
14%
6%
26%
1%
63%20%
3%12%
2%
Revenue
EBITDA
Net Income
59,729 65,749
275,450 284,828
Q3/15 Q4/15 2014 2015
32
P&R
P&R
22%
7%
10%
3%
NI 101%
18% 47%
NI 66%
Operating PerformanceNet Income
Overview Performance 2016 Outlook
Operating Performance 164%
Operating Performance 15%
33
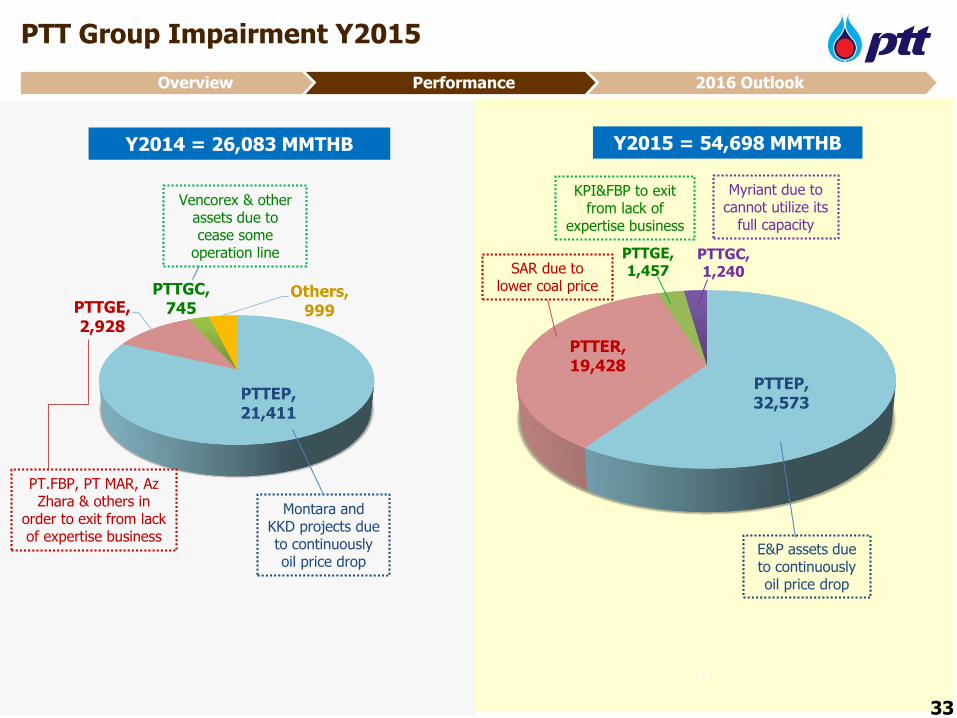
PTT Group Impairment Y2015
Overview Performance 2016 Outlook
33
Y2015 = 54,698 MMTHBY2014 = 26,083 MMTHB
PTTEP, 21,411
PTTGE, 2,928
PTTGC, 745
Others, 999
PTTEP, 32,573
PTTER, 19,428
PTTGE, 1,457
PTTGC, 1,240
Montara and KKD projects due to continuously oil price drop
Vencorex & other assets due to cease some
operation line
PT.FBP, PT MAR, AzZhara & others in
order to exit from lack of expertise business
E&P assets due to continuously oil price drop
KPI&FBP to exit from lack of
expertise business
Myriant due to cannot utilize its
full capacity
SAR due to lower coal price
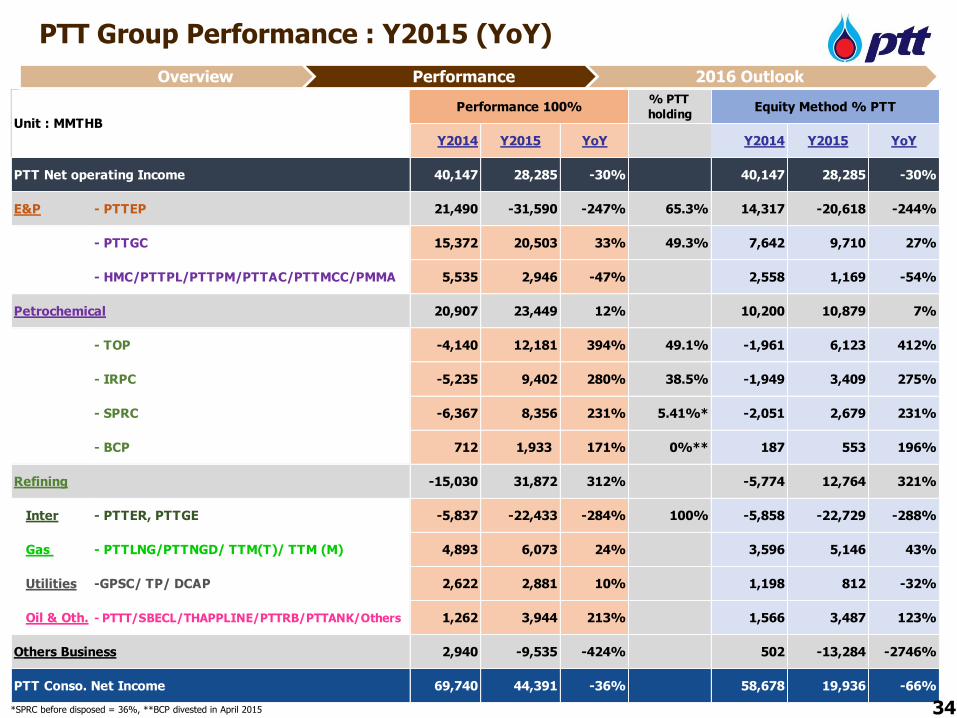
PTT Group Performance : Y2015 (YoY)
% PTT
holding
Y2014 Y2015 YoY Y2014 Y2015 YoY
PTT Net operating Income 40,147 28,285 -30% 40,147 28,285 -30%
E&P - PTTEP 21,490 -31,590 -247% 65.3% 14,317 -20,618 -244%
- PTTGC 15,372 20,503 33% 49.3% 7,642 9,710 27%
- HMC/PTTPL/PTTPM/PTTAC/PTTMCC/PMMA 5,535 2,946 -47% 2,558 1,169 -54%
Petrochemical 20,907 23,449 12% 10,200 10,879 7%
- TOP -4,140 12,181 394% 49.1% -1,961 6,123 412%
- IRPC -5,235 9,402 280% 38.5% -1,949 3,409 275%
- SPRC -6,367 8,356 231% 5.41%* -2,051 2,679 231%
- BCP 712 1,933 171% 0%** 187 553 196%
Refining -15,030 31,872 312% -5,774 12,764 321%
Inter - PTTER, PTTGE -5,837 -22,433 -284% 100% -5,858 -22,729 -288%
Gas - PTTLNG/PTTNGD/ TTM(T)/ TTM (M) 4,893 6,073 24% 3,596 5,146 43%
Utilities -GPSC/ TP/ DCAP 2,622 2,881 10% 1,198 812 -32%
Oil & Oth. - PTTT/SBECL/THAPPLINE/PTTRB/PTTANK/Others 1,262 3,944 213% 1,566 3,487 123%
Others Business 2,940 -9,535 -424% 502 -13,284 -2746%
PTT Conso. Net Income 69,740 44,391 -36% 58,678 19,936 -66%
Equity Method % PTTPerformance 100%
Unit : MMTHB
34
Overview Performance 2016 Outlook
*SPRC before disposed = 36%, **BCP divested in April 2015
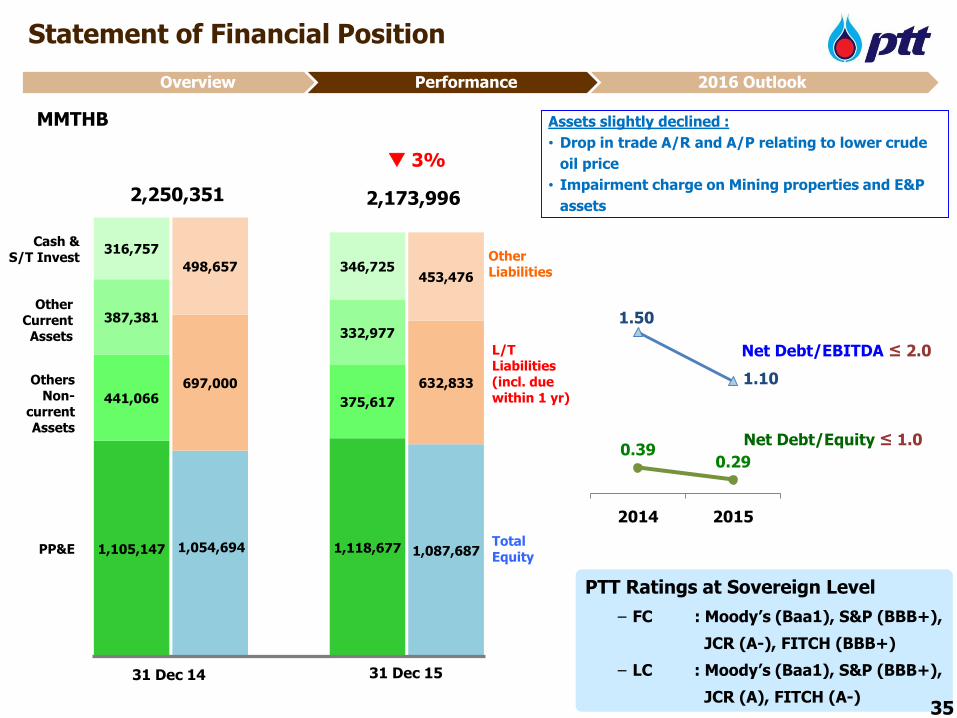
0.390.29
1.50
1.10
0.00
0.50
1.00
1.50
2.00
(0.1)
0.1
0.3
0.5
0.7
0.9
2014 2015
Other Liabilities
PP&E
Others Non-
currentAssets
OtherCurrentAssets
L/TLiabilities(incl. due within 1 yr)
TotalEquity
MMTHB
Cash & S/T Invest
31 Dec 13 30 Sep 14
1,805,041 1,818,746
Statement of Financial Position
PTT Ratings at Sovereign Level
− FC : Moody’s (Baa1), S&P (BBB+),
JCR (A-), FITCH (BBB+)
− LC : Moody’s (Baa1), S&P (BBB+),
JCR (A), FITCH (A-)
Net Debt/EBITDA ≤ 2.0
Net Debt/Equity ≤ 1.0
1,105,147 1,118,677
441,066 375,617
387,381332,977
316,757
346,725
1,054,694 1,087,687
697,000 632,833
498,657453,476
1 2 3 4 5
3%
2,173,9962,250,351
31 Dec 1531 Dec 14
Assets slightly declined :
• Drop in trade A/R and A/P relating to lower crude
oil price
• Impairment charge on Mining properties and E&P
assets
35
Overview Performance 2016 Outlook
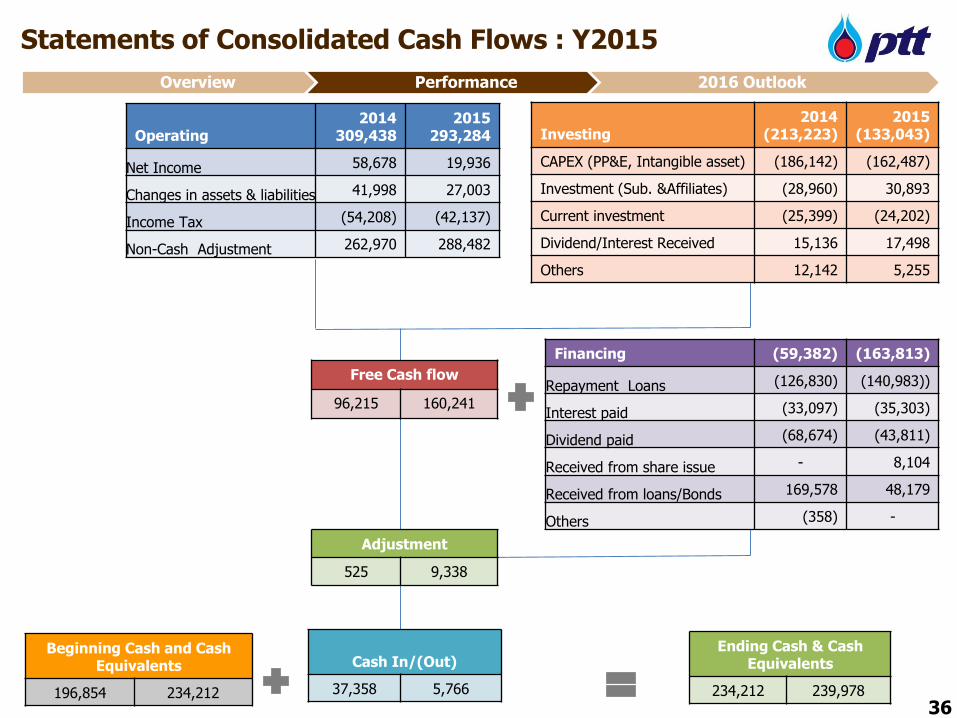
Free Cash flow
96,215 160,241
Investing2014
(213,223)2015
(133,043)
CAPEX (PP&E, Intangible asset) (186,142) (162,487)
Investment (Sub. &Affiliates) (28,960) 30,893
Current investment (25,399) (24,202)
Dividend/Interest Received 15,136 17,498
Others 12,142 5,255
Operating2014
309,4382015
293,284
Net Income 58,678 19,936
Changes in assets & liabilities 41,998 27,003
Income Tax (54,208) (42,137)
Non-Cash Adjustment 262,970 288,482
Ending Cash & Cash Equivalents
234,212 239,978
Beginning Cash and Cash Equivalents
196,854 234,212
Cash In/(Out)
37,358 5,766
Adjustment
525 9,338
Financing (59,382) (163,813)
Repayment Loans (126,830) (140,983))
Interest paid (33,097) (35,303)
Dividend paid (68,674) (43,811)
Received from share issue - 8,104
Received from loans/Bonds 169,578 48,179
Others (358) -
Statements of Consolidated Cash Flows : Y2015
36
Overview Performance 2016 Outlook
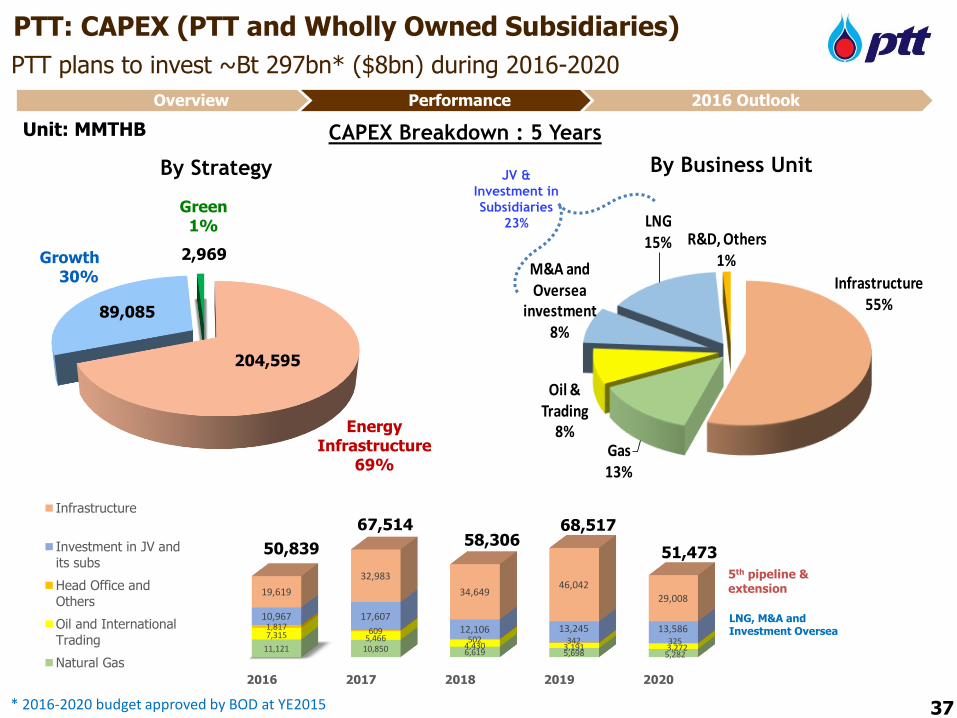
2016 2017 2018 2019 2020
11,121 10,850 6,619 5,698 5,282
7,315 5,4664,430 3,191 3,272
1,817 609502 342 325
10,967 17,60712,106 13,245 13,586
19,619
32,983
34,64946,042
29,008
Infrastructure
Investment in JV andits subs
Head Office andOthers
Oil and InternationalTrading
Natural Gas
204,595
89,085
2,969
Infrastructure55%
Gas13%
Oil & Trading
8%
M&A and Oversea
investment8%
LNG15% R&D, Others
1%
PTT: CAPEX (PTT and Wholly Owned Subsidiaries)
PTT plans to invest ~Bt 297bn* ($8bn) during 2016-2020
CAPEX Breakdown : 5 Years
By Business UnitJV &
Investment in
Subsidiaries
23%
37
67,514 68,517
51,47350,83958,306
* 2016-2020 budget approved by BOD at YE2015
5th pipeline & extension
LNG, M&A and Investment Oversea
Energy Infrastructure
69%
Green1%
Growth30%
Unit: MMTHB
By Strategy
Overview Performance 2016 Outlook
2015 Year in Review
Performance
2016 Outlook
2015 Year in Review Performance 2016 Outlook
38
Contents
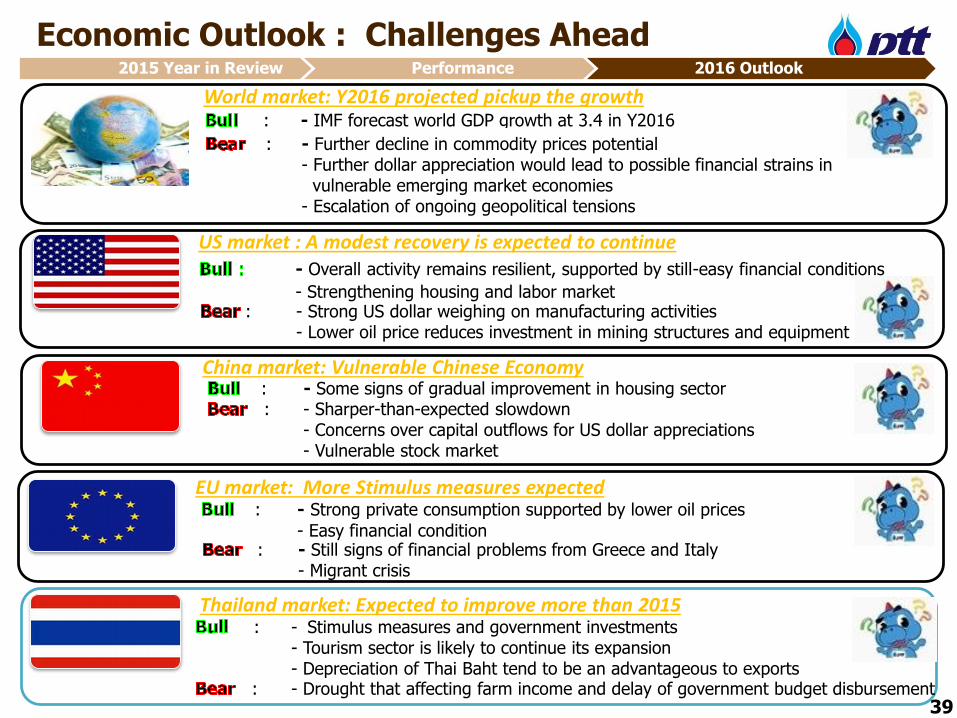
: - Some signs of gradual improvement in housing sector
: - IMF forecast world GDP growth at 3.4 in Y2016
: - Further decline in commodity prices potential- Further dollar appreciation would lead to possible financial strains in
vulnerable emerging market economies- Escalation of ongoing geopolitical tensions
Economic Outlook : Challenges Ahead
US market : A modest recovery is expected to continue
EU market: More Stimulus measures expected : - Strong private consumption supported by lower oil prices
- Easy financial condition: - Still signs of financial problems from Greece and Italy
- Migrant crisis
Thailand market: Expected to improve more than 2015: - Stimulus measures and government investments
- Tourism sector is likely to continue its expansion- Depreciation of Thai Baht tend to be an advantageous to exports
: - Drought that affecting farm income and delay of government budget disbursement
World market: Y2016 projected pickup the growth
: - Sharper-than-expected slowdown- Concerns over capital outflows for US dollar appreciations- Vulnerable stock market
China market: Vulnerable Chinese Economy
- Overall activity remains resilient, supported by still-easy financial conditions
- Strengthening housing and labor market : - Strong US dollar weighing on manufacturing activities
- Lower oil price reduces investment in mining structures and equipment
39
2015 Year in Review Performance 2016 Outlook
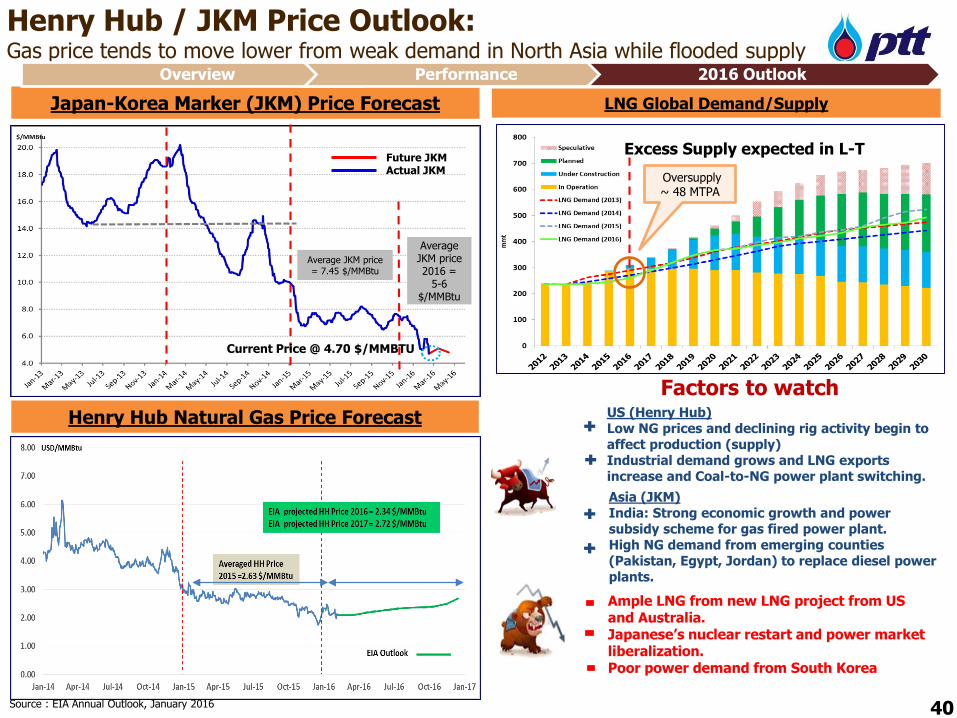
US (Henry Hub)Low NG prices and declining rig activity begin to affect production (supply)Industrial demand grows and LNG exports increase and Coal-to-NG power plant switching.
Factors to watch
Source : EIA Annual Outlook, January 2016
Henry Hub Natural Gas Price Forecast
Henry Hub / JKM Price Outlook: Gas price tends to move lower from weak demand in North Asia while flooded supply
LNG Global Demand/Supply
Ample LNG from new LNG project from US and Australia. Japanese’s nuclear restart and power market liberalization.Poor power demand from South Korea
Japan-Korea Marker (JKM) Price Forecast
Excess Supply expected in L-T
Average JKM price= 7.45 $/MMBtu
Asia (JKM)India: Strong economic growth and power subsidy scheme for gas fired power plant.High NG demand from emerging counties (Pakistan, Egypt, Jordan) to replace diesel power plants.
40
Current Price @ 4.70 $/MMBTU
Future JKM Actual JKM
Oversupply ~ 48 MTPA
Average JKM price2016 =
5-6 $/MMBtu
Overview Performance 2016 Outlook
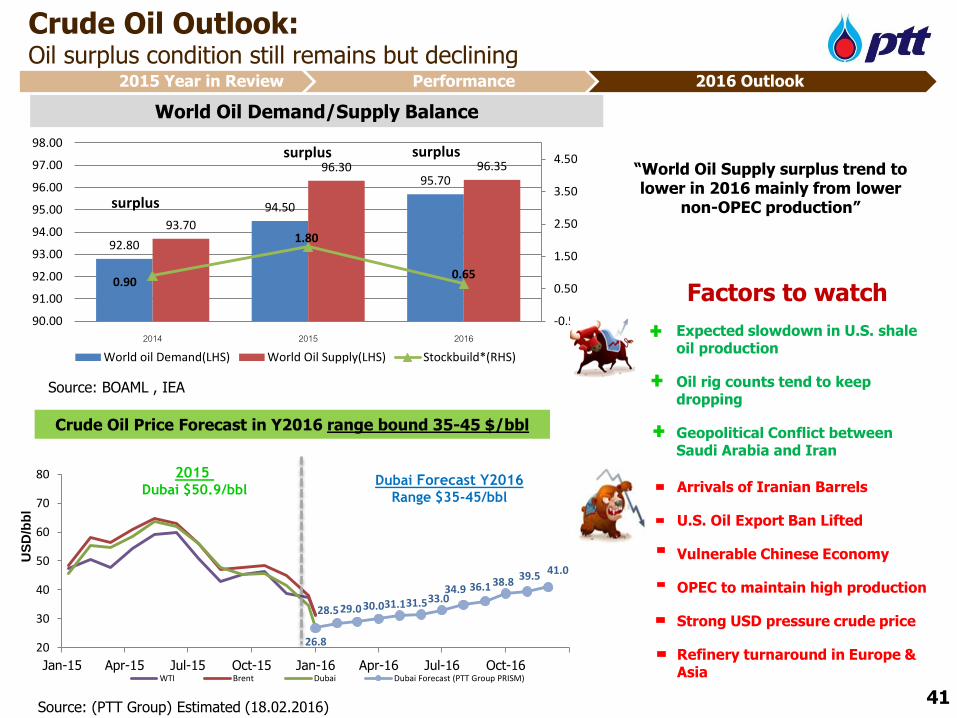
92.80
94.50
95.70
93.70
96.30 96.35
0.90
1.80
0.65
-0.50
0.50
1.50
2.50
3.50
4.50
90.00
91.00
92.00
93.00
94.00
95.00
96.00
97.00
98.00
2014 2015 2016
World oil Demand(LHS) World Oil Supply(LHS) Stockbuild*(RHS)
26.8
28.529.0 30.031.131.533.034.9 36.1 38.8
39.5 41.0
20
30
40
50
60
70
80
Jan-15 Apr-15 Jul-15 Oct-15 Jan-16 Apr-16 Jul-16 Oct-16WTI Brent Dubai Dubai Forecast (PTT Group PRISM)
2015 Dubai $50.9/bbl
Dubai Forecast Y2016Range $35-45/bbl
Expected slowdown in U.S. shale oil production
Oil rig counts tend to keep dropping
Geopolitical Conflict between Saudi Arabia and Iran
“World Oil Supply surplus trend to lower in 2016 mainly from lower
non-OPEC production”
Source: (PTT Group) Estimated (18.02.2016)
Crude Oil Outlook: Oil surplus condition still remains but declining
Arrivals of Iranian Barrels
U.S. Oil Export Ban Lifted
Vulnerable Chinese Economy
OPEC to maintain high production
Strong USD pressure crude price
Refinery turnaround in Europe & Asia
Crude Oil Price Forecast in Y2016 range bound 35-45 $/bbl
Factors to watch
World Oil Demand/Supply Balance
Source: BOAML , IEA
surplus
surplus surplus
US
D/b
bl
41
2015 Year in Review Performance 2016 Outlook
Source: FACTS, DB, KBC, Reuters , IEA, Reuters, Thaioil and PRISM Estimated ( Feb 2016)
-15.0
-10.0
-5.0
0.0
5.0
10.0
15.0
20.0
25.0
30.0
Jan-15 Apr-15 Jul-15 Oct-15 Jan-16 Apr-16 Jul-16 Oct-16
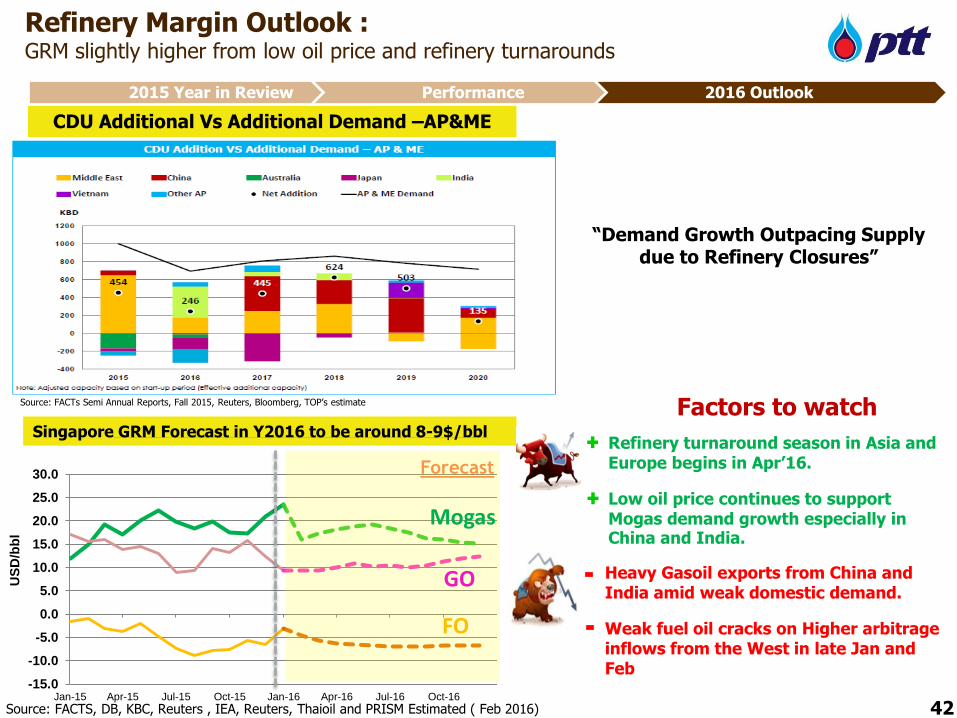
Refinery turnaround season in Asia and Europe begins in Apr’16.
Low oil price continues to support Mogas demand growth especially in China and India.
Forecast
GO
Mogas
FO
Heavy Gasoil exports from China and India amid weak domestic demand.
Weak fuel oil cracks on Higher arbitrage inflows from the West in late Jan and Feb
Singapore GRM Forecast in Y2016 to be around 8-9$/bbl
Factors to watch
“Demand Growth Outpacing Supply due to Refinery Closures”
Refinery Margin Outlook : GRM slightly higher from low oil price and refinery turnarounds
CDU Additional Vs Additional Demand –AP&ME
Source: FACTs Semi Annual Reports, Fall 2015, Reuters, Bloomberg, TOP’s estimate
US
D/b
bl
42
2015 Year in Review Performance 2016 Outlook
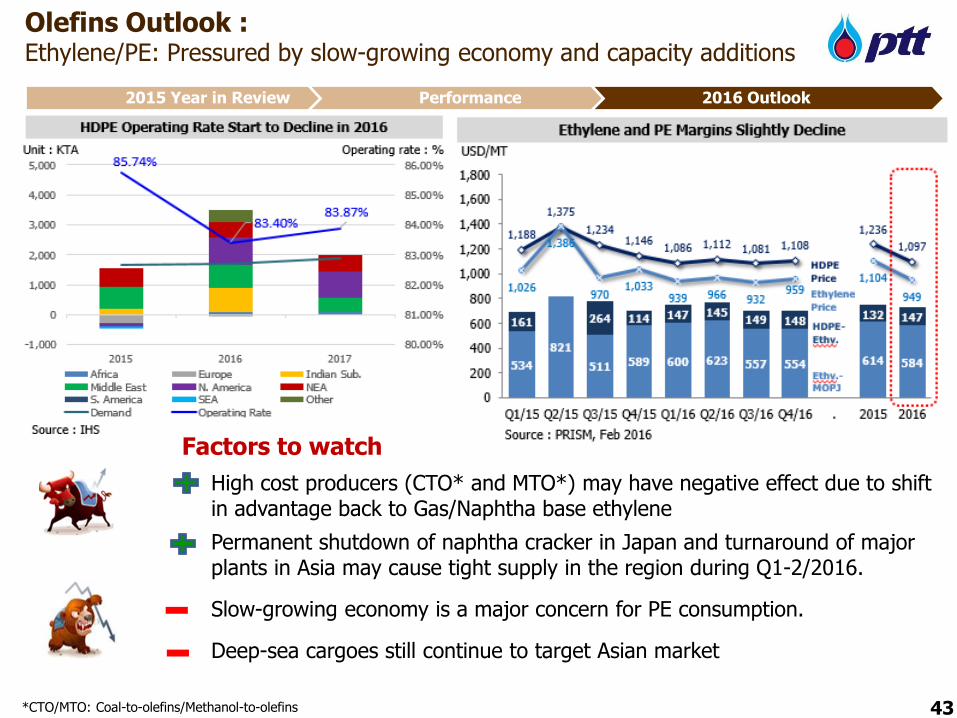
Olefins Outlook :Ethylene/PE: Pressured by slow-growing economy and capacity additions
43
High cost producers (CTO* and MTO*) may have negative effect due to shift in advantage back to Gas/Naphtha base ethylene
Permanent shutdown of naphtha cracker in Japan and turnaround of major plants in Asia may cause tight supply in the region during Q1-2/2016.
Slow-growing economy is a major concern for PE consumption.
Deep-sea cargoes still continue to target Asian market
Factors to watch
*CTO/MTO: Coal-to-olefins/Methanol-to-olefins
2015 Year in Review Performance 2016 Outlook
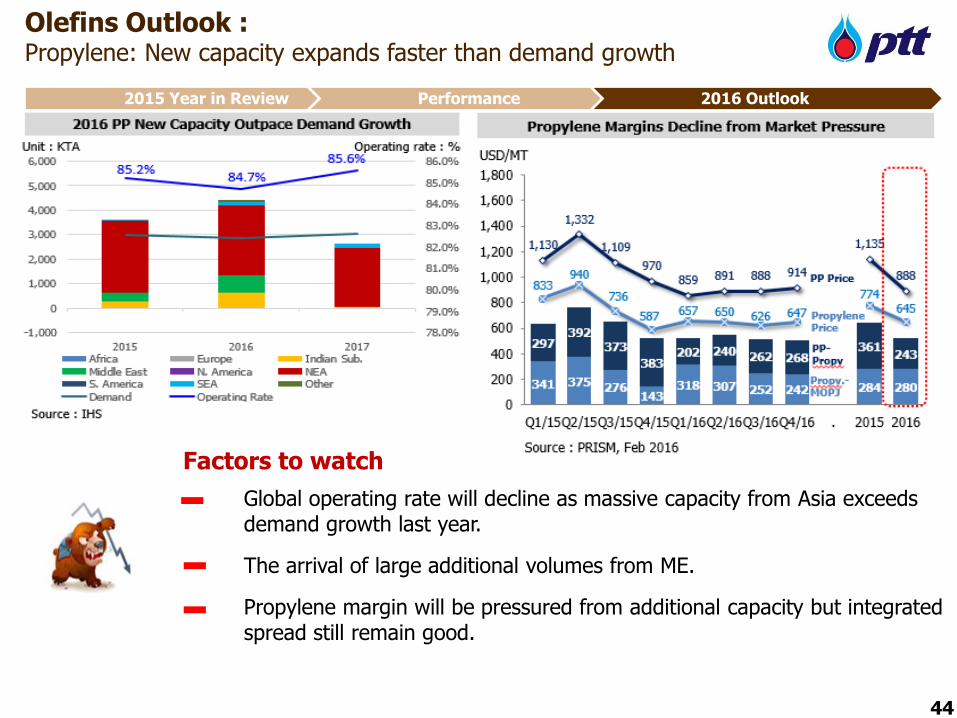
Olefins Outlook :Propylene: New capacity expands faster than demand growth
44
Global operating rate will decline as massive capacity from Asia exceeds demand growth last year.
The arrival of large additional volumes from ME.
Propylene margin will be pressured from additional capacity but integrated spread still remain good.
Factors to watch
2015 Year in Review Performance 2016 Outlook
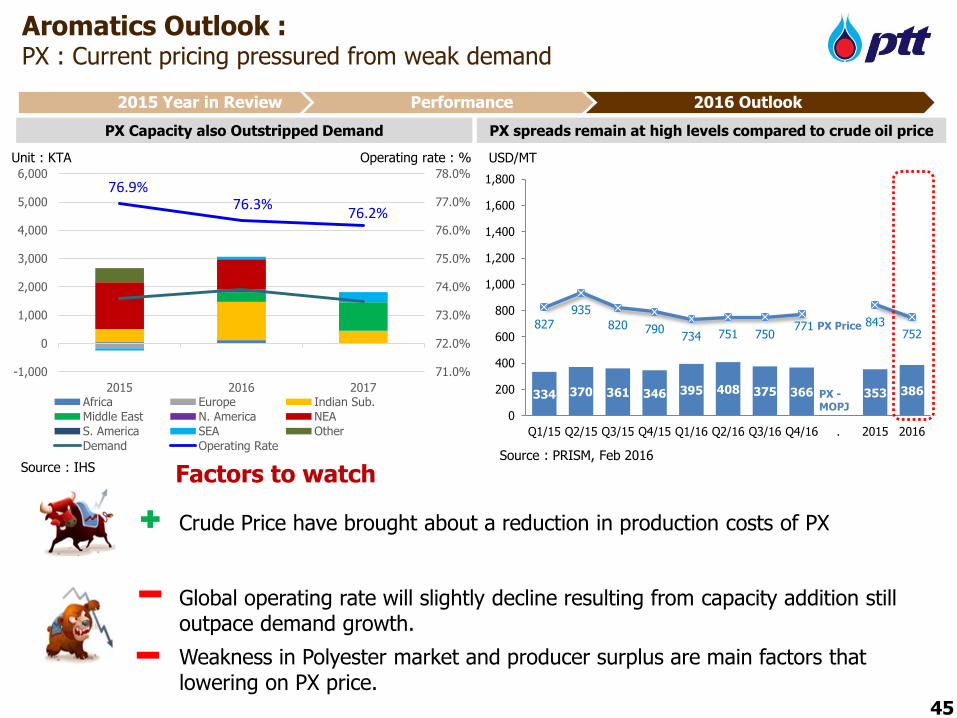
Aromatics Outlook :PX : Current pricing pressured from weak demand
PX Capacity also Outstripped Demand
Crude Price have brought about a reduction in production costs of PX
Global operating rate will slightly decline resulting from capacity addition still outpace demand growth.
Weakness in Polyester market and producer surplus are main factors that lowering on PX price.
PX spreads remain at high levels compared to crude oil price
334 370 361 346 395 408 375 366 353 386
827935
820 790734 751 750
771 843752
0
200
400
600
800
1,000
1,200
1,400
1,600
1,800
Q1/15 Q2/15 Q3/15 Q4/15 Q1/16 Q2/16 Q3/16 Q4/16 . 2015 2016
USD/MT
PX -MOPJ
PX Price
Source : PRISM, Feb 2016Source : IHS
76.9%76.3%
76.2%
71.0%
72.0%
73.0%
74.0%
75.0%
76.0%
77.0%
78.0%
-1,000
0
1,000
2,000
3,000
4,000
5,000
6,000
2015 2016 2017Africa Europe Indian Sub.
Middle East N. America NEA
S. America SEA Other
Demand Operating Rate
Unit : KTA Operating rate : %
Factors to watch
45
2015 Year in Review Performance 2016 Outlook
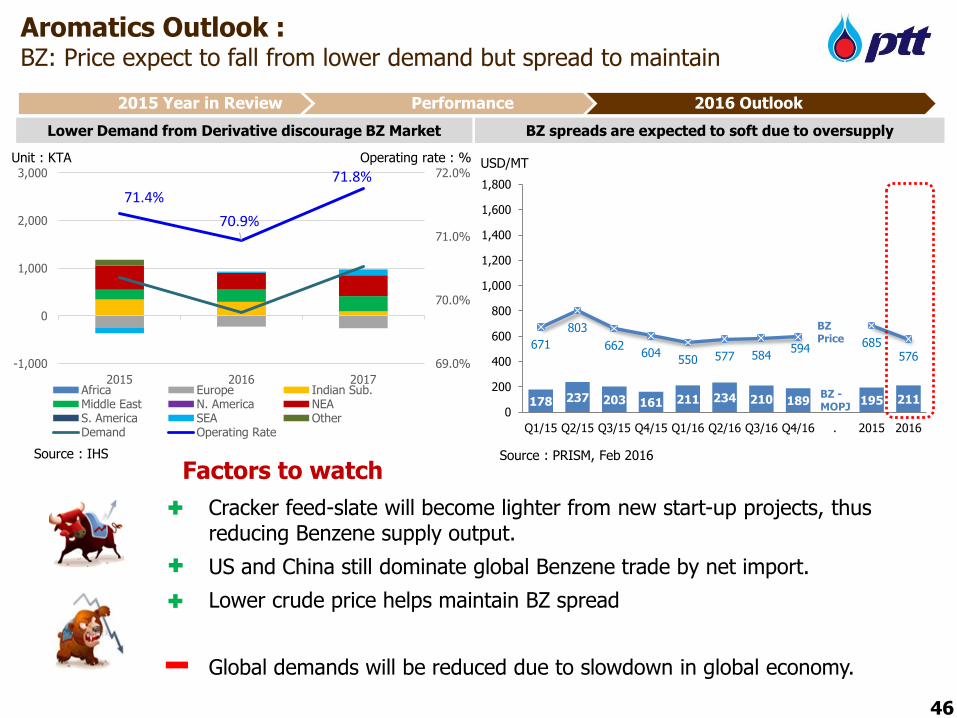
Aromatics Outlook :BZ: Price expect to fall from lower demand but spread to maintain
Lower Demand from Derivative discourage BZ Market
Cracker feed-slate will become lighter from new start-up projects, thus reducing Benzene supply output.
US and China still dominate global Benzene trade by net import.
Lower crude price helps maintain BZ spread
Global demands will be reduced due to slowdown in global economy.
BZ spreads are expected to soft due to oversupply
178 237 203 161 211 234 210 189 195 211
671
803
662604
550 577 584594 685
576
0
200
400
600
800
1,000
1,200
1,400
1,600
1,800
Q1/15 Q2/15 Q3/15 Q4/15 Q1/16 Q2/16 Q3/16 Q4/16 . 2015 2016
USD/MT
BZ -MOPJ
BZ Price
Source : IHS
71.4%
70.9%
71.8%
69.0%
70.0%
71.0%
72.0%
-1,000
0
1,000
2,000
3,000
2015 2016 2017Africa Europe Indian Sub.Middle East N. America NEAS. America SEA OtherDemand Operating Rate
Unit : KTA Operating rate : %
Source : PRISM, Feb 2016
Factors to watch
46
2015 Year in Review Performance 2016 Outlook
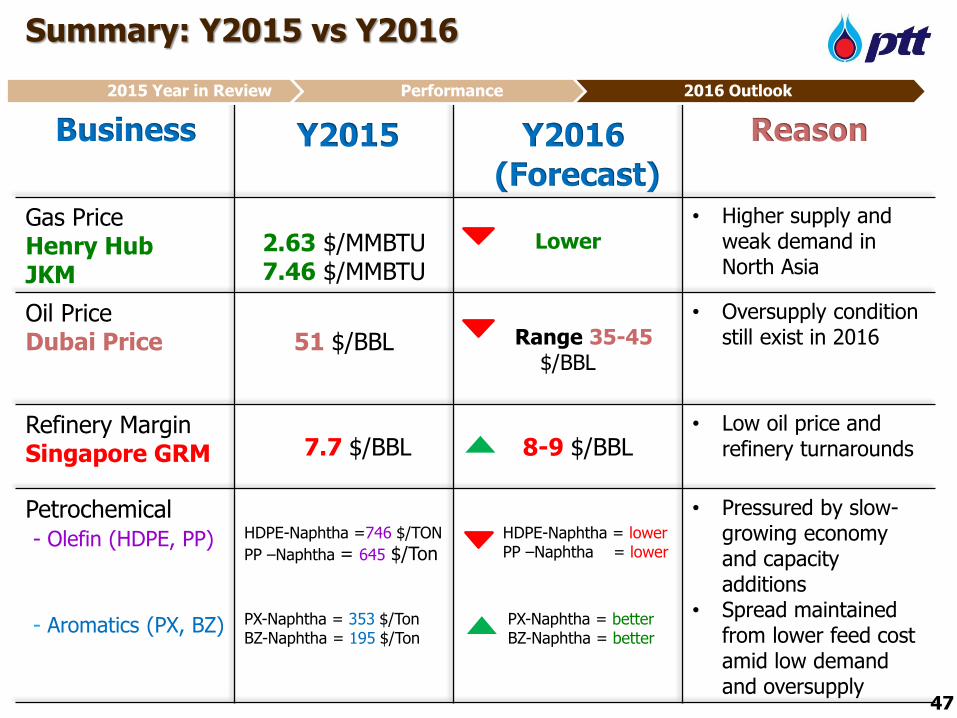
Summary: Y2015 vs Y2016
Business Y2015 Y2016
(Forecast)
Reason
Gas PriceHenry HubJKM
2.63 $/MMBTU7.46 $/MMBTU
Lower• Higher supply and
weak demand in North Asia
Oil PriceDubai Price 51 $/BBL Range 35-45
$/BBL
• Oversupply condition still exist in 2016
Refinery MarginSingapore GRM 7.7 $/BBL 8-9 $/BBL
• Low oil price and refinery turnarounds
Petrochemical - Olefin (HDPE, PP)
- Aromatics (PX, BZ)
HDPE-Naphtha =746 $/TON
PP –Naphtha = 645 $/Ton
PX-Naphtha = 353 $/TonBZ-Naphtha = 195 $/Ton
HDPE-Naphtha = lowerPP –Naphtha = lower
PX-Naphtha = betterBZ-Naphtha = better
• Pressured by slow-growing economy and capacity additions
• Spread maintained from lower feed cost amid low demand and oversupply
47
2015 Year in Review Performance 2016 Outlook
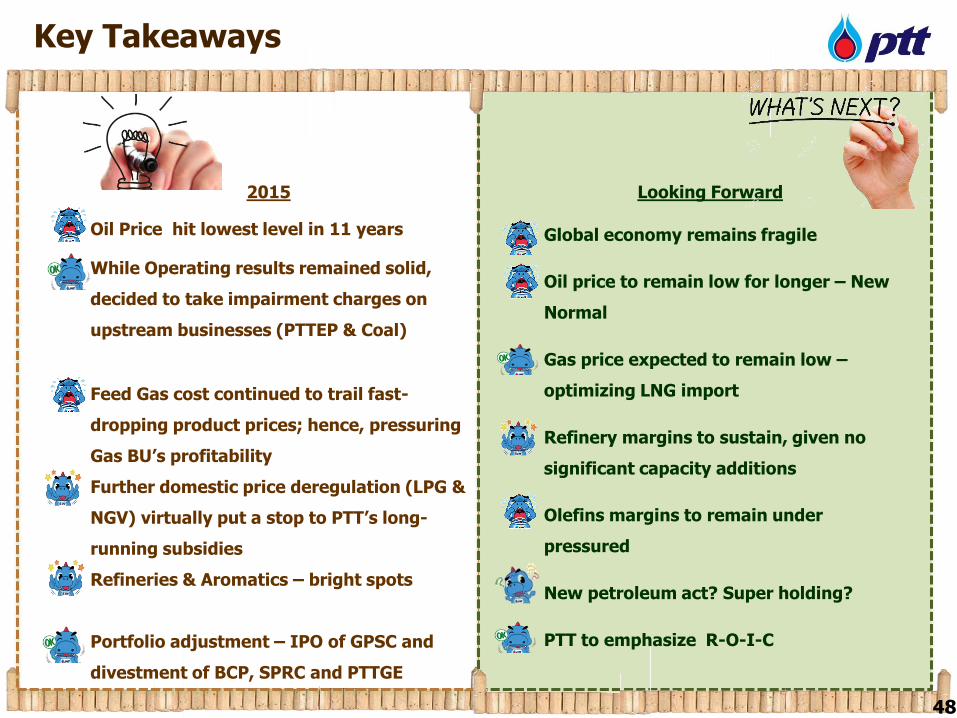
2015
• Oil Price hit lowest level in 11 years
• While Operating results remained solid,
decided to take impairment charges on
upstream businesses (PTTEP & Coal)
• Feed Gas cost continued to trail fast-
dropping product prices; hence, pressuring
Gas BU’s profitability
• Further domestic price deregulation (LPG &
NGV) virtually put a stop to PTT’s long-
running subsidies
• Refineries & Aromatics – bright spots
• Portfolio adjustment – IPO of GPSC and
divestment of BCP, SPRC and PTTGE
Looking Forward
• Global economy remains fragile
• Oil price to remain low for longer – New
Normal
• Gas price expected to remain low –
optimizing LNG import
• Refinery margins to sustain, given no
significant capacity additions
• Olefins margins to remain under
pressured
• New petroleum act? Super holding?
• PTT to emphasize R-O-I-C
Key Takeaways
48
Thank youPTT Public Company Limited – Investor Relations Department
Tel. +66 2 537-3518, Fax. +66 2 537-3948, E-mail: [email protected] Website: http://www.pttplc.com
Disclaimer
The information contained in our presentation is intended solely for your personal reference only. In addition, such information contains projections and forward-looking
statements that reflect our current views with respect to future events and financial performance. These views are based on assumptions subject to various risks and
uncertainties. No assurance is given that future events will occur, that projections will be achieved, or that our assumptions are correct. Actual results may differ
materially from those projected.
Petroleum Reserves and Resources Information
In this presentation, the Company discloses petroleum reserves and resources that are not included in the Securities Exchange and Commission of Thailand (SEC) Annual
Registration Statement Form 56-1 under “Supplemental Information on Petroleum Exploration and Production Activities”. The reserves and resources data contained in
this presentation reflects the Company’s best estimates of its reserves and resources. While the Company periodically obtains an independent audit of a portion of its
proved reserves, no independent qualified reserves evaluator or auditor was involved in the preparation of reserves and resources data disclosed in this presentation.
Unless stated otherwise, reserves and resources are stated at the Company’s gross basis. This presentation may contain the terms “proved reserves”, “probable reserves”,
and/or “contingent resources”. Unless stated otherwise, the Company adopts similar description as defined by the Society of Petroleum Engineers.
Proved Reserves - Proved reserves are defined as those quantities of petroleum which, by analysis of geological and engineering data, can be estimated with reasonable
certainty to be commercially recoverable, from a given date forward, from known reservoirs and under current economic conditions, operating methods, and government
regulations.
Probable Reserves - Probable reserves are defined as those unproved reserves which analysis of geological and engineering data suggests are more likely than not to be
recoverable.
Contingent Resources – Contingent resources are defined as those quantities of petroleum which are estimated, on a given date, to be potentially recoverable from
known accumulations, but which are not currently considered to be commercially recoverable. The reasons for non commerciality could be economic including market
availability, political, environmental, or technological.
49
49
50
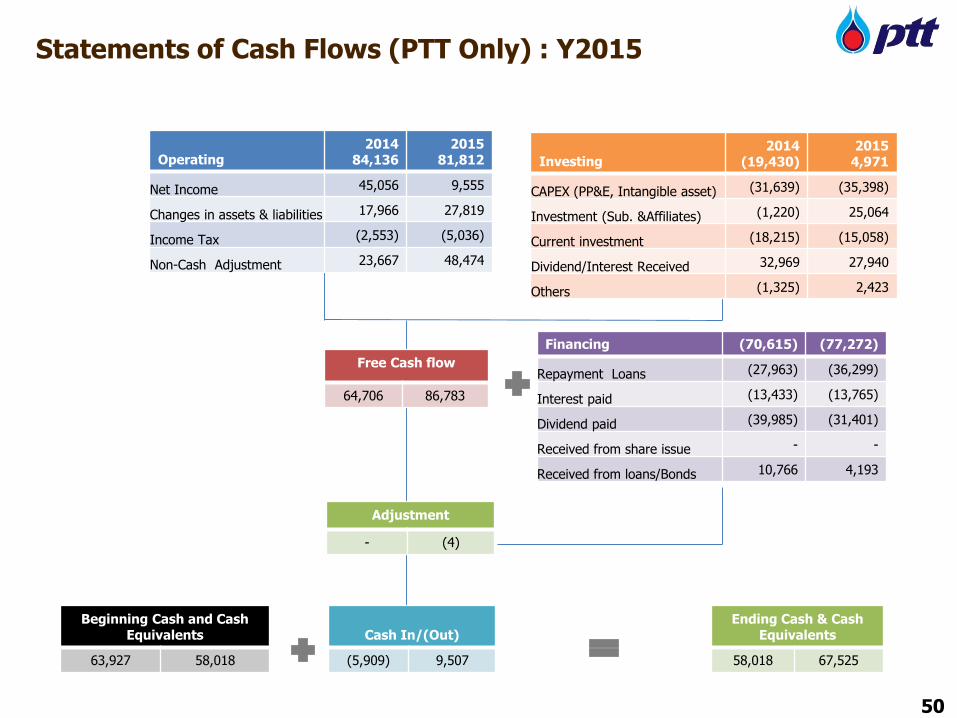
Free Cash flow
64,706 86,783
Financing (70,615) (77,272)
Repayment Loans (27,963) (36,299)
Interest paid (13,433) (13,765)
Dividend paid (39,985) (31,401)
Received from share issue - -
Received from loans/Bonds 10,766 4,193
Investing2014
(19,430)2015
4,971
CAPEX (PP&E, Intangible asset) (31,639) (35,398)
Investment (Sub. &Affiliates) (1,220) 25,064
Current investment (18,215) (15,058)
Dividend/Interest Received 32,969 27,940
Others (1,325) 2,423
Operating2014
84,1362015
81,812
Net Income 45,056 9,555
Changes in assets & liabilities 17,966 27,819
Income Tax (2,553) (5,036)
Non-Cash Adjustment 23,667 48,474
Ending Cash & Cash Equivalents
58,018 67,525
Beginning Cash and Cash Equivalents
63,927 58,018
Cash In/(Out)
(5,909) 9,507
Adjustment
- (4)
Statements of Cash Flows (PTT Only) : Y2015
50
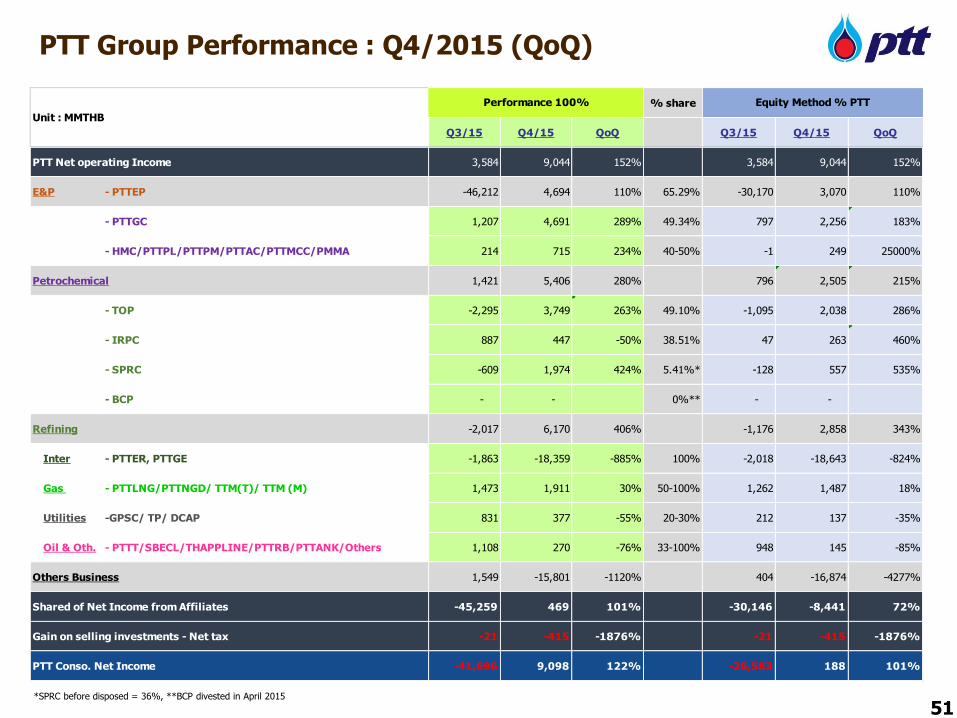
PTT Group Performance : Q4/2015 (QoQ)
% share
Q3/15 Q4/15 QoQ Q3/15 Q4/15 QoQ
PTT Net operating Income 3,584 9,044 152% 3,584 9,044 152%
E&P - PTTEP -46,212 4,694 110% 65.29% -30,170 3,070 110%
- PTTGC 1,207 4,691 289% 49.34% 797 2,256 183%
- HMC/PTTPL/PTTPM/PTTAC/PTTMCC/PMMA 214 715 234% 40-50% -1 249 25000%
Petrochemical 1,421 5,406 280% 796 2,505 215%
- TOP -2,295 3,749 263% 49.10% -1,095 2,038 286%
- IRPC 887 447 -50% 38.51% 47 263 460%
- SPRC -609 1,974 424% 5.41%* -128 557 535%
- BCP - - 0%** - -
Refining -2,017 6,170 406% -1,176 2,858 343%
Inter - PTTER, PTTGE -1,863 -18,359 -885% 100% -2,018 -18,643 -824%
Gas - PTTLNG/PTTNGD/ TTM(T)/ TTM (M) 1,473 1,911 30% 50-100% 1,262 1,487 18%
Utilities -GPSC/ TP/ DCAP 831 377 -55% 20-30% 212 137 -35%
Oil & Oth. - PTTT/SBECL/THAPPLINE/PTTRB/PTTANK/Others 1,108 270 -76% 33-100% 948 145 -85%
Others Business 1,549 -15,801 -1120% 404 -16,874 -4277%
Shared of Net Income from Affiliates -45,259 469 101% -30,146 -8,441 72%
Gain on selling investments - Net tax -21 -415 -1876% -21 -415 -1876%
PTT Conso. Net Income -41,696 9,098 122% -26,583 188 101%
Equity Method % PTTPerformance 100%
Unit : MMTHB
51*SPRC before disposed = 36%, **BCP divested in April 2015
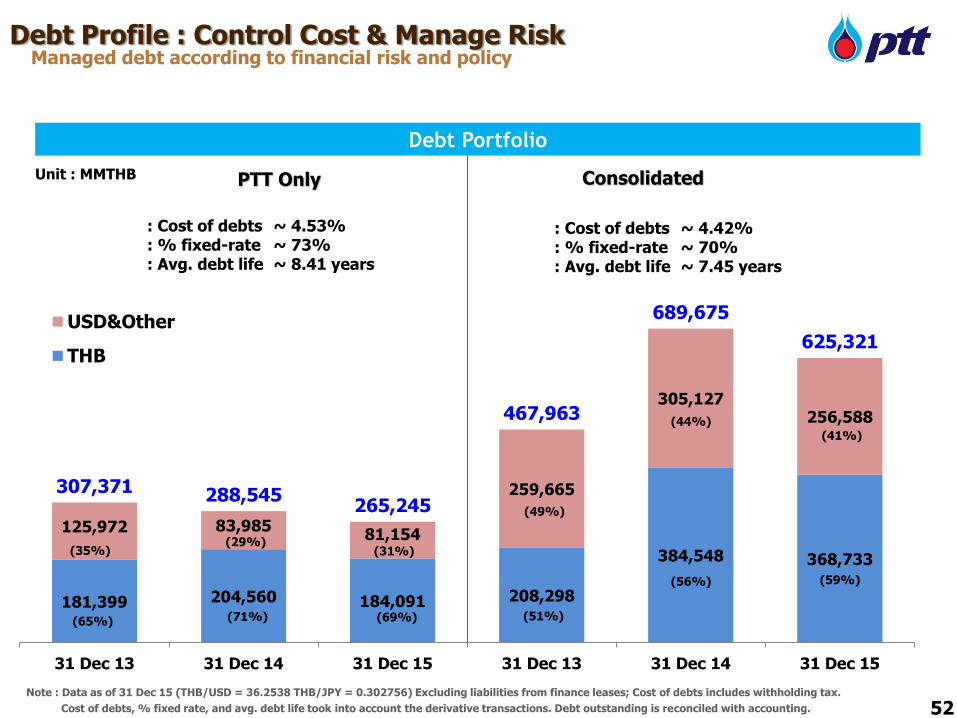
52
Debt Profile : Control Cost & Manage Risk
Debt Portfolio
Managed debt according to financial risk and policy
ConsolidatedPTT OnlyUnit : MMTHB
: Cost of debts ~ 4.53%: % fixed-rate ~ 73%: Avg. debt life ~ 8.41 years
: Cost of debts ~ 4.42%: % fixed-rate ~ 70%: Avg. debt life ~ 7.45 years
181,399 204,560 184,091 208,298
384,548 368,733
125,972 83,98581,154
259,665
305,127256,588
307,371 288,545265,245
467,963
689,675
625,321
31 Dec 13 31 Dec 14 31 Dec 15 31 Dec 13 31 Dec 14 31 Dec 15
USD&Other
THB
(35%)
(65%)
(29%)
(71%)
(31%)
(69%)
(49%)
(51%)
(44%)
(56%)
(41%)
(59%)
Note : Data as of 31 Dec 15 (THB/USD = 36.2538 THB/JPY = 0.302756) Excluding liabilities from finance leases; Cost of debts includes withholding tax.
52Cost of debts, % fixed rate, and avg. debt life took into account the derivative transactions. Debt outstanding is reconciled with accounting.
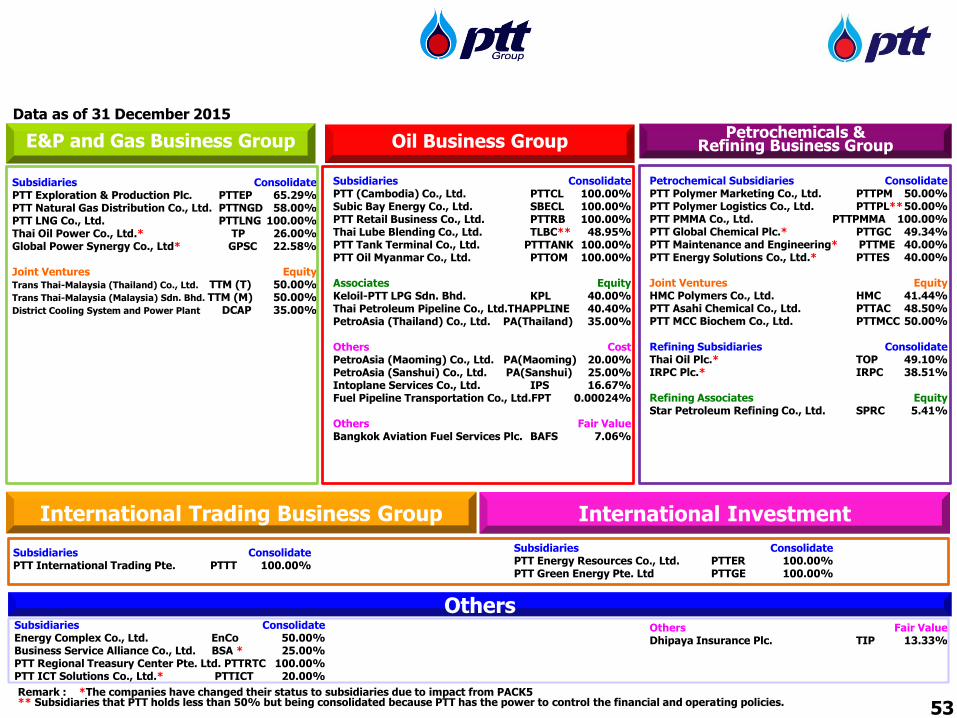
Subsidiaries ConsolidatePTT (Cambodia) Co., Ltd. PTTCL 100.00%Subic Bay Energy Co., Ltd. SBECL 100.00%PTT Retail Business Co., Ltd. PTTRB 100.00%Thai Lube Blending Co., Ltd. TLBC** 48.95%PTT Tank Terminal Co., Ltd. PTTTANK 100.00%PTT Oil Myanmar Co., Ltd. PTTOM 100.00%
Associates EquityKeloil-PTT LPG Sdn. Bhd. KPL 40.00%Thai Petroleum Pipeline Co., Ltd.THAPPLINE 40.40%PetroAsia (Thailand) Co., Ltd. PA(Thailand) 35.00%
Others CostPetroAsia (Maoming) Co., Ltd. PA(Maoming) 20.00%PetroAsia (Sanshui) Co., Ltd. PA(Sanshui) 25.00%Intoplane Services Co., Ltd. IPS 16.67%Fuel Pipeline Transportation Co., Ltd.FPT 0.00024%
Others Fair ValueBangkok Aviation Fuel Services Plc. BAFS 7.06%
Others
Subsidiaries ConsolidatePTT Exploration & Production Plc. PTTEP 65.29%PTT Natural Gas Distribution Co., Ltd. PTTNGD 58.00%PTT LNG Co., Ltd. PTTLNG 100.00%Thai Oil Power Co., Ltd.* TP 26.00%Global Power Synergy Co., Ltd* GPSC 22.58%
Joint Ventures EquityTrans Thai-Malaysia (Thailand) Co., Ltd. TTM (T) 50.00%Trans Thai-Malaysia (Malaysia) Sdn. Bhd. TTM (M) 50.00%District Cooling System and Power Plant DCAP 35.00%
Petrochemical Subsidiaries ConsolidatePTT Polymer Marketing Co., Ltd. PTTPM 50.00%PTT Polymer Logistics Co., Ltd. PTTPL**50.00%PTT PMMA Co., Ltd. PTTPMMA 100.00%PTT Global Chemical Plc.* PTTGC 49.34%PTT Maintenance and Engineering* PTTME 40.00%PTT Energy Solutions Co., Ltd.* PTTES 40.00%
Joint Ventures EquityHMC Polymers Co., Ltd. HMC 41.44%PTT Asahi Chemical Co., Ltd. PTTAC 48.50%PTT MCC Biochem Co., Ltd. PTTMCC 50.00%
Refining Subsidiaries ConsolidateThai Oil Plc.* TOP 49.10%IRPC Plc.* IRPC 38.51%
Refining Associates EquityStar Petroleum Refining Co., Ltd. SPRC 5.41%
Others Fair ValueDhipaya Insurance Plc. TIP 13.33%
Subsidiaries ConsolidateEnergy Complex Co., Ltd. EnCo 50.00%Business Service Alliance Co., Ltd. BSA * 25.00%PTT Regional Treasury Center Pte. Ltd. PTTRTC 100.00%PTT ICT Solutions Co., Ltd.* PTTICT 20.00%
International Trading Business Group
Subsidiaries ConsolidatePTT International Trading Pte. PTTT 100.00%
Remark : *The companies have changed their status to subsidiaries due to impact from PACK5** Subsidiaries that PTT holds less than 50% but being consolidated because PTT has the power to control the financial and operating policies.
Petrochemicals & Refining Business GroupE&P and Gas Business Group Oil Business Group
Data as of 31 December 2015
International Investment
Subsidiaries ConsolidatePTT Energy Resources Co., Ltd. PTTER 100.00%PTT Green Energy Pte. Ltd PTTGE 100.00%
53
53
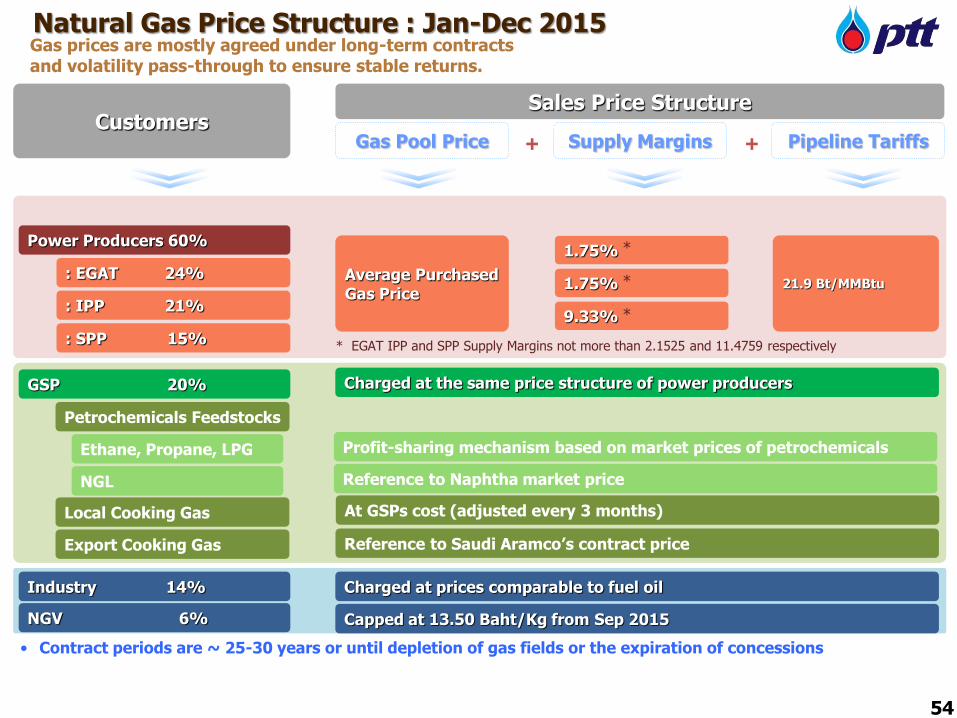
54
Natural Gas Price Structure : Jan-Dec 2015
CustomersSales Price Structure
Gas Pool Price Supply Margins Pipeline Tariffs+ +
Average Purchased Gas Price
1.75%
1.75%
9.33%
21.9 Bt/MMBtu
Charged at the same price structure of power producers
Reference to Saudi Aramco’s contract price
Charged at prices comparable to fuel oil
Gas prices are mostly agreed under long-term contracts and volatility pass-through to ensure stable returns.
Capped at 13.50 Baht/Kg from Sep 2015
Profit-sharing mechanism based on market prices of petrochemicals
Reference to Naphtha market price
At GSPs cost (adjusted every 3 months)
• Contract periods are ~ 25-30 years or until depletion of gas fields or the expiration of concessions
54
*
* EGAT IPP and SPP Supply Margins not more than 2.1525 and 11.4759 respectively
*
*
Power Producers 60%
: EGAT 24%
: IPP 21%
: SPP 15%
GSP 20%
Petrochemicals Feedstocks
Industry 14%
NGV 6%
Ethane, Propane, LPG
NGL
Local Cooking Gas
Export Cooking Gas
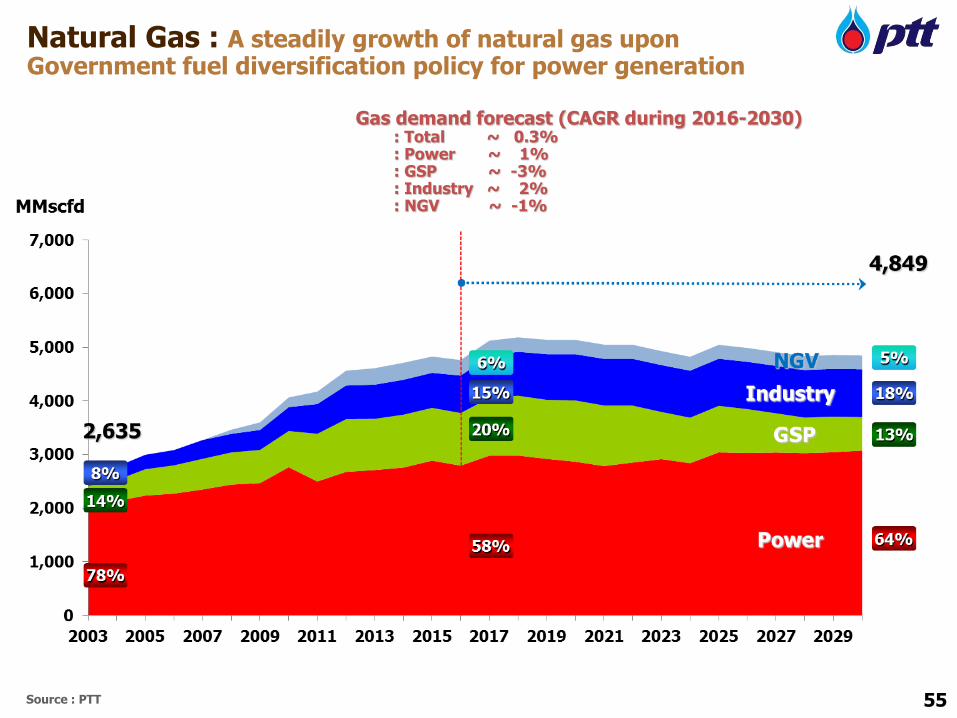
55Source : PTT
Gas demand forecast (CAGR during 2016-2030): Total ~ 0.3%: Power ~ 1%: GSP ~ -3%: Industry ~ 2%: NGV ~ -1%
Natural Gas : A steadily growth of natural gas upon Government fuel diversification policy for power generation
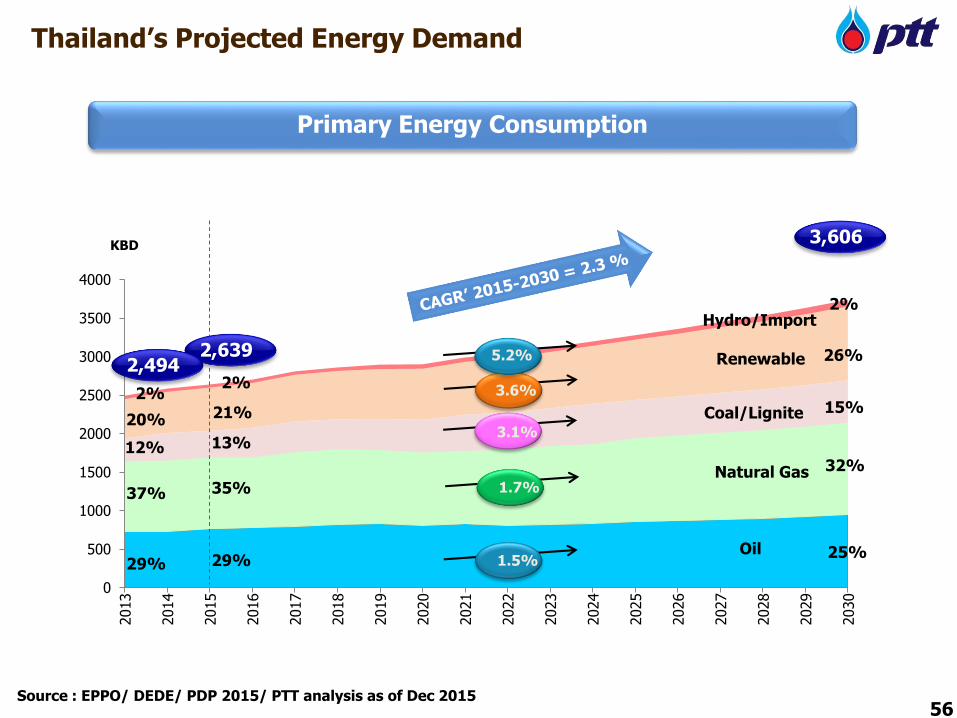
Thailand’s Projected Energy Demand
56
Primary Energy Consumption
Source : EPPO/ DEDE/ PDP 2015/ PTT analysis as of Dec 2015
0
500
1000
1500
2000
2500
3000
3500
4000
2013
2014
2015
2016
2017
2018
2019
2020
2021
2022
2023
2024
2025
2026
2027
2028
2029
2030
Oil
Natural Gas
Coal/Lignite
Hydro/Import
KBD
Renewable2,639
25%
32%
15%
2%
26%
3,606
2,494
29%
35%
13%
21%
2%
29%
37%
12%
20%
2%
1.5%
1.7%
3.1%
3.6%
5.2%
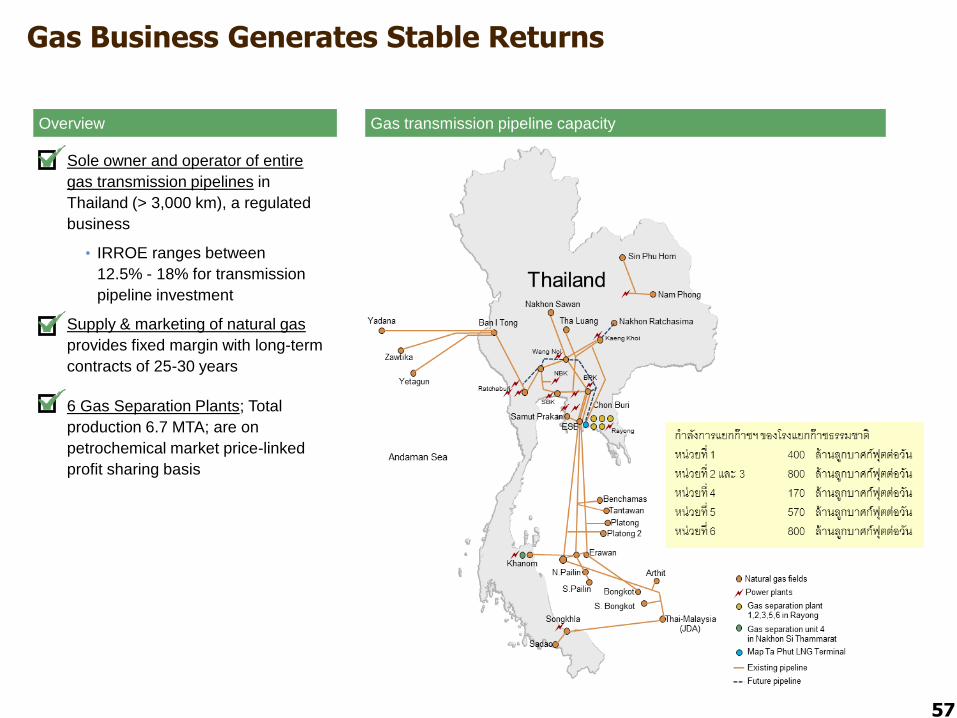
Gas Business Generates Stable Returns
Sole owner and operator of entire
gas transmission pipelines in
Thailand (> 3,000 km), a regulated
business
• IRROE ranges between
12.5% - 18% for transmission
pipeline investment
Supply & marketing of natural gas
provides fixed margin with long-term
contracts of 25-30 years
6 Gas Separation Plants; Total
production 6.7 MTA; are on
petrochemical market price-linked
profit sharing basis
Overview Gas transmission pipeline capacity
57