Embed Size (px)
Citation preview
Analyst Meeting Q3/2014
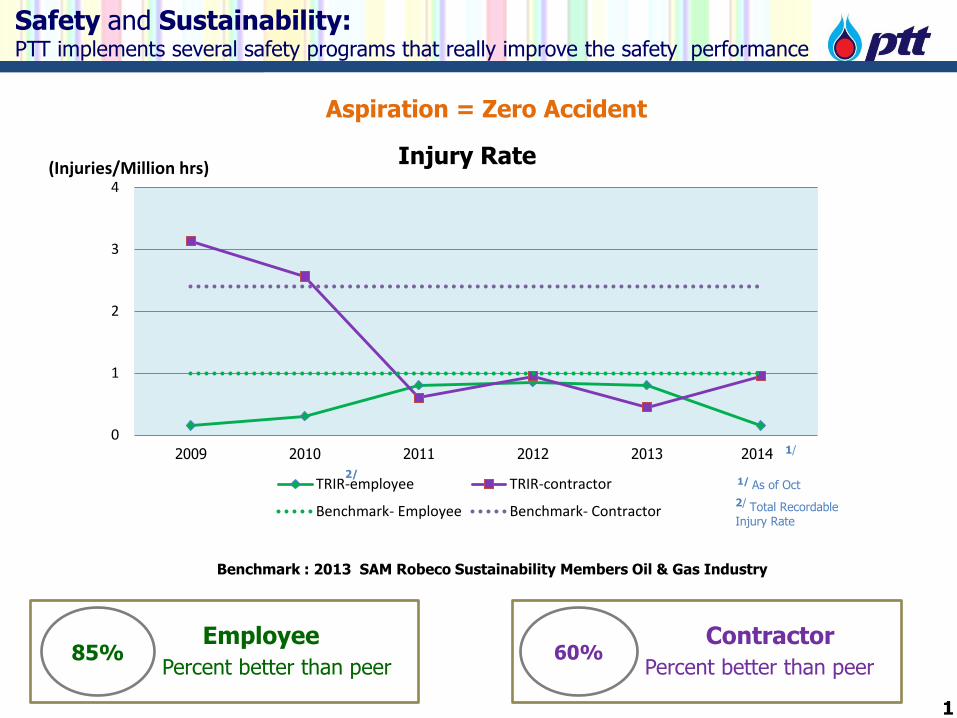
Safety and Sustainability: PTT implements several safety programs that really improve the safety performance
Aspiration = Zero Accident
Benchmark : 2013 SAM Robeco Sustainability Members Oil & Gas Industry
Percent better than peer
85% Employee
Percent better than peer 60%
Contractor
0
1
2
3
4
2009 2010 2011 2012 2013 2014*
Injury Rate
TRIR-employee TRIR-contractor
Benchmark- Employee Benchmark- Contractor
1/ As of Oct
(Injuries/Million hrs)
2/
1/
2/ Total Recordable Injury Rate
1
Safety and Sustainability: PTT consistently receives awards on “Safety performance”
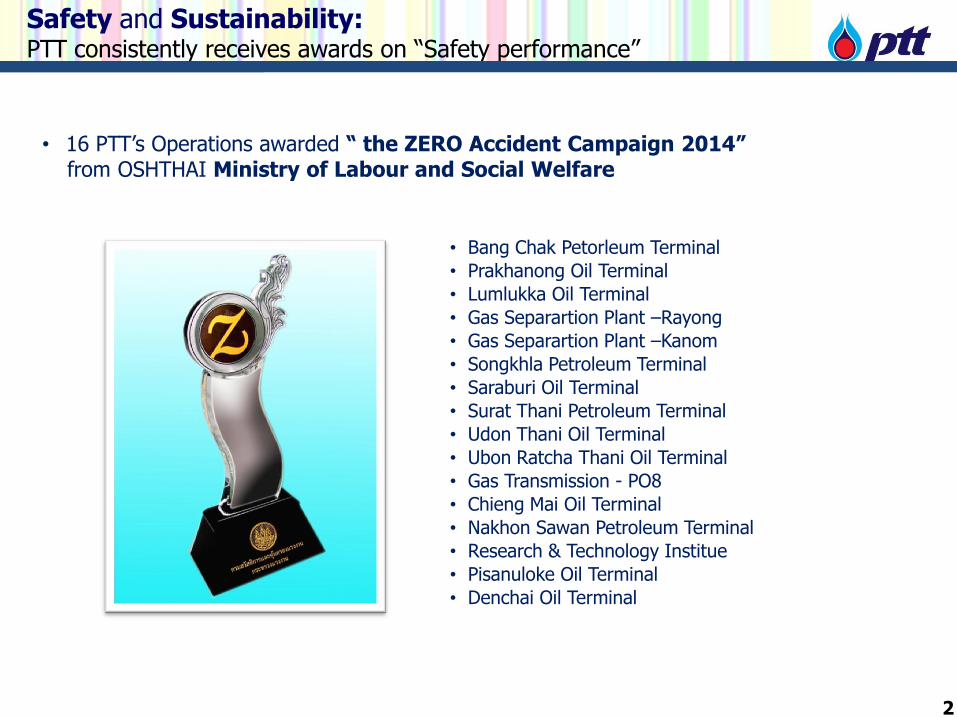
• 16 PTT’s Operations awarded “ the ZERO Accident Campaign 2014” from OSHTHAI Ministry of Labour and Social Welfare
• Bang Chak Petorleum Terminal
• Prakhanong Oil Terminal
• Lumlukka Oil Terminal
• Gas Separartion Plant –Rayong
• Gas Separartion Plant –Kanom
• Songkhla Petroleum Terminal
• Saraburi Oil Terminal
• Surat Thani Petroleum Terminal
• Udon Thani Oil Terminal
• Ubon Ratcha Thani Oil Terminal
• Gas Transmission - PO8
• Chieng Mai Oil Terminal
• Nakhon Sawan Petroleum Terminal
• Research & Technology Institue
• Pisanuloke Oil Terminal
• Denchai Oil Terminal
2
3
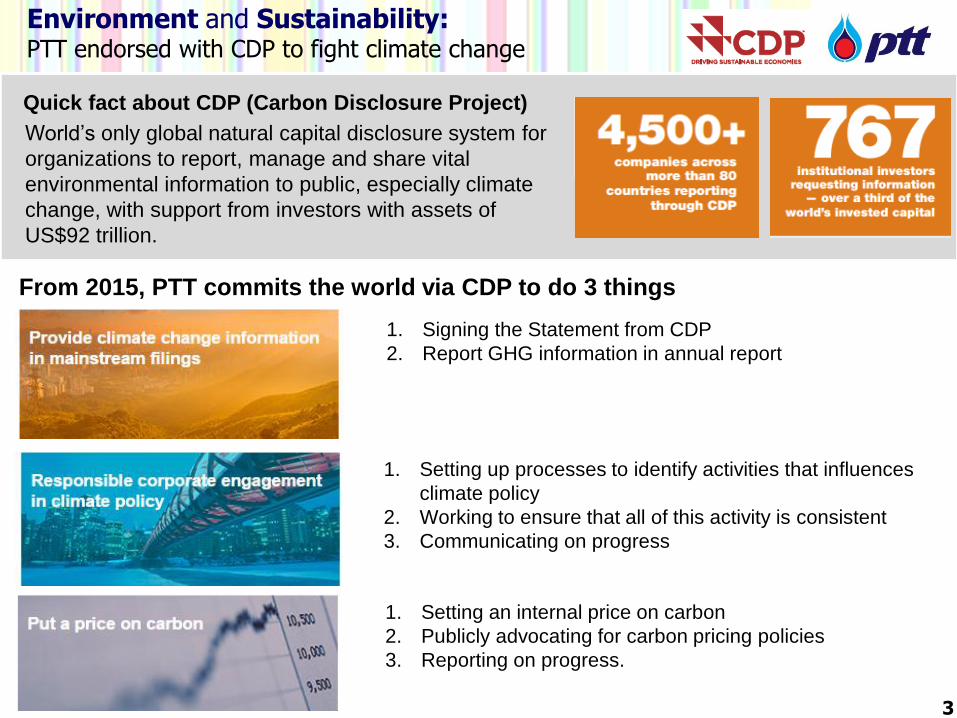
Environment and Sustainability: PTT endorsed with CDP to fight climate change
Quick fact about CDP (Carbon Disclosure Project)
From 2015, PTT commits the world via CDP to do 3 things
1. Setting an internal price on carbon
2. Publicly advocating for carbon pricing policies
3. Reporting on progress.
1. Setting up processes to identify activities that influences
climate policy
2. Working to ensure that all of this activity is consistent
3. Communicating on progress
1. Signing the Statement from CDP
2. Report GHG information in annual report
World’s only global natural capital disclosure system for
organizations to report, manage and share vital
environmental information to public, especially climate
change, with support from investors with assets of
US$92 trillion.
3
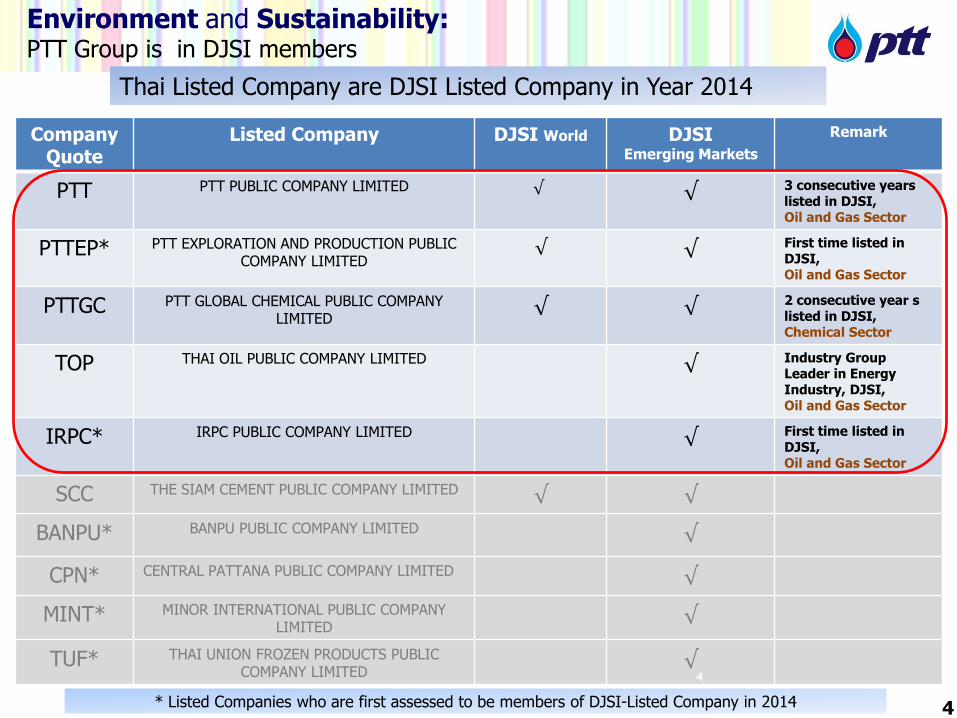
Company Quote
Listed Company DJSI World
DJSI Emerging Markets
Remark
PTT PTT PUBLIC COMPANY LIMITED √ √ 3 consecutive years listed in DJSI, Oil and Gas Sector
PTTEP* PTT EXPLORATION AND PRODUCTION PUBLIC COMPANY LIMITED
√ √ First time listed in DJSI, Oil and Gas Sector
PTTGC PTT GLOBAL CHEMICAL PUBLIC COMPANY LIMITED
√ √ 2 consecutive year s listed in DJSI, Chemical Sector
TOP THAI OIL PUBLIC COMPANY LIMITED √ Industry Group Leader in Energy Industry, DJSI, Oil and Gas Sector
IRPC* IRPC PUBLIC COMPANY LIMITED √ First time listed in DJSI, Oil and Gas Sector
SCC THE SIAM CEMENT PUBLIC COMPANY LIMITED √ √
BANPU* BANPU PUBLIC COMPANY LIMITED √
CPN* CENTRAL PATTANA PUBLIC COMPANY LIMITED √
MINT* MINOR INTERNATIONAL PUBLIC COMPANY LIMITED
√
TUF* THAI UNION FROZEN PRODUCTS PUBLIC COMPANY LIMITED
√ 4
Environment and Sustainability: PTT Group is in DJSI members
Thai Listed Company are DJSI Listed Company in Year 2014
* Listed Companies who are first assessed to be members of DJSI-Listed Company in 2014 4
Contents
5
Highlights
Performance
Conclusion
Highlights Performance Conclusion
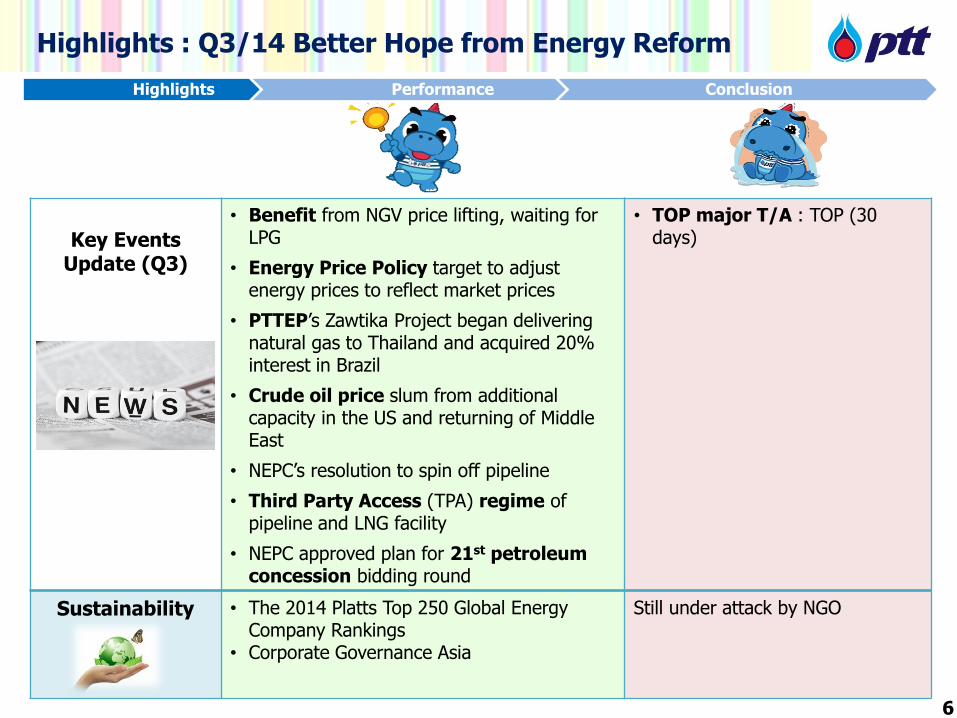
Key Events
Update (Q3)
• Benefit from NGV price lifting, waiting for LPG
• Energy Price Policy target to adjust energy prices to reflect market prices
• PTTEP’s Zawtika Project began delivering natural gas to Thailand and acquired 20% interest in Brazil
• Crude oil price slum from additional capacity in the US and returning of Middle East
• NEPC’s resolution to spin off pipeline
• Third Party Access (TPA) regime of pipeline and LNG facility
• NEPC approved plan for 21st petroleum concession bidding round
• TOP major T/A : TOP (30 days)
Sustainability • The 2014 Platts Top 250 Global Energy Company Rankings
• Corporate Governance Asia
Still under attack by NGO
Highlights : Q3/14 Better Hope from Energy Reform
6
Highlights Performance Conclusion
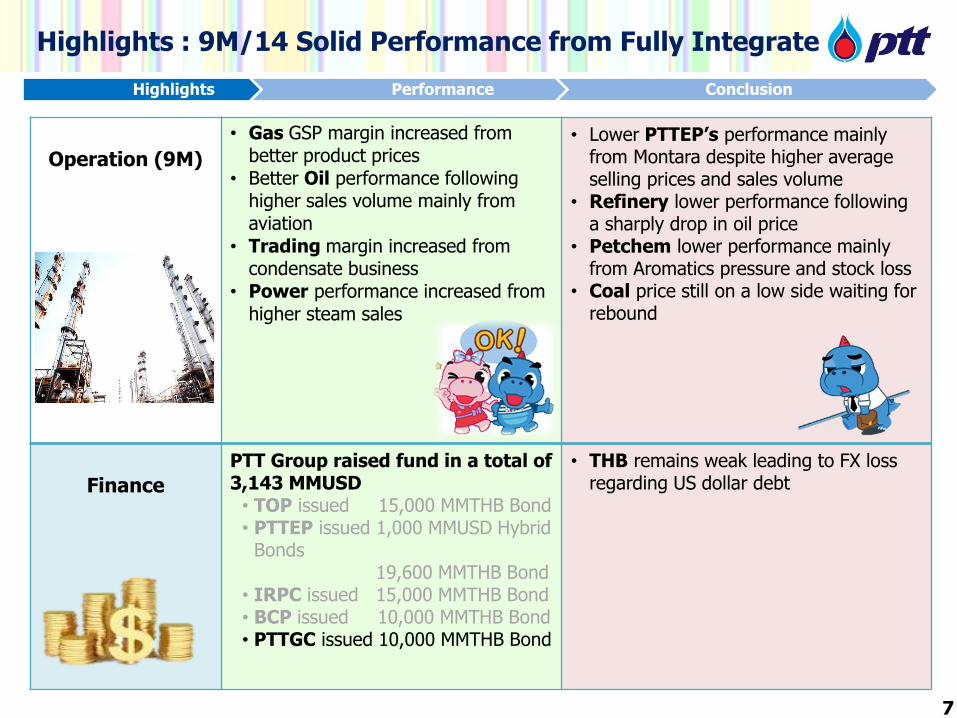
Operation (9M)
• Gas GSP margin increased from better product prices
• Better Oil performance following higher sales volume mainly from aviation
• Trading margin increased from condensate business
• Power performance increased from
higher steam sales
• Lower PTTEP’s performance mainly from Montara despite higher average selling prices and sales volume
• Refinery lower performance following a sharply drop in oil price
• Petchem lower performance mainly from Aromatics pressure and stock loss
• Coal price still on a low side waiting for rebound
Finance
PTT Group raised fund in a total of 3,143 MMUSD
• TOP issued 15,000 MMTHB Bond • PTTEP issued 1,000 MMUSD Hybrid
Bonds 19,600 MMTHB Bond • IRPC issued 15,000 MMTHB Bond • BCP issued 10,000 MMTHB Bond • PTTGC issued 10,000 MMTHB Bond
• THB remains weak leading to FX loss regarding US dollar debt
7
Highlights : 9M/14 Solid Performance from Fully Integrate
QoQ market update Ex.oil price
Highlights Performance Conclusion
0
5
10
15
20
25
Jan-13 Jul-13 Jan-14 Jul-14
28
30
32
34
Jan-13 Jul-13 Jan-14 Jul-14100
300
500
700
900
Jan-13 Jul-13 Jan-14 Jul-14
HDPE Spread PX Spread
80
100
120
Jan-13 Jul-13 Jan-14 Jul-14
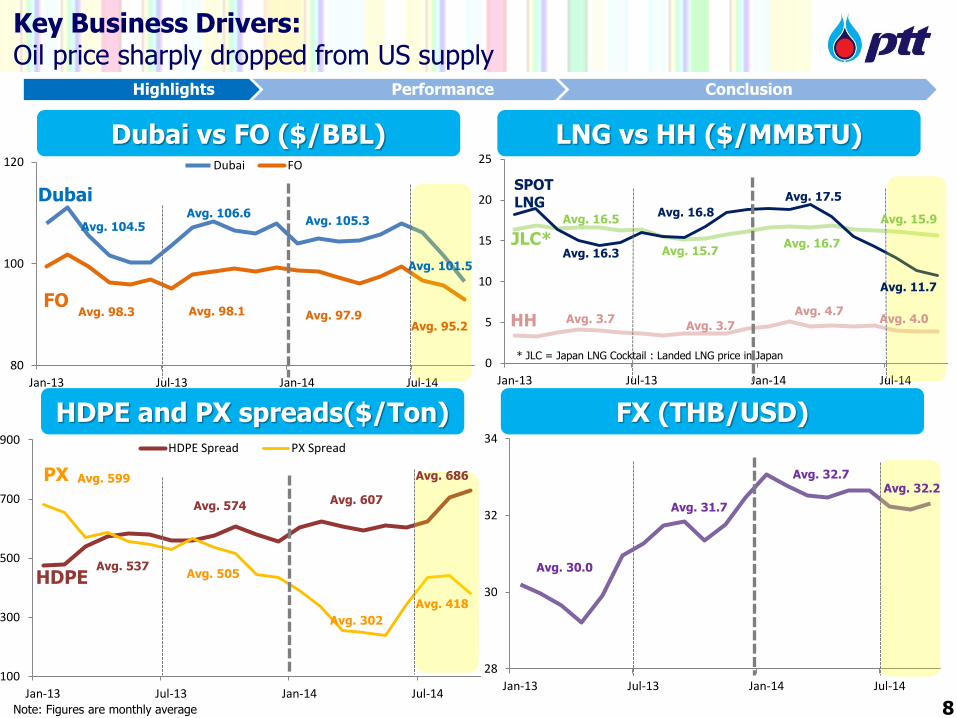
Dubai FO
Avg. 16.5
LNG vs HH ($/MMBTU)
* JLC = Japan LNG Cocktail : Landed LNG price in Japan
Key Business Drivers: Oil price sharply dropped from US supply
8 Note: Figures are monthly average
Avg. 98.3
Avg. 104.5
Avg. 537 Avg. 30.0
Dubai vs FO ($/BBL)
HDPE and PX spreads($/Ton) FX (THB/USD)
Dubai
FO
HDPE
Avg. 599 PX Avg. 32.7
Avg. 105.3
Avg. 97.9
Avg. 607
Avg. 302
Avg. 16.7 JLC*
LNG มีบทบาทส าคัญในการดึงราคา pool
Avg. 106.6
Avg. 15.7
Avg. 98.1
Avg. 31.7 Avg. 574
Avg. 505
HH Avg. 4.7
Avg. 3.7 Avg. 3.7
Avg. 16.3
Avg. 17.5 SPOT LNG
Avg. 16.8
Avg. 101.5
Avg. 95.2
Avg. 686
Avg. 418
Avg. 32.2
Avg. 11.7
Avg. 15.9
Avg. 4.0
Highlights Performance Conclusion
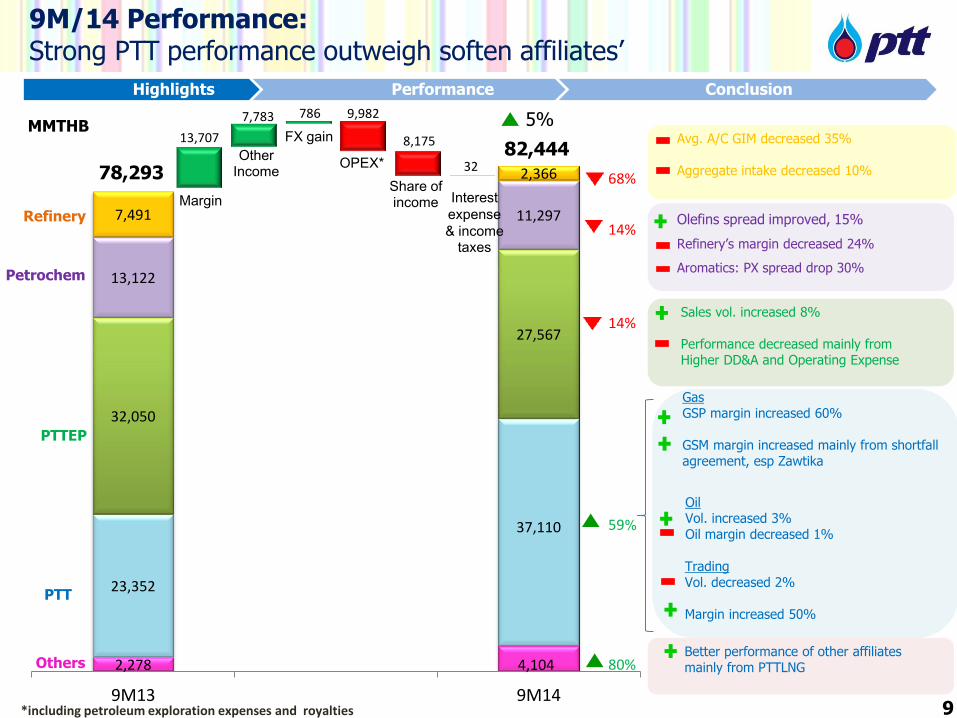
Gas GSP margin increased 60% GSM margin increased mainly from shortfall agreement, esp Zawtika
2,278 4,104
23,352
37,110
32,050
27,567
13,122
11,297 7,491
2,366
9M13 9M14
PTTEP
82,444
PTT
Others
Refinery
Petrochem
78,293
5%
68%
14%
14%
59%
80%
9M/14 Performance: Strong PTT performance outweigh soften affiliates’
9
Sales vol. increased 8% Performance decreased mainly from Higher DD&A and Operating Expense
MMTHB Avg. A/C GIM decreased 35% Aggregate intake decreased 10%
*including petroleum exploration expenses and royalties
Oil Vol. increased 3% Oil margin decreased 1% Trading Vol. decreased 2% Margin increased 50%
Better performance of other affiliates mainly from PTTLNG
Olefins spread improved, 15%
Refinery’s margin decreased 24%
Aromatics: PX spread drop 30%
13,707
7,783 786
32
9,982
8,175
Margin
FX gain
OPEX*
Share of income Interest
expense & income
taxes
Other Income
Highlights Performance Conclusion
Contents
10
Highlights
Performance
Conclusion
Highlights Performance Conclusion
Financial Management
and Key Issue Updated
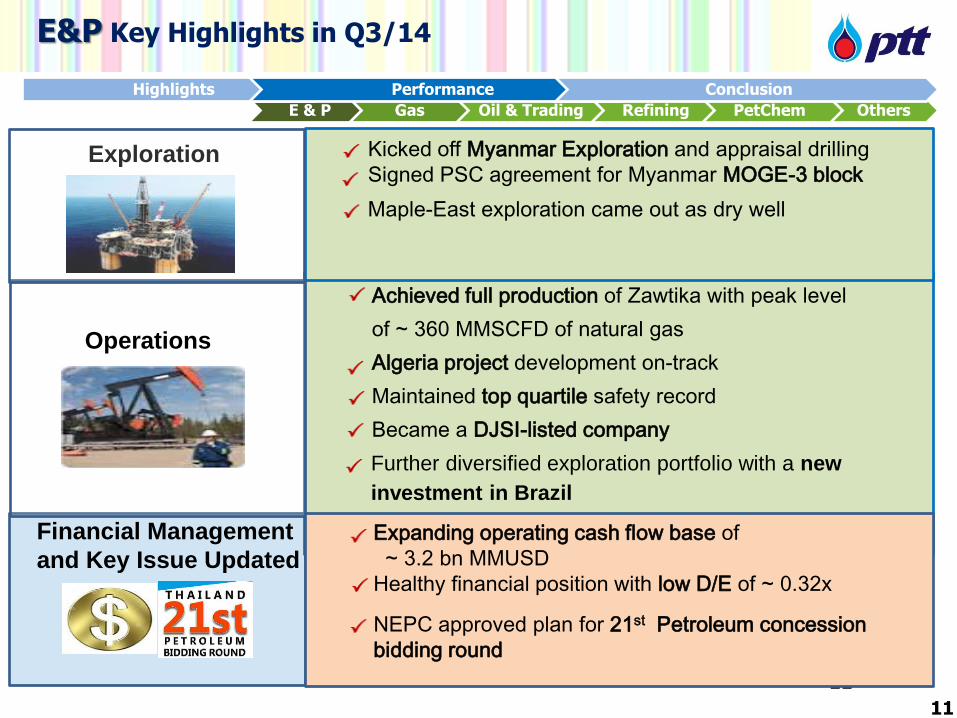
E&P Key Highlights in Q3/14
E & P Gas Oil & Trading Refining PetChem Others
Kicked off Myanmar Exploration and appraisal drilling Signed PSC agreement for Myanmar MOGE-3 block
Achieved full production of Zawtika with peak level
of ~ 360 MMSCFD of natural gas
Algeria project development on-track
Maintained top quartile safety record
Became a DJSI-listed company
Further diversified exploration portfolio with a new
investment in Brazil
11
Expanding operating cash flow base of ~ 3.2 bn MMUSD Healthy financial position with low D/E of ~ 0.32x
Exploration
Operations
Maple-East exploration came out as dry well
11
Highlights Performance Conclusion
NEPC approved plan for 21st Petroleum concession bidding round
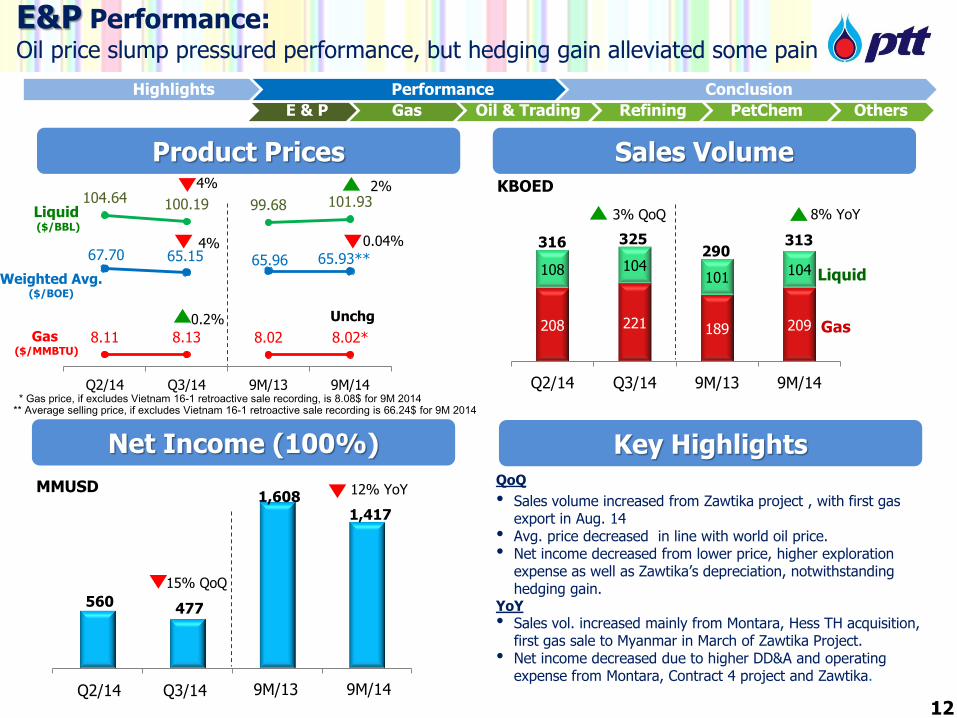
560 477
1,608
1,417
9M/13 Q2/14
E&P Performance: Oil price slump pressured performance, but hedging gain alleviated some pain
Product Prices
Net Income (100%)
Sales Volume
Key Highlights
8.11 8.13 8.02 8.02*
104.64 100.19 99.68 101.93
67.70 65.15 65.96 65.93**
Q2/14 Q3/14 9M/13 9M/14
Liquid ($/BBL)
Gas ($/MMBTU)
Weighted Avg. ($/BOE)
MMUSD
208 221 189 209
108 104 101
104
Q2/14 Q3/14 9M/13 9M/14
325
Liquid
Gas
KBOED
316
12
290
4%
* Gas price, if excludes Vietnam 16-1 retroactive sale recording, is 8.08$ for 9M 2014
E & P Gas Oil & Trading Refining PetChem Others
** Average selling price, if excludes Vietnam 16-1 retroactive sale recording is 66.24$ for 9M 2014
12% YoY
8% YoY
4%
0.2%
2%
0.04%
Unchg
313
3% QoQ
15% QoQ
Q3/14 9M/14
QoQ
• Sales volume increased from Zawtika project , with first gas export in Aug. 14
• Avg. price decreased in line with world oil price. • Net income decreased from lower price, higher exploration
expense as well as Zawtika’s depreciation, notwithstanding hedging gain.
YoY
• Sales vol. increased mainly from Montara, Hess TH acquisition, first gas sale to Myanmar in March of Zawtika Project.
• Net income decreased due to higher DD&A and operating expense from Montara, Contract 4 project and Zawtika.
Highlights Performance Conclusion
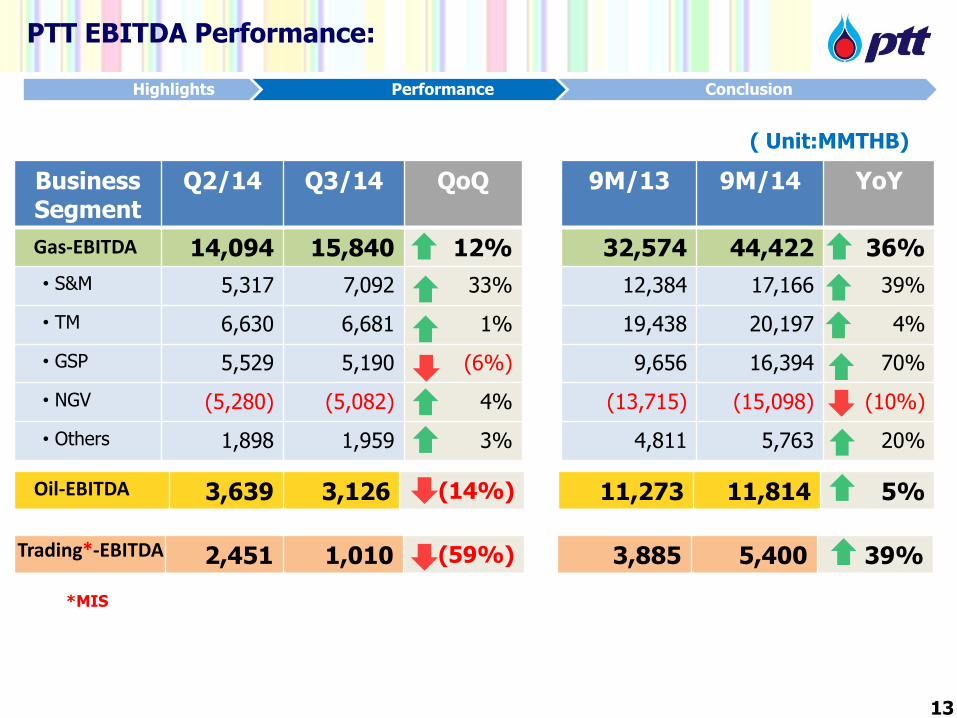
Business Segment
Q2/14 Q3/14 QoQ 9M/13 9M/14 YoY
14,094 15,840 12% 32,574 44,422 36%
• S&M 5,317 7,092 33% 12,384 17,166 39%
• TM 6,630 6,681 1% 19,438 20,197 4%
• GSP 5,529 5,190 (6%) 9,656 16,394 70%
• NGV (5,280) (5,082) 4% (13,715) (15,098) (10%)
• Others 1,898 1,959 3% 4,811 5,763 20%
13
PTT EBITDA Performance:
( Unit:MMTHB)
3,639 3,126 (14%) 11,273 11,814 5%
2,451 1,010 (59%) 3,885 5,400 39% *MIS
13
Highlights Performance Conclusion
Gas-EBITDA
Oil-EBITDA
Trading*-EBITDA
4,291
4,515
4,616
4,754 4,704
4,685
4,497 4,469
4,450
4,768 4,731
Q1 Q2 Q3 Q41,334 1,165 1,287 1,252
826 932 865 790
712 681 594 701
948 945 936 934
635 689 639 656
313 319 307 317
Q2/14 Q3/14 9M/13 9M/14
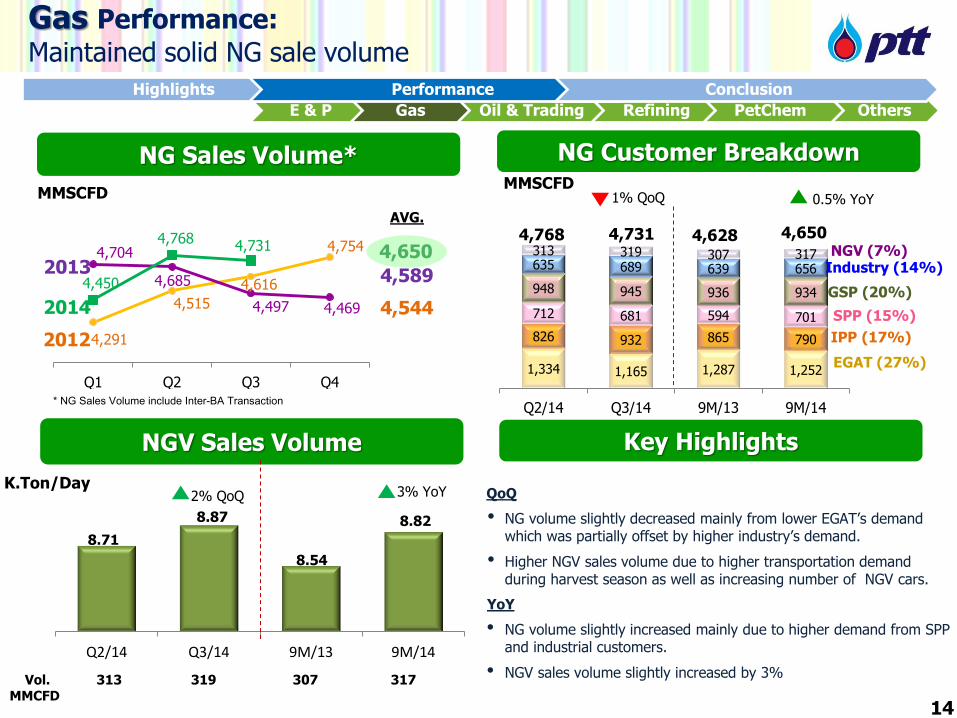
Gas Performance:
Maintained solid NG sale volume
NG Sales Volume* NG Customer Breakdown
2013
2012
2014
MMSCFD
EGAT (27%)
IPP (17%)
SPP (15%)
GSP (20%)
Industry (14%) NGV (7%)
MMSCFD
4,731 4,768 AVG.
4,650
4,544
4,589
4,628
E & P Gas Oil & Trading Refining PetChem Others
0.5% YoY
8.71
8.87
8.54
8.82
Q2/14 Q3/14 9M/13 9M/14
2% QoQ
NGV Sales Volume
Unit : Approx. KTon/Day
Vol. MMCFD
313 319 307 317
3% YoY QoQ
• NG volume slightly decreased mainly from lower EGAT’s demand which was partially offset by higher industry’s demand.
• Higher NGV sales volume due to higher transportation demand during harvest season as well as increasing number of NGV cars.
YoY
• NG volume slightly increased mainly due to higher demand from SPP and industrial customers.
• NGV sales volume slightly increased by 3%
QoQ
• Higher NGV Sales volume due to NGV Station back to normal operation after closed during political demonstratiionon
YOY
• Sales volume increased by 5%, also, feed cost increased
• No Government subsidy, while special discount given to public transportation customers
Key Highlights
SM: GSM, NGR, CHP margin +1.75% no cap for internal use, external cap according to price structure
4,650
1% QoQ
Convention เพ่ิม 2 สถานี Mother Daughter ที่เพ่ิมข้ึนเป็นของเอกชน
* NG Sales Volume include Inter-BA Transaction
Gas BU Performance:
Better performance from GSP#5 back to normal operation
K.Ton/Day
14
Highlights Performance Conclusion
667 720
2,043 2,025 185 184
535 549
501 532
1,565 1,509
204 162
550 575
Q2/14 Q3/14 9M/13 9M/14
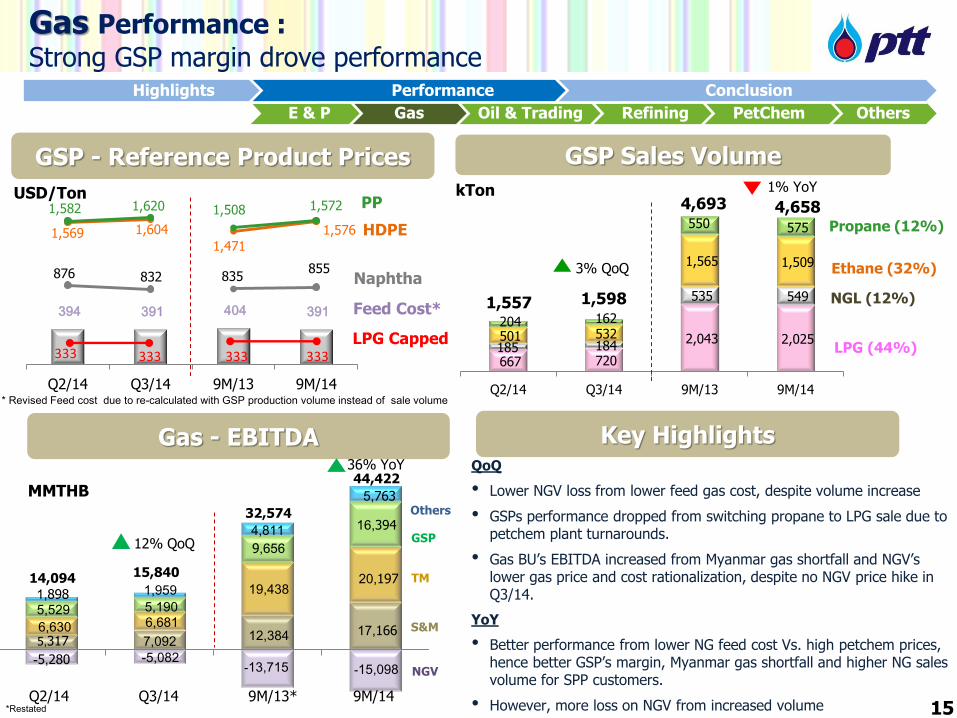
4,693
GSP Sales Volume
LPG (44%)
kTon
1,557 1,598
4,658
3% QoQ
1% YoY
19,438
9,656
12,384 5,317 -5,280
Gas - EBITDA
MMTHB Others
TM
GSP
14,094
Q2/14 Q3/14 9M/13* 9M/14
1,898 5,529
6,630
-13,715
32,574
12% QoQ
S&M
NGV
4,811
Gas Performance :
Strong GSP margin drove performance
15
E & P Gas Oil & Trading Refining PetChem Others
QoQ
• Lower NGV loss from lower feed gas cost, despite volume increase
• GSPs performance dropped from switching propane to LPG sale due to petchem plant turnarounds.
• Gas BU’s EBITDA increased from Myanmar gas shortfall and NGV’s lower gas price and cost rationalization, despite no NGV price hike in Q3/14.
YoY
• Better performance from lower NG feed cost Vs. high petchem prices, hence better GSP’s margin, Myanmar gas shortfall and higher NG sales volume for SPP customers.
• However, more loss on NGV from increased volume
Propane (12%)
NGL (12%)
Ethane (32%)
Key Highlights
1,959
-5,082
7,092
6,681 5,190
15,840
36% YoY
-15,098
17,166
20,197
16,394
5,763
*Restated
394 391 404 391
876 832 835 855
1,569 1,604
1,471 1,576
1,582 1,620 1,508 1,572
Q2/14 Q3/14 9M/13 9M/14
333
GSP - Reference Product Prices
PP
HDPE
Naphtha
USD/Ton
Feed Cost*
LPG Capped 333 333 333
44,422
* Revised Feed cost due to re-calculated with GSP production volume instead of sale volume
Highlights Performance Conclusion
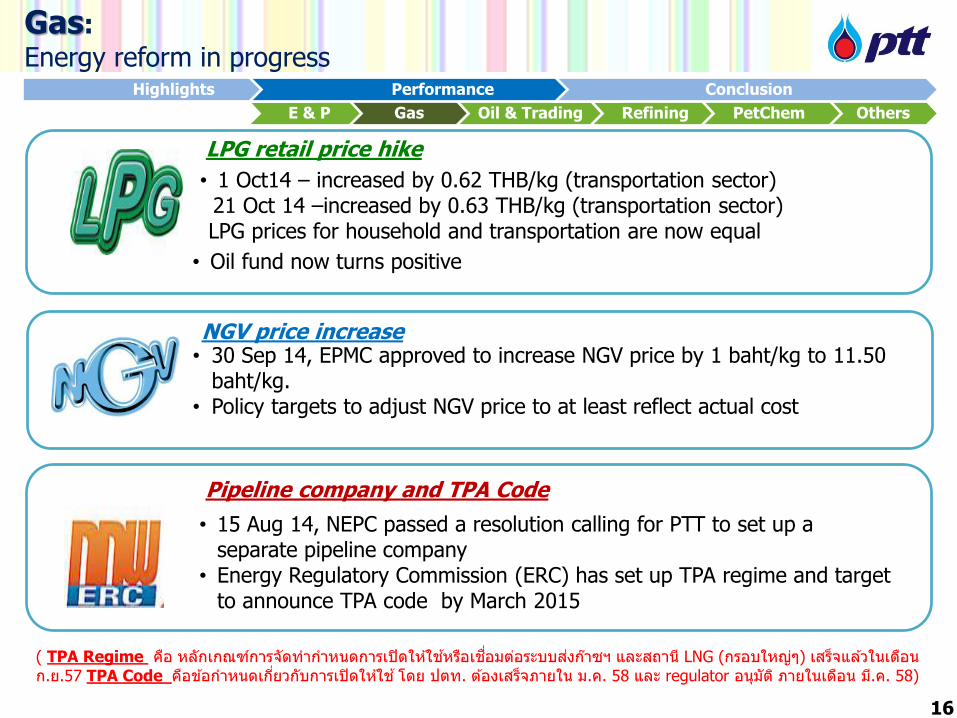
( TPA Regime คอื หลักเกณฑก์ารจัดท าก าหนดการเปิดใหใ้ชห้รอืเชือ่มตอ่ระบบสง่กา๊ซฯ และสถาน ีLNG (กรอบใหญ่ๆ ) เสร็จแลว้ในเดอืน ก.ย.57 TPA Code คอืขอ้ก าหนดเกีย่วกับการเปิดใหใ้ช ้โดย ปตท. ตอ้งเสร็จภายใน ม.ค. 58 และ regulator อนุมัต ิภายในเดอืน ม.ีค. 58)
Gas:
Energy reform in progress
• Long term gas demand, close to GDP as our major customer is power sector
• Power sector: 60% using gas, in term of vol still growing but for % might be lower
• GSP5 will S/D only 15 days for installation of WHRU in Sep’14
E & P Gas Oil & Trading Refining PetChem Others
NGV price increase • 30 Sep 14, EPMC approved to increase NGV price by 1 baht/kg to 11.50
baht/kg. • Policy targets to adjust NGV price to at least reflect actual cost
LPG retail price hike
• 1 Oct14 – increased by 0.62 THB/kg (transportation sector) 21 Oct 14 –increased by 0.63 THB/kg (transportation sector) LPG prices for household and transportation are now equal
• Oil fund now turns positive
• 15 Aug 14, NEPC passed a resolution calling for PTT to set up a separate pipeline company
• Energy Regulatory Commission (ERC) has set up TPA regime and target to announce TPA code by March 2015
Pipeline company and TPA Code
16
Highlights Performance Conclusion
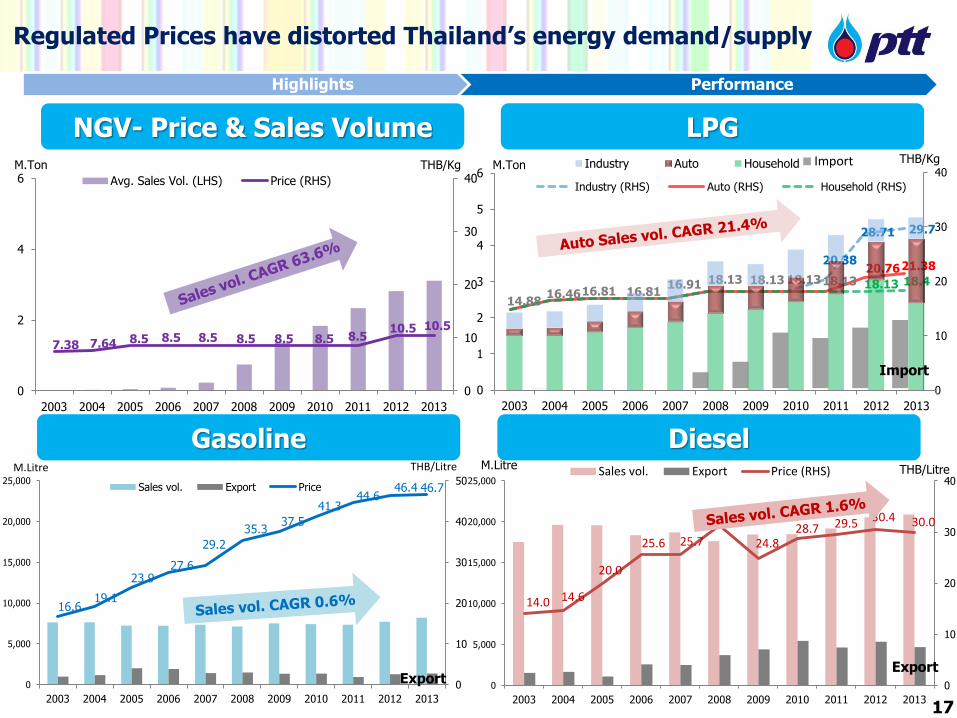
14.88 16.46 16.81 16.81
16.91 18.13 18.13 18.13
20.38
28.71 29.7
18.13 20.76 21.38
18.13 18.4
0
10
20
30
40
Industry (RHS) Auto (RHS) Household (RHS)
16.6 19.1
23.9 27.6
29.2
35.3 37.5
41.3 44.6
46.4 46.7
0
10
20
30
40
50
0
5,000
10,000
15,000
20,000
25,000
2003 2004 2005 2006 2007 2008 2009 2010 2011 2012 2013
Sales vol. Export Price
M.Litre THB/Litre
0
1
2
3
4
5
6
2003 2004 2005 2006 2007 2008 2009 2010 2011 2012 2013
Industry Auto Household
14.0 14.6
20.0
25.6 25.7
31.3
24.8 28.7 29.5 30.4 30.0
0
10
20
30
40
0
5,000
10,000
15,000
20,000
25,000
2003 2004 2005 2006 2007 2008 2009 2010 2011 2012 2013
Sales vol. Export Price (RHS)
Regulated Prices have distorted Thailand’s energy demand/supply
Highlights Performance
NGV- Price & Sales Volume LPG M.Ton THB/Kg M.Ton
THB/Kg
7.38 7.64 8.5 8.5 8.5 8.5 8.5 8.5 8.5 10.5 10.5
0
10
20
30
40
0
2
4
6
2003 2004 2005 2006 2007 2008 2009 2010 2011 2012 2013
Avg. Sales Vol. (LHS) Price (RHS)
Diesel Gasoline M.Litre THB/Litre
17
Export Export
Import
Import
740 684 1,716 2,065 2,899 2,442
9,557 9,749
Q2/14 Q3/14 9M/13 9M/14
3,639 3,126
11,814 11,273
0.78 0.77 0.83 0.82
Q2/14 Q3/14 9M/13 9M/14
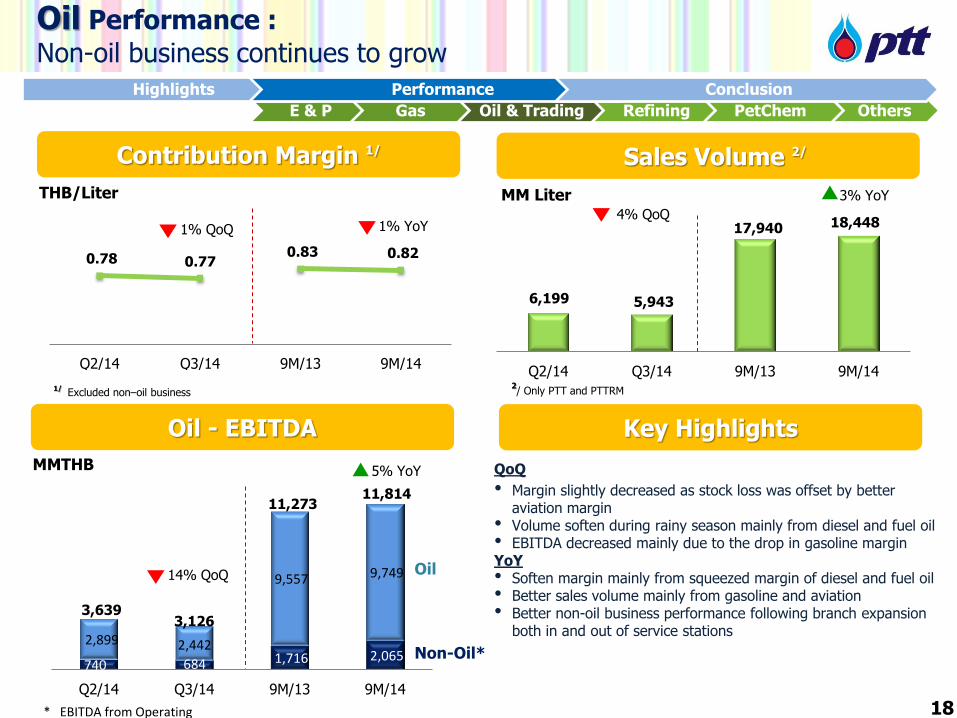
Oil Performance :
Non-oil business continues to grow
Contribution Margin 1/
Oil - EBITDA Key Highlights
MMTHB
THB/Liter
1/ Excluded non–oil business
18
QoQ
• Margin slightly decreased as stock loss was offset by better aviation margin
• Volume soften during rainy season mainly from diesel and fuel oil • EBITDA decreased mainly due to the drop in gasoline margin YoY • Soften margin mainly from squeezed margin of diesel and fuel oil • Better sales volume mainly from gasoline and aviation • Better non-oil business performance following branch expansion
both in and out of service stations
Oil
Non-Oil*
E & P Gas Oil & Trading Refining PetChem Others
* EBITDA from Operating
1% YoY
5% YoY
6,199 5,943
17,940 18,448
Q2/14 Q3/14 9M/13 9M/14
Sales Volume 2/
MM Liter
2/ Only PTT and PTTRM
3% YoY
1% QoQ 4% QoQ
14% QoQ
Highlights Performance Conclusion
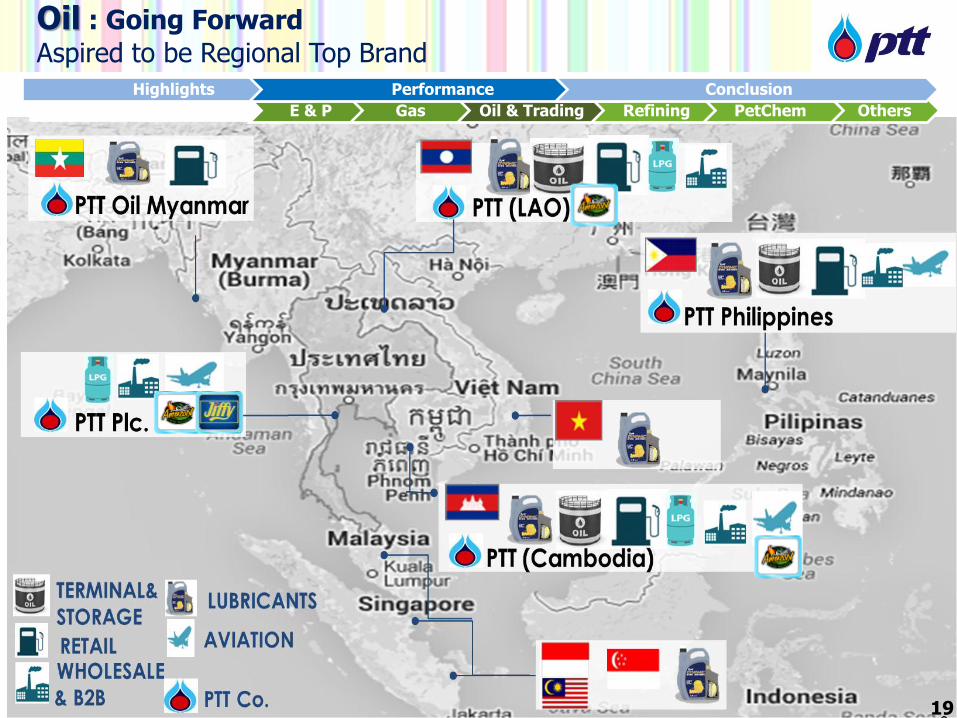
Non oil contribution & station growth in neighboring countries
Oil : Going Forward
Aspired to be Regional Top Brand
19
E & P Gas Oil & Trading Refining PetChem Others
Highlights Performance Conclusion
2,451
1,010
3,885
5,400
Q2/14 Q3/14 9M/13 9M/14
0.17
0.07 0.08
0.12
Q2/14 Q3/14 9M/13 9M/14
17,013 20,429
55,591 54,673
Q2/14 Q3/14 9M/13 9M/14
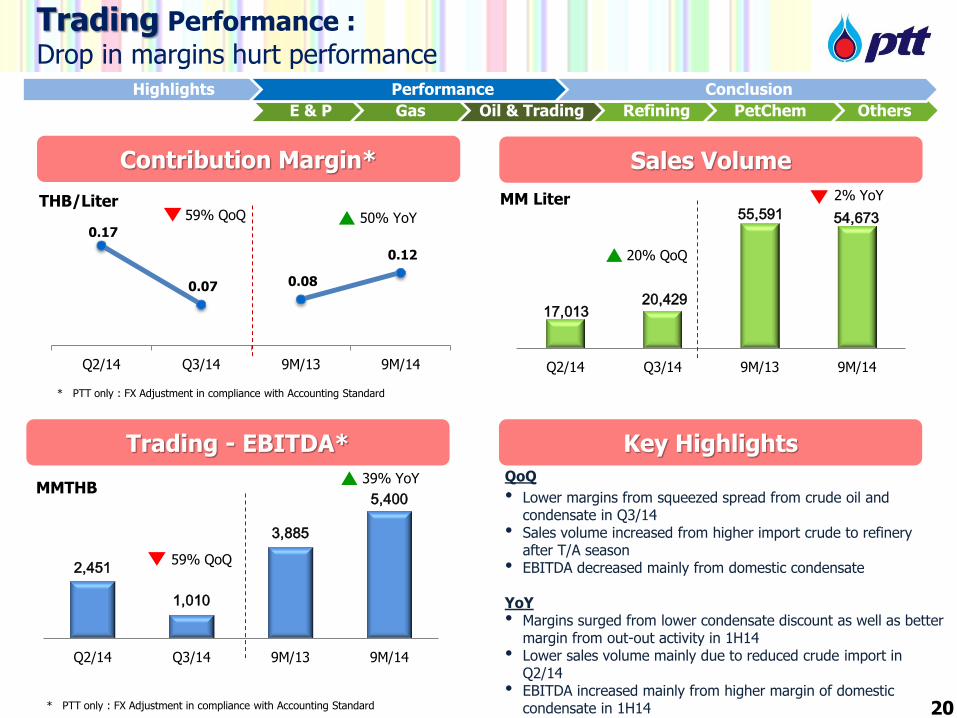
Trading Performance :
Drop in margins hurt performance
Contribution Margin*
Trading - EBITDA*
Sales Volume
Key Highlights
MMTHB
THB/Liter MM Liter
* PTT only : FX Adjustment in compliance with Accounting Standard 20
QoQ
• Lower margins from squeezed spread from crude oil and condensate in Q3/14
• Sales volume increased from higher import crude to refinery after T/A season
• EBITDA decreased mainly from domestic condensate
YoY • Margins surged from lower condensate discount as well as better
margin from out-out activity in 1H14 • Lower sales volume mainly due to reduced crude import in
Q2/14 • EBITDA increased mainly from higher margin of domestic
condensate in 1H14
** Not restated
39% YoY
• Import parity • Basket price or
reference price
59% QoQ
50% YoY 59% QoQ
2% YoY
20% QoQ
* PTT only : FX Adjustment in compliance with Accounting Standard
E & P Gas Oil & Trading Refining PetChem Others
Highlights Performance Conclusion
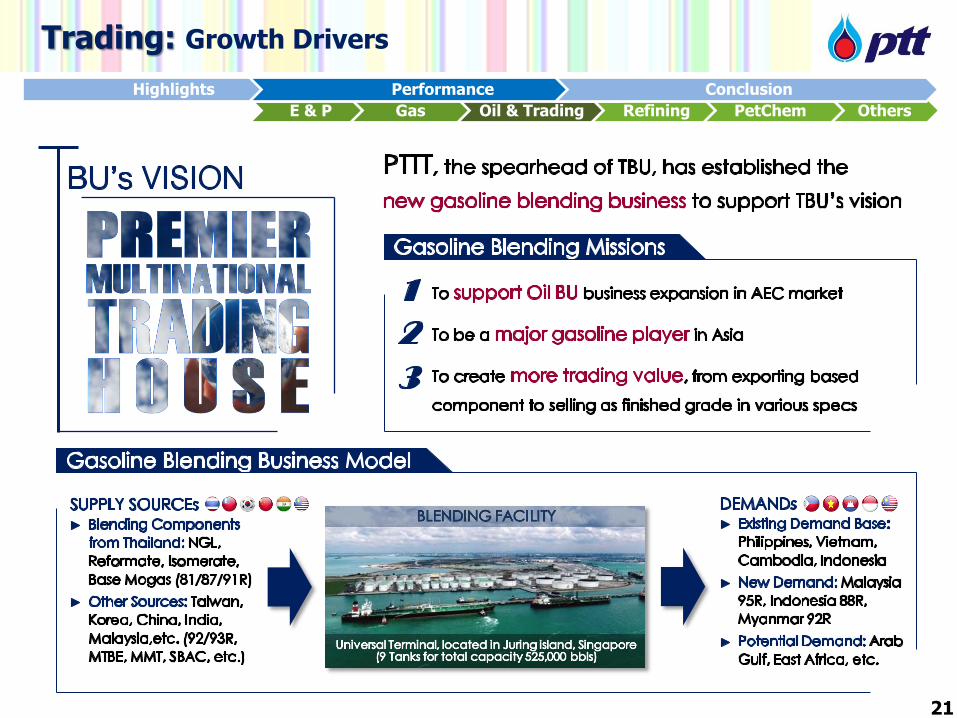
Trading: Growth Drivers
21
E & P Gas Oil & Trading Refining PetChem Others
Highlights Performance Conclusion
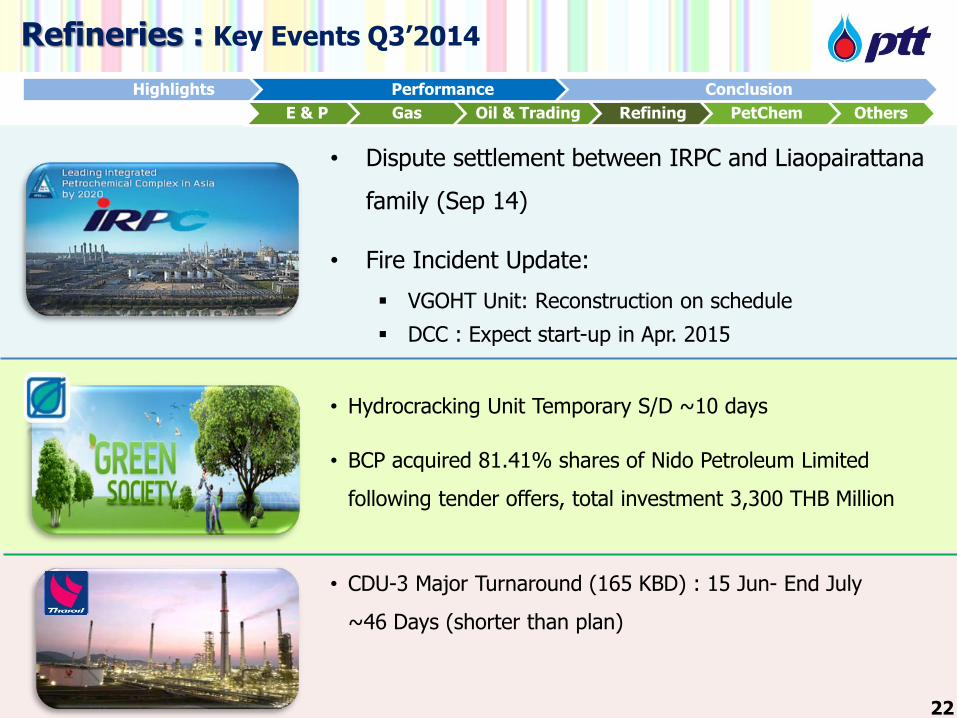
• Dispute settlement between IRPC and Liaopairattana
family (Sep 14)
• Fire Incident Update:
VGOHT Unit: Reconstruction on schedule
DCC : Expect start-up in Apr. 2015
• Hydrocracking Unit Temporary S/D ~10 days
• BCP acquired 81.41% shares of Nido Petroleum Limited
following tender offers, total investment 3,300 THB Million
• CDU-3 Major Turnaround (165 KBD) : 15 Jun- End July
~46 Days (shorter than plan)
Refineries : Key Events Q3’2014
E & P Gas Oil & Trading Refining PetChem Others
22
Highlights Performance Conclusion
2,094
(2,175)
9,307
2,453
1,120
(213)
3,783
(267)
1,258
380
3,963
3,200
178 22
42 544
Q2/14 Q3/14 9M/13 9M/14
79% 64%
88% 79%
254 327
286 289 220
371
499
288
Q2/14 Q3/14 9M/13 9M/14
106.1 101.5
105.1 104.0
3.34 4.29 4.35 3.91 5.27
0.73
5.07
3.23
7.67
1.82
7.92
5.16
Q2/14 Q3/14 9M/13 9M/14
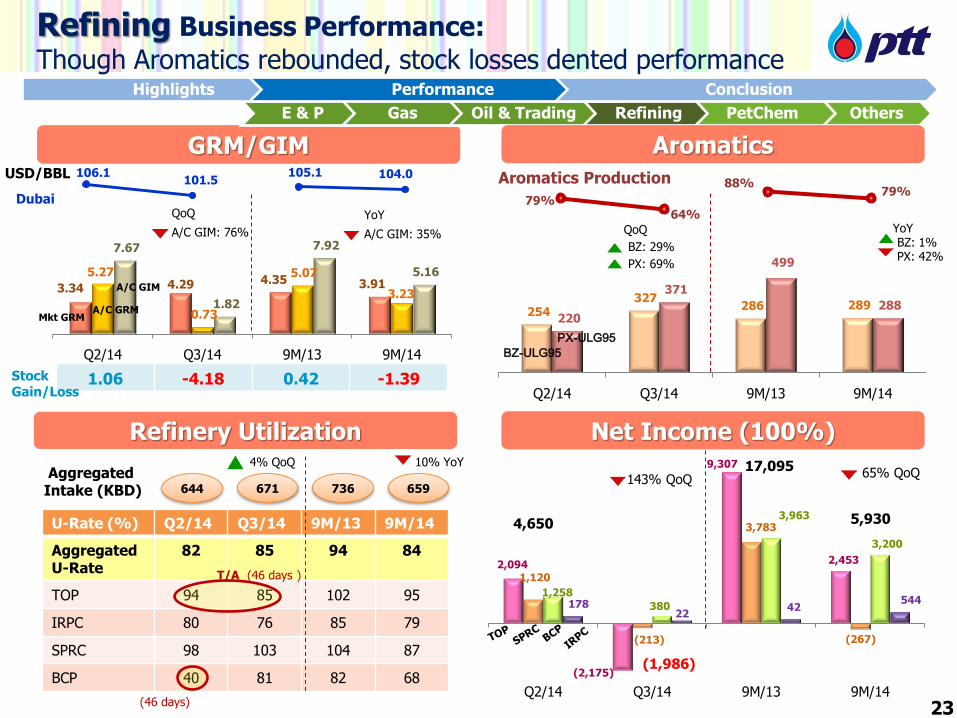
QoQ • Mkt GRM increased mainly from falling crude oil price (Q3/14:
101.5$/bbl, Q2/14: 106.1$/bbl)
• Q3/14 has large stock loss while Q2/14 had stock gain then A/C GRM decline pretty sharply (Ending Dubai Q2’14>Q3’14 : 108>96$/BBL
whereas Q1’14<Q2’14 : 104<108$/BBL), (stock loss 4R exclude PTTGC (Q3/14= -4.18 $/bbl., Q2/14= +1.06$/bbl)
• Recovered PX spread (PX-ULG95: Q3/14= 371$/ton, Q2/14=220$/ton) from several PX producers cut runs and some plants’ maintenance (also
postponed PX plant start up in SG capacity 800,000 tons/yr. from Aug. to Sept.)
• BZ spread also improved from capacity declined (producers in Japan cut
runs, and postponed operation in SG) in contrast to its improving demand (from imported demand in US, resumed phenol operations in Japan using BZ as feedstock)
YoY • A/C GRM decreased mainly from lower Mkt GRM & more stock loss • A/C GIM also drop from PX spread tumbled on softened polyester
demand & additional PX supply • Lower utilization rate from major refineries’ T/A
Source : PTT, Refining Associates Note: Weighted Avg. GRM of PTT’s associates’ complex refineries (TOP, SPRC, BCP, and IRPC) Weighted Avg. GIM of PTT’s associates’ integrated refineries (TOP and IRPC) Account GRM/GIM = Market GRM/GIM + Hedging Gain/Loss + Stock Gain/Loss
(0.16)
0.95
(0.90)
GRM/GIM
Refinery Utilization
USD/BBL
A/C GRM
A/C GIM
Mkt GRM
Dubai
E & P Gas Oil & Trading Refining PetChem Others
Net Income (100%)
U-Rate (%) Q2/14 Q3/14 9M/13 9M/14
Aggregated U-Rate
82 85 94 84
TOP 94 85 102 95
IRPC 80 76 85 79
SPRC 98 103 104 87
BCP 40 81 82 68
Aggregated Intake (KBD) 659 671 644
10% YoY 4% QoQ
1.06 -4.18 0.42 -1.39 Stock Gain/Loss
736
(46 days)
1,120 SPRC: -213
3,783
-54
2,094
TOP: -2,175
9,307
2,453
178
IRPC:22
42
544
1,258
BCP: 380
3,963
3,200
Q2/14 Q3/14 9M/13 9M/14
MMTHB
BCP
IRPC
SPRC
TOP
4,650
-1,986
7,916
54% YoY 143% QoQ
17,094
(46 days ) T/A
Aromatics
Aromatics Production
BZ-ULG95 PX-ULG95
BZ: 1% YoY
PX: 42% BZ: 29%
QoQ
PX: 69%
QoQ
A/C GIM: 76%
YoY
A/C GIM: 35%
+ Insurance Compensation : 521 MB in Q2/14 + Recognized revenue (of 743 Baht million) from fully-operated all 3
phases of Solar Power Plant - Lower A/C GRM (9M/14= 5.34$/bbl, 9M/13 =7.45$/bbl) - Lower U-Rate (T/A 46 days in Q2/14)
TOP 6,854
SPRC 4,050
BCP 763
IRPC 502
- Lower A/C GIM (9M14= 4.70$/bbl, 9M13=8.27$/bbl) from weaken crack spreads and PX spread
- Stock loss due to drop in Dubai price (9M14 stock loss 3,985 MMTHB while 9M13 stock gain 1,378 MMTHB)
- Lower integrated intake from planned major T/A of refinery and aromatics plant (Mid June- End July ~ 46 days)
- Pressured Aromatics : PX margin tumbled
+ Non-recurring items: insurance claim (710 MB), reverse impairment (470 MB), sales of investment (150 MB), etc.
- Lower A/C GIM (drop by 1.3$/bbl) from; the stock loss (decrease 1.44$/bbl), and Mkt GIM decrease (by 0.77$/bbl) while increase in oil hedging gain (increase 0.92$/bbl)
- T/A 23 days (18 Mar – 9 Apr)/ Fire incident on 9 June
- Lower A/C GRM (9M14= 2.72$/bbl, 9M13=5.34$/bbl) - Plant Turnaround: 8 Feb – 7 Apr (total S/D)
9M14 Vs. 9M13
Split stack to bar graph like GRM/GIM
4,650
(1,986)
17,095
5,930
143% QoQ 65% QoQ
Refining Business Performance:
Though Aromatics rebounded, stock losses dented performance
23
Highlights Performance Conclusion

28 Aug : Purchased 34% of the registered capital in Vencorex from Perstorp,
making % holding in Vencorex changed from 51% to 85%.
15 Sep : ARO 2 (capacity 1.07 ton/year) had unplanned S/D.
Petrochemical : Key Events Q3’2014
E & P Gas Oil & Trading Refining PetChem Others
24
Highlights Performance Conclusion
618 691
558 643 617
698
584 644
Q2/14 Q3/14 9M/13 9M/14
89%
83%
89% 84%
4.44 3.83 3.56 4.24 5.83
1.61
5.06 3.84
Q2/14 Q3/14 9M/13 9M/14
370 430
391 394 334
479
573
400
Q2/14 Q3/14 9M/13 9M/14
Net Income (100%)
Aromatics
Unit : MMTHB
6,085 7,590
25,857 19,971
Q2/14 Q3/14 9M/13 9M/14
PTTGC
HMC
Others
8,657
E & P Gas Oil & Trading Refining PetChem Others
8% YoY
618 691
558 643
Q2/14 Q3/14 9M/13 9M/14
Olefins U-Rate
91% 94% 88% 87%
Olefins
HDPE-Naphtha
USD/Ton
BTX U-Rate
103% 102% 87%
102%
Refineries
CDU U-Rate
Stock G/L
A/C GRM Mkt GRM
BZ-Cond
PX-Cond
BZ-Cond: 1%
YoY
PX:-Cond 30%
(0.91)
1.11
(0.69)
0.73 -2.92 0.73 -0.96 Stock Gain/Loss
QoQ
72%:A/C GRM BZ-Cond: 16%
QoQ
PX-Cond: 43%
13% QoQ
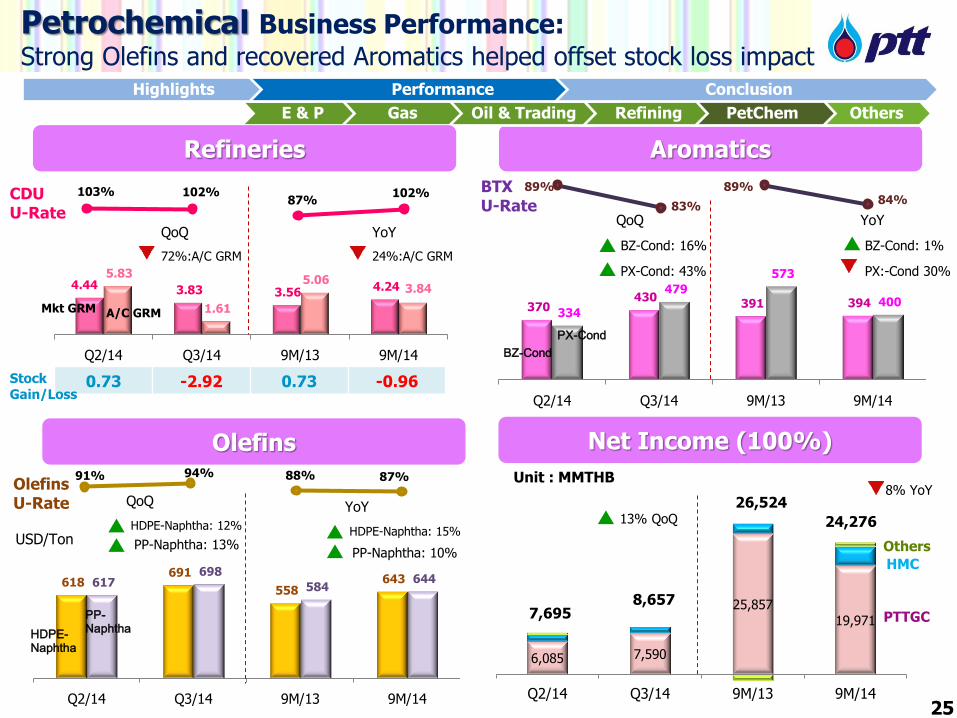
Petrochemical Business Performance: Strong Olefins and recovered Aromatics helped offset stock loss impact
7,695
26,524
24,276
YoY
24%:A/C GRM
QoQ
- Refinery business dip as A/C GRM decreased
(Q3/14 =1.64$/bbl, Q2/14= 5.83$/bbl) from stock loss (Q3/14 =
-2.76$/bbl, Q2/14= +0.73$/bbl) with maintained U-rate
+ Olefins business better from higher U-rate in Q3 (with full GSP#5 resumption), and improved Olefins spread
+ Aromatics business recovered from both PX and BZ spreads (PX spread rose by 43% from 334 $/Ton in
Q2’14 to 479 $/Ton in Q3’14 as well as BZ enhanced by 16% from 370 $/Ton to 431 $/Ton)
+There was one-off transaction from Vencorex (French entity) in Q2’14 amounted 1,180 MB (consisted of asset impairment 750 MB and provision cost of employee & others 430 MB according to implementing new strategy)
YoY
+Olefins improved: most spreads largely improved (HDPE-Naphtha: 9M14= 642$/ton,
9M13= 558$/ton)
- Refinery declined: A/C GRM decreased (9M14
=3.84$/bbl, 9M13= 5.06$/bbl) from stock loss (9M14= -0.93$/bbl, 9M13= 0.73$/bbl)
- Aromatics downturn: PX spreads tumbling (drop by 30% from 573 $/Ton in 9M13 to 400 $/Ton in 9M14)
- Vencorex restructuring cost and impairment in
Q2/14 amounted 1,180 MB
เพ่ิม PP-Naph
HDPE-Naphtha
PP-Naphtha
HDPE-Naphtha: 12%
QoQ
PP-Naphtha: 13% HDPE-Naphtha: 15%
YoY
PP-Naphtha: 10%
25
Highlights Performance Conclusion
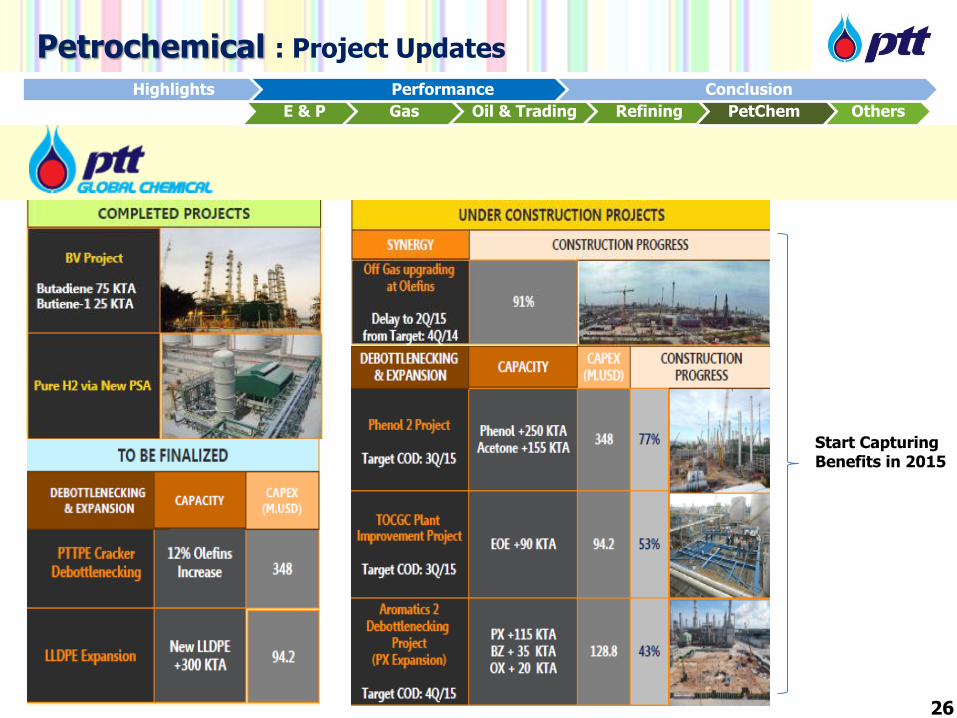
Petrochemical : Project Updates
E & P Gas Oil & Trading Refining PetChem Others
Start Capturing Benefits in 2015
26
Highlights Performance Conclusion
64 62
74
65
44 40
51
43
73 68
86
73
Q2/14 Q3/14 9M/13 9M/14
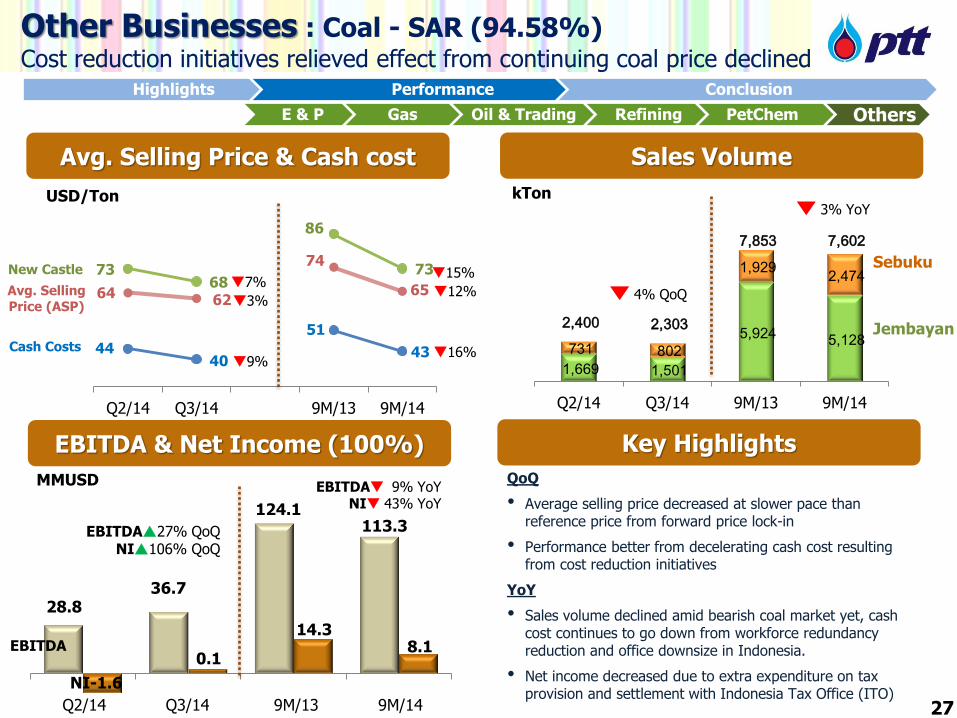
Other Businesses : Coal - SAR (94.58%) Cost reduction initiatives relieved effect from continuing coal price declined
EBITDA & Net Income (100%)
Sales Volume
Key Highlights
MMUSD
USD/Ton
1,669 1,501
5,924 5,128 731 802
1,929 2,474
2,400 2,303
7,853 7,602
Q2/14 Q3/14 9M/13 9M/14
kTon
Jembayan
Sebuku
Avg. Selling Price (ASP)
Cash Costs
E & P Gas Oil & Trading Refining PetChem Others
QoQ
• Average selling price decreased at slower pace than reference price from forward price lock-in
• Performance better from decelerating cash cost resulting from cost reduction initiatives
YoY
• Sales volume declined amid bearish coal market yet, cash cost continues to go down from workforce redundancy reduction and office downsize in Indonesia.
• Net income decreased due to extra expenditure on tax provision and settlement with Indonesia Tax Office (ITO)
4% QoQ
Avg. Selling Price & Cash cost
New Castle
SAR negative profit in Q2 is mainly due to extra expenditure US$ 3.6mn on tax settlement (corporate income tax) of BCS 2012 with Indonesia Tax Office (ITO). BCS is one of SAR subsidiaries in Indonesia, who handle coal sales to Tiger Energy Trading in Singapore.
3%
3% YoY
28.8 36.7
124.1 113.3 EBITDA27% QoQ
NI106% QoQ
NI-1.6
0.1
Q2/14 Q3/14 9M/13 9M/14
EBITDA 9% YoY NI 43% YoY
14.3 8.1 EBITDA
7%
9%
12%
15%
16%
27
Highlights Performance Conclusion
SAR Project Update
28
E & P Gas Oil & Trading Refining PetChem Others
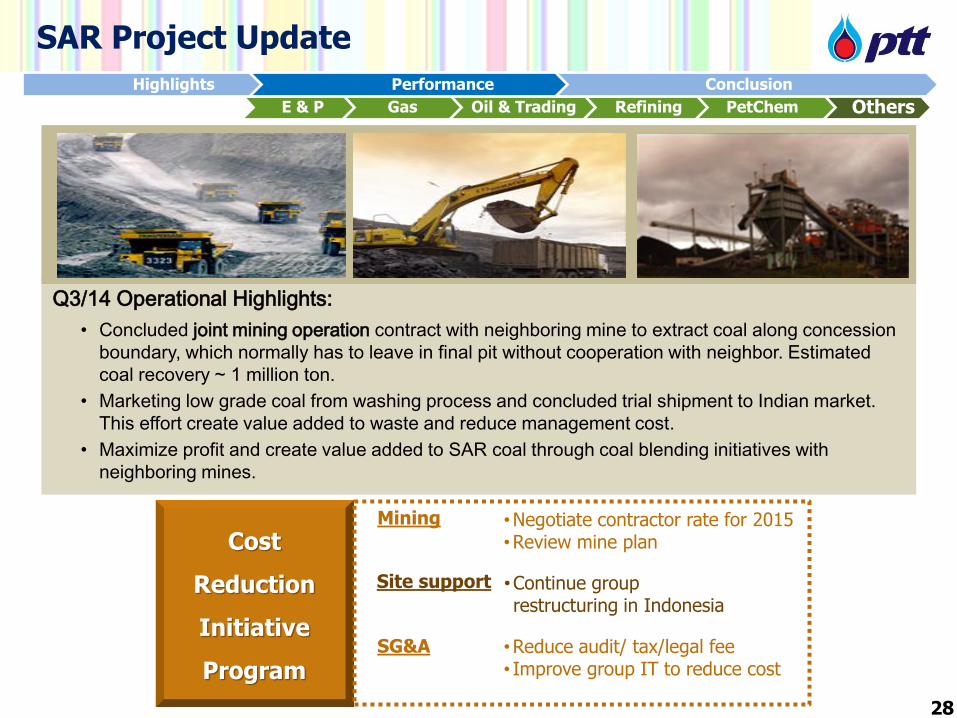
Q3/14 Operational Highlights: • Concluded joint mining operation contract with neighboring mine to extract coal along concession
boundary, which normally has to leave in final pit without cooperation with neighbor. Estimated coal recovery ~ 1 million ton.
• Marketing low grade coal from washing process and concluded trial shipment to Indian market. This effort create value added to waste and reduce management cost.
• Maximize profit and create value added to SAR coal through coal blending initiatives with neighboring mines.
Any other update??? Refinance ขอ ST loan จาก RTC 100mmusd เอาไปคืนเงินกู้ bank
Bridge loan bod approved repay all LT loan RTC will take
1H/14 Operational Highlights:
• Continue cost reduction initiative program under downturn market. Mining contract at
Jembayan was reviewed and negotiated with contractor PAMA. SAR cash cost has reduced 17% HoH.
• Operation ปรับ
• Logistic cost ขนถ่านผ่านแม่น้้า (ใช้เวลานาน) แล้วค่อยออกทะเล หาทางล่นระยะทาง ตัดถนน เพื่อลดระยะทาง ลด
ค่าใช้จ่าย study ตัดถนน ตรงเหลือแค่ 40กม. (ซื้อที่เพิ่มเพื่อตัดถนน) สร้างท่าเรือ 140กม.ทางน้้า ศึกษาแล้วท้าคนเดียวไม่คุ้ม
ทุน ก้าลังหา partner (replace water transportation with land transportation)
• per distance อันไหนถูกกว่า feul and time consumption
• In consideration of adjacent
• ราคาที่ break even
• Study coal blending to optimize SAR resources and seek opportunity for joint
operation with neighboring mines to maximize capacity and lowering cost. Conclud
shipment กับลูกค้า เจรจากับผู้ซื้อเรื่อง spec and selling price
• Market expansion in India and increase sales to Indonesia’s domestic market. ของล้นตลาดอยู่ ราคาก็ลง ก็เลยยังทรง
• ผู้ผลิตรายเล็กๆก้าลังประสบปัญหา ต้นทุนต่้า คุณภาพใกล้เคียง opportunity จากกลาง เล็ก เริ่มประสบปัญหา
Mining •Negotiate contractor rate for 2015 •Review mine plan
SG&A
Site support •Continue group restructuring in Indonesia
•Reduce audit/ tax/legal fee • Improve group IT to reduce cost
Cost
Reduction
Initiative
Program
New MD K.Peerachat
Highlights Performance Conclusion
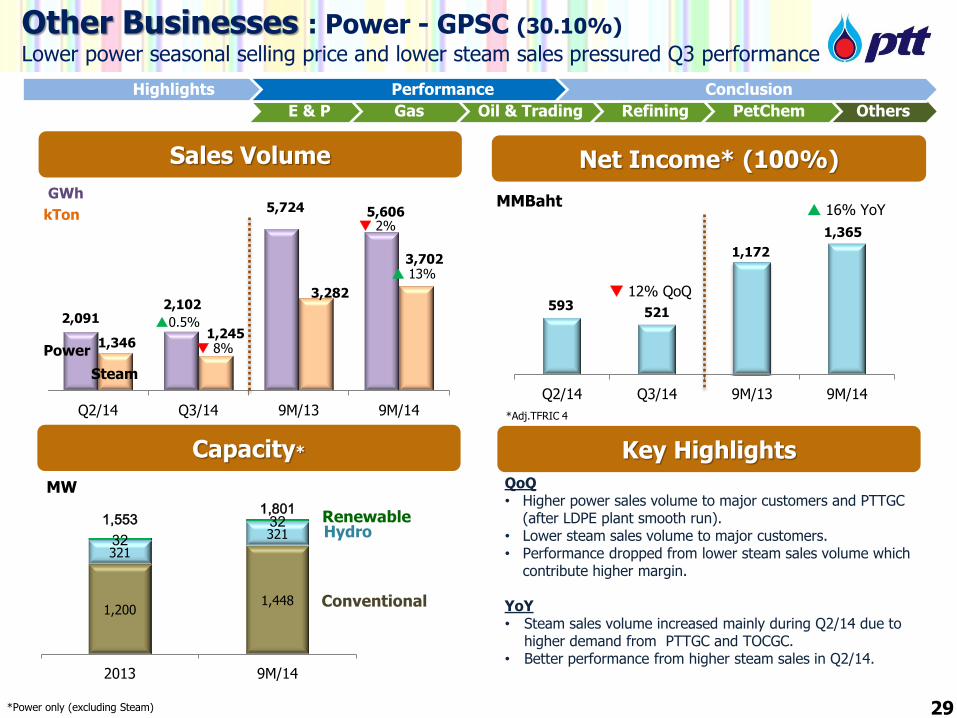
593 521
1,172
1,365
Q2/14 Q3/14 9M/13 9M/14
Net Income* (100%) Sales Volume
Key Highlights
MMBaht GWh
29
16% YoY
Other Businesses : Power - GPSC (30.10%)
Lower power seasonal selling price and lower steam sales pressured Q3 performance
2,091 2,102
5,724 5,606
1,346 1,245
3,282
3,702
Q2/14 Q3/14 9M/13 9M/14
kTon
E & P Gas Oil & Trading Refining PetChem Others
Capacity*
MW
1,200 1,448
321
321 32 32 1,553
1,801
2013 9M/14
Renewable
Conventional
*Power only (excludingSteam) According to Business Plan 2014-18 (@ 4 Mar 2014 (To be revised) ** By year-end 2014
2%
8%
13%
*Power only (excluding Steam)
Hydro
12% QoQ
*Adj.TFRIC 4
QoQ • Higher power sales volume to major customers and PTTGC
(after LDPE plant smooth run). • Lower steam sales volume to major customers. • Performance dropped from lower steam sales volume which
contribute higher margin. YoY • Steam sales volume increased mainly during Q2/14 due to
higher demand from PTTGC and TOCGC. • Better performance from higher steam sales in Q2/14.
ราคาขายไฟฟ้าให ้EGAT จะแพงสดุในชว่ง Q2 –Q3จะนอ้ยลง
• Legend ไว้ซ้าย • % ไว้ขวา
Power
Steam
0.5%
Highlights Performance Conclusion
30
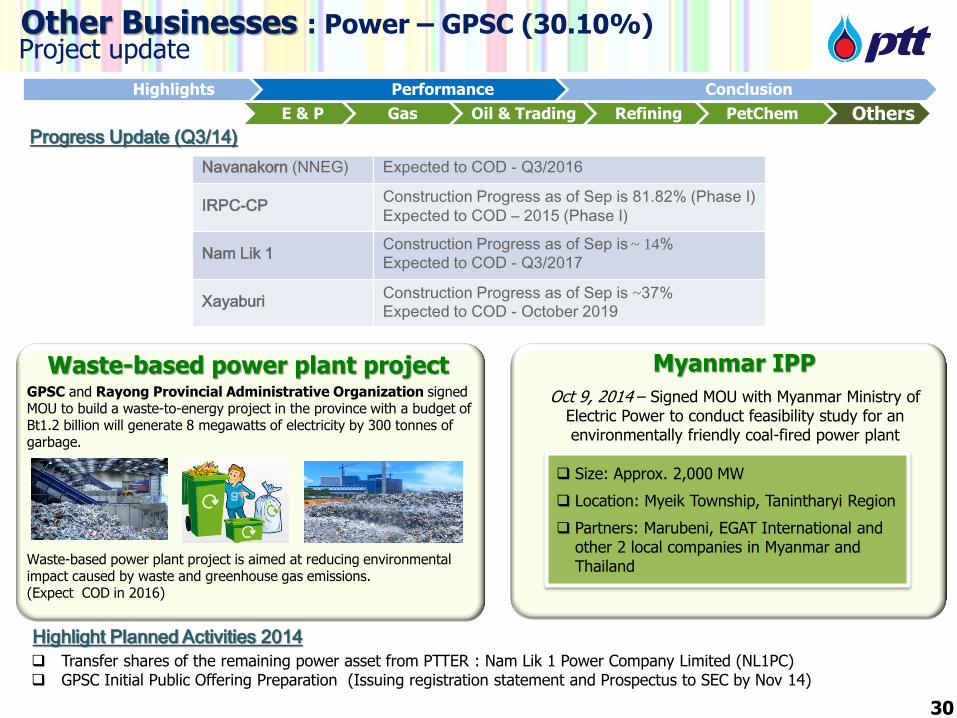
Other Businesses : Power – GPSC (30.10%) Project update
Transfer shares of the remaining power asset from PTTER : Nam Lik 1 Power Company Limited (NL1PC) GPSC Initial Public Offering Preparation (Issuing registration statement and Prospectus to SEC by Nov 14)
Navanakorn (NNEG) Expected to COD - Q3/2016
IRPC-CP Construction Progress as of Sep is 81.82% (Phase I) Expected to COD – 2015 (Phase I)
Nam Lik 1 Construction Progress as of Sep is ~ 14% Expected to COD - Q3/2017
Xayaburi Construction Progress as of Sep is ~37% Expected to COD - October 2019
E & P Gas Oil & Trading Refining PetChem Others
Progress Update (Q3/14)
Highlight Planned Activities 2014
GPSC and Rayong Provincial Administrative Organization signed MOU to build a waste-to-energy project in the province with a budget of Bt1.2 billion will generate 8 megawatts of electricity by 300 tonnes of garbage. Waste-based power plant project is aimed at reducing environmental impact caused by waste and greenhouse gas emissions. (Expect COD in 2016)
Waste-based power plant project Myanmar IPP
Size: Approx. 2,000 MW
Location: Myeik Township, Tanintharyi Region
Partners: Marubeni, EGAT International and other 2 local companies in Myanmar and Thailand
Oct 9, 2014 – Signed MOU with Myanmar Ministry of Electric Power to conduct feasibility study for an environmentally friendly coal-fired power plant
30
Highlights Performance Conclusion
106.1 101.5 105.1 104.0
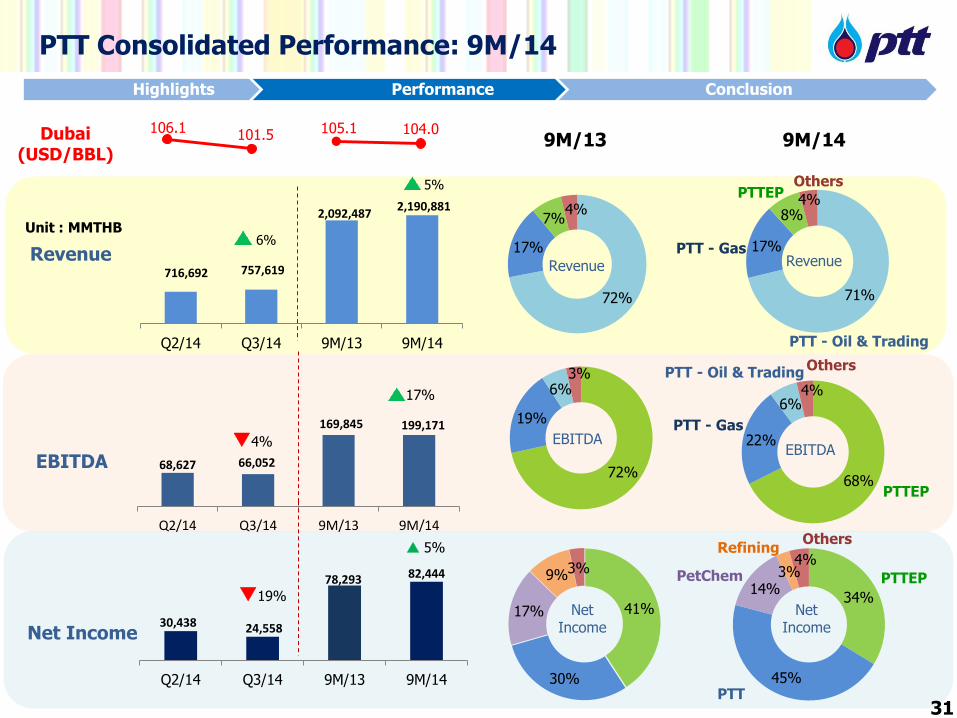
30,438 24,558
78,293 82,444
Q2/14 Q3/14 9M/13 9M/14
PTT Consolidated Performance: 9M/14
31
Dubai (USD/BBL)
9M/14 9M/13
41%
30%
17%
9% 3%
68%
22%
6% 4%
PTT - Oil & Trading
PTT - Gas
Others
PTTEP
716,692 757,619
2,092,487 2,190,881
Q2/14 Q3/14 9M/13 9M/14
68,627 66,052
169,845 199,171
Q2/14 Q3/14 9M/13 9M/14
34%
45%
14% 3%
4%
PTT
PetChem
Others
PTTEP
Refining
Net Income
Unit : MMTHB
EBITDA
Net Income
Revenue
71%
17%
8% 4%
PTT - Oil & Trading
PTT - Gas
Others PTTEP
Revenue
EBITDA
6%
5%
72%
17%
7% 4%
72%
19%
6% 3%
Revenue
EBITDA
Net Income
30%
46%
17%
-5% 4%
72%
17%
7% 4%
69%
24%
4%
3%
Revenue
EBITDA
Net Income
Q3/14
4%
17%
19%
5%
Highlights Performance Conclusion
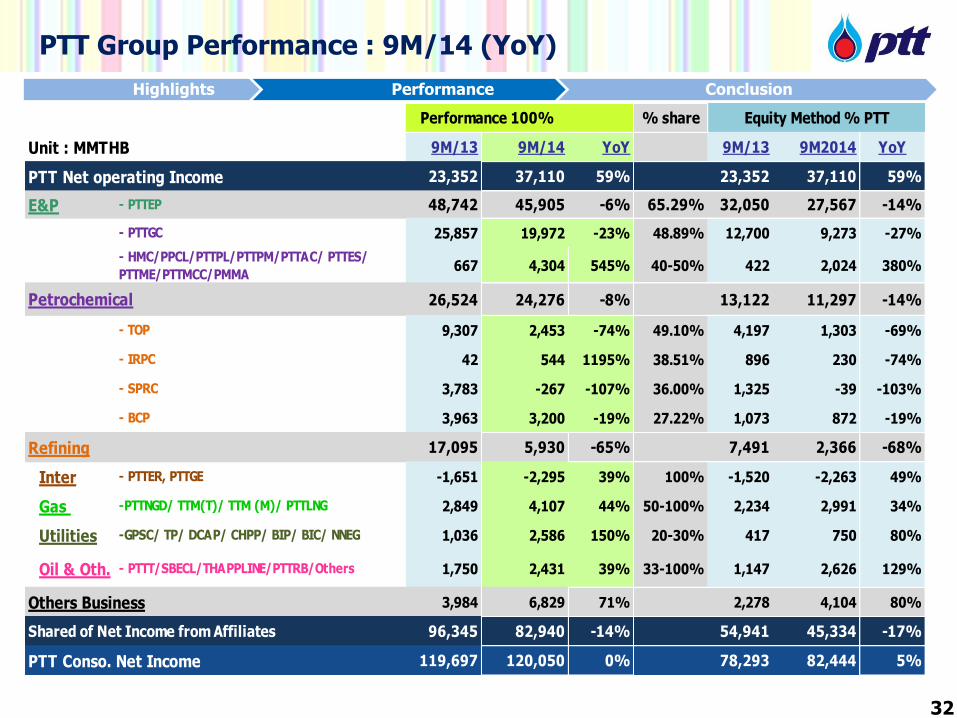
PTT Group Performance : 9M/14 (YoY)
% share
Unit : MMTHB 9M/13 9M/14 YoY 9M/13 9M2014 YoY
PTT Net operating Income 23,352 37,110 59% 23,352 37,110 59%
E&P - PTTEP 48,742 45,905 -6% 65.29% 32,050 27,567 -14%
- PTTGC 25,857 19,972 -23% 48.89% 12,700 9,273 -27%
- HMC/PPCL/PTTPL/PTTPM/PTTAC/ PTTES/
PTTME/PTTMCC/PMMA667 4,304 545% 40-50% 422 2,024 380%
Petrochemical 26,524 24,276 -8% 13,122 11,297 -14%
- TOP 9,307 2,453 -74% 49.10% 4,197 1,303 -69%
- IRPC 42 544 1195% 38.51% 896 230 -74%
- SPRC 3,783 -267 -107% 36.00% 1,325 -39 -103%
- BCP 3,963 3,200 -19% 27.22% 1,073 872 -19%
Refining 17,095 5,930 -65% 7,491 2,366 -68%
Inter - PTTER, PTTGE -1,651 -2,295 39% 100% -1,520 -2,263 49%
Gas -PTTNGD/ TTM(T)/ TTM (M)/ PTTLNG 2,849 4,107 44% 50-100% 2,234 2,991 34%
Utilities -GPSC/ TP/ DCAP/ CHPP/ BIP/ BIC/ NNEG 1,036 2,586 150% 20-30% 417 750 80%
Oil & Oth. - PTTT/SBECL/THAPPLINE/PTTRB/Others 1,750 2,431 39% 33-100% 1,147 2,626 129%
Others Business 3,984 6,829 71% 2,278 4,104 80%
Shared of Net Income from Affiliates 96,345 82,940 -14% 54,941 45,334 -17%
PTT Conso. Net Income 119,697 120,050 0% 78,293 82,444 5%
Performance 100% Equity Method % PTT
32
Highlights Performance Conclusion
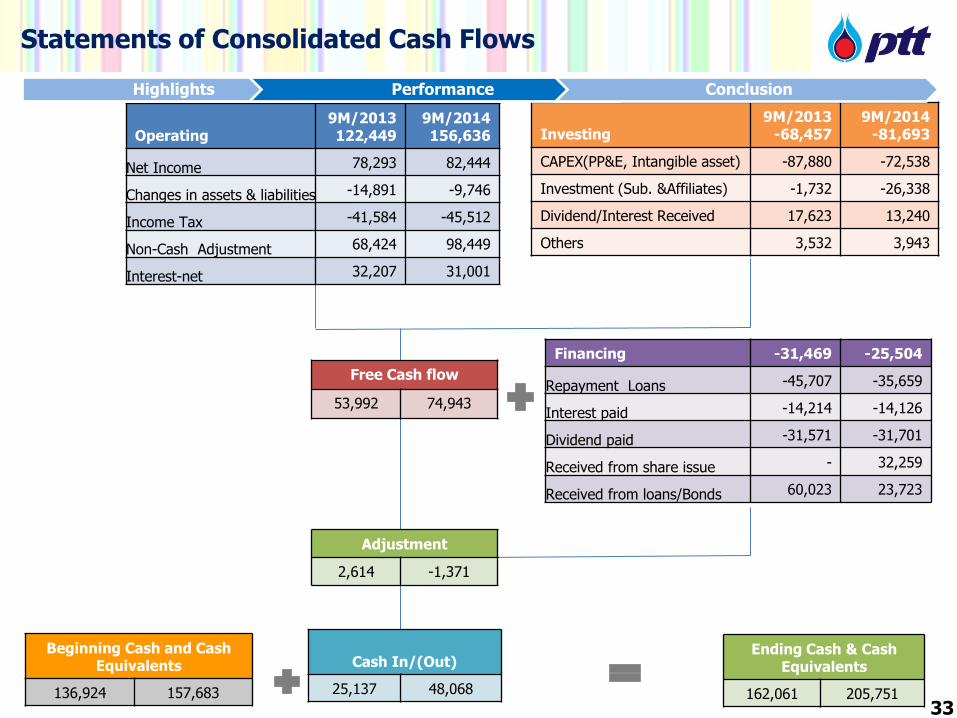
Free Cash flow
53,992 74,943
Investing
9M/2013 -68,457
9M/2014 -81,693
CAPEX(PP&E, Intangible asset) -87,880 -72,538
Investment (Sub. &Affiliates) -1,732 -26,338
Dividend/Interest Received 17,623 13,240
Others 3,532 3,943
Operating
9M/2013 122,449
9M/2014 156,636
Net Income 78,293 82,444
Changes in assets & liabilities -14,891 -9,746
Income Tax -41,584 -45,512
Non-Cash Adjustment 68,424 98,449
Interest-net 32,207 31,001
Ending Cash & Cash Equivalents
162,061 205,751
Beginning Cash and Cash Equivalents
136,924 157,683
Cash In/(Out)
25,137 48,068
Adjustment
2,614 -1,371
33
Financing -31,469 -25,504
Repayment Loans -45,707 -35,659
Interest paid -14,214 -14,126
Dividend paid -31,571 -31,701
Received from share issue - 32,259
Received from loans/Bonds 60,023 23,723
Statements of Consolidated Cash Flows
Highlights Performance Conclusion
Other Liabilities
PP&E
Others Non-
current Assets
Other Current Assets
L/T Liabilities (incl. due within 1 yr)
Total Equity
MMTHB
Cash & S/T Invest
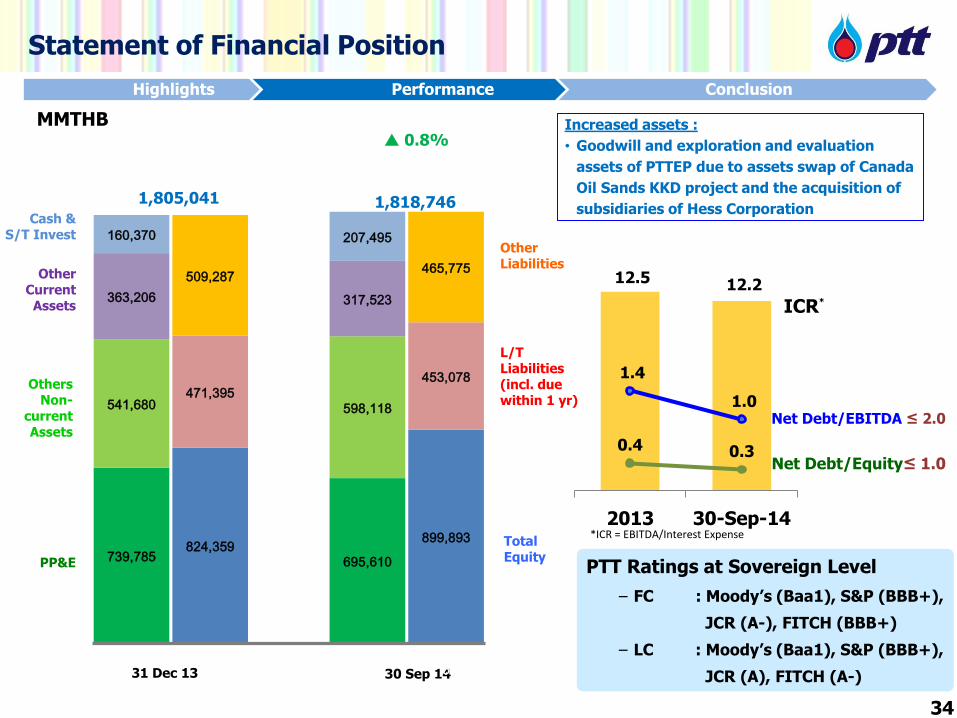
Increased assets :
• Goodwill and exploration and evaluation
assets of PTTEP due to assets swap of Canada
Oil Sands KKD project and the acquisition of
subsidiaries of Hess Corporation
31 Dec 13 30 Sep 14
1,805,041 1,818,746
Statement of Financial Position
34
PTT Ratings at Sovereign Level
− FC : Moody’s (Baa1), S&P (BBB+),
JCR (A-), FITCH (BBB+)
− LC : Moody’s (Baa1), S&P (BBB+),
JCR (A), FITCH (A-)
12.5 12.2
0.4 0.3
1.4
1.0
0.0
0.5
1.0
1.5
2.0
2.5
3.0
2013 30-Sep-14
Net Debt/EBITDA ≤ 2.0
Net Debt/Equity≤ 1.0
ICR*
*ICR = EBITDA/Interest Expense
739,785 695,610
541,680 598,118
363,206 317,523
160,370 207,495
824,359 899,893
471,395 453,078
509,287 465,775
1 2 3 4 5
0.8%
Highlights Performance Conclusion
Contents
35
Highlights
Performance
Conclusion
Highlights Performance Conclusion
9M/2014 Conclusion
36
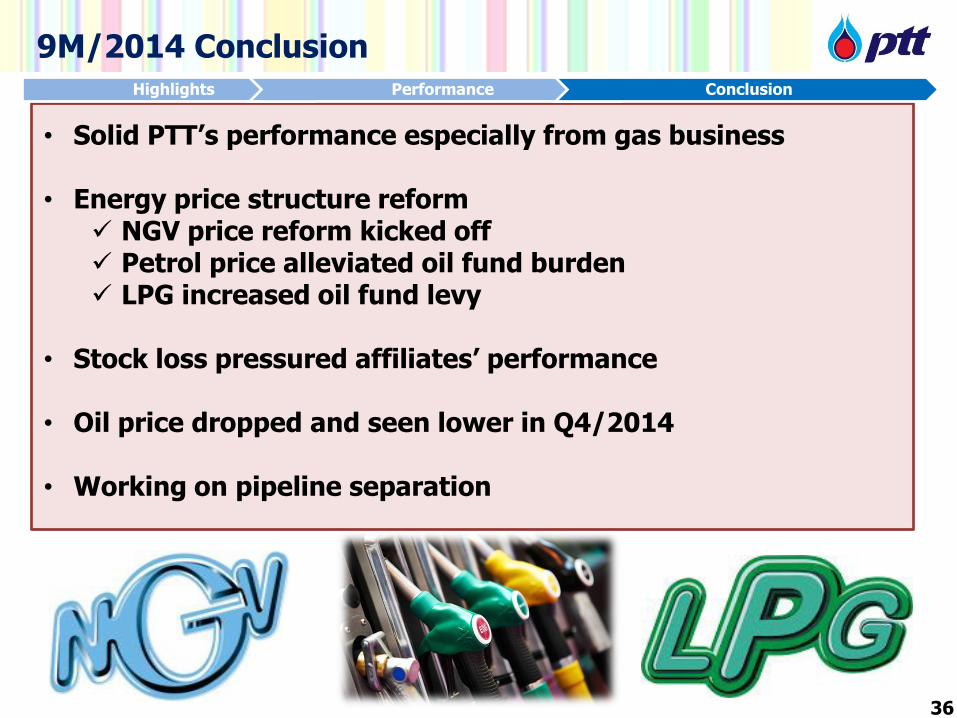
• Solid PTT’s performance especially from gas business
• Energy price structure reform NGV price reform kicked off Petrol price alleviated oil fund burden LPG increased oil fund levy
• Stock loss pressured affiliates’ performance
• Oil price dropped and seen lower in Q4/2014
• Working on pipeline separation
Highlights Performance Conclusion
2015 Industry Outlook
37
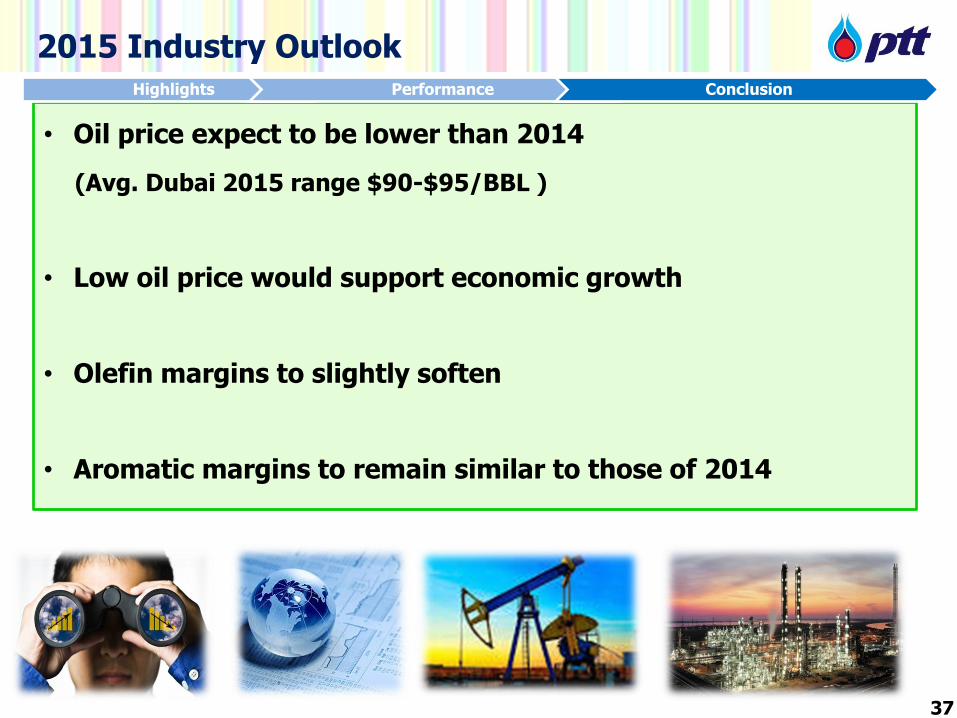
• Oil price expect to be lower than 2014
(Avg. Dubai 2015 range $90-$95/BBL )
• Low oil price would support economic growth
• Olefin margins to slightly soften
• Aromatic margins to remain similar to those of 2014
Highlights Performance Conclusion
Thank you PTT Public Company Limited – Investor Relations Department
Tel. +66 2 537-3518, Fax. +66 2 537-3948, E-mail: [email protected] Website: http://www.pttplc.com
Disclaimer
The information contained in our presentation is intended solely for your personal reference only. In addition, such information contains projections and forward-looking
statements that reflect our current views with respect to future events and financial performance. These views are based on assumptions subject to various risks and
uncertainties. No assurance is given that future events will occur, that projections will be achieved, or that our assumptions are correct. Actual results may differ
materially from those projected.
Petroleum Reserves and Resources Information
In this presentation, the Company discloses petroleum reserves and resources that are not included in the Securities Exchange and Commission of Thailand (SEC) Annual
Registration Statement Form 56-1 under “Supplemental Information on Petroleum Exploration and Production Activities”. The reserves and resources data contained in
this presentation reflects the Company’s best estimates of its reserves and resources. While the Company periodically obtains an independent audit of a portion of its
proved reserves, no independent qualified reserves evaluator or auditor was involved in the preparation of reserves and resources data disclosed in this presentation.
Unless stated otherwise, reserves and resources are stated at the Company’s gross basis. This presentation may contain the terms “proved reserves”, “probable reserves”,
and/or “contingent resources”. Unless stated otherwise, the Company adopts similar description as defined by the Society of Petroleum Engineers.
Proved Reserves - Proved reserves are defined as those quantities of petroleum which, by analysis of geological and engineering data, can be estimated with reasonable
certainty to be commercially recoverable, from a given date forward, from known reservoirs and under current economic conditions, operating methods, and government
regulations.
Probable Reserves - Probable reserves are defined as those unproved reserves which analysis of geological and engineering data suggests are more likely than not to be
recoverable.
Contingent Resources – Contingent resources are defined as those quantities of petroleum which are estimated, on a given date, to be potentially recoverable from
known accumulations, but which are not currently considered to be commercially recoverable. The reasons for non commerciality could be economic including market
availability, political, environmental, or technological.
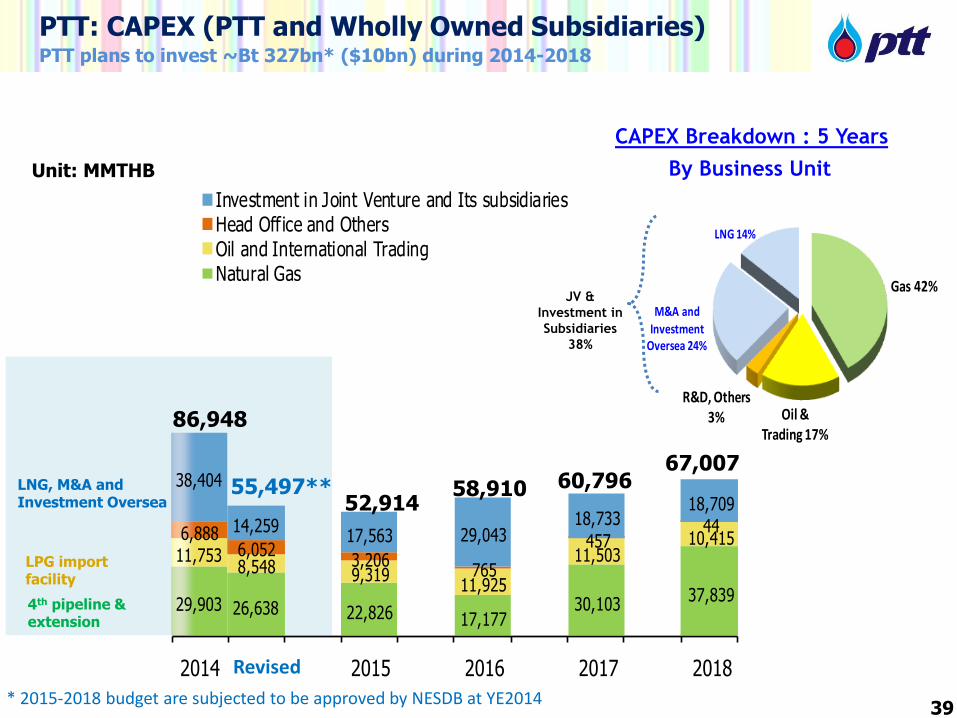
29,903 26,638 22,826 17,17730,103
37,839
11,7538,548 9,319
11,925
11,50310,4156,888
6,0523,206
765
45744
38,404
14,25917,563 29,043
18,73318,709
2014Revised* 2015 2016 2017 2018
Investment in Joint Venture and Its subsidiariesHead Office and OthersOil and International TradingNatural Gas
Gas 42%
Oil & Trading 17%
R&D, Others 3%
M&A and
Investment Oversea 24%
LNG 14%
Unit: MMTHB
PTT: CAPEX (PTT and Wholly Owned Subsidiaries) PTT plans to invest ~Bt 327bn* ($10bn) during 2014-2018
CAPEX Breakdown : 5 Years
By Business Unit
JV &
Investment in
Subsidiaries
38%
39
52,914 60,796
67,007
86,948
58,910
4th pipeline & extension
LPG import facility
LNG, M&A and Investment Oversea
55,497**
Revised
* 2015-2018 budget are subjected to be approved by NESDB at YE2014
40
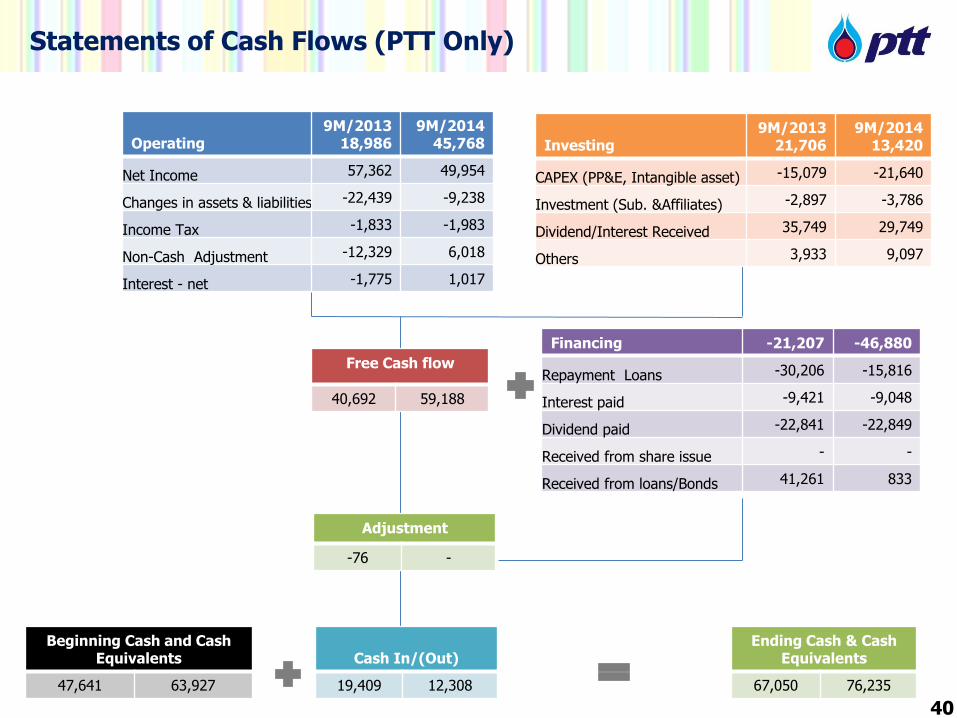
Free Cash flow
40,692 59,188
Financing -21,207 -46,880
Repayment Loans -30,206 -15,816
Interest paid -9,421 -9,048
Dividend paid -22,841 -22,849
Received from share issue - -
Received from loans/Bonds 41,261 833
Investing
9M/2013 21,706
9M/2014 13,420
CAPEX (PP&E, Intangible asset) -15,079 -21,640
Investment (Sub. &Affiliates) -2,897 -3,786
Dividend/Interest Received 35,749 29,749
Others 3,933 9,097
Operating
9M/2013 18,986
9M/2014 45,768
Net Income 57,362 49,954
Changes in assets & liabilities -22,439 -9,238
Income Tax -1,833 -1,983
Non-Cash Adjustment -12,329 6,018
Interest - net -1,775 1,017
Ending Cash & Cash Equivalents
67,050 76,235
Beginning Cash and Cash Equivalents
47,641 63,927
Cash In/(Out)
19,409 12,308
Adjustment
-76 -
40
Statements of Cash Flows (PTT Only)
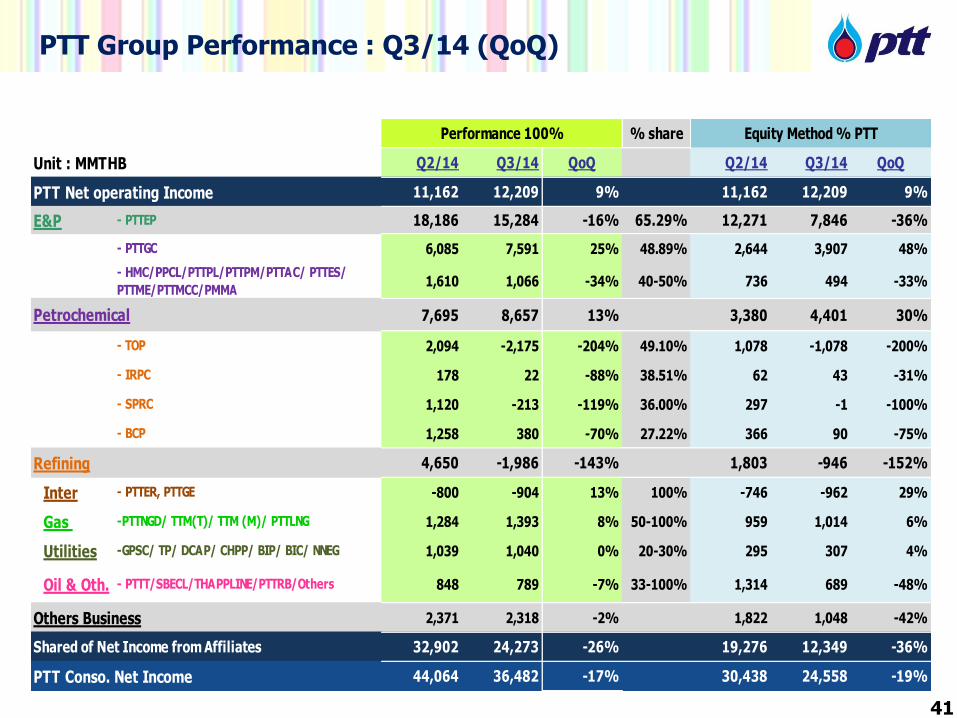
PTT Group Performance : Q3/14 (QoQ)
% share
Unit : MMTHB Q2/14 Q3/14 QoQ Q2/14 Q3/14 QoQ
PTT Net operating Income 11,162 12,209 9% 11,162 12,209 9%
E&P - PTTEP 18,186 15,284 -16% 65.29% 12,271 7,846 -36%
- PTTGC 6,085 7,591 25% 48.89% 2,644 3,907 48%
- HMC/PPCL/PTTPL/PTTPM/PTTAC/ PTTES/
PTTME/PTTMCC/PMMA1,610 1,066 -34% 40-50% 736 494 -33%
Petrochemical 7,695 8,657 13% 3,380 4,401 30%
- TOP 2,094 -2,175 -204% 49.10% 1,078 -1,078 -200%
- IRPC 178 22 -88% 38.51% 62 43 -31%
- SPRC 1,120 -213 -119% 36.00% 297 -1 -100%
- BCP 1,258 380 -70% 27.22% 366 90 -75%
Refining 4,650 -1,986 -143% 1,803 -946 -152%
Inter - PTTER, PTTGE -800 -904 13% 100% -746 -962 29%
Gas -PTTNGD/ TTM(T)/ TTM (M)/ PTTLNG 1,284 1,393 8% 50-100% 959 1,014 6%
Utilities -GPSC/ TP/ DCAP/ CHPP/ BIP/ BIC/ NNEG 1,039 1,040 0% 20-30% 295 307 4%
Oil & Oth. - PTTT/SBECL/THAPPLINE/PTTRB/Others 848 789 -7% 33-100% 1,314 689 -48%
Others Business 2,371 2,318 -2% 1,822 1,048 -42%
Shared of Net Income from Affiliates 32,902 24,273 -26% 19,276 12,349 -36%
PTT Conso. Net Income 44,064 36,482 -17% 30,438 24,558 -19%
Performance 100% Equity Method % PTT
41
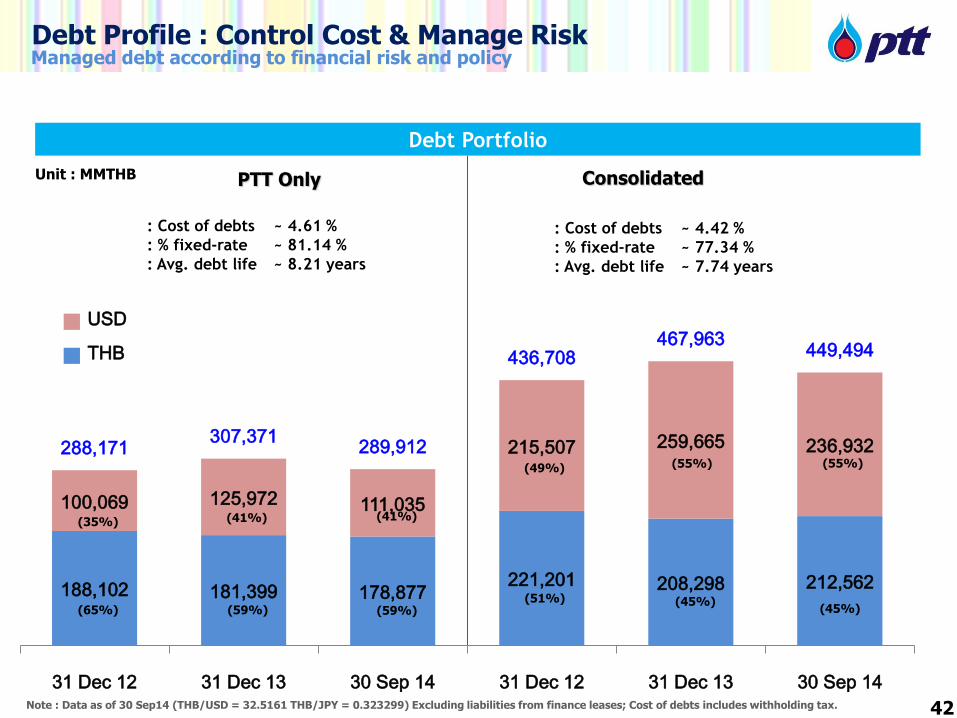
Debt Profile : Control Cost & Manage Risk
Debt Portfolio
Managed debt according to financial risk and policy
Consolidated PTT Only Unit : MMTHB
42
: Cost of debts ~ 4.61 %
: % fixed-rate ~ 81.14 %
: Avg. debt life ~ 8.21 years
: Cost of debts ~ 4.42 %
: % fixed-rate ~ 77.34 %
: Avg. debt life ~ 7.74 years
188,102 181,399 178,877 221,201 208,298 212,562
100,069 125,972 111,035
215,507 259,665 236,932 288,171 307,371 289,912
436,708 467,963 449,494
31 Dec 12 31 Dec 13 30 Sep 14 31 Dec 12 31 Dec 13 30 Sep 14
USD
THB
(35%)
(65%)
(41%)
(59%)
(41%)
(59%)
(49%)
(51%)
(55%)
(45%)
(55%)
(45%)
Note : Data as of 30 Sep14 (THB/USD = 32.5161 THB/JPY = 0.323299) Excluding liabilities from finance leases; Cost of debts includes withholding tax.
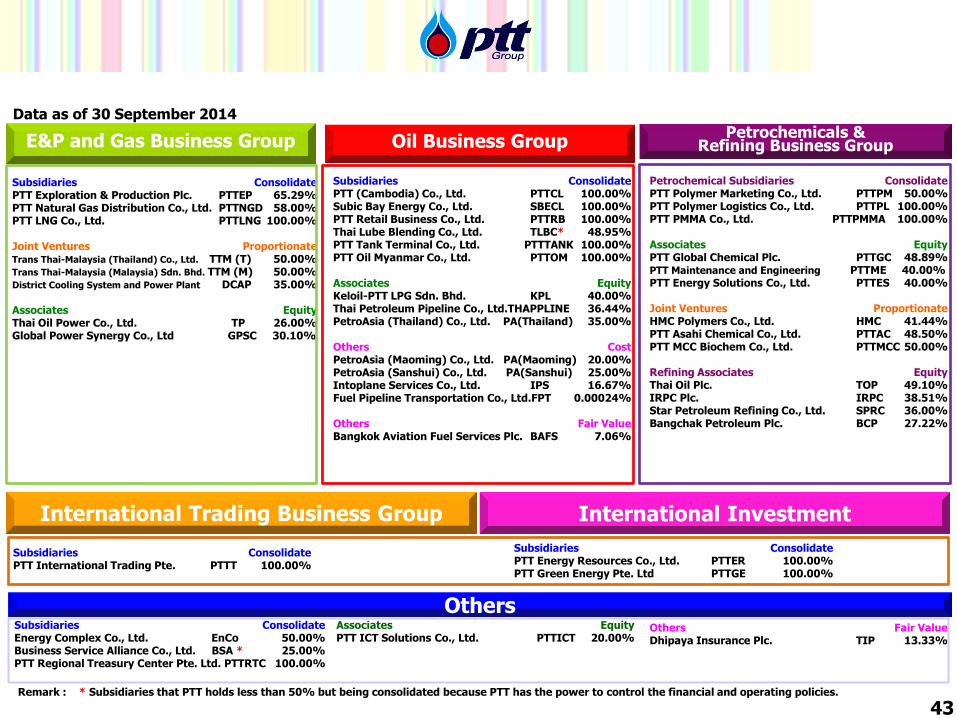
Subsidiaries Consolidate PTT (Cambodia) Co., Ltd. PTTCL 100.00% Subic Bay Energy Co., Ltd. SBECL 100.00% PTT Retail Business Co., Ltd. PTTRB 100.00% Thai Lube Blending Co., Ltd. TLBC* 48.95% PTT Tank Terminal Co., Ltd. PTTTANK 100.00% PTT Oil Myanmar Co., Ltd. PTTOM 100.00% Associates Equity Keloil-PTT LPG Sdn. Bhd. KPL 40.00% Thai Petroleum Pipeline Co., Ltd.THAPPLINE 36.44% PetroAsia (Thailand) Co., Ltd. PA(Thailand) 35.00% Others Cost PetroAsia (Maoming) Co., Ltd. PA(Maoming) 20.00% PetroAsia (Sanshui) Co., Ltd. PA(Sanshui) 25.00% Intoplane Services Co., Ltd. IPS 16.67% Fuel Pipeline Transportation Co., Ltd.FPT 0.00024% Others Fair Value Bangkok Aviation Fuel Services Plc. BAFS 7.06%
Others
Subsidiaries Consolidate PTT Exploration & Production Plc. PTTEP 65.29% PTT Natural Gas Distribution Co., Ltd. PTTNGD 58.00% PTT LNG Co., Ltd. PTTLNG 100.00% Joint Ventures Proportionate Trans Thai-Malaysia (Thailand) Co., Ltd. TTM (T) 50.00% Trans Thai-Malaysia (Malaysia) Sdn. Bhd. TTM (M) 50.00% District Cooling System and Power Plant DCAP 35.00% Associates Equity Thai Oil Power Co., Ltd. TP 26.00% Global Power Synergy Co., Ltd GPSC 30.10%
Petrochemical Subsidiaries Consolidate PTT Polymer Marketing Co., Ltd. PTTPM 50.00% PTT Polymer Logistics Co., Ltd. PTTPL 100.00% PTT PMMA Co., Ltd. PTTPMMA 100.00% Associates Equity PTT Global Chemical Plc. PTTGC 48.89% PTT Maintenance and Engineering PTTME 40.00% PTT Energy Solutions Co., Ltd. PTTES 40.00% Joint Ventures Proportionate HMC Polymers Co., Ltd. HMC 41.44% PTT Asahi Chemical Co., Ltd. PTTAC 48.50% PTT MCC Biochem Co., Ltd. PTTMCC 50.00% Refining Associates Equity Thai Oil Plc. TOP 49.10% IRPC Plc. IRPC 38.51% Star Petroleum Refining Co., Ltd. SPRC 36.00% Bangchak Petroleum Plc. BCP 27.22% Others Fair Value Dhipaya Insurance Plc. TIP 13.33%
Subsidiaries Consolidate Energy Complex Co., Ltd. EnCo 50.00% Business Service Alliance Co., Ltd. BSA * 25.00% PTT Regional Treasury Center Pte. Ltd. PTTRTC 100.00%
International Trading Business Group
Subsidiaries Consolidate PTT International Trading Pte. PTTT 100.00%
Remark : * Subsidiaries that PTT holds less than 50% but being consolidated because PTT has the power to control the financial and operating policies.
Petrochemicals & Refining Business Group
Associates Equity PTT ICT Solutions Co., Ltd. PTTICT 20.00%
E&P and Gas Business Group Oil Business Group
Data as of 30 September 2014
International Investment
Subsidiaries Consolidate PTT Energy Resources Co., Ltd. PTTER 100.00%
PTT Green Energy Pte. Ltd PTTGE 100.00%
43
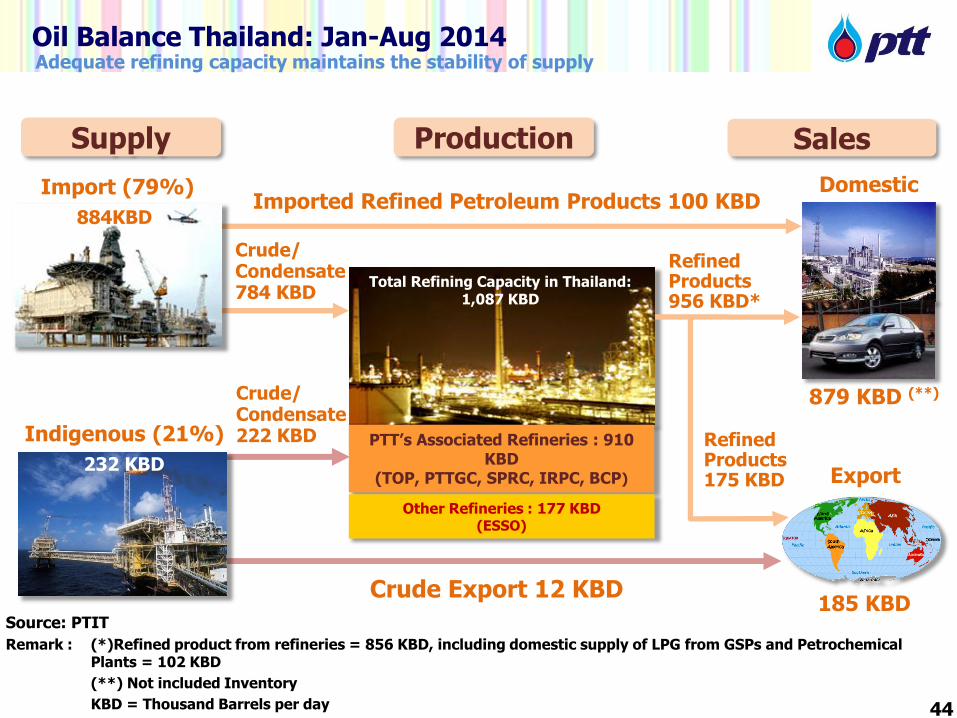
Indigenous (21%)
Imported Refined Petroleum Products 100 KBD
879 KBD (**)
Source: PTIT
Remark : (*)Refined product from refineries = 856 KBD, including domestic supply of LPG from GSPs and Petrochemical Plants = 102 KBD
(**) Not included Inventory
KBD = Thousand Barrels per day
Import (79%)
Crude/ Condensate 784 KBD
Refined Products 956 KBD*
Domestic
Crude/ Condensate 222 KBD
Supply Production Sales
Export
185 KBD
Oil Balance Thailand: Jan-Aug 2014
232 KBD
Adequate refining capacity maintains the stability of supply
Total Refining Capacity in Thailand: 1,087 KBD
PTT’s Associated Refineries : 910 KBD
(TOP, PTTGC, SPRC, IRPC, BCP)
Other Refineries : 177 KBD (ESSO)
Refined Products 175 KBD
44
Crude Export 12 KBD
884KBD
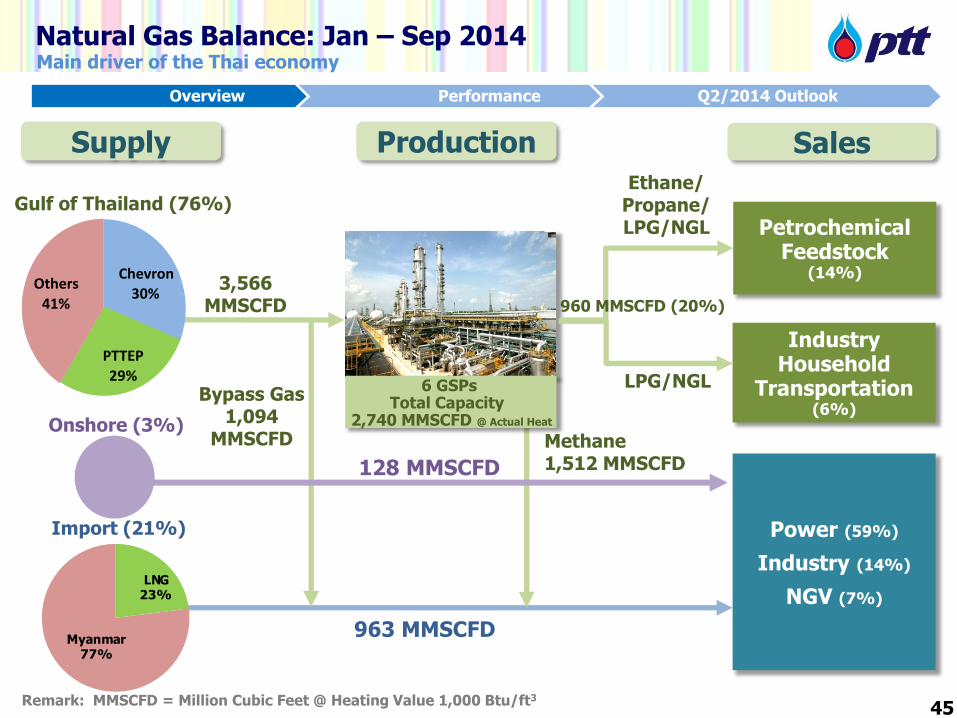
Natural Gas Balance: Jan – Sep 2014
Gulf of Thailand (76%)
Power (59%)
Industry (14%)
NGV (7%)
Petrochemical Feedstock
(14%)
Industry Household
Transportation (6%)
Ethane/ Propane/ LPG/NGL
LPG/NGL
Remark: MMSCFD = Million Cubic Feet @ Heating Value 1,000 Btu/ft3
3,566 MMSCFD
Main driver of the Thai economy
Supply Production Sales
45
LNG23%
Myanmar77%
Chevron 30%
PTTEP 29%
Others 41%
Bypass Gas 1,094
MMSCFD
960 MMSCFD (20%)
Methane 1,512 MMSCFD
Onshore (3%)
128 MMSCFD
6 GSPs Total Capacity
2,740 MMSCFD @ Actual Heat
Import (21%)
963 MMSCFD
Overview Performance Q2/2014 Outlook
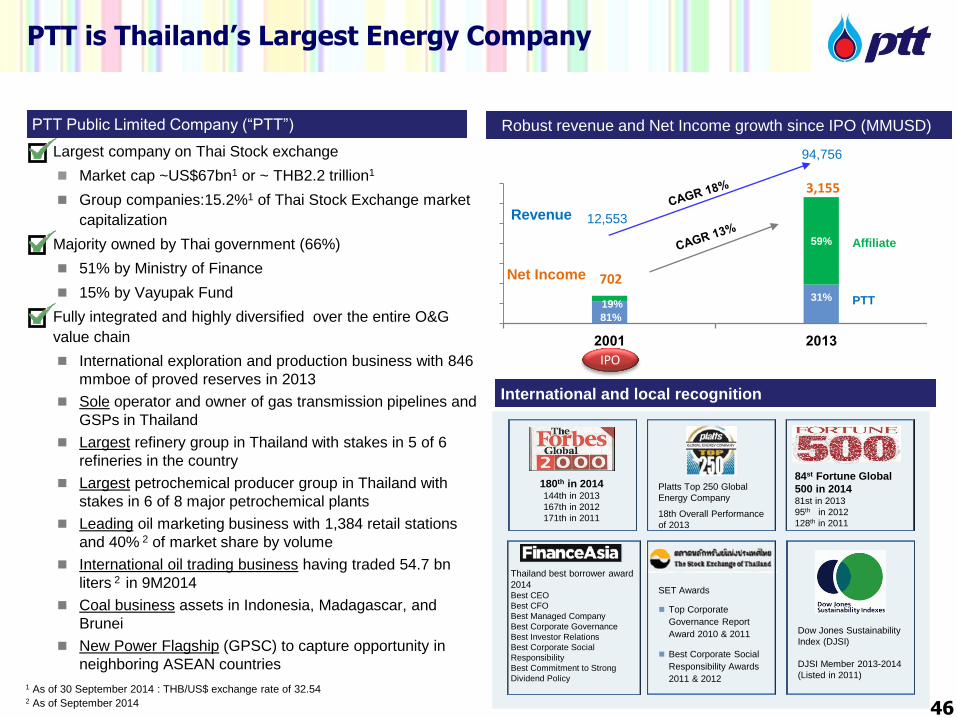
81%
31% 19%
59%
2001 2013
Revenue
Net Income
Affiliate
PTT
702
3,155
IPO
1 As of 30 September 2014 : THB/US$ exchange rate of 32.54 2 As of September 2014
Largest company on Thai Stock exchange
Market cap ~US$67bn1 or ~ THB2.2 trillion1
Group companies:15.2%1 of Thai Stock Exchange market
capitalization
Majority owned by Thai government (66%)
51% by Ministry of Finance
15% by Vayupak Fund
Fully integrated and highly diversified over the entire O&G
value chain
International exploration and production business with 846
mmboe of proved reserves in 2013
Sole operator and owner of gas transmission pipelines and
GSPs in Thailand
Largest refinery group in Thailand with stakes in 5 of 6
refineries in the country
Largest petrochemical producer group in Thailand with
stakes in 6 of 8 major petrochemical plants
Leading oil marketing business with 1,384 retail stations
and 40% 2 of market share by volume
International oil trading business having traded 54.7 bn
liters 2 in 9M2014
Coal business assets in Indonesia, Madagascar, and
Brunei
New Power Flagship (GPSC) to capture opportunity in
neighboring ASEAN countries
PTT is Thailand’s Largest Energy Company
PTT Public Limited Company (“PTT”) Robust revenue and Net Income growth since IPO (MMUSD)
12,553
94,756
International and local recognition
Thailand best borrower award
2014 Best CEO
Best CFO
Best Managed Company
Best Corporate Governance
Best Investor Relations
Best Corporate Social
Responsibility
Best Commitment to Strong
Dividend Policy
SET Awards
Top Corporate
Governance Report
Award 2010 & 2011
Best Corporate Social
Responsibility Awards
2011 & 2012
84st Fortune Global
500 in 2014 81st in 2013
95th in 2012
128th in 2011
Platts Top 250 Global
Energy Company
18th Overall Performance
of 2013
180th in 2014 144th in 2013
167th in 2012
171th in 2011
Dow Jones Sustainability
Index (DJSI)
DJSI Member 2013-2014
(Listed in 2011)
46
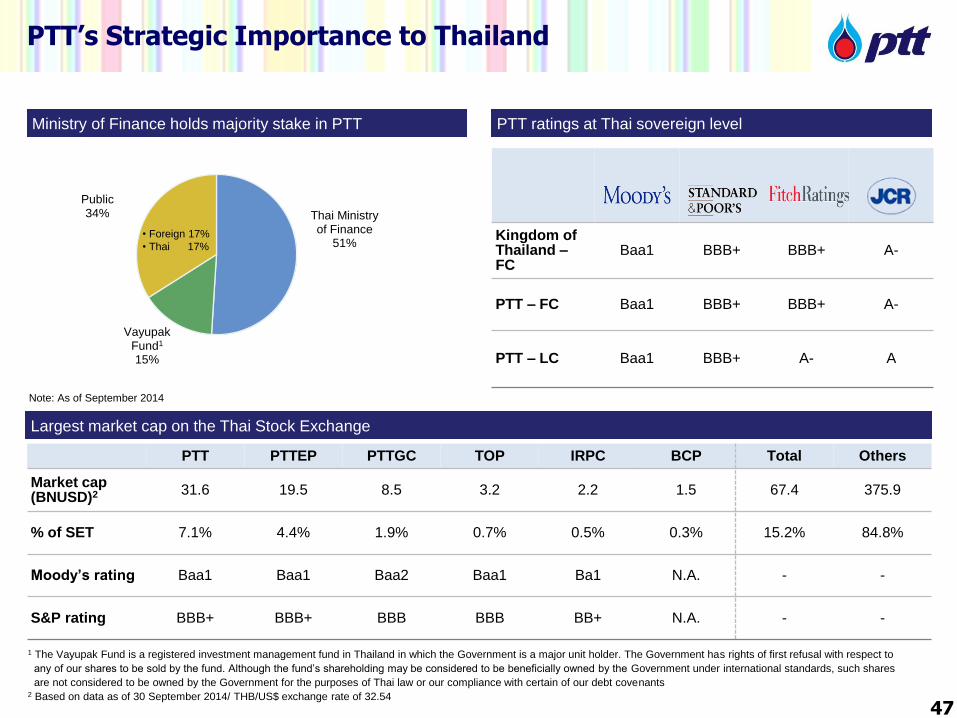
Ministry of Finance holds majority stake in PTT PTT ratings at Thai sovereign level
Thai Ministry of Finance
51%
Vayupak Fund1 15%
Public 34%
Kingdom of Thailand – FC
Baa1 BBB+ BBB+ A-
PTT – FC Baa1 BBB+ BBB+ A-
PTT – LC Baa1 BBB+ A- A
Largest market cap on the Thai Stock Exchange
Note: As of September 2014
• Foreign 17%
• Thai 17%
PTT PTTEP PTTGC TOP IRPC BCP Total Others
Market cap (BNUSD)2 31.6 19.5 8.5 3.2 2.2 1.5 67.4 375.9
% of SET 7.1% 4.4% 1.9% 0.7% 0.5% 0.3% 15.2% 84.8%
Moody’s rating Baa1 Baa1 Baa2 Baa1 Ba1 N.A. - -
S&P rating BBB+ BBB+ BBB BBB BB+ N.A. - -
PTT’s Strategic Importance to Thailand
47
1 The Vayupak Fund is a registered investment management fund in Thailand in which the Government is a major unit holder. The Government has rights of first refusal with respect to
any of our shares to be sold by the fund. Although the fund’s shareholding may be considered to be beneficially owned by the Government under international standards, such shares
are not considered to be owned by the Government for the purposes of Thai law or our compliance with certain of our debt covenants 2 Based on data as of 30 September 2014/ THB/US$ exchange rate of 32.54
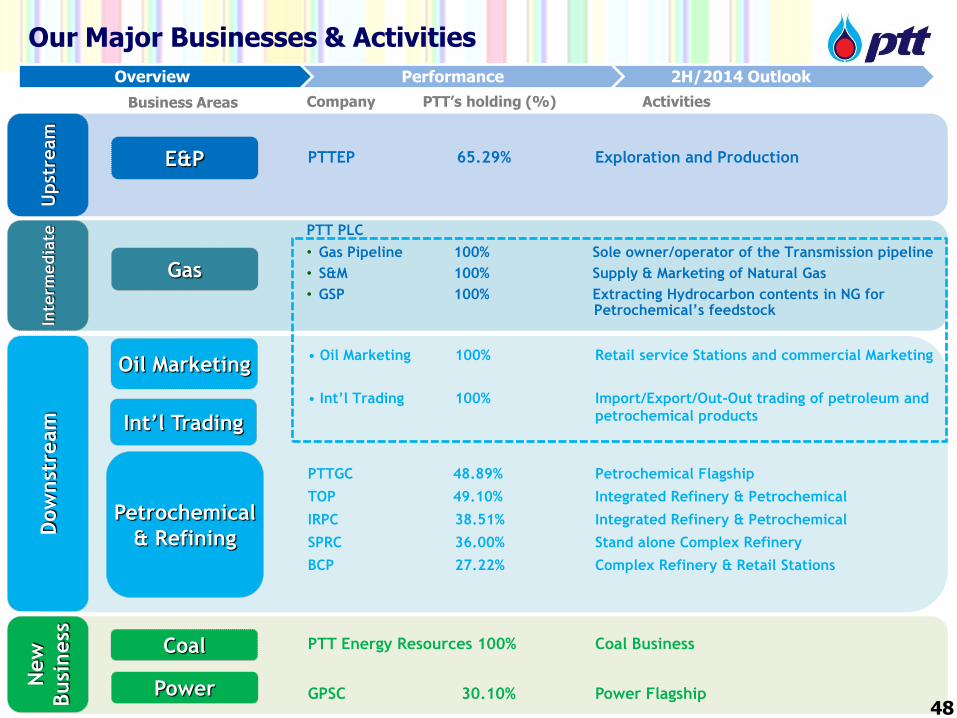
Our Major Businesses & Activities
E&P
Gas
PTTEP 65.29% Exploration and Production
Upst
ream
Oil Marketing
Int’l Trading
Dow
nst
ream
Petrochemical
& Refining
PTTGC 48.89% Petrochemical Flagship
TOP 49.10% Integrated Refinery & Petrochemical
IRPC 38.51% Integrated Refinery & Petrochemical
SPRC 36.00% Stand alone Complex Refinery
BCP 27.22% Complex Refinery & Retail Stations
New
Busi
ness
Coal PTT Energy Resources 100% Coal Business
GPSC 30.10% Power Flagship
• Oil Marketing 100% Retail service Stations and commercial Marketing
• Int’l Trading 100% Import/Export/Out-Out trading of petroleum and
petrochemical products
Inte
rmedia
te
PTT PLC
• Gas Pipeline 100% Sole owner/operator of the Transmission pipeline
• S&M 100% Supply & Marketing of Natural Gas
• GSP 100% Extracting Hydrocarbon contents in NG for Petrochemical’s feedstock
48
Business Areas Activities Company PTT’s holding (%)
Power
Overview Performance 2H/2014 Outlook
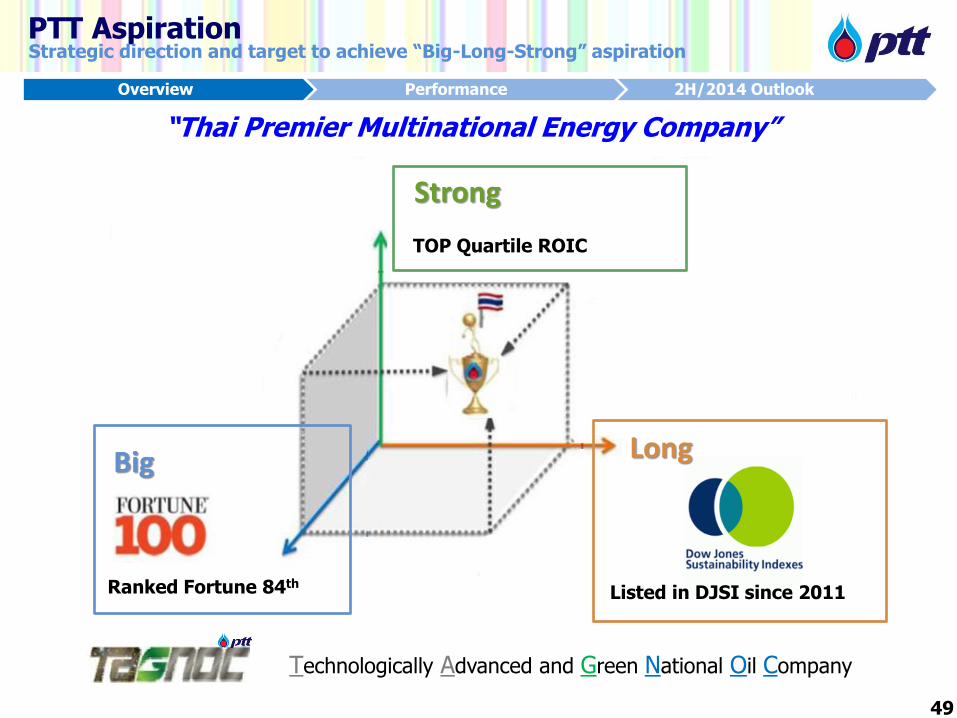
PTT Aspiration Strategic direction and target to achieve “Big-Long-Strong” aspiration
“Thai Premier Multinational Energy Company”
49
Strong
TOP Quartile ROIC
Listed in DJSI since 2011
Long
Ranked Fortune 84th
Big
Technologically Advanced and Green National Oil Company
Overview Performance 2H/2014 Outlook
50
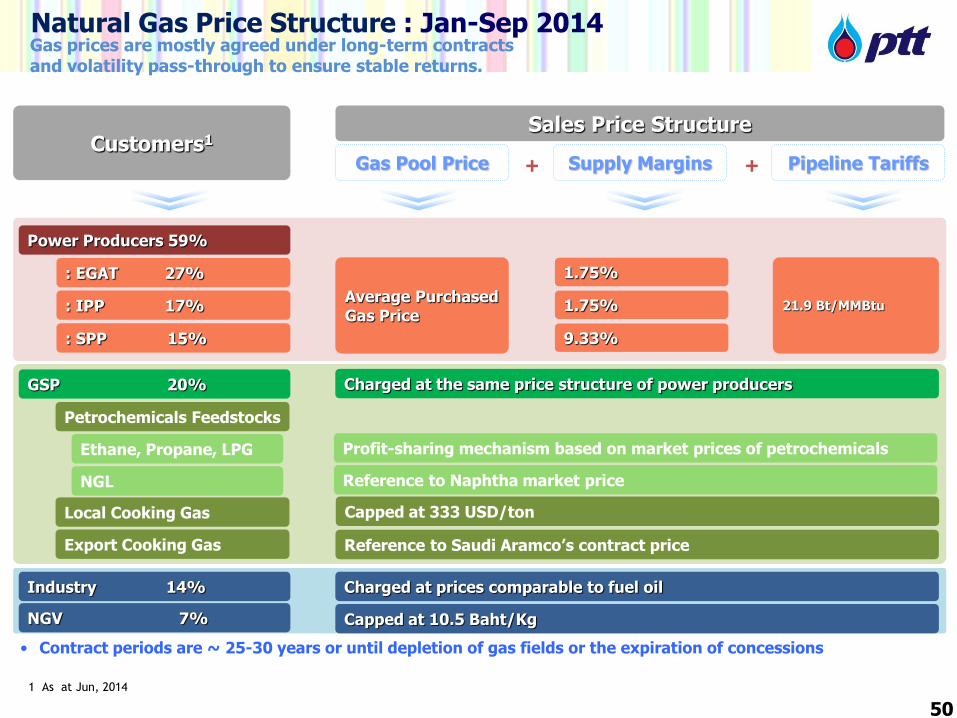
Natural Gas Price Structure : Jan-Sep 2014
Customers1 Sales Price Structure
Gas Pool Price Supply Margins Pipeline Tariffs + +
Power Producers 59%
: EGAT 27%
: IPP 17%
: SPP 15%
Average Purchased Gas Price
1.75%
1.75%
9.33%
21.9 Bt/MMBtu
GSP 20% Charged at the same price structure of power producers
Petrochemicals Feedstocks
Reference to Saudi Aramco’s contract price
Industry 14% Charged at prices comparable to fuel oil
Gas prices are mostly agreed under long-term contracts and volatility pass-through to ensure stable returns.
NGV 7% Capped at 10.5 Baht/Kg
Ethane, Propane, LPG Profit-sharing mechanism based on market prices of petrochemicals
NGL Reference to Naphtha market price
Local Cooking Gas
Export Cooking Gas
Capped at 333 USD/ton
• Contract periods are ~ 25-30 years or until depletion of gas fields or the expiration of concessions
1 As at Jun, 2014
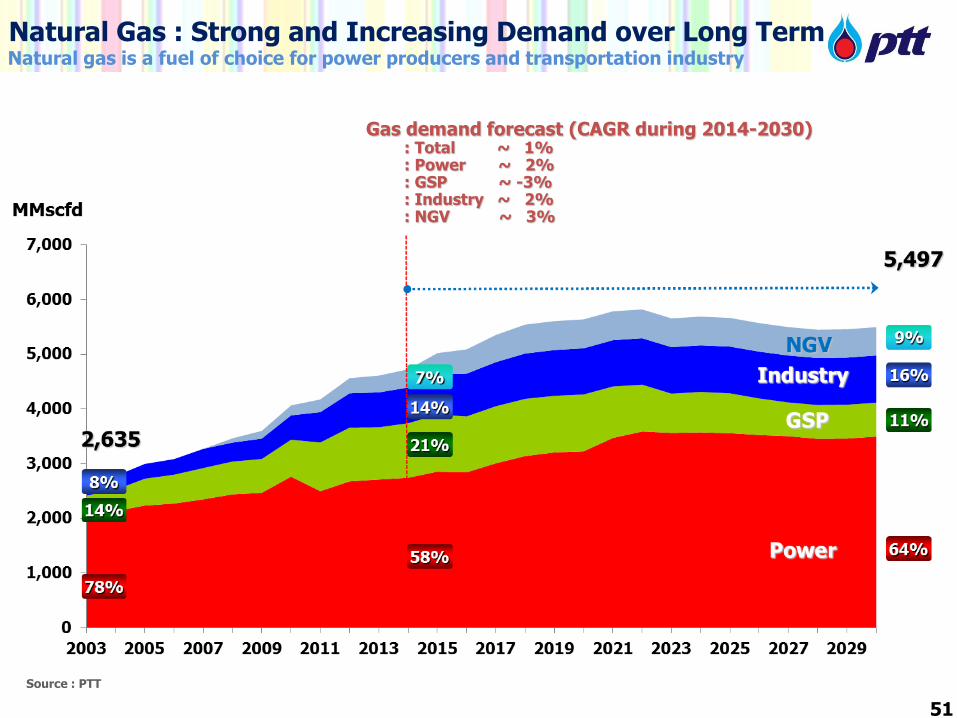
Natural Gas : Strong and Increasing Demand over Long Term Natural gas is a fuel of choice for power producers and transportation industry
51
Source : PTT
Gas demand forecast (CAGR during 2014-2030) : Total ~ 1% : Power ~ 2% : GSP ~ -3% : Industry ~ 2% : NGV ~ 3%
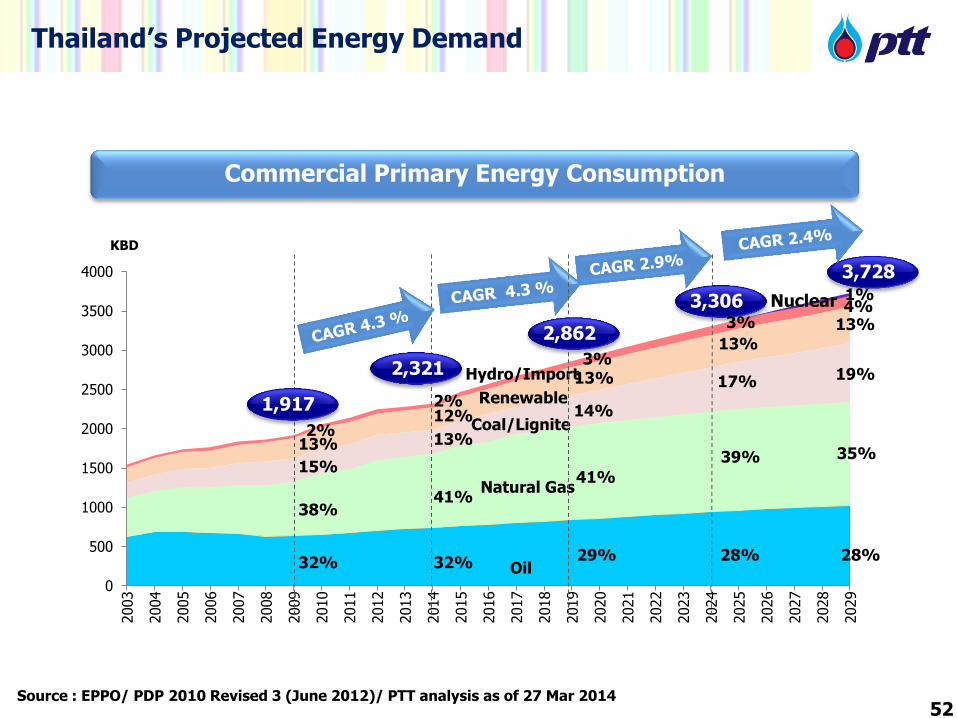
Thailand’s Projected Energy Demand
52
Commercial Primary Energy Consumption
Source : EPPO/ PDP 2010 Revised 3 (June 2012)/ PTT analysis as of 27 Mar 2014
0
500
1000
1500
2000
2500
3000
3500
4000
2003
2004
2005
2006
2007
2008
2009
2010
2011
2012
2013
2014
2015
2016
2017
2018
2019
2020
2021
2022
2023
2024
2025
2026
2027
2028
2029
32%
38%
15%
13%
Oil
Natural Gas
Coal/Lignite
Hydro/Import
KBD
28%
35%
19%
4% 13%
Renewable
2%
3,728
3,306
2,862
2,321
1,917
32%
41%
13%
12% 2%
28%
39%
17%
3%
13%
29%
41%
14%
3% 13%
1% Nuclear
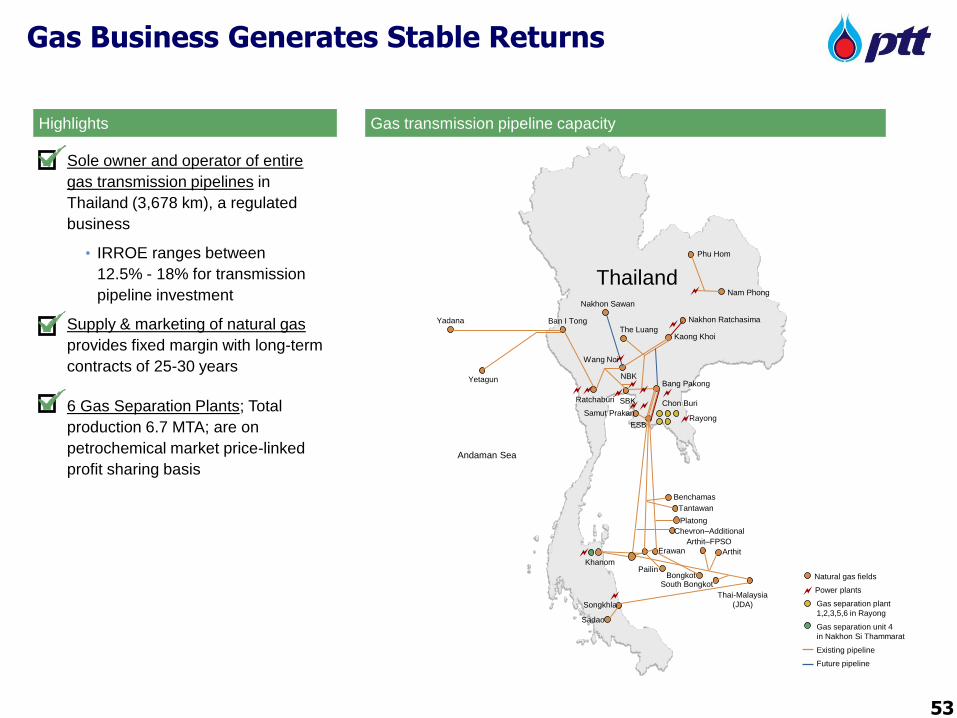
Gas Business Generates Stable Returns
Sole owner and operator of entire
gas transmission pipelines in
Thailand (3,678 km), a regulated
business
• IRROE ranges between
12.5% - 18% for transmission
pipeline investment
Supply & marketing of natural gas
provides fixed margin with long-term
contracts of 25-30 years
6 Gas Separation Plants; Total
production 6.7 MTA; are on
petrochemical market price-linked
profit sharing basis
Highlights Gas transmission pipeline capacity
Phu Hom
Nam Phong
Thailand
Ban I Tong
Ratchaburi
Nakhon Sawan
SBK
NBK
The Luang
Nakhon Ratchasima
Kaong Khoi
Samut Prakan
ESB
Bang Pakong
Khanom
Songkhla
Sadao
Yadana
Yetagun
Chon Buri
Rayong
Wang Noi
Thai-Malaysia
(JDA)
Arthit
Arthit–FPSO Erawan
Pailin Bongkot
South Bongkot
Chevron–Additional
Platong
Tantawan
Benchamas
Natural gas fields
Power plants Gas separation plant
1,2,3,5,6 in Rayong
Gas separation unit 4
in Nakhon Si Thammarat
Existing pipeline
Future pipeline
Andaman Sea
53