Embed Size (px)
Citation preview

ANALYST BRIEFING 2013
YBhg. Dato’ Sri Zukri Samat3 April 2013
Strictly Private & Confidential

Managing Director’s Office 2

Managing Director’s Office 3
Financial Highlights & Notable Achievements
FY2012

Finance Division 4
INCOME STATEMENT
* Restated arising from change in accounting policy on the determination of collective assessment allowance under MFRS 139

Finance Division 5
KEY BALANCE SHEET ITEMS
* Restated arising from adoption of MFRS
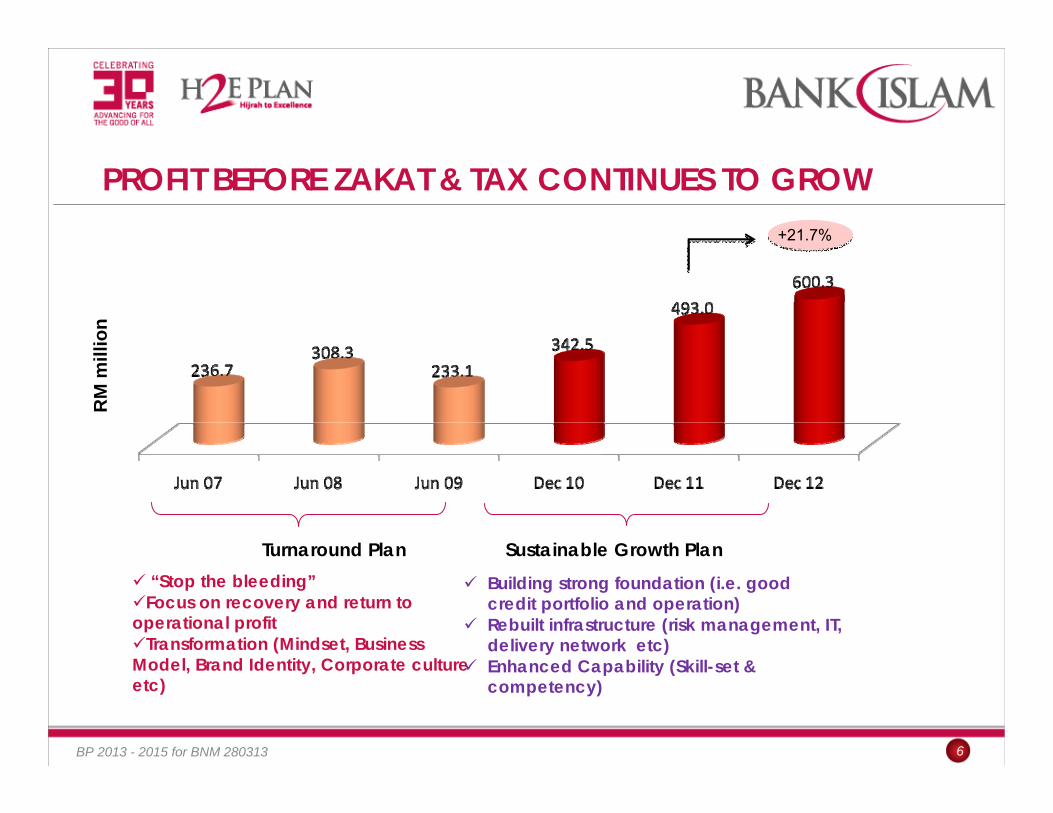
PROFIT BEFORE ZAKAT & TAX CONTINUES TO GROW
6
Turnaround Plan Sustainable Growth Plan“Stop the bleeding”
Focus on recovery and return to operational profit
Transformation (Mindset, Business Model, Brand Identity, Corporate culture etc)
Building strong foundation (i.e. good credit portfolio and operation)Rebuilt infrastructure (risk management, IT, delivery network etc)Enhanced Capability (Skill-set & competency)
RM
mill
ion
BP 2013 - 2015 for BNM 280313
+21.7%

TOTAL ASSETS : CAGR OF 12.1% OVER THE LAST 5 YEARS
7
Turnaround Plan Sustainable Growth PlanRecapitalisationBalance Sheet RestructuringRejuvenate Bank Islam brand
Robust Risk ManagementOptimising Balance Sheet Mix
RM
mill
ion
BP 2013 - 2015 for BNM 280313
+16.2%

TOTAL ASSETS: BENCHMARKED AGAINST OTHER ISLAMIC BANKS
Managing Director’s Office 8
Islamic Banking Assets (excluding DFIs) forms
20.0% of Banking System.Growth of 13.9% to
RM381.5b.
22.3%RM81.3b
12.8%RM46.6b
9.8%RM35.6b
8.3%RM30.3b
7.8%RM28.3b
22.1%RM74.0b
12.9%RM43.1b
9.6%RM32.2b
8.8%RM29.4b
6.7%RM22.4b
@ Dec 11
^Based on best proxy per Islamic banking operations disclosure in the audited account of the conventional banking group
@ Sept 12
Market Share
24.4%RM92.9b
15.4%RM58.9b
9.8%RM37.5b
7.7%RM29.3b
7.8%RM29.6b
@ Dec 12^
24.4%RM92.9b
15.4%RM58.9b
9.8%RM37.5b
7.8%RM29.6b
7.7%RM29.3b

NET FINANCING GREW BY 37.8% IN FY2012
9
…still primarily a retail bank
“Putting the House in Order”Revamp Business Model
Risk based Target MarketFocus on Secured Financing
RM
mill
ion
Gross Financing by Business Unit
3,696.6 (62.7)641.3 1,110.0
BP 2013 - 2015 for BNM 280313
+37.8%
Managing Director’s Office 10
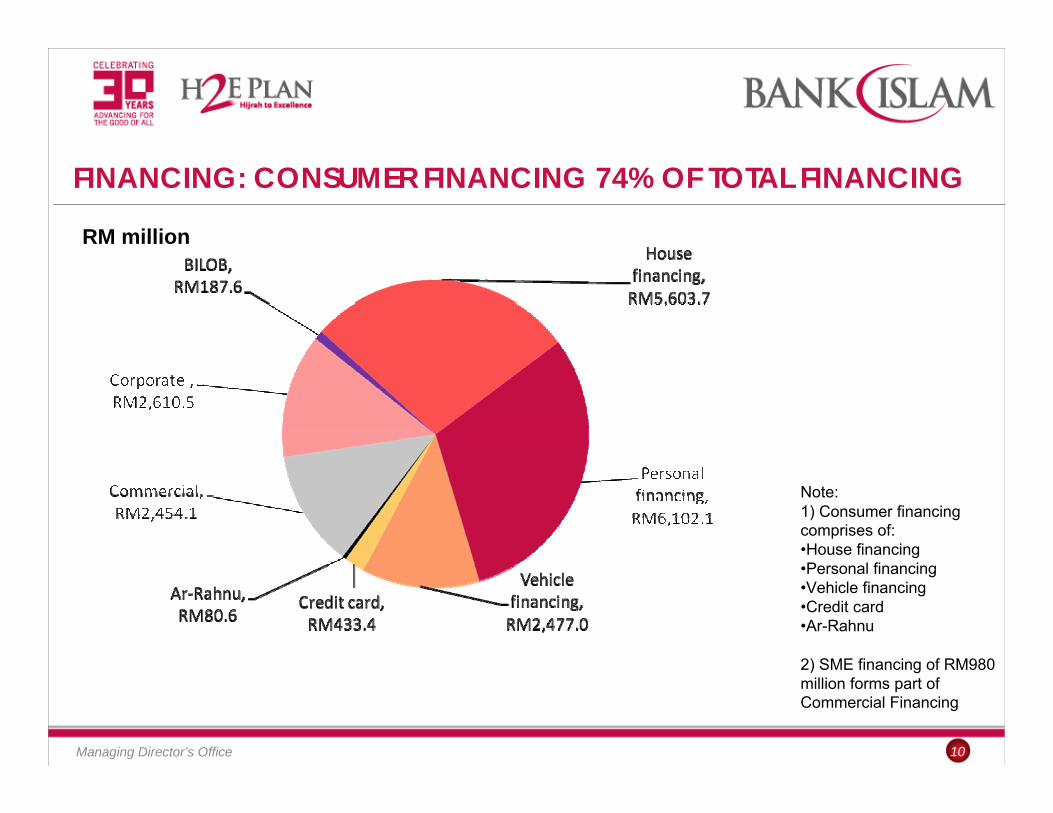
FINANCING: CONSUMER FINANCING 74% OF TOTAL FINANCING
RM million
Note:1) Consumer financing comprises of:•House financing•Personal financing•Vehicle financing•Credit card•Ar-Rahnu
2) SME financing of RM980 million forms part of Commercial Financing

CONSUMER FINANCING DRIVEN BY PERSONAL & HOUSE FINANCING
11
27%
19%
13%
2%
62%
23%
17%
-4%100%
• Consumer banking (74% of total financing). • Personal financing and HFA contributes42% and 38% of consumer banking respectively.

PACKAGE EMPLOYERS : GLCS & NON- GLCS
Managing Director’s Office 12
…about 51% of Consumer Banking
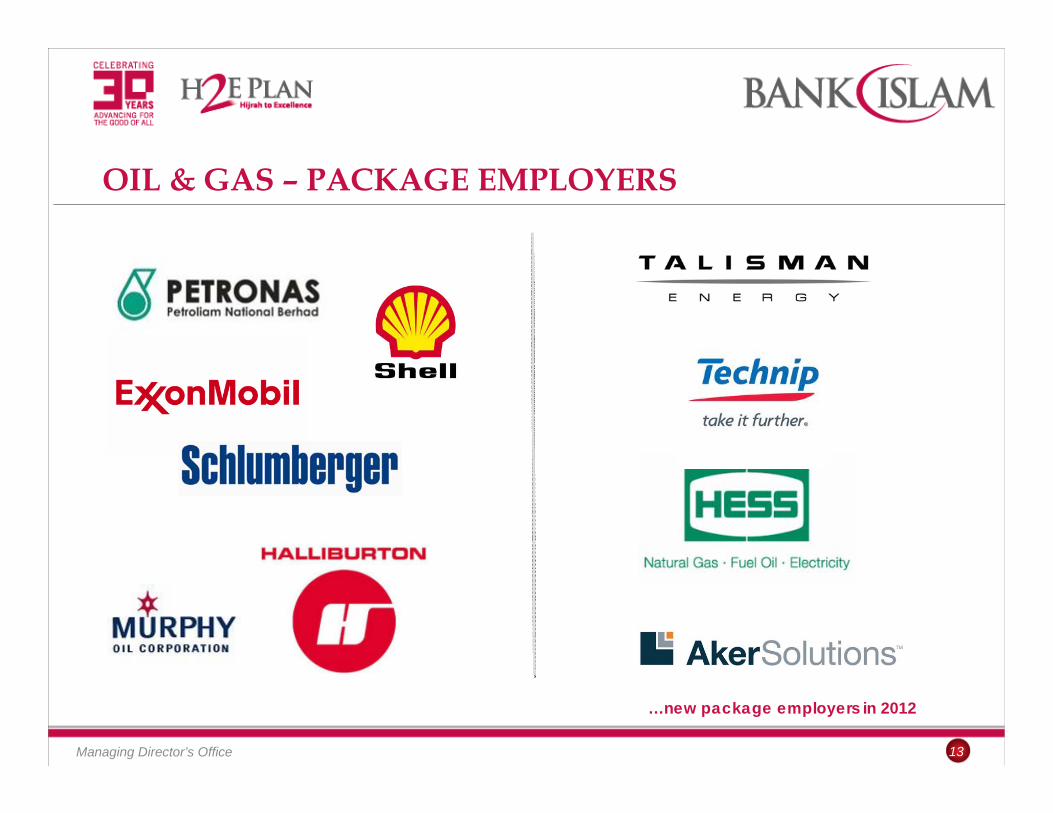
OIL & GAS – PACKAGE EMPLOYERS
Managing Director’s Office 13
…new package employers in 2012

KEY EXPOSURE TO ETP PROJECTS
Managing Director’s Office 14
Oil, Gas & Energy
Education
Palm Oil
Healthcare
Greater Kuala Lumpur
About RM350 million About RM5 billion
About RM4.5 billion
About RM500 million

NET FINANCING: BENCHMARKED AGAINST OTHER ISLAMIC BANKS
Managing Director’s Office 15
25.2%RM56.2b
14.1%RM31.4b
8.8%RM19.6b
8.7%RM19.5b
8.1%RM18.2b
25.4%RM49.9b
14.3%RM28.1b
7.8%RM15.3b
9.7%RM19.2b
7.2%RM14.2b
@ Dec 11@ Sept 12Market Share
26.7%RM62.2b
15.5%RM36.0b
8.6%RM19.9b
8.7%RM20.2b
8.4%RM19.5b
@ Dec12^
Islamic Banking Financing (excluding DFIs) forms
21.1% of Banking System.Growth of 16.2% to
RM232.8b.
^Based on best proxy per Islamic banking operations disclosure in the audited account of the conventional banking group
26.7%RM62.2b
15.5%RM36.0b 8.7%
RM20.2b 8.6%RM19.9b
8.4%RM19.5b

ASSET QUALITY CONTINUES TO IMPROVE
16
RM million Dec 10* Mar 11* June 11* Sept 11* Dec 11* Mar 12 June 12 Sept 12 Dec 12
Gross Impaired Financing 552 551 556 551 380 351 331 322 309Gross Financing 12,283 12,855 13,253 13,740 14,564 15,327 16,828 18,571 19,949
Individual Assessment 79 88 79 108 76 72 72 72 127Collective Assessment 347 342 349 338 328 341 345 348 313
Net Impaired Financing 126 121 128 105 (24) (62) (86) (98) (132)
Gross Impaired Financing Ratio 4.50% 4.29% 4.19% 4.01% 2.61% 2.29% 1.97% 1.74% 1.55%Net Impaired Financing Ratio 1.06% 0.98% 0.99% 0.79% -0.17% -0.42% -0.53% -0.54% -0.67%
* Restated arising from change in accounting policy on the determination of collective assessment allowance under MFRS 139
BP 2013 - 2015 for BNM 280313
Impaired financing

STRONG CUSTOMER DEPOSITS GROWTH OF 15.1% IN FY2012
17
Growth+ 15.1%
of which Al-Awfar
7032.5%
of which Al-Awfar
1120.4%
of which Al-Awfar1,1213.6%
of which Al-Awfar
1090.4%
BP 2013 - 2015 for BNM 280313
RM
mill
ion

CASA DEPOSITS RATIO REMAINS STABLE
18
RM million Dec 2011 Dec 2012Islamic Banking Industry as at
Dec 2012
Banking System as at Dec 2012
Total CASA 12.3 13.4 82.6 363.1
% of Total Deposits 43.4% 41.2% 26.9% 25.7%
Non CASA RM16,022m
CASA RM12,283m
Demand RM8,420m
Savings Mudharabah RM1,264m
CASA – RM13,426.1mNon CASA – RM19,157.1m
Demand RM8,968.6m
Savings Mudharabah RM1,942.2m
Savings Non-Mudharabah RM2,515.3m
…continues to focus on cheaper funds
BP 2013 - 2015 for BNM 280313

CASA GREW DESPITE INTENSE COMPETITION
19
RM’m
illio
n
… stiff competition ahead
BP 2013 - 2015 for BNM 280313

TOTAL CASA: BENCHMARKED AGAINST OTHER ISLAMIC BANKS
Managing Director’s Office 20
27.7%RM21.4b
15.8%RM12.2b
10.8%RM8.3b
9.4%RM7.2b
6.5%RM5.0b
24.8%RM16.6b
18.4%RM12.3b
10.4%RM6.9b
10.0%RM6.7b
5.6%RM3.7b
@ Dec 11@ Sept 12
Market Share
28.6%RM23.6b
16.3%RM13.4b
12.2%RM10.0b
8.7%RM7.2b
6.5%RM5.3b
@ Dec 12^
^Based on best proxy per Islamic banking operations disclosure in the audited account of the conventional banking group
28.6%RM23.6b
16.3%RM13.4b 12.2%
RM10.0b 8.7%RM7.2b 6.5%
RM5.3b
Islamic Banking CASA (excluding DFIs) forms
22.4% of Banking System.Growth of 15.4% to
RM77.0b.

TOTAL DEPOSITS: BENCHMARKED AGAINST OTHER ISLAMIC BANKS
Managing Director’s Office 21
20.7%RM59.1b
10.8%RM31.0b
10.7%RM30.7b
8.5%RM24.4b
7.2%RM20.7b
22.1%RM58.7b
10.6%RM28.3b
11.0%RM29.2b
7.5%RM20.0b
6.4%RM17.0b
@ Dec 11@ Sept 12
Market Share
23.3%RM71.3b
10.6%RM32.6b
12.7%RM38.9b
7.7%RM23.7b
7.1%RM21.7b
@ Dec12^
^Based on best proxy per Islamic banking operations disclosure in the audited account of the conventional banking group
23.3%RM71.3b
12.7%RM38.9b
10.6%RM32.6b 7.7%
RM23.7b7.1%
RM21.7b
Islamic Banking Deposits (excluding DFIs) forms
21.8% of Banking System.Growth of 15.1% to RM306.5b.

INCREASING TREND FOR AVERAGE YIELD ON TOTAL ASSETS
Managing Director’s Office 22

AVERAGE COST OF DEPOSITS INCREASED TOO
Managing Director’s Office 23

NET INCOME SPREAD (NIM) IMPROVED FROM 3.17% TO 3.25% YOY
Managing Director’s Office 24
…drop in net income spread in Q4 was mainly due to the Bank’s strategy to drive deposits and defend its market position.
…however continued financing growth has mitigated NIM erosion YoY.

KEY FINANCIAL RATIOS
25
AuditedFY
June 07
AuditedFY
June 08
Audited FY
June 09
ActualFYE Dec 2010**
Audited FYDec 11 **
Actual Dec 12
IslamicBanking System
Banking System
PROFITABILITY
Return on equity (%) – based on PBT 23.3% 26.5% 16.5% 14.4% 18.5% 20.4% ^ 19.6% * 17.5% *
Return on assets (%) – based on PBT 1.4% 1.5% 0.9% 1.2% 1.6% 1.7% ^ 1.4% * 1.6% *
Cost Income Ratio (%) 68.2% 60.8% 56.7% 55.4% 53.8% 51.4% 46.1% * 46.6% *
Non-Fund Based Income Ratio (%) 9.0% 7.8% 10.3% 10.8% 13.8% 13.5% 11.0% * 19.6% *
ASSET QUALITY
Gross Non-Performing/Impaired Financing Ratio (%) 24.7% 21.2% 16.4% 4.5% 2.6% 1.6% 1.6% # 2.0 % #
Net Non-Performing/Impaired Financing Ratio - Less IA & CA (%) 11.4% 7.8% 6.7% 1.1% -0.2% -0.7% -0.3% # -0.02% #
Financing Loss Coverage Ratio (%) 67.7% 75.8% 80.8% 77.2% 106.2% 142.6% 119.3% # 100.9% #
EFFICIENCY
Financing to Deposits (%) 57.6% 52.0% 43.5% 45.7% 51.5% 61.2% 77.2% # 78.7% #
CAPITALISATION
RWCR (%) – before proposed dividend 12.0% 12.9% 13.6% 16.8% 16.9% 14.1% 14.3% *
# 15.2% *#
^ Annualised * Bank Negara Malaysia Annual Report 2012 # Bank Negara Malaysia Monthly Statistical Bulletin @ Dec 2012 ** Restated arising from adoption of MFRS
…healthy capitalisation
…financing-to deposit ratio inching closer to optimum level
…cost income ratio continue to trend downwards
…commendable post 2006 asset quality
BP 2013 - 2015 for BNM 280313

FRANCHISE DEVELOPMENT – BRANCH NETWORK
Managing Director’s Office 26
Perlis - 1
Kedah - 10
Kelantan - 11Pulau Pinang - 5
Perak - 9
Pahang - 9
Terengganu - 5
Selangor – 25Kuala Lumpur - 17
NegeriSembilan -5
Melaka - 4
Johor - 14
Sarawak - 6
Sabah - 5
Labuan- 1
Region Total
Central 42
Northern 25
Eastern 25
Southern 23
East Malaysia 12
Total 127…127 branches as at end of 2012… 6 new branches in 2013 (Sungai Buloh, Bukit Indah (JB), Bandar Baru Tunjung (Kelantan) Sungai Petani (Kedah), Tabung Haji Convention Centre Sepang, & Senawang (N. Sembilan)

Managing Director’s Office 27
New Corporate Plan for 2013-2015
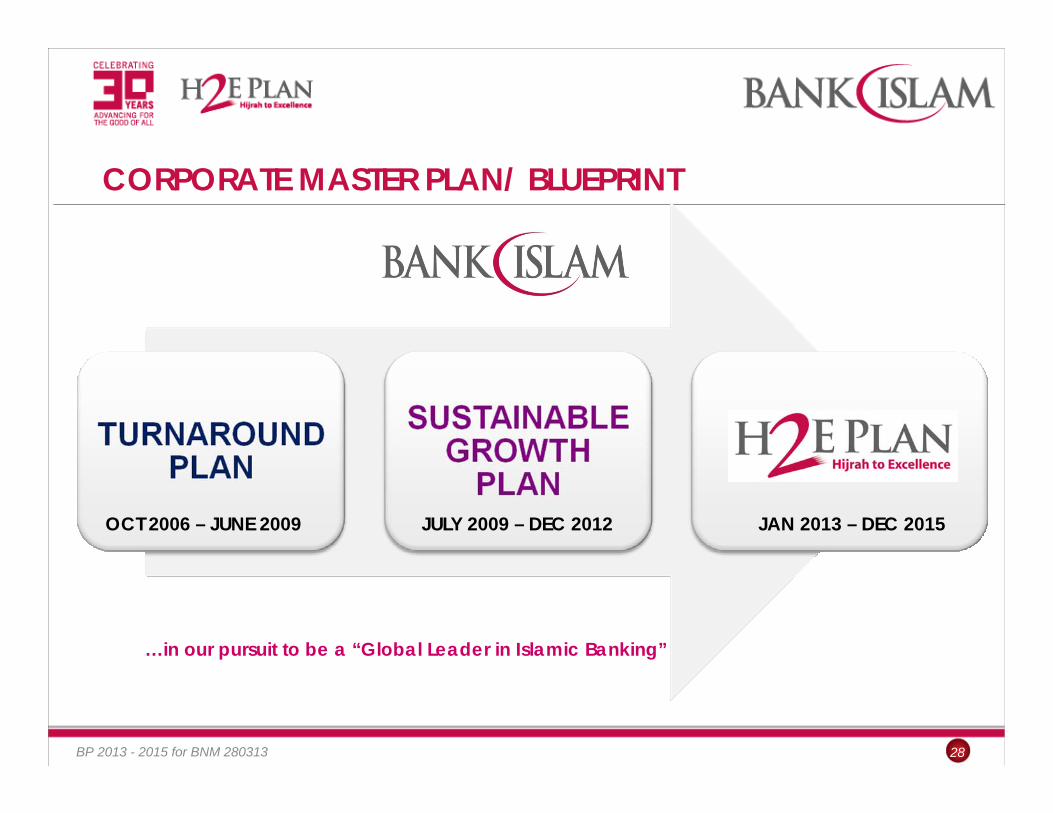
CORPORATE MASTER PLAN/ BLUEPRINT
BP 2013 - 2015 for BNM 280313
OCT 2006 – JUNE 2009 JULY 2009 – DEC 2012
…in our pursuit to be a “Global Leader in Islamic Banking”
JAN 2013 – DEC 2015
28

SIX PILLARS OF H2E PLAN
BP 2013 - 2015 for BNM 280313
Robust Organic Growth
Service Excellence
Shariah-led Innovation
Resource Optimisation
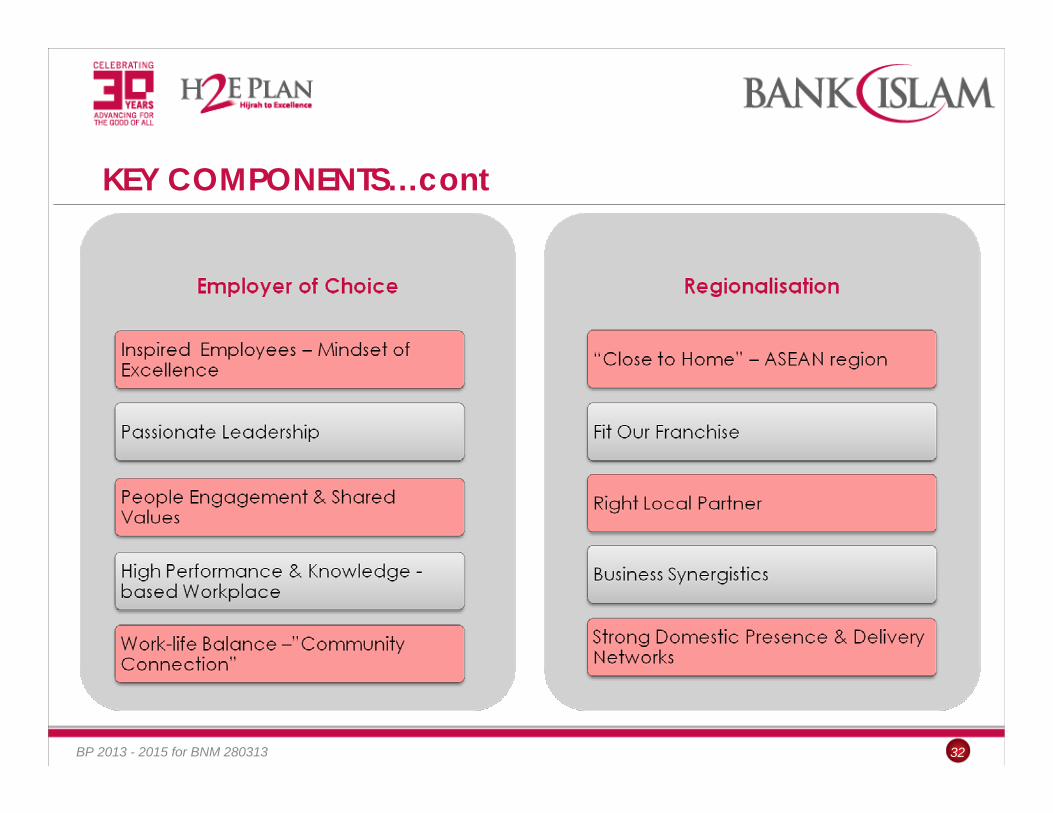
Employer of Choice
Regionalisation
29
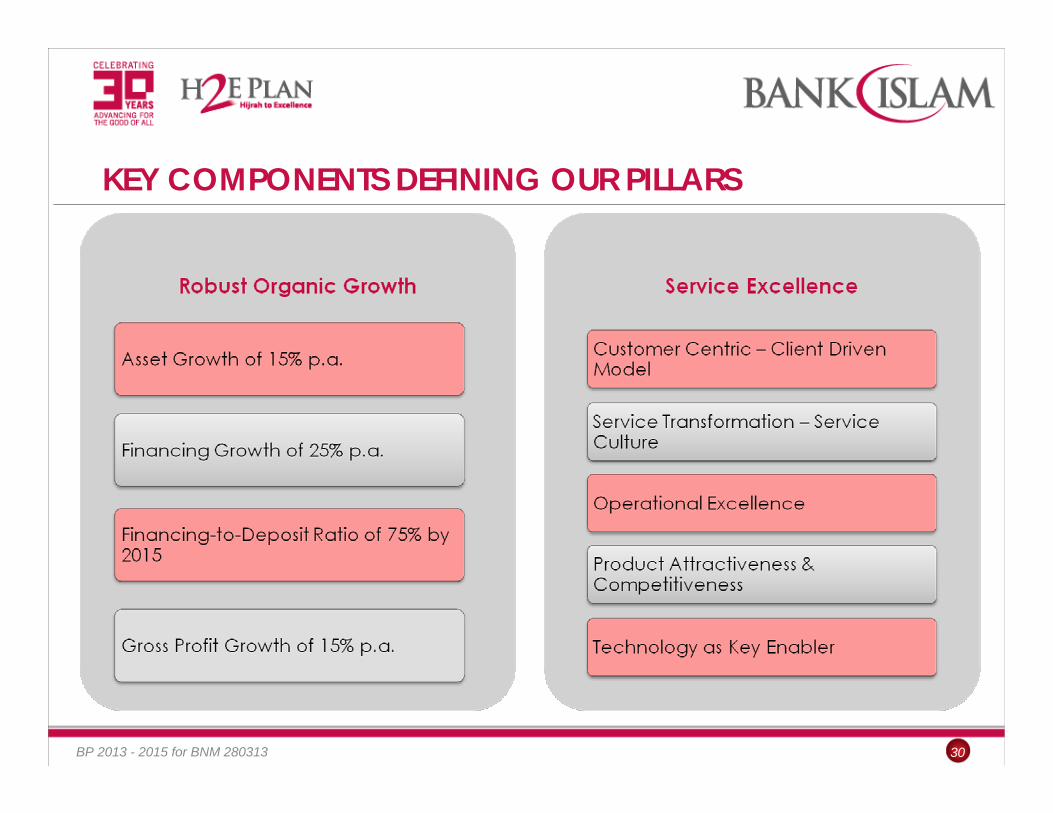
KEY COMPONENTS DEFINING OUR PILLARS
BP 2013 - 2015 for BNM 280313 30

KEY COMPONENTS…cont
BP 2013 - 2015 for BNM 280313 31
KEY COMPONENTS…cont
BP 2013 - 2015 for BNM 280313 32

Managing Director’s Office 33
Outlook

ISLAMIC BANKING: MOVING FORWARD
BP 2013 - 2015 for BNM 280313 34
Opportunities Challenges
www.bankislam.com.my
Managing Director’s Office 35
& Thank You
شكرا جزيال شكرا جزيال
Disclaimer: This presentation material has been prepared by Bank Islam Malaysia Berhad (the Bank”) for information purposes only and does not purport to contain all the information that may be required to evaluate the Bank or its financial position. No
representation or warranty, express r implied, is given by or on behalf of the Bank as to the accuracy of the information or opinions contained in this presentation. The presentation does not constitute or form part of an offer, solicitation or invitation of any offer, to buy or subscribe for any securities , nor should it or any part of it form the basis of, or be relied in any connection with, any contract, investment decision or commitment whatsoever. The Bank does not accept any liability whatsoever for any loss howsoever arising
from any use of this presentation or their contents or otherwise arising in connection therewith.