Embed Size (px)
Citation preview
MEDIOBANCA
1Q/3M RESULTS AS AT
30 SEPTEMBER 2021
Milan, 27 October 2021

Agenda
Section 1. Executive summary
Section 2. 1Q Group results
Section 3. Divisional results
Section 4. Closing remarks
Annexes
1. Divisional results by quarter
2. Glossary
3
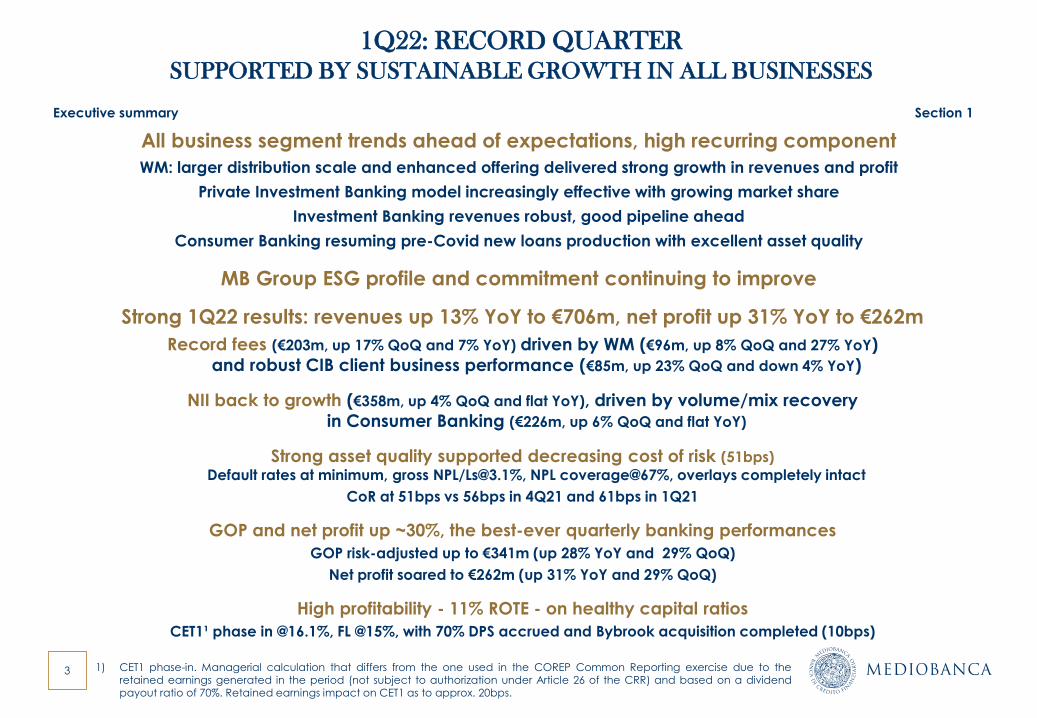
1Q22: RECORD QUARTER
SUPPORTED BY SUSTAINABLE GROWTH IN ALL BUSINESSES
Strong 1Q22 results: revenues up 13% YoY to €706m, net profit up 31% YoY to €262m
Record fees (€203m, up 17% QoQ and 7% YoY) driven by WM (€96m, up 8% QoQ and 27% YoY)
and robust CIB client business performance (€85m, up 23% QoQ and down 4% YoY)
NII back to growth (€358m, up 4% QoQ and flat YoY), driven by volume/mix recovery
in Consumer Banking (€226m, up 6% QoQ and flat YoY)
Strong asset quality supported decreasing cost of risk (51bps)
Default rates at minimum, gross NPL/[email protected]%, NPL coverage@67%, overlays completely intact
CoR at 51bps vs 56bps in 4Q21 and 61bps in 1Q21
GOP and net profit up ~30%, the best-ever quarterly banking performances
GOP risk-adjusted up to €341m (up 28% YoY and 29% QoQ)
Net profit soared to €262m (up 31% YoY and 29% QoQ)
High profitability - 11% ROTE - on healthy capital ratios
CET1¹ phase in @16.1%, FL @15%, with 70% DPS accrued and Bybrook acquisition completed (10bps)
All business segment trends ahead of expectations, high recurring component
WM: larger distribution scale and enhanced offering delivered strong growth in revenues and profit
Private Investment Banking model increasingly effective with growing market share
Investment Banking revenues robust, good pipeline ahead
Consumer Banking resuming pre-Covid new loans production with excellent asset quality
MB Group ESG profile and commitment continuing to improve
Executive summary Section 1
1) CET1 phase-in. Managerial calculation that differs from the one used in the COREP Common Reporting exercise due to theretained earnings generated in the period (not subject to authorization under Article 26 of the CRR) and based on a dividendpayout ratio of 70%. Retained earnings impact on CET1 as to approx. 20bps.
4
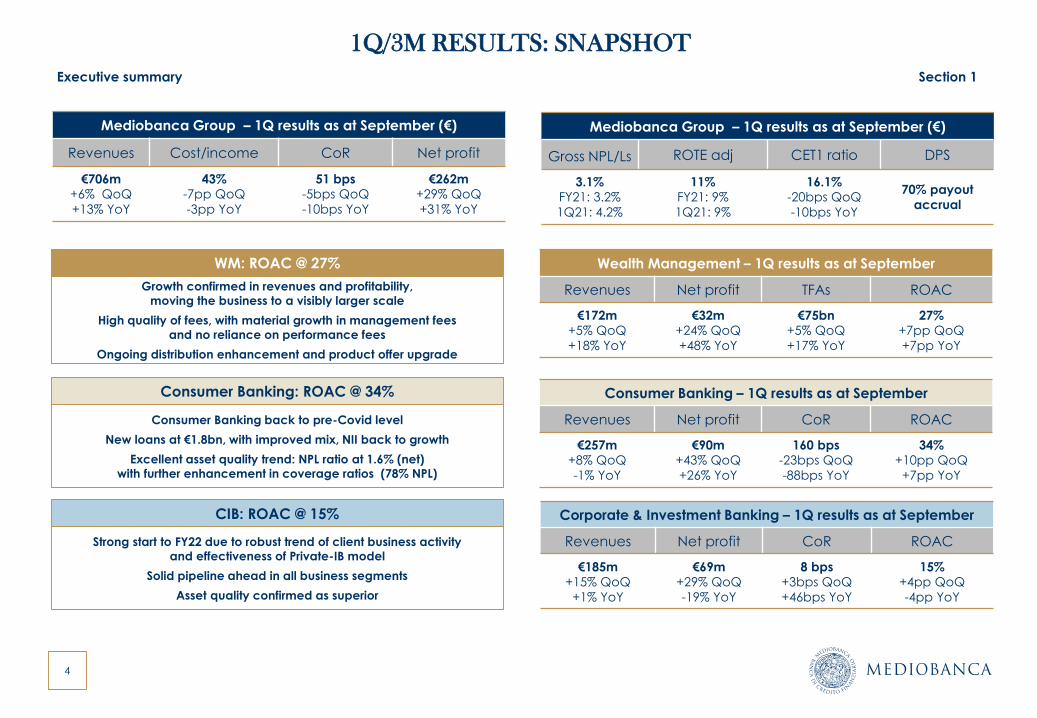
1Q/3M RESULTS: SNAPSHOT
WM: ROAC @ 27%
Consumer Banking: ROAC @ 34%
CIB: ROAC @ 15%
Mediobanca Group – 1Q results as at September (€)
Revenues Cost/income CoR Net profit
€706m+6% QoQ
+13% YoY
43%-7pp QoQ
-3pp YoY
51 bps-5bps QoQ
-10bps YoY
€262m+29% QoQ
+31% YoY
Wealth Management – 1Q results as at September
Revenues Net profit TFAs ROAC
€172m+5% QoQ
+18% YoY
€32m+24% QoQ
+48% YoY
€75bn+5% QoQ
+17% YoY
27%+7pp QoQ
+7pp YoY
Consumer Banking – 1Q results as at September
Revenues Net profit CoR ROAC
€257m+8% QoQ
-1% YoY
€90m+43% QoQ
+26% YoY
160 bps-23bps QoQ
-88bps YoY
34%+10pp QoQ
+7pp YoY
Corporate & Investment Banking – 1Q results as at September
Revenues Net profit CoR ROAC
€185m+15% QoQ
+1% YoY
€69m+29% QoQ
-19% YoY
8 bps+3bps QoQ
+46bps YoY
15%+4pp QoQ
-4pp YoY
Growth confirmed in revenues and profitability,
moving the business to a visibly larger scale
High quality of fees, with material growth in management fees
and no reliance on performance fees
Ongoing distribution enhancement and product offer upgrade
Consumer Banking back to pre-Covid level
New loans at €1.8bn, with improved mix, NII back to growth
Excellent asset quality trend: NPL ratio at 1.6% (net)
with further enhancement in coverage ratios (78% NPL)
Strong start to FY22 due to robust trend of client business activity
and effectiveness of Private-IB model
Solid pipeline ahead in all business segments
Asset quality confirmed as superior
Executive summary Section 1
Mediobanca Group – 1Q results as at September (€)
Gross NPL/Ls ROTE adj CET1 ratio DPS
3.1%FY21: 3.2%
1Q21: 4.2%
11%FY21: 9%
1Q21: 9%
16.1%-20bps QoQ
-10bps YoY
70% payout
accrual
Agenda
Section 1. Executive summary
Section 2. 1Q Group results
Section 3. Divisional results
Section 4. Closing remarks
Annexes
1. Divisional results by quarter
2. Glossary
6
1Q22 RESULTS: REVENUES UP 13% TO €706m
NET PROFIT UP 31% TO €262m, ROTE 11%
Financial results Highlights
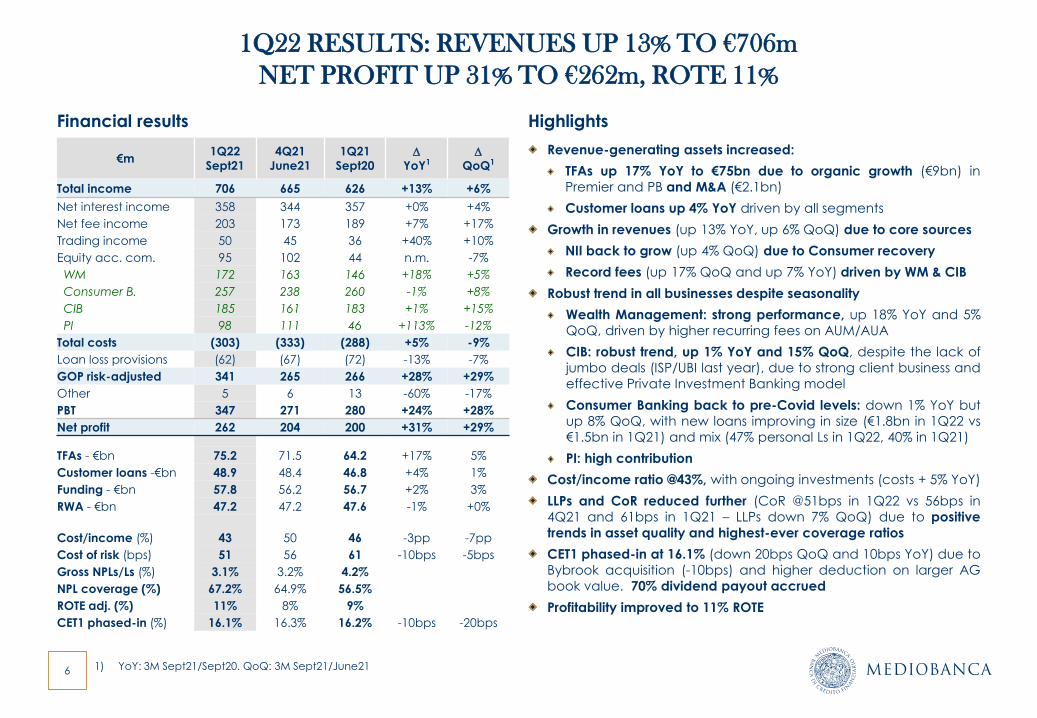
Revenue-generating assets increased:
TFAs up 17% YoY to €75bn due to organic growth (€9bn) in
Premier and PB and M&A (€2.1bn)
Customer loans up 4% YoY driven by all segments
Growth in revenues (up 13% YoY, up 6% QoQ) due to core sources
NII back to grow (up 4% QoQ) due to Consumer recovery
Record fees (up 17% QoQ and up 7% YoY) driven by WM & CIB
Robust trend in all businesses despite seasonality
Wealth Management: strong performance, up 18% YoY and 5%
QoQ, driven by higher recurring fees on AUM/AUA
CIB: robust trend, up 1% YoY and 15% QoQ, despite the lack of
jumbo deals (ISP/UBI last year), due to strong client business and
effective Private Investment Banking model
Consumer Banking back to pre-Covid levels: down 1% YoY but
up 8% QoQ, with new loans improving in size (€1.8bn in 1Q22 vs
€1.5bn in 1Q21) and mix (47% personal Ls in 1Q22, 40% in 1Q21)
PI: high contribution
Cost/income ratio @43%, with ongoing investments (costs + 5% YoY)
LLPs and CoR reduced further (CoR @51bps in 1Q22 vs 56bps in
4Q21 and 61bps in 1Q21 – LLPs down 7% QoQ) due to positive
trends in asset quality and highest-ever coverage ratios
CET1 phased-in at 16.1% (down 20bps QoQ and 10bps YoY) due to
Bybrook acquisition (-10bps) and higher deduction on larger AG
book value. 70% dividend payout accrued
Profitability improved to 11% ROTE
1) YoY: 3M Sept21/Sept20. QoQ: 3M Sept21/June21
€m 1Q22
Sept21
4Q21
June21
1Q21
Sept20D
YoY1D
QoQ1
Total income 706 665 626 +13% +6%
Net interest income 358 344 357 +0% +4%
Net fee income 203 173 189 +7% +17%
Trading income 50 45 36 +40% +10%
Equity acc. com. 95 102 44 n.m. -7%
WM 172 163 146 +18% +5%
Consumer B. 257 238 260 -1% +8%
CIB 185 161 183 +1% +15%
PI 98 111 46 +113% -12%
Total costs (303) (333) (288) +5% -9%
Loan loss provisions (62) (67) (72) -13% -7%
GOP risk-adjusted 341 265 266 +28% +29%
Other 5 6 13 -60% -17%
PBT 347 271 280 +24% +28%
Net profit 262 204 200 +31% +29%
TFAs - €bn 75.2 71.5 64.2 +17% 5%
Customer loans -€bn 48.9 48.4 46.8 +4% 1%
Funding - €bn 57.8 56.2 56.7 +2% 3%
RWA - €bn 47.2 47.2 47.6 -1% +0%
Cost/income (%) 43 50 46 -3pp -7pp
Cost of risk (bps) 51 56 61 -10bps -5bps
Gross NPLs/Ls (%) 3.1% 3.2% 4.2%
NPL coverage (%) 67.2% 64.9% 56.5%
ROTE adj. (%) 11% 8% 9%
CET1 phased-in (%) 16.1% 16.3% 16.2% -10bps -20bps
7
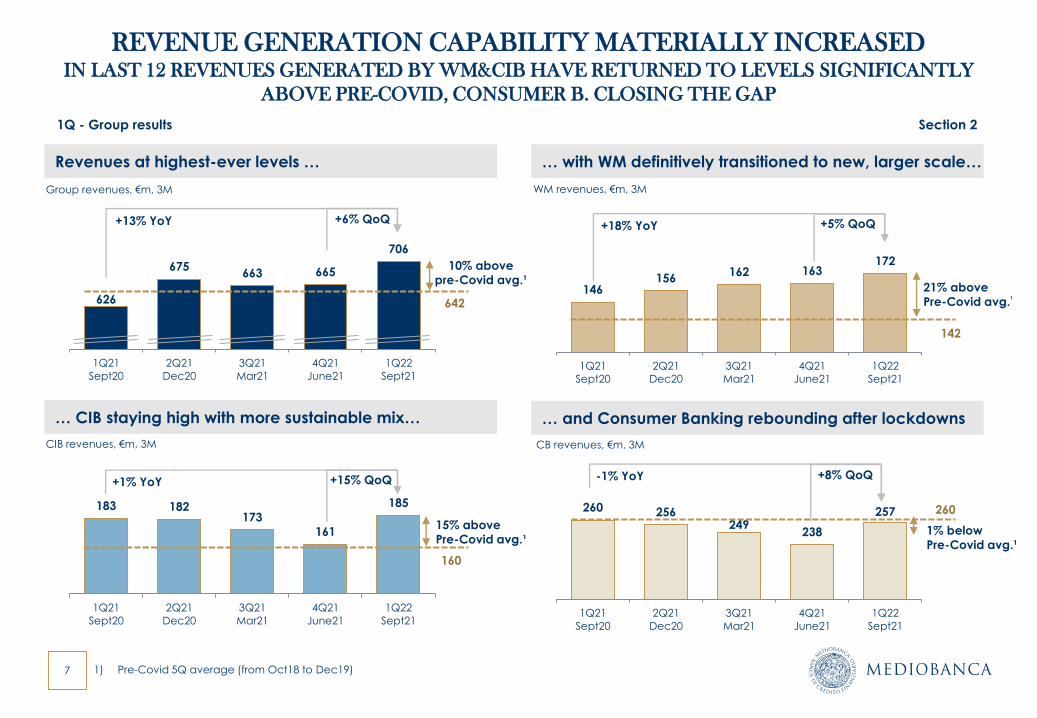
REVENUE GENERATION CAPABILITY MATERIALLY INCREASED IN LAST 12 REVENUES GENERATED BY WM&CIB HAVE RETURNED TO LEVELS SIGNIFICANTLY
ABOVE PRE-COVID, CONSUMER B. CLOSING THE GAP
Revenues at highest-ever levels …
626
675663 665
706
1Q21
Sept20
2Q21
Dec20
3Q21
Mar21
4Q21
June21
1Q22
Sept21
1) Pre-Covid 5Q average (from Oct18 to Dec19)
146156
162 163172
1Q21
Sept20
2Q21
Dec20
3Q21
Mar21
4Q21
June21
1Q22
Sept21
183 182173
161
185
1Q21
Sept20
2Q21
Dec20
3Q21
Mar21
4Q21
June21
1Q22
Sept21
260 256249
238
257
1Q21
Sept20
2Q21
Dec20
3Q21
Mar21
4Q21
June21
1Q22
Sept21
10% above
pre-Covid avg.¹
1Q - Group results Section 2
… with WM definitively transitioned to new, larger scale…
… CIB staying high with more sustainable mix… … and Consumer Banking rebounding after lockdowns
642
+6% QoQ+13% YoY
21% above
Pre-Covid avg.¹
142
+18% YoY +5% QoQ
15% above
Pre-Covid avg.¹
+15% QoQ+1% YoY
160
1% below
Pre-Covid avg.¹
260
Group revenues, €m, 3M WM revenues, €m, 3M
CIB revenues, €m, 3M CB revenues, €m, 3M
+8% QoQ-1% YoY
8
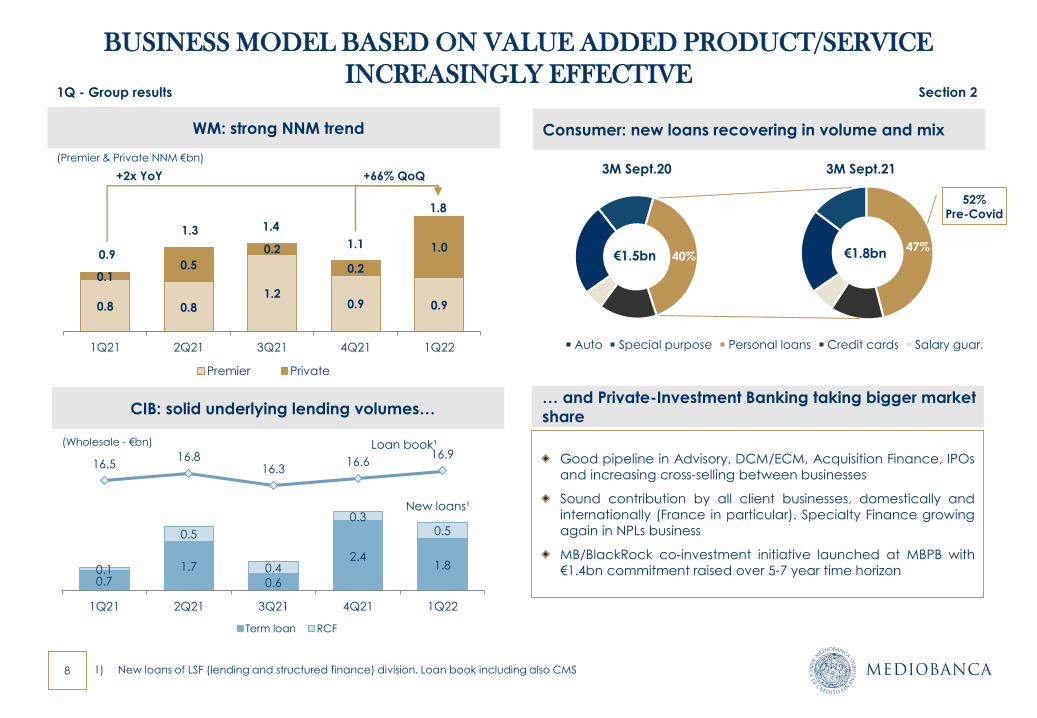
BUSINESS MODEL BASED ON VALUE ADDED PRODUCT/SERVICE
INCREASINGLY EFFECTIVE
WM: strong NNM trend
CIB: solid underlying lending volumes…
1Q - Group results Section 2
Good pipeline in Advisory, DCM/ECM, Acquisition Finance, IPOs
and increasing cross-selling between businesses
Sound contribution by all client businesses, domestically and
internationally (France in particular). Specialty Finance growing
again in NPLs business
MB/BlackRock co-investment initiative launched at MBPB with
€1.4bn commitment raised over 5-7 year time horizon
0.8 0.81.2
0.9 0.9
0.10.5
0.2
0.2
1.0
1Q21 2Q21 3Q21 4Q21 1Q22
Premier Private
(Premier & Private NNM €bn)
1.8
0.9
1.3 1.4
1.1
Consumer: new loans recovering in volume and mix
€1.8bn€1.5bn
3M Sept.20 3M Sept.21
47%
Auto Special purpose Personal loans Credit cards Salary guar.
52%
Pre-Covid
40%
+2x YoY
… and Private-Investment Banking taking bigger market
share
1) New loans of LSF (lending and structured finance) division. Loan book including also CMS
+66% QoQ
0.7
1.7
0.6
2.41.80.1
0.5
0.4
0.30.5
16.516.8
16.316.6
16.9
12
13
14
15
16
17
18
0.0
0.5
1.0
1.5
2.0
2.5
3.0
3.5
4.0
4.5
5.0
1Q21 2Q21 3Q21 4Q21 1Q22
Term loan RCF
(Wholesale - €bn) Loan book¹
New loans¹
9
235 226 223 216 214 226
69 68 69 72 72 74
69 72 77 70 68 68
Pre-Covid
(1)
1Q21 2Q21 3Q21 4Q21 1Q22
Consumer B. WM CIB HF&Other
359
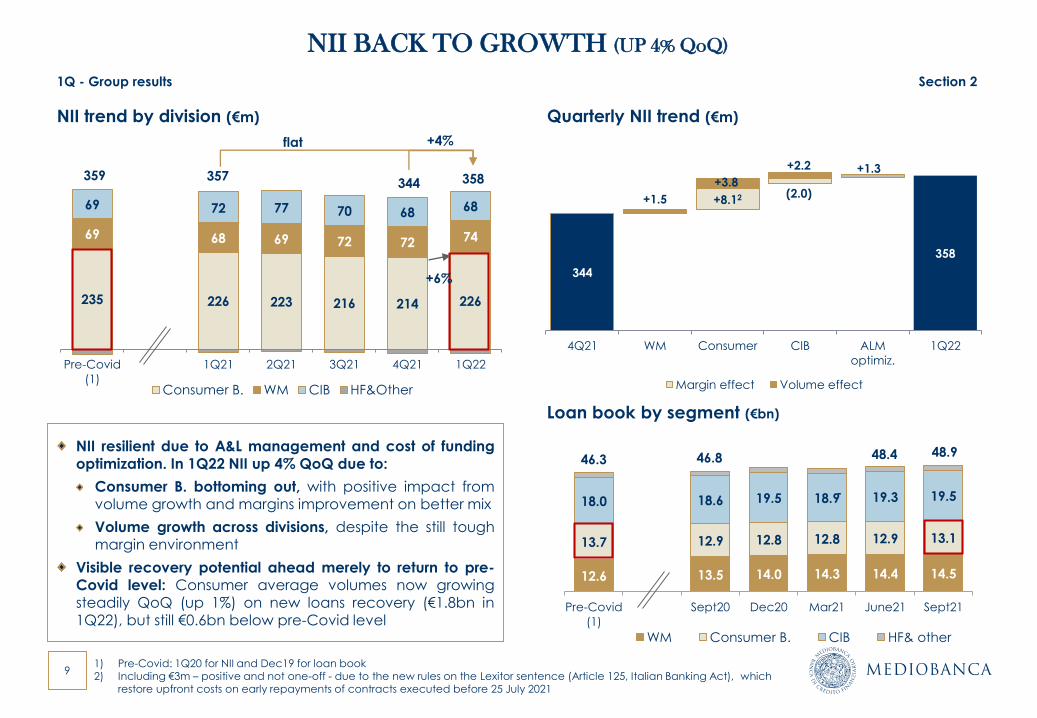
NII BACK TO GROWTH (UP 4% QoQ)
NII resilient due to A&L management and cost of funding
optimization. In 1Q22 NII up 4% QoQ due to:
Consumer B. bottoming out, with positive impact fromvolume growth and margins improvement on better mix
Volume growth across divisions, despite the still toughmargin environment
Visible recovery potential ahead merely to return to pre-Covid level: Consumer average volumes now growingsteadily QoQ (up 1%) on new loans recovery (€1.8bn in1Q22), but still €0.6bn below pre-Covid level
NII trend by division (€m)
Loan book by segment (€bn)
12.6 13.5 14.0 14.3 14.4 14.5
13.7 12.9 12.8 12.8 12.9 13.1
18.0 18.6 19.5 18.9 19.3 19.5
Pre-Covid
(1)
Sept20 Dec20 Mar21 June21 Sept21
WM Consumer B. CIB HF& other
46.3 48.4
-
1Q - Group results Section 2
344 358
+4%
Quarterly NII trend (€m)
48.9
1) Pre-Covid: 1Q20 for NII and Dec19 for loan book2) Including €3m – positive and not one-off - due to the new rules on the Lexitor sentence (Article 125, Italian Banking Act), which
restore upfront costs on early repayments of contracts executed before 25 July 2021
357
46.8
+6%
flat
344
358
+8.12 (2.0)
+1.3
+1.5
+3.8
+2.2
4Q21 WM Consumer CIB ALM
optimiz.
1Q22
Margin effect Volume effect
10
RECORD FEES FOR THE FIRST TIME > €200M, HIGHLY DIVERSIFIED & SUSTAINABLE
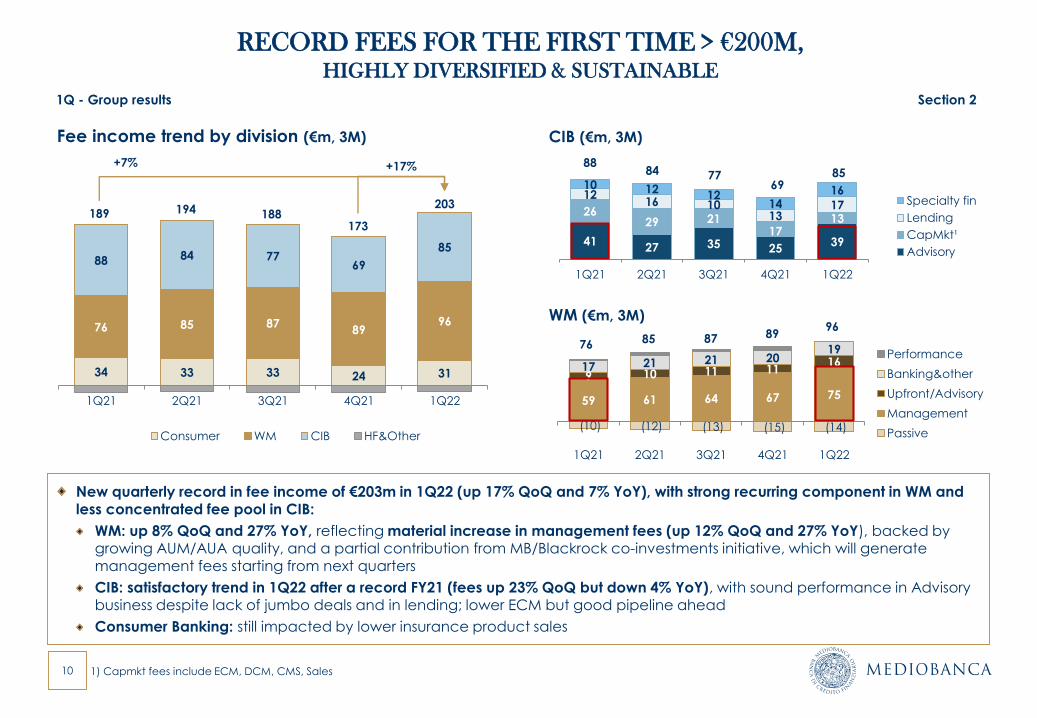
New quarterly record in fee income of €203m in 1Q22 (up 17% QoQ and 7% YoY), with strong recurring component in WM and less concentrated fee pool in CIB:
WM: up 8% QoQ and 27% YoY, reflecting material increase in management fees (up 12% QoQ and 27% YoY), backed by growing AUM/AUA quality, and a partial contribution from MB/Blackrock co-investments initiative, which will generate management fees starting from next quarters
CIB: satisfactory trend in 1Q22 after a record FY21 (fees up 23% QoQ but down 4% YoY), with sound performance in Advisory business despite lack of jumbo deals and in lending; lower ECM but good pipeline ahead
Consumer Banking: still impacted by lower insurance product sales
Fee income trend by division (€m, 3M)
1Q - Group results Section 2
34 33 33 24 31
76 85 8789
96
88 84 7769
85
1Q21 2Q21 3Q21 4Q21 1Q22
Consumer WM CIB HF&Other
189 194 188173
203
+17%
CIB (€m, 3M)
1) Capmkt fees include ECM, DCM, CMS, Sales
WM (€m, 3M)
(10) (12) (13) (15) (14)
59 61 64 67 75
9 10 11 111617 21 21 2019
1Q21 2Q21 3Q21 4Q21 1Q22
Performance
Banking&other
Upfront/Advisory
Management
Passive
76 85 898796
4127 35 25
39
2629 21
1713
1216 10
1317
10 1212
1416
1Q21 2Q21 3Q21 4Q21 1Q22
Specialty fin
Lending
CapMkt¹
Advisory
+7% 8884 77
6985
11
Gross carrying amount (€bn, Sept21)¹
Total
granted% expired
Total
Outstanding
o/w
Stage 2-3
(Sept21)
o/w
Stage 2-3
(June21)
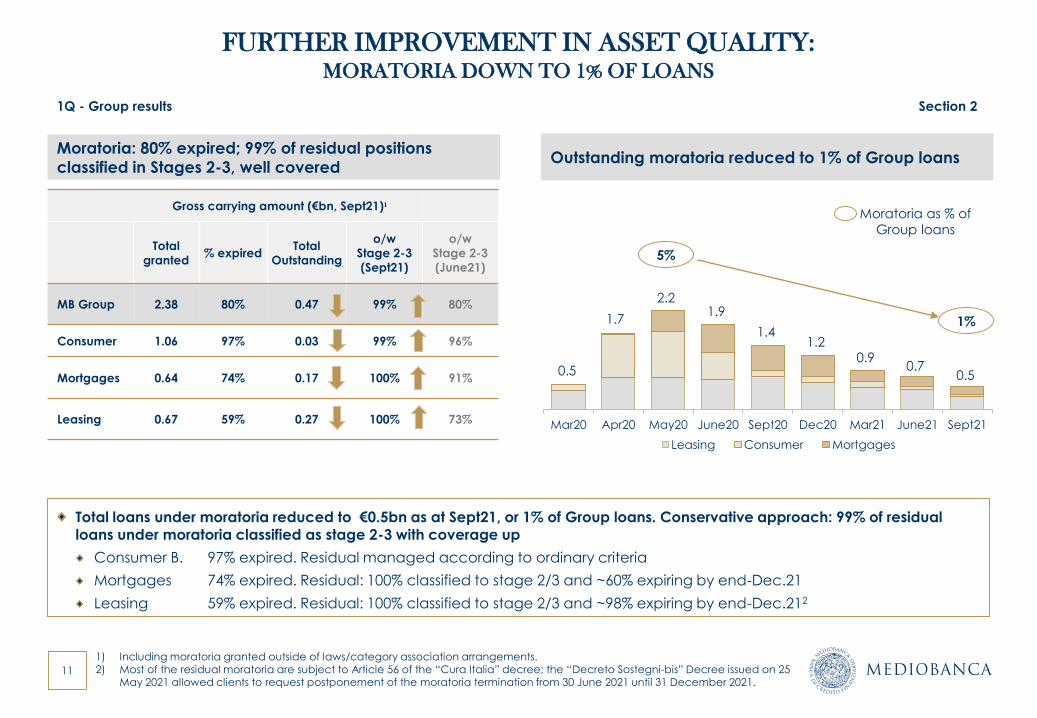
MB Group 2.38 80% 0.47 99% 80%
Consumer 1.06 97% 0.03 99% 96%
Mortgages 0.64 74% 0.17 100% 91%
Leasing 0.67 59% 0.27 100% 73%
FURTHER IMPROVEMENT IN ASSET QUALITY: MORATORIA DOWN TO 1% OF LOANS
Moratoria: 80% expired; 99% of residual positions
classified in Stages 2-3, well covered
1) Including moratoria granted outside of laws/category association arrangements.2) Most of the residual moratoria are subject to Article 56 of the “Cura Italia” decree; the “Decreto Sostegni-bis” Decree issued on 25
May 2021 allowed clients to request postponement of the moratoria termination from 30 June 2021 until 31 December 2021.
Total loans under moratoria reduced to €0.5bn as at Sept21, or 1% of Group loans. Conservative approach: 99% of residual loans under moratoria classified as stage 2-3 with coverage up
Consumer B. 97% expired. Residual managed according to ordinary criteria
Mortgages 74% expired. Residual: 100% classified to stage 2/3 and ~60% expiring by end-Dec.21
Leasing 59% expired. Residual: 100% classified to stage 2/3 and ~98% expiring by end-Dec.212
Outstanding moratoria reduced to 1% of Group loans
Mar20 Apr20 May20 June20 Sept20 Dec20 Mar21 June21 Sept21
Leasing Consumer Mortgages
1.4
1.92.2
1.7
0.5
1%
Moratoria as % of
Group loans
5%
1.20.9
0.7
1Q - Group results Section 2
0.5
12
PRUDENT STAGING:NPLs INCIDENCE DOWN AND COVERAGE RATIOS UP
1) Figures in the graphs in upper part of the slide refer to the Customers Loan Book and may therefore differ from the EBA Dashboard. In particular, the EBA includes NPLs purchased and treasury balances that are excluded from the MB classification.In Stage 3 gross NPLs MBCS excluded
88% 89% 89%
0.56% 0.65% 0.66%
-1.5%
-1.0%
-0.5%
0.0%
0.5%
1.0%
50%
70%
90%
110%
Sept20 June21 Sept21
Gross Exposure/Loans Coverage
6.7% 7.5% 7.2%
10.3% 9.7% 10.1%
-10.0%
0.0%
10.0%
20.0%
-1%
4%
9%
14%
Sept20 June21 Sept21
Gross Exposure/Loans Coverage
Performing Loans – Stage 11
4.2%3.2% 3.1%
56.5%64.9% 67.2%
10.0%
20.0%
30.0%
40.0%
50.0%
60.0%
70.0%
0%
2%
4%
6%
8%
Sept20 June21 Sept21
Gross Exposure/Loans Coverage
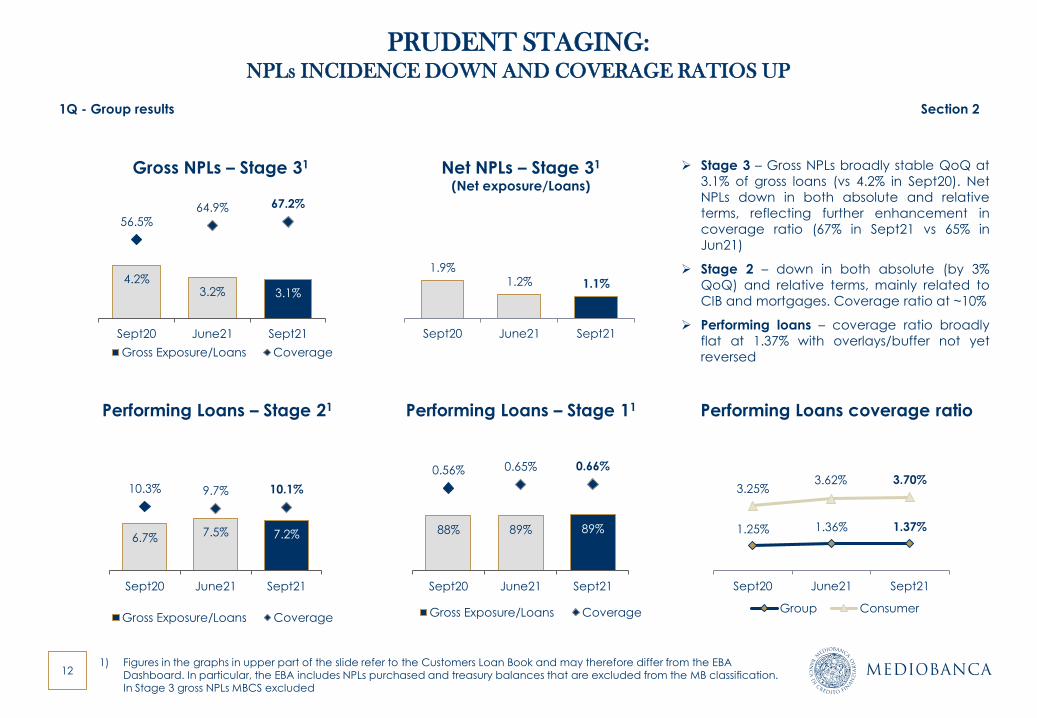
➢ Stage 3 – Gross NPLs broadly stable QoQ at
3.1% of gross loans (vs 4.2% in Sept20). Net
NPLs down in both absolute and relative
terms, reflecting further enhancement in
coverage ratio (67% in Sept21 vs 65% in
Jun21)
➢ Stage 2 – down in both absolute (by 3%
QoQ) and relative terms, mainly related to
CIB and mortgages. Coverage ratio at ~10%
➢ Performing loans – coverage ratio broadly
flat at 1.37% with overlays/buffer not yet
reversed
1.9%1.2% 1.1%
0.00%
1.00%
2.00%
3.00%
4.00%
5.00%
Sept20 June21 Sept21
Performing Loans – Stage 21
Gross NPLs – Stage 31 Net NPLs – Stage 31
(Net exposure/Loans)
Performing Loans coverage ratio
1.25% 1.36% 1.37%
3.25%3.62% 3.70%
Sept20 June21 Sept21
Group Consumer
1Q - Group results Section 2
13
COST OF RISK REDUCED TO 51bps WITH NO OVERLAYS REVERSED AND RECORD COVERAGE RATIOS
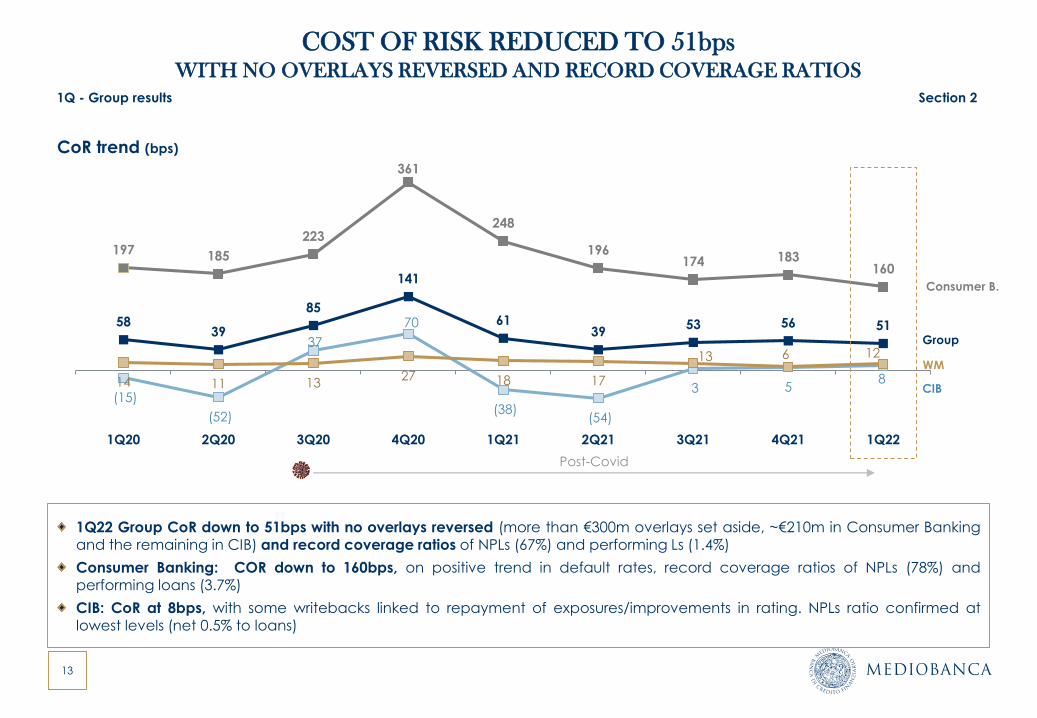
1Q22 Group CoR down to 51bps with no overlays reversed (more than €300m overlays set aside, ~€210m in Consumer Bankingand the remaining in CIB) and record coverage ratios of NPLs (67%) and performing Ls (1.4%)
Consumer Banking: COR down to 160bps, on positive trend in default rates, record coverage ratios of NPLs (78%) andperforming loans (3.7%)
CIB: CoR at 8bps, with some writebacks linked to repayment of exposures/improvements in rating. NPLs ratio confirmed atlowest levels (net 0.5% to loans)
CoR trend (bps)
1Q - Group results Section 2
5839
85
141
6139
53 56 51
(15)
(52)
37
70
(38)(54)
3 5814 11 13
27 18 17
13 6 12
197 185
223
361
248
196174 183
160
1Q20 2Q20 3Q20 4Q20 1Q21 2Q21 3Q21 4Q21 1Q22
Post-Covid
Consumer B.
Group
CIB
WM
14
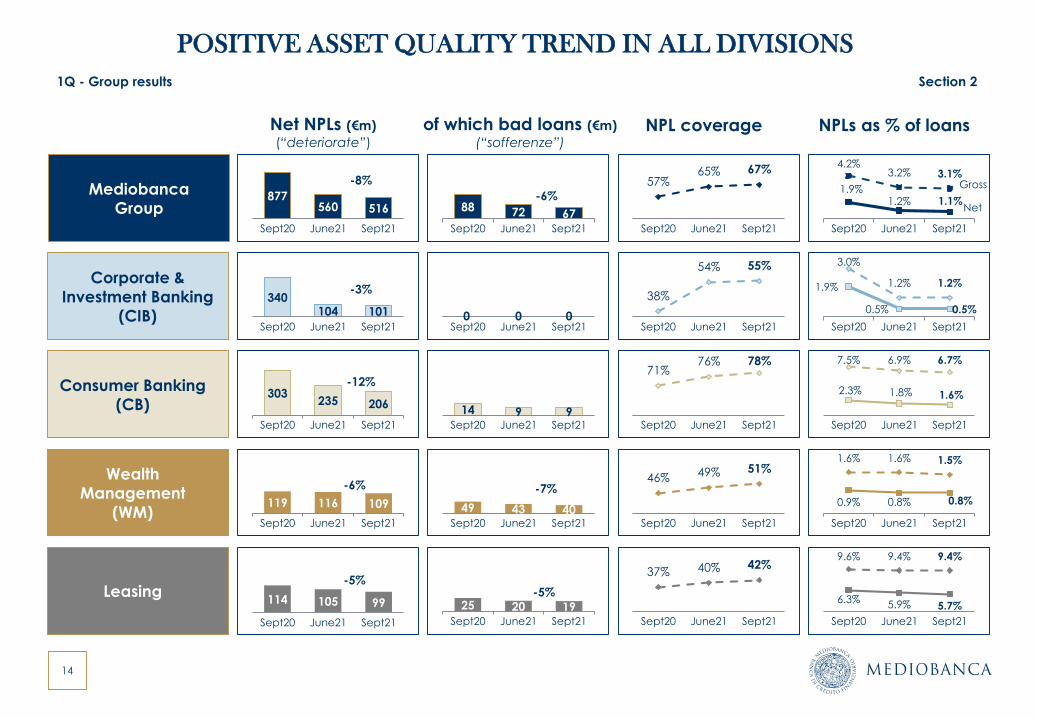
POSITIVE ASSET QUALITY TREND IN ALL DIVISIONS
Net NPLs (€m)
(“deteriorate”)
Leasing
Consumer Banking
(CB)
Corporate &
Investment Banking
(CIB)
Wealth
Management
(WM)
of which bad loans (€m)
(“sofferenze”)
NPL coverage NPLs as % of loans
Mediobanca
Group877
560 516
Sept20 June21 Sept21
340104 101
Sept20 June21 Sept21
303235 206
Sept20 June21 Sept21
119 116 109
Sept20 June21 Sept21
114 105 99
Sept20 June21 Sept21
88 72 67Sept20 June21 Sept21
0 0 0Sept20 June21 Sept21
14 9 9Sept20 June21 Sept21
49 43 40Sept20 June21 Sept21
25 20 19Sept20 June21 Sept21
57%65% 67%
Sept20 June21 Sept21
38%
54% 55%
Sept20 June21 Sept21
71%76% 78%
Sept20 June21 Sept21
46% 49% 51%
Sept20 June21 Sept21
37% 40% 42%
Sept20 June21 Sept21
4.2%3.2% 3.1%
1.9%1.2% 1.1%
Sept20 June21 Sept21
3.0%
1.2% 1.2%1.9%
0.5% 0.5%
Sept20 June21 Sept21
7.5% 6.9% 6.7%
2.3% 1.8% 1.6%
Sept20 June21 Sept21
1.6% 1.6% 1.5%
0.9% 0.8% 0.8%
Sept20 June21 Sept21
9.6% 9.4% 9.4%
6.3%5.9% 5.7%
Sept20 June21 Sept21
-8%
-3%
-6%
-5%-5%
Net
Gross
-12%
-7%
-6%
1Q - Group results Section 2
15
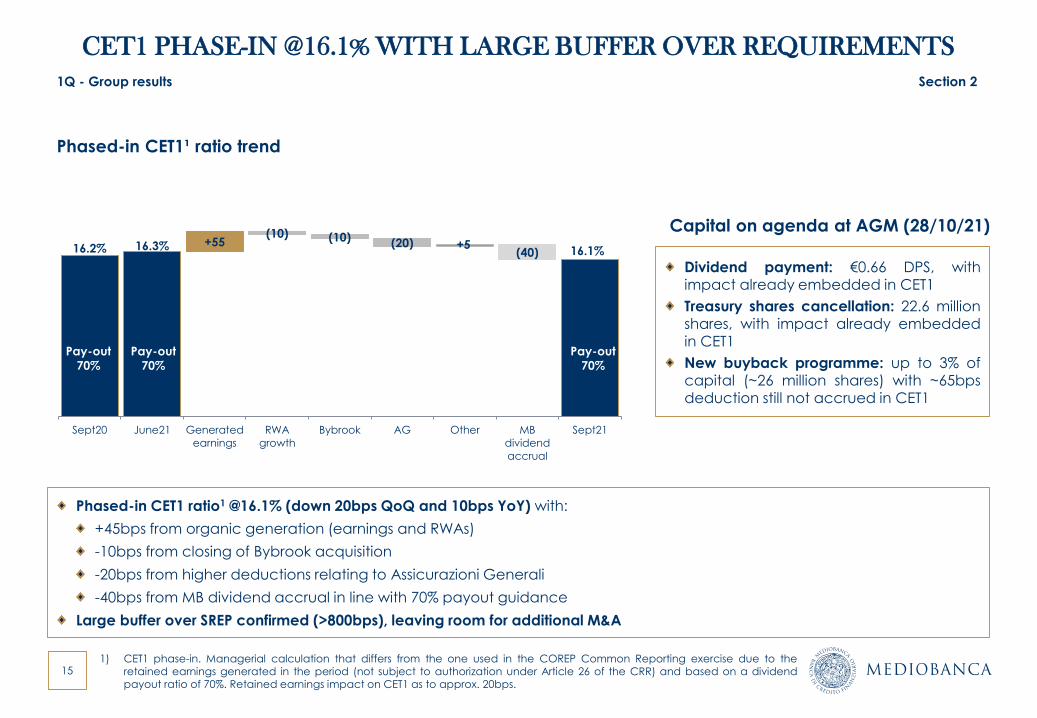
CET1 PHASE-IN @16.1% WITH LARGE BUFFER OVER REQUIREMENTS
Phased-in CET1¹ ratio trend
16.2% 16.3% 16.1%+55
(10) (10) (20) +5(40)
Sept20 June21 Generated
earnings
RWA
growth
Bybrook AG Other MB
dividend
accrual
Sept21
Phased-in CET1 ratio1 @16.1% (down 20bps QoQ and 10bps YoY) with:
+45bps from organic generation (earnings and RWAs)
-10bps from closing of Bybrook acquisition
-20bps from higher deductions relating to Assicurazioni Generali
-40bps from MB dividend accrual in line with 70% payout guidance
Large buffer over SREP confirmed (>800bps), leaving room for additional M&A
1) CET1 phase-in. Managerial calculation that differs from the one used in the COREP Common Reporting exercise due to theretained earnings generated in the period (not subject to authorization under Article 26 of the CRR) and based on a dividendpayout ratio of 70%. Retained earnings impact on CET1 as to approx. 20bps.
Pay-out
70%
Pay-out
70%
1Q - Group results Section 2
Pay-out
70%
Dividend payment: €0.66 DPS, withimpact already embedded in CET1
Treasury shares cancellation: 22.6 million
shares, with impact already embeddedin CET1
New buyback programme: up to 3% ofcapital (~26 million shares) with ~65bpsdeduction still not accrued in CET1
Capital on agenda at AGM (28/10/21)
16
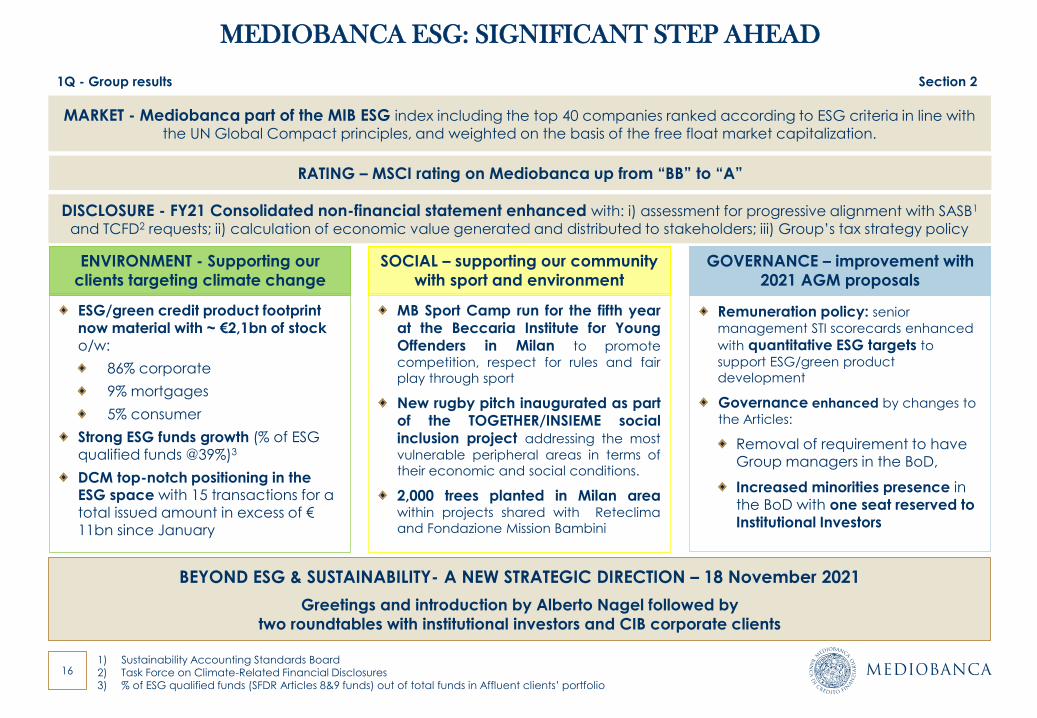
MEDIOBANCA ESG: SIGNIFICANT STEP AHEAD
GOVERNANCE – improvement with
2021 AGM proposals
ENVIRONMENT - Supporting our
clients targeting climate change
SOCIAL – supporting our community
with sport and environment
Remuneration policy: senior
management STI scorecards enhanced
with quantitative ESG targets to
support ESG/green product
development
Governance enhanced by changes to
the Articles:
Removal of requirement to have Group managers in the BoD,
Increased minorities presence in the BoD with one seat reserved to
Institutional Investors
MB Sport Camp run for the fifth yearat the Beccaria Institute for YoungOffenders in Milan to promote
competition, respect for rules and fair
play through sport
New rugby pitch inaugurated as partof the TOGETHER/INSIEME socialinclusion project addressing the most
vulnerable peripheral areas in terms of
their economic and social conditions.
2,000 trees planted in Milan areawithin projects shared with Reteclima
and Fondazione Mission Bambini
ESG/green credit product footprint now material with ~ €2,1bn of stock o/w:
86% corporate
9% mortgages
5% consumer
Strong ESG funds growth (% of ESG qualified funds @39%)3
DCM top-notch positioning in the ESG space with 15 transactions for a total issued amount in excess of € 11bn since January
BEYOND ESG & SUSTAINABILITY- A NEW STRATEGIC DIRECTION – 18 November 2021
Greetings and introduction by Alberto Nagel followed by
two roundtables with institutional investors and CIB corporate clients
MARKET - Mediobanca part of the MIB ESG index including the top 40 companies ranked according to ESG criteria in line with
the UN Global Compact principles, and weighted on the basis of the free float market capitalization.
DISCLOSURE - FY21 Consolidated non-financial statement enhanced with: i) assessment for progressive alignment with SASB1
and TCFD2 requests; ii) calculation of economic value generated and distributed to stakeholders; iii) Group’s tax strategy policy
1) Sustainability Accounting Standards Board2) Task Force on Climate-Related Financial Disclosures3) % of ESG qualified funds (SFDR Articles 8&9 funds) out of total funds in Affluent clients’ portfolio
1Q - Group results Section 2
RATING – MSCI rating on Mediobanca up from “BB” to “A”
Agenda
Section 1. Executive summary
Section 2. 1Q Group results
Section 3. Divisional results
Section 4. Closing remarks
Annexes
1. Divisional results by quarter
2. Glossary
18
WM: BUSINESS SET ON LARGER SCALE
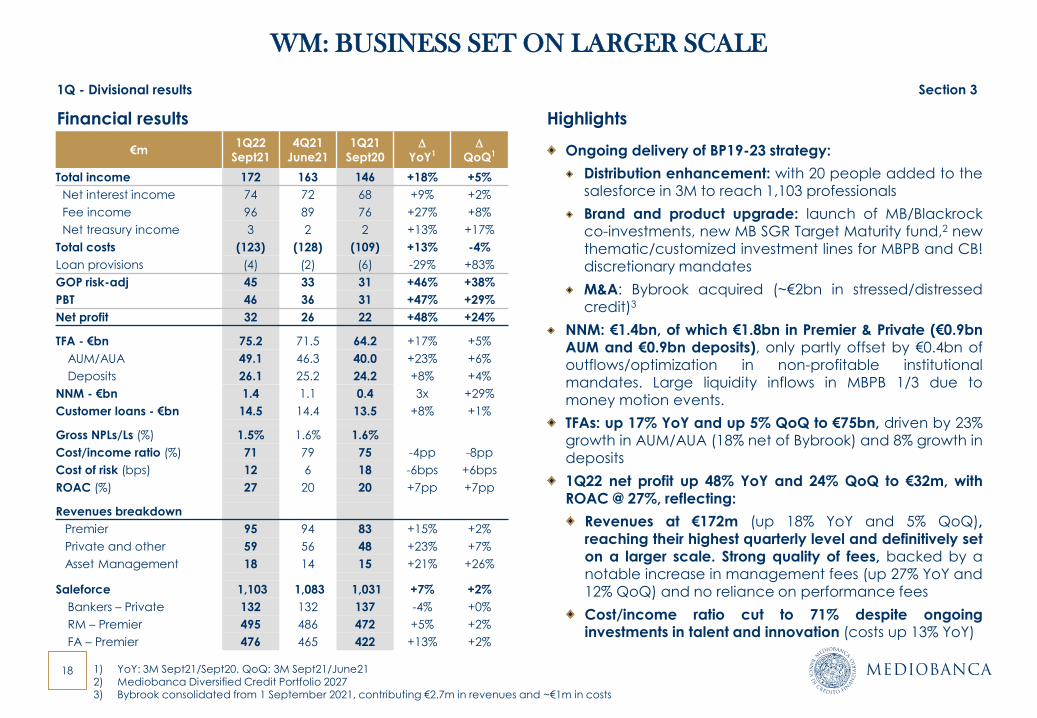
Ongoing delivery of BP19-23 strategy:
Distribution enhancement: with 20 people added to thesalesforce in 3M to reach 1,103 professionals
Brand and product upgrade: launch of MB/Blackrockco-investments, new MB SGR Target Maturity fund,2 newthematic/customized investment lines for MBPB and CB!discretionary mandates
M&A: Bybrook acquired (~€2bn in stressed/distressedcredit)3
NNM: €1.4bn, of which €1.8bn in Premier & Private (€0.9bnAUM and €0.9bn deposits), only partly offset by €0.4bn ofoutflows/optimization in non-profitable institutionalmandates. Large liquidity inflows in MBPB 1/3 due tomoney motion events.
TFAs: up 17% YoY and up 5% QoQ to €75bn, driven by 23%growth in AUM/AUA (18% net of Bybrook) and 8% growth in
deposits
1Q22 net profit up 48% YoY and 24% QoQ to €32m, withROAC @ 27%, reflecting:
Revenues at €172m (up 18% YoY and 5% QoQ),reaching their highest quarterly level and definitively seton a larger scale. Strong quality of fees, backed by anotable increase in management fees (up 27% YoY and
12% QoQ) and no reliance on performance fees
Cost/income ratio cut to 71% despite ongoinginvestments in talent and innovation (costs up 13% YoY)
HighlightsFinancial results
€m 1Q22
Sept21
4Q21
June21
1Q21
Sept20D
YoY1D
QoQ1
Total income 172 163 146 +18% +5%
Net interest income 74 72 68 +9% +2%
Fee income 96 89 76 +27% +8%
Net treasury income 3 2 2 +13% +17%
Total costs (123) (128) (109) +13% -4%
Loan provisions (4) (2) (6) -29% +83%
GOP risk-adj 45 33 31 +46% +38%
PBT 46 36 31 +47% +29%
Net profit 32 26 22 +48% +24%
TFA - €bn 75.2 71.5 64.2 +17% +5%
AUM/AUA 49.1 46.3 40.0 +23% +6%
Deposits 26.1 25.2 24.2 +8% +4%
NNM - €bn 1.4 1.1 0.4 3x +29%
Customer loans - €bn 14.5 14.4 13.5 +8% +1%
Gross NPLs/Ls (%) 1.5% 1.6% 1.6%
Cost/income ratio (%) 71 79 75 -4pp -8pp
Cost of risk (bps) 12 6 18 -6bps +6bps
ROAC (%) 27 20 20 +7pp +7pp
Revenues breakdown
Premier 95 94 83 +15% +2%
Private and other 59 56 48 +23% +7%
Asset Management 18 14 15 +21% +26%
Saleforce 1,103 1,083 1,031 +7% +2%
Bankers – Private 132 132 137 -4% +0%
RM – Premier 495 486 472 +5% +2%
FA – Premier 476 465 422 +13% +2%
1) YoY: 3M Sept21/Sept20. QoQ: 3M Sept21/June212) Mediobanca Diversified Credit Portfolio 20273) Bybrook consolidated from 1 September 2021, contributing €2.7m in revenues and ~€1m in costs
1Q - Divisional results Section 3
19
BALANCED ORGANIC AND NON-ORGANIC TFA GROWTHBYBROOK CONSOLIDATION FROM 1 SEPTEMBER
1Q - Divisional results Section 3
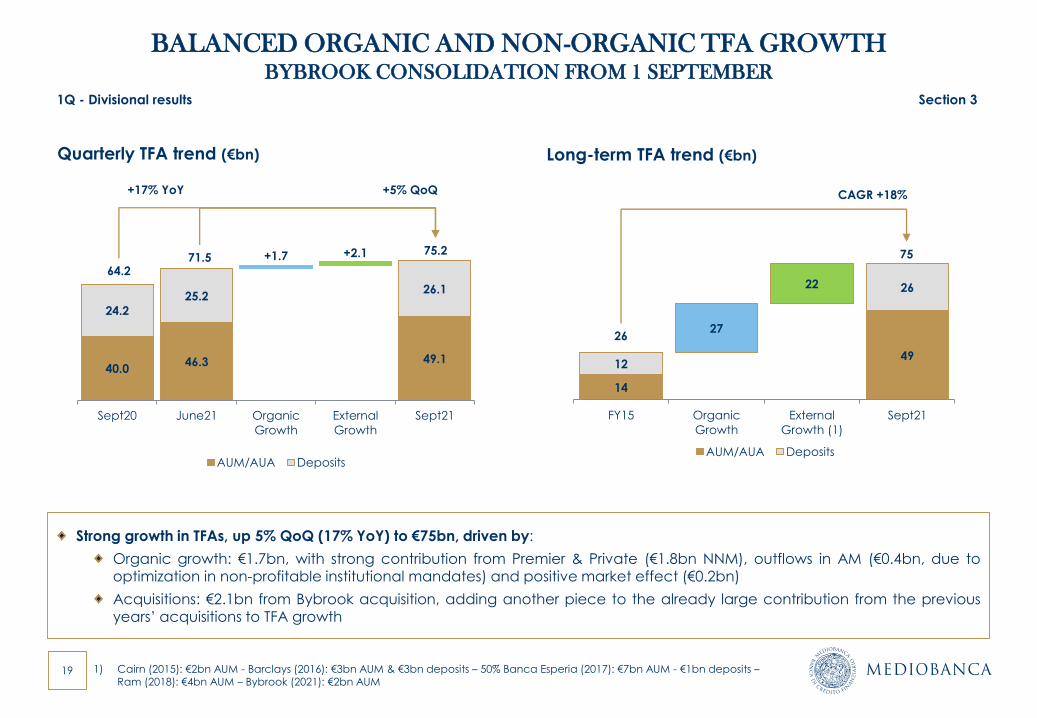
Strong growth in TFAs, up 5% QoQ (17% YoY) to €75bn, driven by:
Organic growth: €1.7bn, with strong contribution from Premier & Private (€1.8bn NNM), outflows in AM (€0.4bn, due tooptimization in non-profitable institutional mandates) and positive market effect (€0.2bn)
Acquisitions: €2.1bn from Bybrook acquisition, adding another piece to the already large contribution from the previousyears’ acquisitions to TFA growth
14
4912
26
27
22
FY15 Organic
Growth
External
Growth (1)
Sept21
AUM/AUA Deposits
26
75
CAGR +18%
40.046.3 49.1
24.2
25.2
+1.7 +2.1
26.1
Sept20 June21 Organic
Growth
External
Growth
Sept21
AUM/AUA Deposits
71.575.2
64.2
+5% QoQ+17% YoY
Quarterly TFA trend (€bn) Long-term TFA trend (€bn)
1) Cairn (2015): €2bn AUM - Barclays (2016): €3bn AUM & €3bn deposits – 50% Banca Esperia (2017): €7bn AUM - €1bn deposits –Ram (2018): €4bn AUM – Bybrook (2021): €2bn AUM
20
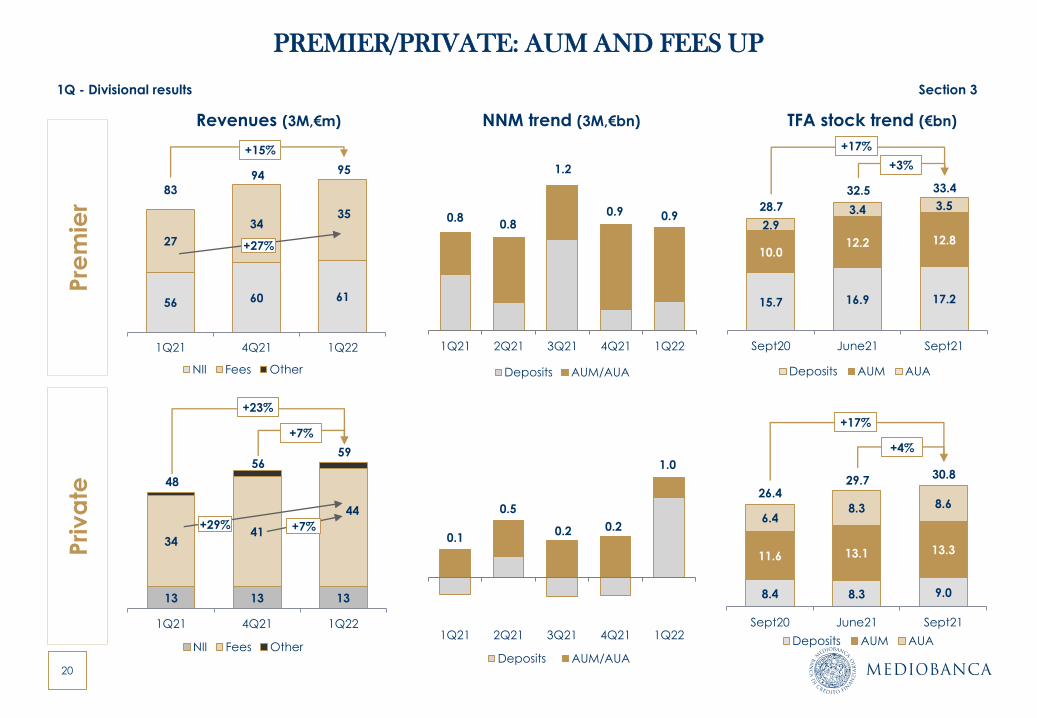
13 13 13
3441
44
1Q21 4Q21 1Q22
NII Fees Other
PREMIER/PRIVATE: AUM AND FEES UP
NNM trend (3M,€bn) TFA stock trend (€bn)
15.7 16.9 17.2
10.012.2 12.8
2.9
3.4 3.5
Sept20 June21 Sept21
Deposits AUM AUA
+15%
Revenues (3M,€m)
56 60 61
27
3435
1Q21 4Q21 1Q22
NII Fees Other
83
94 95
Pre
mie
rP
riv
ate
+27%
1Q21 2Q21 3Q21 4Q21 1Q22
Deposits AUM/AUA
1Q - Divisional results Section 3
48
5659
+29% +7%
+7%
28.7
32.5 33.4
+3%
+17%
8.4 8.3 9.0
11.6 13.1 13.3
6.48.3 8.6
Sept20 June21 Sept21
Deposits AUM AUA
26.429.7
30.8
+4%
+17%
1Q21 2Q21 3Q21 4Q21 1Q22
Deposits AUM/AUA
0.1
0.5
0.2 0.2
0.80.8
1.2
0.90.9
+23%
1.0
21
ENHANCED DISTRIBUTION AND DISTICTIVE OFFERING
1Q - Divisional results Section 3
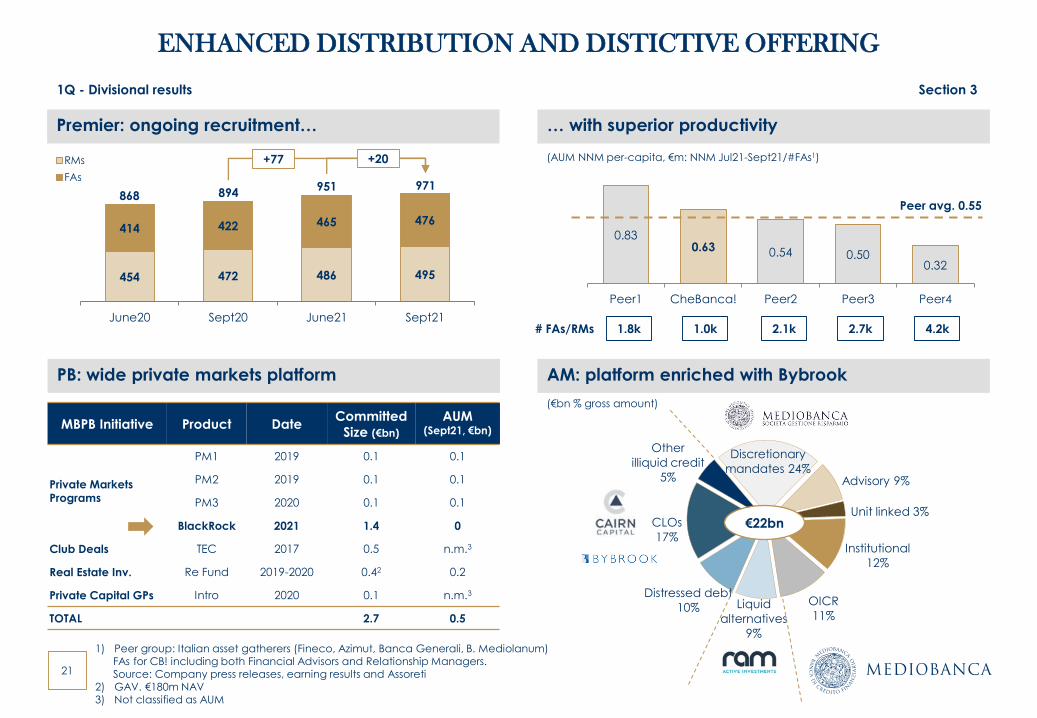
MBPB Initiative Product DateCommitted
Size (€bn)
AUM (Sept21, €bn)
Private MarketsPrograms
PM1 2019 0.1 0.1
PM2 2019 0.1 0.1
PM3 2020 0.1 0.1
BlackRock 2021 1.4 0
Club Deals TEC 2017 0.5 n.m.3
Real Estate Inv. Re Fund 2019-2020 0.42 0.2
Private Capital GPs Intro 2020 0.1 n.m.3
TOTAL 2.7 0.5
1) Peer group: Italian asset gatherers (Fineco, Azimut, Banca Generali, B. Mediolanum) FAs for CB! including both Financial Advisors and Relationship Managers. Source: Company press releases, earning results and Assoreti
2) GAV. €180m NAV3) Not classified as AUM
PB: wide private markets platform
Liquid
alternatives
9%
Distressed debt
10%
CLOs
17%
Other
illiquid credit
5%
Discretionary
mandates 24%Advisory 9%
Unit linked 3%
Institutional
12%
OICR
11%
AM: platform enriched with Bybrook
€22bn
… with superior productivity
(€bn % gross amount)
0.830.63 0.54 0.50
0.32
0
0
0
0
0
1
1
1
1
1
Peer1 CheBanca! Peer2 Peer3 Peer4
Peer avg. 0.55
(AUM NNM per-capita, €m: NNM Jul21-Sept21/#FAs1)
1.8k 1.0k 2.1k 2.7k 4.2k# FAs/RMs
Premier: ongoing recruitment…
454 472 486 495
414 422 465 476
June20 Sept20 June21 Sept21
RMs
FAs
868 894951 971
+77 +20
22
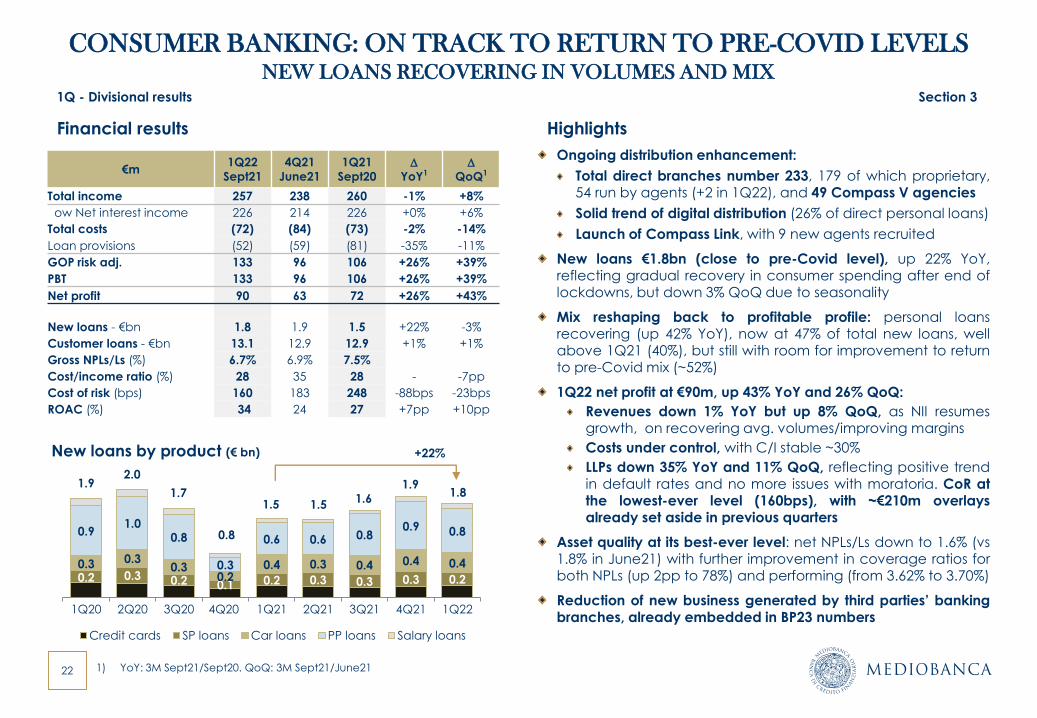
CONSUMER BANKING: ON TRACK TO RETURN TO PRE-COVID LEVELSNEW LOANS RECOVERING IN VOLUMES AND MIX
Financial results
Ongoing distribution enhancement:
Total direct branches number 233, 179 of which proprietary,54 run by agents (+2 in 1Q22), and 49 Compass V agencies
Solid trend of digital distribution (26% of direct personal loans)
Launch of Compass Link, with 9 new agents recruited
New loans €1.8bn (close to pre-Covid level), up 22% YoY,reflecting gradual recovery in consumer spending after end oflockdowns, but down 3% QoQ due to seasonality
Mix reshaping back to profitable profile: personal loansrecovering (up 42% YoY), now at 47% of total new loans, wellabove 1Q21 (40%), but still with room for improvement to returnto pre-Covid mix (~52%)
1Q22 net profit at €90m, up 43% YoY and 26% QoQ:
Revenues down 1% YoY but up 8% QoQ, as NII resumesgrowth, on recovering avg. volumes/improving margins
Costs under control, with C/I stable ~30%
LLPs down 35% YoY and 11% QoQ, reflecting positive trendin default rates and no more issues with moratoria. CoR atthe lowest-ever level (160bps), with ~€210m overlaysalready set aside in previous quarters
Asset quality at its best-ever level: net NPLs/Ls down to 1.6% (vs1.8% in June21) with further improvement in coverage ratios forboth NPLs (up 2pp to 78%) and performing (from 3.62% to 3.70%)
Reduction of new business generated by third parties’ bankingbranches, already embedded in BP23 numbers
New loans by product (€ bn)
Highlights
€m 1Q22
Sept21
4Q21
June21
1Q21
Sept20D
YoY1D
QoQ1
Total income 257 238 260 -1% +8%
ow Net interest income 226 214 226 +0% +6%
Total costs (72) (84) (73) -2% -14%
Loan provisions (52) (59) (81) -35% -11%
GOP risk adj. 133 96 106 +26% +39%
PBT 133 96 106 +26% +39%
Net profit 90 63 72 +26% +43%
New loans - €bn 1.8 1.9 1.5 +22% -3%
Customer loans - €bn 13.1 12.9 12.9 +1% +1%
Gross NPLs/Ls (%) 6.7% 6.9% 7.5%
Cost/income ratio (%) 28 35 28 - -7pp
Cost of risk (bps) 160 183 248 -88bps -23bps
ROAC (%) 34 24 27 +7pp +10pp
1) YoY: 3M Sept21/Sept20. QoQ: 3M Sept21/June21
1Q - Divisional results Section 3
0.2 0.3 0.2 0.1 0.2 0.3 0.3 0.3 0.2
0.3 0.30.3
0.20.4 0.3 0.4 0.4 0.4
0.91.0
0.8
0.3
0.6 0.6 0.80.9 0.8
1Q20 2Q20 3Q20 4Q20 1Q21 2Q21 3Q21 4Q21 1Q22
Credit cards SP loans Car loans PP loans Salary loans
1.5 1.51.6
1.91.8
0.8
1.7
2.01.9
+22%
23
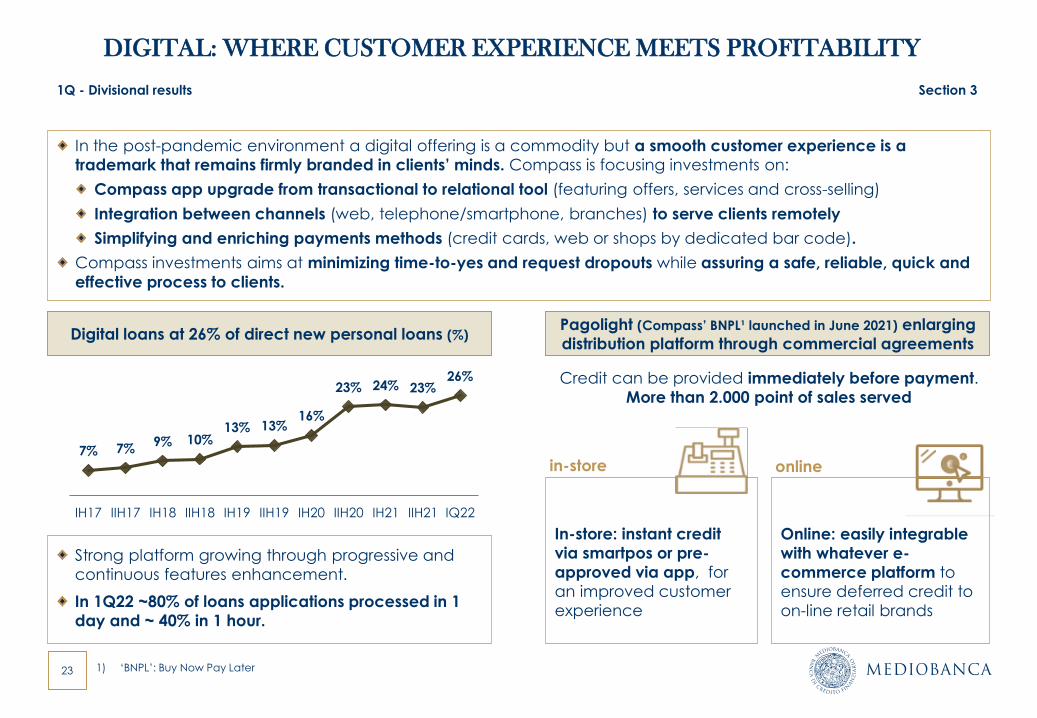
DIGITAL: WHERE CUSTOMER EXPERIENCE MEETS PROFITABILITY
In the post-pandemic environment a digital offering is a commodity but a smooth customer experience is a
trademark that remains firmly branded in clients’ minds. Compass is focusing investments on:
Compass app upgrade from transactional to relational tool (featuring offers, services and cross-selling)
Integration between channels (web, telephone/smartphone, branches) to serve clients remotely
Simplifying and enriching payments methods (credit cards, web or shops by dedicated bar code).
Compass investments aims at minimizing time-to-yes and request dropouts while assuring a safe, reliable, quick and
effective process to clients.
Strong platform growing through progressive and
continuous features enhancement.
In 1Q22 ~80% of loans applications processed in 1
day and ~ 40% in 1 hour.
Digital loans at 26% of direct new personal loans (%)Pagolight (Compass’ BNPL¹ launched in June 2021) enlarging
distribution platform through commercial agreements
1Q - Divisional results Section 3
In-store: instant credit
via smartpos or pre-
approved via app, for
an improved customer
experience
7% 7%9% 10%
13% 13%16%
23% 24% 23%26%
IH17 IIH17 IH18 IIH18 IH19 IIH19 IH20 IIH20 IH21 IIH21 IQ22
Credit can be provided immediately before payment.
More than 2.000 point of sales served
in-store online
1) ‘BNPL’: Buy Now Pay Later
Online: easily integrable
with whatever e-
commerce platform to
ensure deferred credit to
on-line retail brands
24
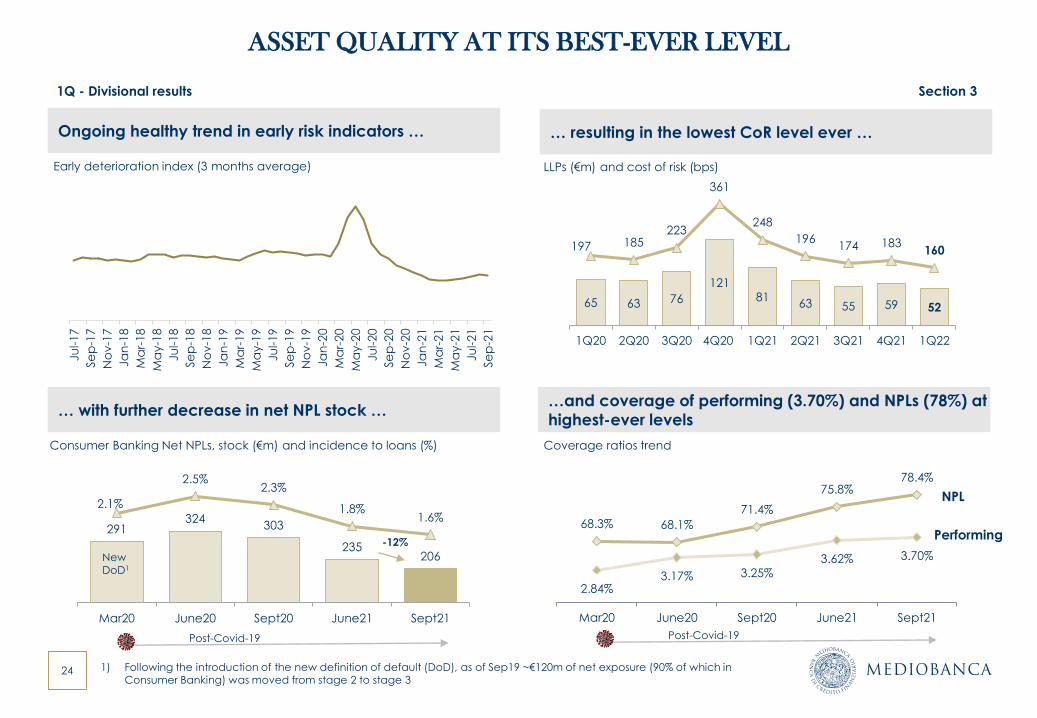
ASSET QUALITY AT ITS BEST-EVER LEVEL
… resulting in the lowest CoR level ever …Ongoing healthy trend in early risk indicators …
1) Following the introduction of the new definition of default (DoD), as of Sep19 ~€120m of net exposure (90% of which in Consumer Banking) was moved from stage 2 to stage 3
Early deterioration index (3 months average)
1Q - Divisional results Section 3
… with further decrease in net NPL stock …
Consumer Banking Net NPLs, stock (€m) and incidence to loans (%)
…and coverage of performing (3.70%) and NPLs (78%) at
highest-ever levels
68.3% 68.1%
71.4%
75.8%78.4%
2.84%3.17% 3.25%
3.62% 3.70%
2%
3%
3%
4%
4%
5%
5%
55.00%
60.00%
65.00%
70.00%
75.00%
80.00%
Mar20 June20 Sept20 June21 Sept21
291324
303
235206
2.1%
2.5%2.3%
1.8%1.6%
0.0%
0.5%
1.0%
1.5%
2.0%
2.5%
3.0%
100
150
200
250
300
350
400
450
500
Mar20 June20 Sept20 June21 Sept21
-12%
NPL
Performing
NewDoD1
Post-Covid-19
Coverage ratios trend
Ju
l-17
Se
p-1
7
No
v-1
7
Ja
n-1
8
Ma
r-18
Ma
y-1
8
Ju
l-18
Se
p-1
8
No
v-1
8
Ja
n-1
9
Ma
r-19
Ma
y-1
9
Ju
l-19
Se
p-1
9
No
v-1
9
Ja
n-2
0
Ma
r-20
Ma
y-2
0
Ju
l-20
Se
p-2
0
No
v-2
0
Ja
n-2
1
Ma
r-21
Ma
y-2
1
Ju
l-21
Se
p-2
1
Post-Covid-19
65 63 76
12181
63 55 59 52
197 185223
361
248
196174 183
160
-20
30
80
130
180
230
280
330
380
0
50
100
150
1Q20 2Q20 3Q20 4Q20 1Q21 2Q21 3Q21 4Q21 1Q22
LLPs (€m) and cost of risk (bps)
25
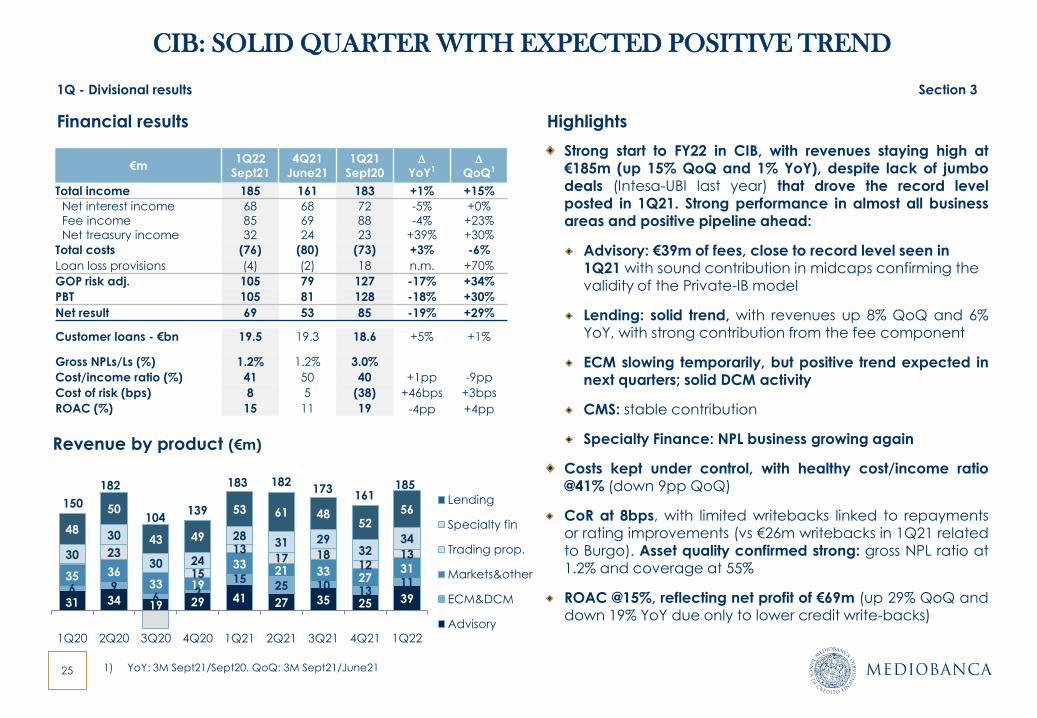
CIB: SOLID QUARTER WITH EXPECTED POSITIVE TREND
Financial results Highlights
Strong start to FY22 in CIB, with revenues staying high at€185m (up 15% QoQ and 1% YoY), despite lack of jumbodeals (Intesa-UBI last year) that drove the record levelposted in 1Q21. Strong performance in almost all businessareas and positive pipeline ahead:
Advisory: €39m of fees, close to record level seen in 1Q21 with sound contribution in midcaps confirming the validity of the Private-IB model
Lending: solid trend, with revenues up 8% QoQ and 6%YoY, with strong contribution from the fee component
ECM slowing temporarily, but positive trend expected innext quarters; solid DCM activity
CMS: stable contribution
Specialty Finance: NPL business growing again
Costs kept under control, with healthy cost/income ratio@41% (down 9pp QoQ)
CoR at 8bps, with limited writebacks linked to repaymentsor rating improvements (vs €26m writebacks in 1Q21 relatedto Burgo). Asset quality confirmed strong: gross NPL ratio at1.2% and coverage at 55%
ROAC @15%, reflecting net profit of €69m (up 29% QoQ anddown 19% YoY due only to lower credit write-backs)
Revenue by product (€m)
€m 1Q22
Sept21
4Q21
June21
1Q21
Sept20D
YoY1D
QoQ1
Total income 185 161 183 +1% +15%
Net interest income 68 68 72 -5% +0%
Fee income 85 69 88 -4% +23%
Net treasury income 32 24 23 +39% +30%
Total costs (76) (80) (73) +3% -6%
Loan loss provisions (4) (2) 18 n.m. +70%
GOP risk adj. 105 79 127 -17% +34%
PBT 105 81 128 -18% +30%
Net result 69 53 85 -19% +29%
Customer loans - €bn 19.5 19.3 18.6 +5% +1%
Gross NPLs/Ls (%) 1.2% 1.2% 3.0%
Cost/income ratio (%) 41 50 40 +1pp -9pp
Cost of risk (bps) 8 5 (38) +46bps +3bps
ROAC (%) 15 11 19 -4pp +4pp
1) YoY: 3M Sept21/Sept20. QoQ: 3M Sept21/June21
1Q - Divisional results Section 3
31 34 19 29 41 27 35 25 396 9
6 215
25 10 1311
35 3633 19
3321 33
2731
23
15
1317 18
121330
30
30 24
2831 29
3234
48
50
43 49
53 61 4852
56
1Q20 2Q20 3Q20 4Q20 1Q21 2Q21 3Q21 4Q21 1Q22
Lending
Specialty fin
Trading prop.
Markets&other
ECM&DCM
Advisory
104
182
150139
183173
182161
185
26
LEADING POSITIONING CONFIRMED IN M&A…
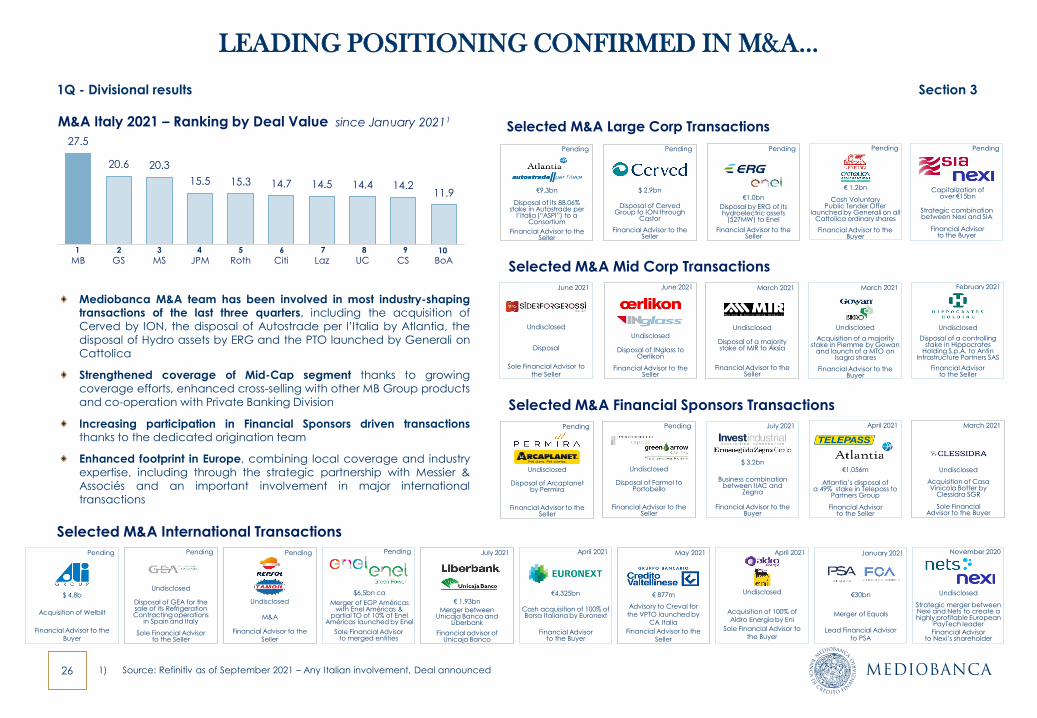
Mediobanca M&A team has been involved in most industry-shapingtransactions of the last three quarters, including the acquisition ofCerved by ION, the disposal of Autostrade per l’Italia by Atlantia, thedisposal of Hydro assets by ERG and the PTO launched by Generali onCattolica
Strengthened coverage of Mid-Cap segment thanks to growingcoverage efforts, enhanced cross-selling with other MB Group productsand co-operation with Private Banking Division
Increasing participation in Financial Sponsors driven transactionsthanks to the dedicated origination team
Enhanced footprint in Europe, combining local coverage and industryexpertise, including through the strategic partnership with Messier &Associés and an important involvement in major internationaltransactions
Selected M&A Large Corp Transactions
Selected M&A Mid Corp Transactions
Selected M&A International Transactions
M&A Italy 2021 – Ranking by Deal Value since January 20211
Pending
Financial Advisorto the Buyer
Strategic combination between Nexi and SIA
Capitalization ofover €15bn
April 2021
Financial Advisorto the Seller
Atlantia’s disposal of a 49% stake in Telepass to
Partners Group
€1,056m
February 2021
Financial Advisorto the Seller
Disposal of a controlling stake in Hippocrates
Holding S.p.A. to AntinInfrastructure Partners SAS
Undisclosed
April 2021
Financial Advisorto the Buyer
Cash acquisition of 100% of Borsa Italiana by Euronext
€4.325bn
November 2020
Financial Advisorto Nexi’s shareholder
Strategic merger between Nexi and Nets to create a highly profitable European
PayTech leader
Undisclosed
Pending
Sole Financial Advisorto merged entities
Merger of EGP Américaswith Enel Américas &
partial TO of 10% of Enel Américas launched by Enel
$6,5bn ca
January 2021
Lead Financial Advisorto PSA
Merger of Equals
€30bn
March 2021
Financial Advisor to the Buyer
Acquisition of a majority stake in Piemme by Gowan
and launch of a MTO on Isagro shares
Undisclosed
July 2021
€ 1.93bn
Merger between Unicaja Banco and
Liberbank
Financial advisor of Unicaja Banco
March 2021
Undisclosed
Disposal of a majority stake of MIR to Aksìa
Financial Advisor to the Seller
1) Source: Refinitiv as of September 2021 – Any Italian involvement, Deal announced
27.5
20.6 20.3
15.5 15.3 14.7 14.5 14.4 14.211.9
MB GS MS JPM Roth Citi Laz UC CS BoA
April 2021
Sole Financial Advisor to the Buyer
Acquisition of 100% of Aldro Energìa by Eni
Undisclosed
Pending
Undisclosed
M&A
Financial Advisor to the Seller
May 2021
€ 877m
Advisory to Creval for the VPTO launched by
CA Italia
Financial Advisor to the Seller
2 3 4 5 6 7 8 9 101
Selected M&A Financial Sponsors Transactions
Pending
€9.3bn
Disposal of its 88.06% stake in Autostrade per
l’Italia (“ASPI”) to a Consortium
Financial Advisor to the Seller
Pending
Undisclosed
Disposal of Arcaplanetby Permira
Financial Advisor to the Seller
June 2021
Sole Financial Advisor to the Seller
Disposal
Undisclosed
July 2021
$ 3.2bn
Business combination between IIAC and
Zegna
Financial Advisor to the Buyer
Pending
€1.0bn
Disposal by ERG of its hydroelectric assets
(527MW) to Enel
Financial Advisor to the Seller
Pending
Financial Advisor to the Buyer
Cash Voluntary Public Tender Offer
launched by Generali on all Cattolica ordinary shares
€ 1.2bn
Pending
Undisclosed
Disposal of GEA for the sale of its Refrigeration Contracting operations
in Spain and Italy
Sole Financial Advisor to the Seller
Pending
$ 4.8b
Acquisition of Welbilt
Financial Advisor to the Buyer
March 2021
Undisclosed
Acquisition of Casa Vinicola Botter by
Clessidra SGR
Sole Financial Advisor to the Buyer
June 2021
Undisclosed
Disposal of INglass to Oerlikon
Financial Advisor to the Seller
Pending
$ 2.9bn
Disposal of CervedGroup to ION through
Castor
Financial Advisor to the Seller
Pending
Undisclosed
Disposal of Farmol to Portobello
Financial Advisor to the Seller
1Q - Divisional results Section 3
27
…AND IN ECM AND DCM
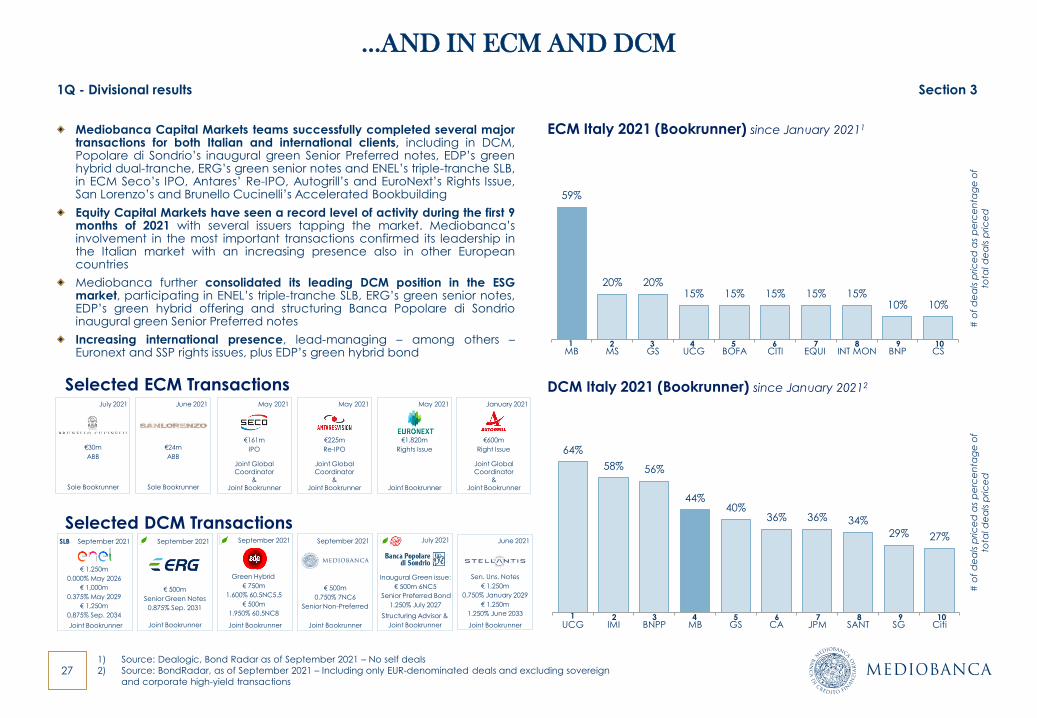
Mediobanca Capital Markets teams successfully completed several majortransactions for both Italian and international clients, including in DCM,Popolare di Sondrio’s inaugural green Senior Preferred notes, EDP’s greenhybrid dual-tranche, ERG’s green senior notes and ENEL’s triple-tranche SLB,in ECM Seco’s IPO, Antares’ Re-IPO, Autogrill’s and EuroNext’s Rights Issue,San Lorenzo’s and Brunello Cucinelli’s Accelerated Bookbuilding
Equity Capital Markets have seen a record level of activity during the first 9months of 2021 with several issuers tapping the market. Mediobanca’sinvolvement in the most important transactions confirmed its leadership inthe Italian market with an increasing presence also in other Europeancountries
Mediobanca further consolidated its leading DCM position in the ESGmarket, participating in ENEL’s triple-tranche SLB, ERG’s green senior notes,EDP’s green hybrid offering and structuring Banca Popolare di Sondrioinaugural green Senior Preferred notes
Increasing international presence, lead-managing – among others –Euronext and SSP rights issues, plus EDP’s green hybrid bond
1
1) Source: Dealogic, Bond Radar as of September 2021 – No self deals
2) Source: BondRadar, as of September 2021 – Including only EUR-denominated deals and excluding sovereign
and corporate high-yield transactions
ECM Italy 2021 (Bookrunner) since January 20211
# o
f d
ea
ls p
ric
ed
as
pe
rce
nta
ge
of
tota
l d
ea
ls p
ric
ed
59%
20% 20%15% 15% 15% 15% 15%
10% 10%
MB MS GS UCG BOFA CITI EQUI INT MON BNP CS2 3 4 5 6 7 8 9 10
64%
58% 56%
44%40%
36% 36% 34%
29% 27%
UCG IMI BNPP MB GS CA JPM SANT SG Citi
DCM Italy 2021 (Bookrunner) since January 20212
# o
f d
ea
ls p
ric
ed
as
pe
rce
nta
ge
of
tota
l d
ea
ls p
ric
ed
2 3 4 5 6 7 8 9 101
Selected DCM TransactionsSeptember 2021
Joint Bookrunner
Green Hybrid
€ 750m
1.600% 60.5NC5.5
€ 500m
1.950% 60.5NC8
July 2021
Structuring Advisor &
Joint Bookrunner
Inaugural Green issue:
€ 500m 6NC5
Senior Preferred Bond
1.250% July 2027
June 2021
Joint Bookrunner
Sen. Uns. Notes
€ 1,250m
0.750% January 2029
€ 1,250m
1.250% June 2033
September 2021
Joint Bookrunner
€ 1,250m
0.000% May 2026
€ 1,000m
0.375% May 2029
€ 1,250m
0.875% Sep. 2034
SLB September 2021
Joint Bookrunner
€ 500m
0.750% 7NC6
Senior Non-Preferred
September 2021
Joint Bookrunner
€ 500m
Senior Green Notes
0.875% Sep. 2031
July 2021
€30m
ABB
Sole Bookrunner
Selected ECM TransactionsMay 2021
Joint Global Coordinator
&Joint Bookrunner
€161m
IPO
May 2021
Joint Global Coordinator
&Joint Bookrunner
€225m
Re-IPO
May 2021
€1,820m
Rights Issue
Joint Bookrunner
June 2021
€24m
ABB
Sole Bookrunner
January 2021
€600m
Right Issue
Joint Global Coordinator
&Joint Bookrunner
1Q - Divisional results Section 3
28
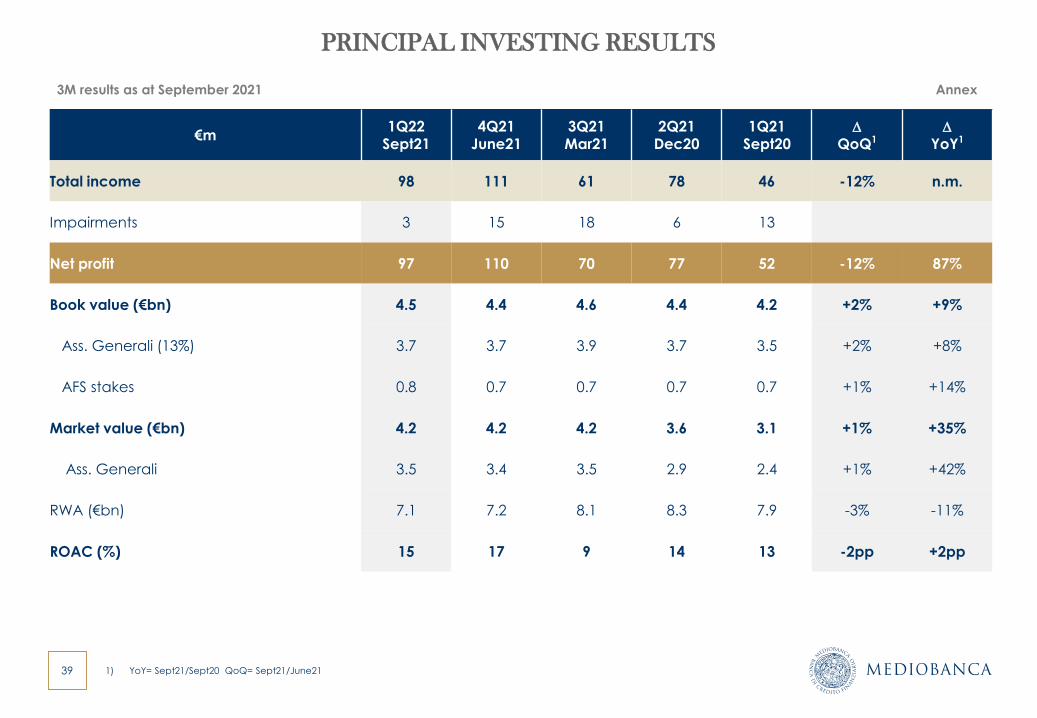
PRINCIPAL INVESTING: POSITIVE CONTRIBUTION
Financial results Highlights
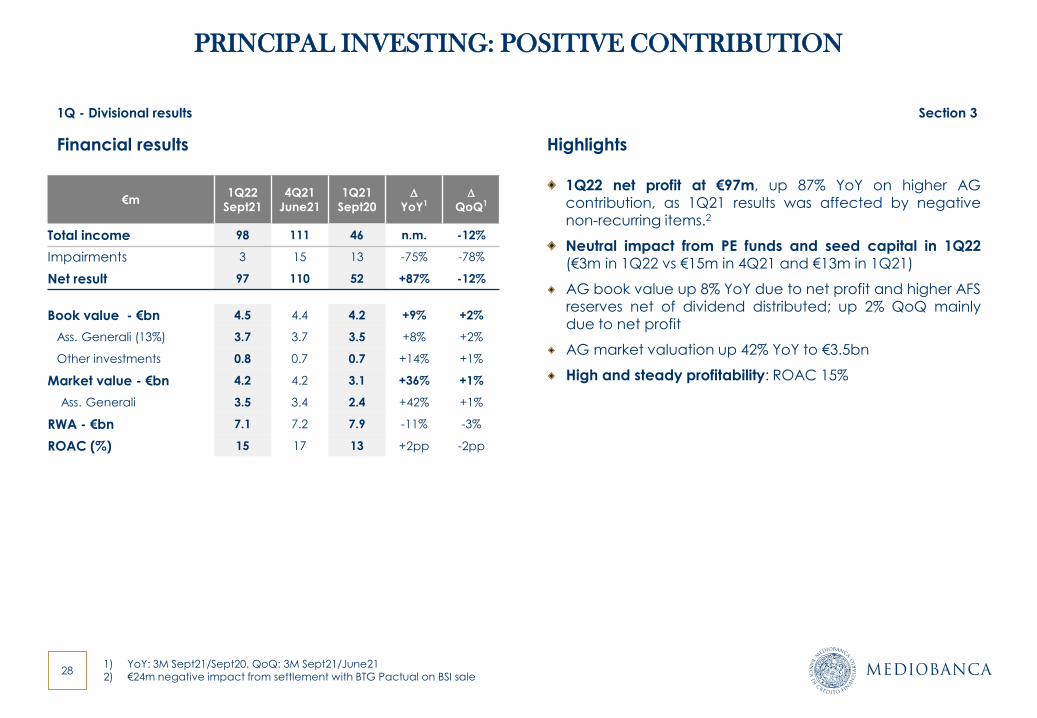
1Q22 net profit at €97m, up 87% YoY on higher AGcontribution, as 1Q21 results was affected by negativenon-recurring items.2
Neutral impact from PE funds and seed capital in 1Q22(€3m in 1Q22 vs €15m in 4Q21 and €13m in 1Q21)
AG book value up 8% YoY due to net profit and higher AFSreserves net of dividend distributed; up 2% QoQ mainlydue to net profit
AG market valuation up 42% YoY to €3.5bn
High and steady profitability: ROAC 15%
€m 1Q22
Sept21
4Q21
June21
1Q21
Sept20D
YoY1D
QoQ1
Total income 98 111 46 n.m. -12%
Impairments 3 15 13 -75% -78%
Net result 97 110 52 +87% -12%
Book value - €bn 4.5 4.4 4.2 +9% +2%
Ass. Generali (13%) 3.7 3.7 3.5 +8% +2%
Other investments 0.8 0.7 0.7 +14% +1%
Market value - €bn 4.2 4.2 3.1 +36% +1%
Ass. Generali 3.5 3.4 2.4 +42% +1%
RWA - €bn 7.1 7.2 7.9 -11% -3%
ROAC (%) 15 17 13 +2pp -2pp
1) YoY: 3M Sept21/Sept20. QoQ: 3M Sept21/June212) €24m negative impact from settlement with BTG Pactual on BSI sale
1Q - Divisional results Section 3
29
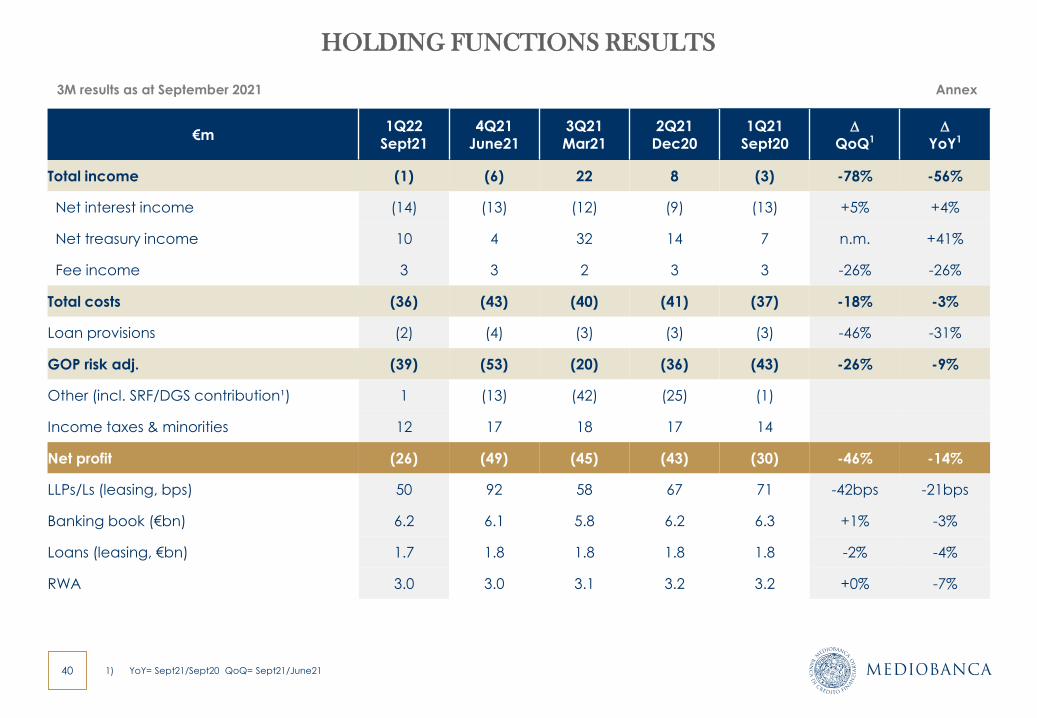
HOLDING FUNCTIONS – IMPROVED RESULTS
Financial results Highlights
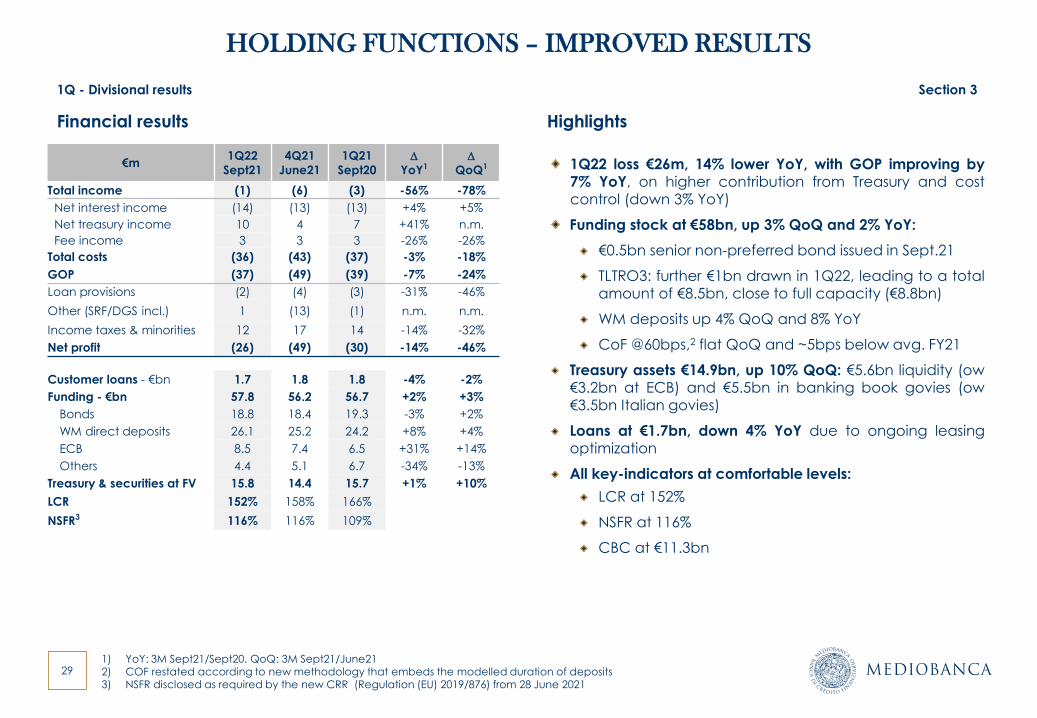
1Q22 loss €26m, 14% lower YoY, with GOP improving by7% YoY, on higher contribution from Treasury and costcontrol (down 3% YoY)
Funding stock at €58bn, up 3% QoQ and 2% YoY:
€0.5bn senior non-preferred bond issued in Sept.21
TLTRO3: further €1bn drawn in 1Q22, leading to a totalamount of €8.5bn, close to full capacity (€8.8bn)
WM deposits up 4% QoQ and 8% YoY
CoF @60bps,2 flat QoQ and ~5bps below avg. FY21
Treasury assets €14.9bn, up 10% QoQ: €5.6bn liquidity (ow€3.2bn at ECB) and €5.5bn in banking book govies (ow€3.5bn Italian govies)
Loans at €1.7bn, down 4% YoY due to ongoing leasingoptimization
All key-indicators at comfortable levels:
LCR at 152%
NSFR at 116%
CBC at €11.3bn
€m 1Q22
Sept21
4Q21
June21
1Q21
Sept20D
YoY1D
QoQ1
Total income (1) (6) (3) -56% -78%
Net interest income (14) (13) (13) +4% +5%
Net treasury income 10 4 7 +41% n.m.
Fee income 3 3 3 -26% -26%
Total costs (36) (43) (37) -3% -18%
GOP (37) (49) (39) -7% -24%
Loan provisions (2) (4) (3) -31% -46%
Other (SRF/DGS incl.) 1 (13) (1) n.m. n.m.
Income taxes & minorities 12 17 14 -14% -32%
Net profit (26) (49) (30) -14% -46%
Customer loans - €bn 1.7 1.8 1.8 -4% -2%
Funding - €bn 57.8 56.2 56.7 +2% +3%
Bonds 18.8 18.4 19.3 -3% +2%
WM direct deposits 26.1 25.2 24.2 +8% +4%
ECB 8.5 7.4 6.5 +31% +14%
Others 4.4 5.1 6.7 -34% -13%
Treasury & securities at FV 15.8 14.4 15.7 +1% +10%
LCR 152% 158% 166%
NSFR3 116% 116% 109%
1) YoY: 3M Sept21/Sept20. QoQ: 3M Sept21/June212) COF restated according to new methodology that embeds the modelled duration of deposits 3) NSFR disclosed as required by the new CRR (Regulation (EU) 2019/876) from 28 June 2021
1Q - Divisional results Section 3
Agenda
Section 1. Executive summary
Section 2. 1Q Group results
Section 3. Divisional results
Section 4. Closing remarks
Annexes
1. Divisional results by quarter
2. Glossary
31
CLOSING REMARKS
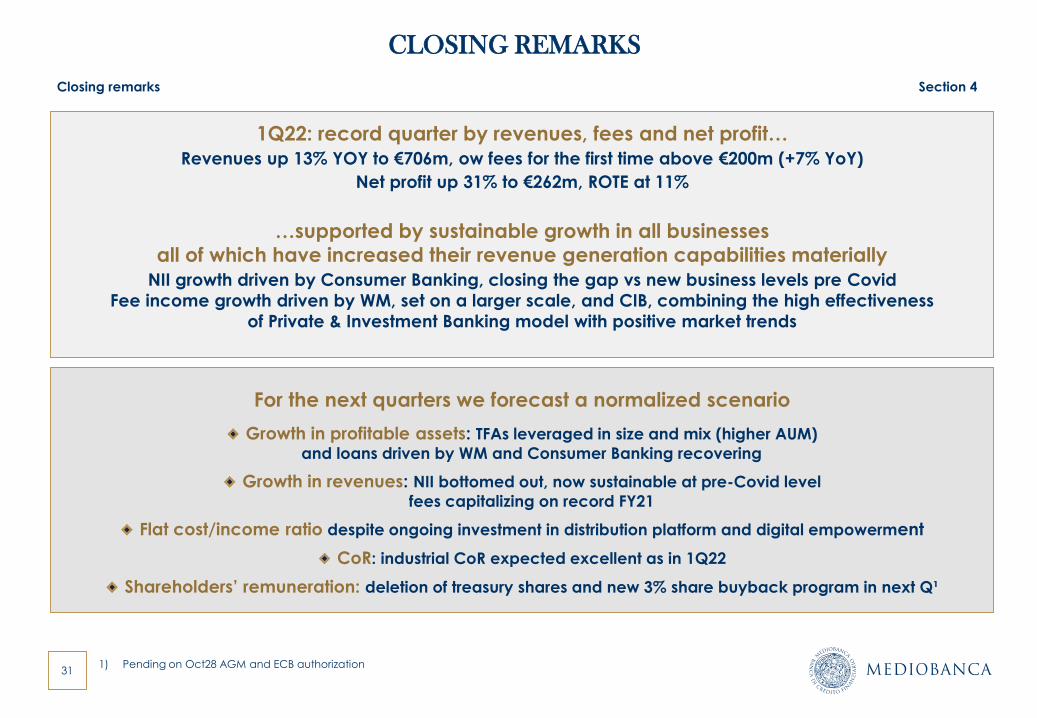
1Q22: record quarter by revenues, fees and net profit…
Revenues up 13% YOY to €706m, ow fees for the first time above €200m (+7% YoY)
Net profit up 31% to €262m, ROTE at 11%
…supported by sustainable growth in all businesses
all of which have increased their revenue generation capabilities materially
NII growth driven by Consumer Banking, closing the gap vs new business levels pre Covid
Fee income growth driven by WM, set on a larger scale, and CIB, combining the high effectiveness
of Private & Investment Banking model with positive market trends
For the next quarters we forecast a normalized scenario
Growth in profitable assets: TFAs leveraged in size and mix (higher AUM)
and loans driven by WM and Consumer Banking recovering
Growth in revenues: NII bottomed out, now sustainable at pre-Covid level
fees capitalizing on record FY21
Flat cost/income ratio despite ongoing investment in distribution platform and digital empowerment
CoR: industrial CoR expected excellent as in 1Q22
Shareholders’ remuneration: deletion of treasury shares and new 3% share buyback program in next Q¹
Closing remarks Section 4
1) Pending on Oct28 AGM and ECB authorization

MEDIOBANCA
1Q/3M RESULTS AS AT
30 SEPTEMBER 2021
Milan, 27 October 2021
Agenda
Section 1. Executive summary
Section 2. 1Q Group results
Section 3. Divisional results
Section 5. Closing remarks
Annexes
1. Divisional results by quarter
2. Glossary
34
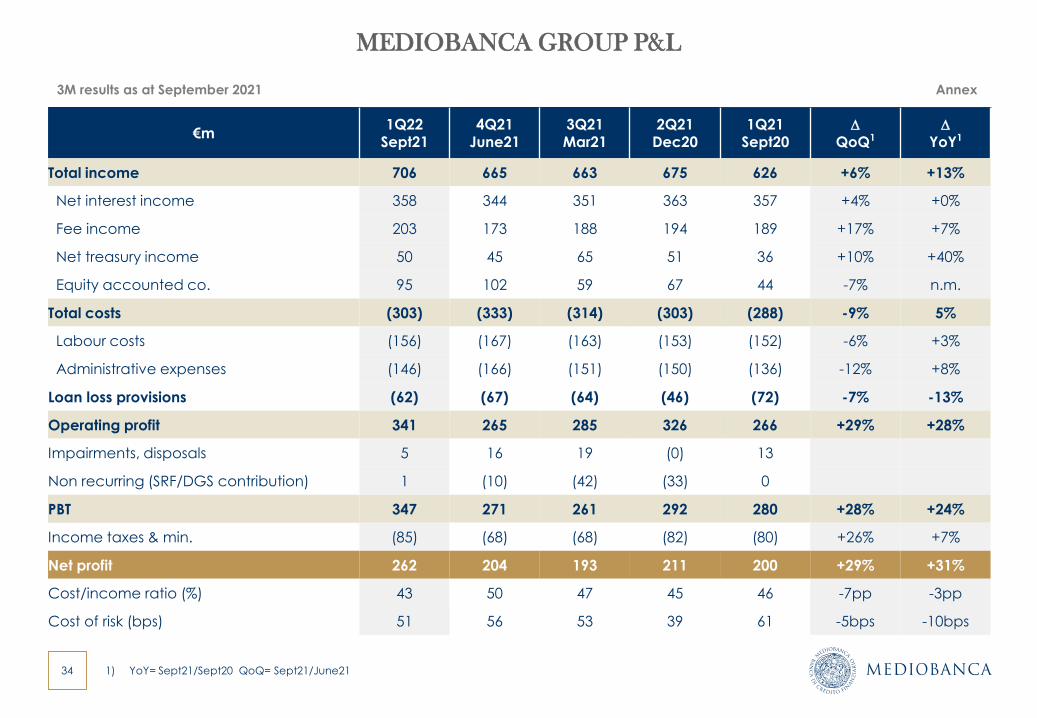
MEDIOBANCA GROUP P&L
3M results as at September 2021 Annex
1) YoY= Sept21/Sept20 QoQ= Sept21/June21
€m 1Q22
Sept214Q21
June213Q21Mar21
2Q21Dec20
1Q21Sept20
D
QoQ1D
YoY1
Total income 706 665 663 675 626 +6% +13%
Net interest income 358 344 351 363 357 +4% +0%
Fee income 203 173 188 194 189 +17% +7%
Net treasury income 50 45 65 51 36 +10% +40%
Equity accounted co. 95 102 59 67 44 -7% n.m.
Total costs (303) (333) (314) (303) (288) -9% 5%
Labour costs (156) (167) (163) (153) (152) -6% +3%
Administrative expenses (146) (166) (151) (150) (136) -12% +8%
Loan loss provisions (62) (67) (64) (46) (72) -7% -13%
Operating profit 341 265 285 326 266 +29% +28%
Impairments, disposals 5 16 19 (0) 13
Non recurring (SRF/DGS contribution) 1 (10) (42) (33) 0
PBT 347 271 261 292 280 +28% +24%
Income taxes & min. (85) (68) (68) (82) (80) +26% +7%
Net profit 262 204 193 211 200 +29% +31%
Cost/income ratio (%) 43 50 47 45 46 -7pp -3pp
Cost of risk (bps) 51 56 53 39 61 -5bps -10bps
35
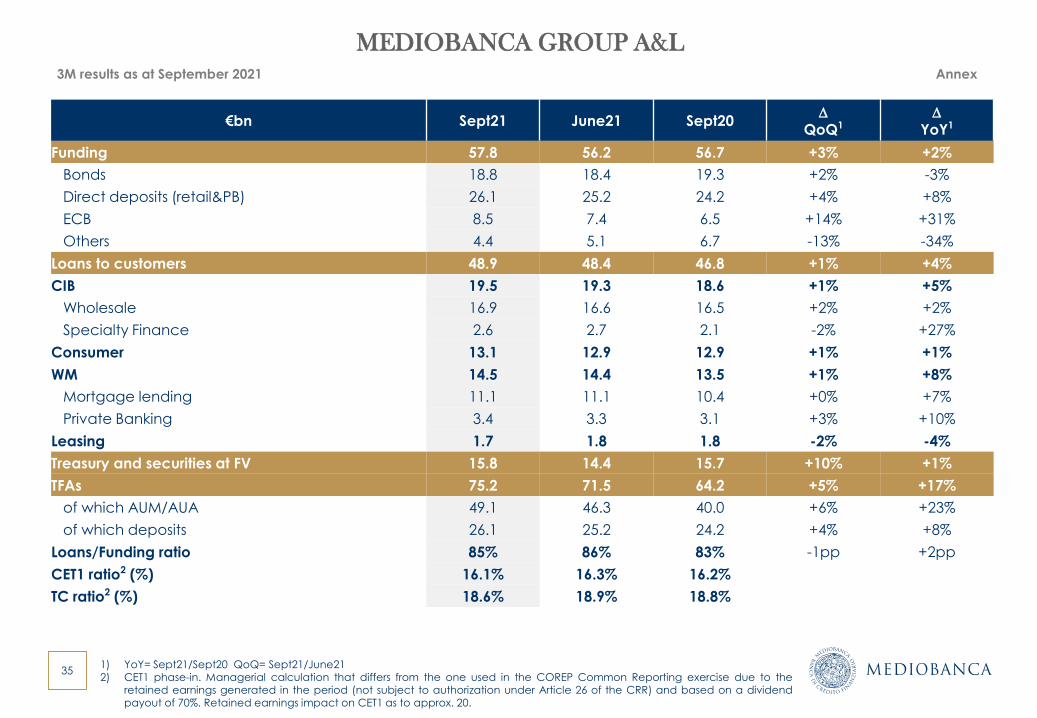
MEDIOBANCA GROUP A&L
€bn Sept21 June21 Sept20D
QoQ1D
YoY1
Funding 57.8 56.2 56.7 +3% +2%
Bonds 18.8 18.4 19.3 +2% -3%
Direct deposits (retail&PB) 26.1 25.2 24.2 +4% +8%
ECB 8.5 7.4 6.5 +14% +31%
Others 4.4 5.1 6.7 -13% -34%
Loans to customers 48.9 48.4 46.8 +1% +4%
CIB 19.5 19.3 18.6 +1% +5%
Wholesale 16.9 16.6 16.5 +2% +2%
Specialty Finance 2.6 2.7 2.1 -2% +27%
Consumer 13.1 12.9 12.9 +1% +1%
WM 14.5 14.4 13.5 +1% +8%
Mortgage lending 11.1 11.1 10.4 +0% +7%
Private Banking 3.4 3.3 3.1 +3% +10%
Leasing 1.7 1.8 1.8 -2% -4%
Treasury and securities at FV 15.8 14.4 15.7 +10% +1%
TFAs 75.2 71.5 64.2 +5% +17%
of which AUM/AUA 49.1 46.3 40.0 +6% +23%
of which deposits 26.1 25.2 24.2 +4% +8%
Loans/Funding ratio 85% 86% 83% -1pp +2pp
CET1 ratio2 (%) 16.1% 16.3% 16.2%
TC ratio2 (%) 18.6% 18.9% 18.8%
3M results as at September 2021 Annex
1) YoY= Sept21/Sept20 QoQ= Sept21/June212) CET1 phase-in. Managerial calculation that differs from the one used in the COREP Common Reporting exercise due to the
retained earnings generated in the period (not subject to authorization under Article 26 of the CRR) and based on a dividendpayout of 70%. Retained earnings impact on CET1 as to approx. 20.
36
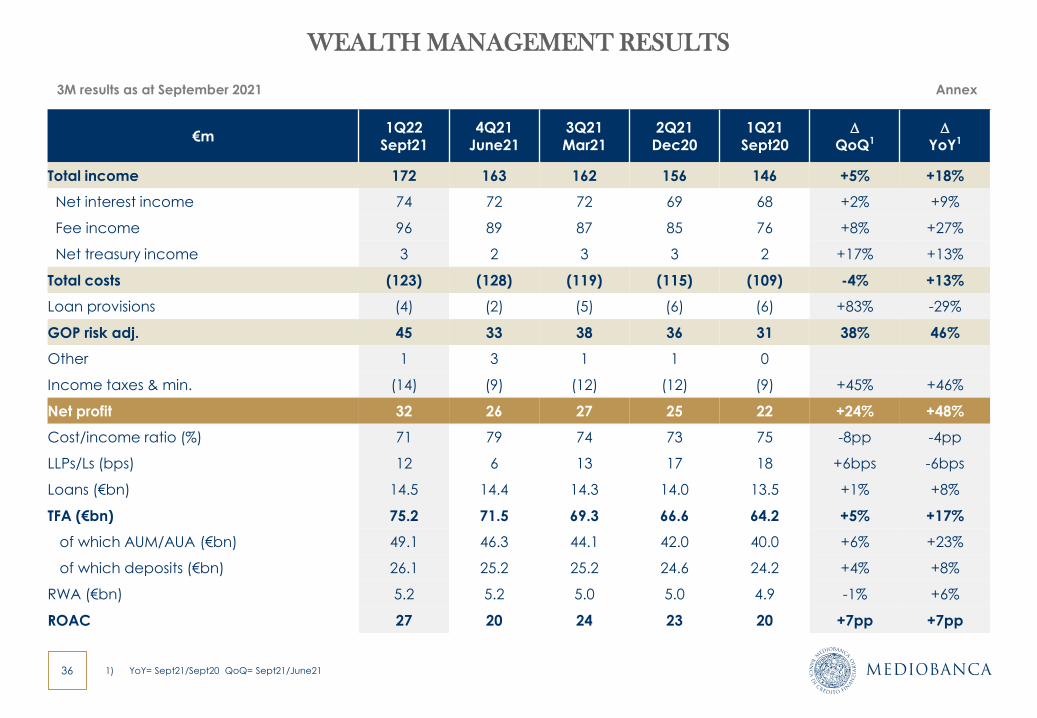
WEALTH MANAGEMENT RESULTS
3M results as at September 2021 Annex
1) YoY= Sept21/Sept20 QoQ= Sept21/June21
€m 1Q22
Sept214Q21
June213Q21Mar21
2Q21Dec20
1Q21Sept20
D
QoQ1D
YoY1
Total income 172 163 162 156 146 +5% +18%
Net interest income 74 72 72 69 68 +2% +9%
Fee income 96 89 87 85 76 +8% +27%
Net treasury income 3 2 3 3 2 +17% +13%
Total costs (123) (128) (119) (115) (109) -4% +13%
Loan provisions (4) (2) (5) (6) (6) +83% -29%
GOP risk adj. 45 33 38 36 31 38% 46%
Other 1 3 1 1 0
Income taxes & min. (14) (9) (12) (12) (9) +45% +46%
Net profit 32 26 27 25 22 +24% +48%
Cost/income ratio (%) 71 79 74 73 75 -8pp -4pp
LLPs/Ls (bps) 12 6 13 17 18 +6bps -6bps
Loans (€bn) 14.5 14.4 14.3 14.0 13.5 +1% +8%
TFA (€bn) 75.2 71.5 69.3 66.6 64.2 +5% +17%
of which AUM/AUA (€bn) 49.1 46.3 44.1 42.0 40.0 +6% +23%
of which deposits (€bn) 26.1 25.2 25.2 24.6 24.2 +4% +8%
RWA (€bn) 5.2 5.2 5.0 5.0 4.9 -1% +6%
ROAC 27 20 24 23 20 +7pp +7pp
37
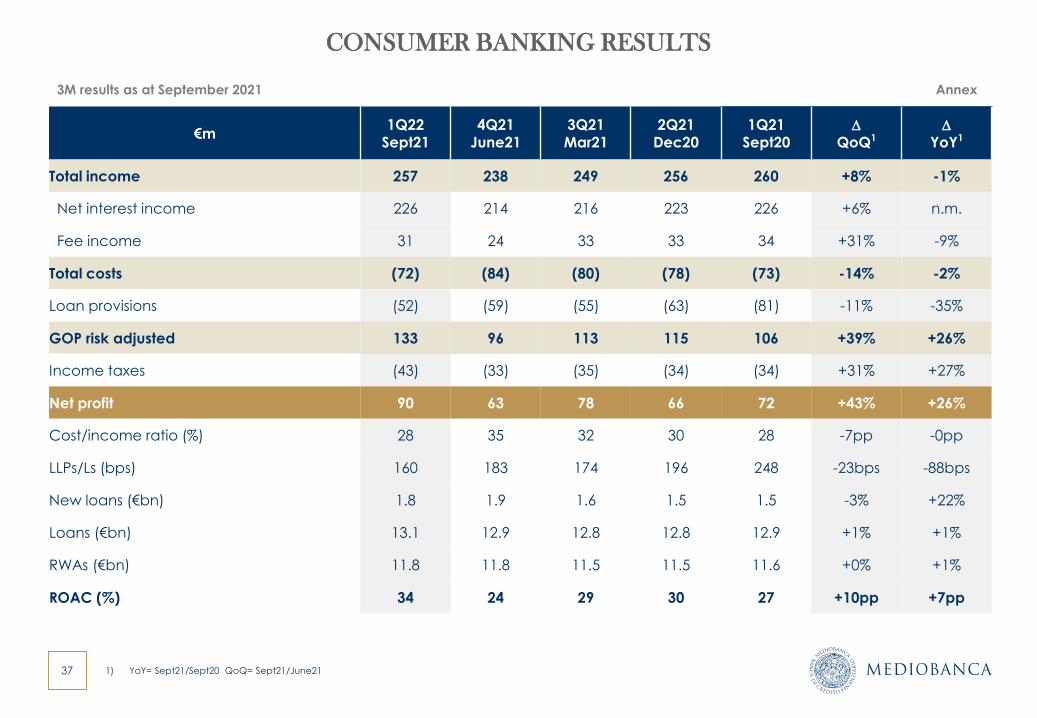
CONSUMER BANKING RESULTS
3M results as at September 2021 Annex
1) YoY= Sept21/Sept20 QoQ= Sept21/June21
€m 1Q22
Sept214Q21
June213Q21Mar21
2Q21Dec20
1Q21Sept20
D
QoQ1D
YoY1
Total income 257 238 249 256 260 +8% -1%
Net interest income 226 214 216 223 226 +6% n.m.
Fee income 31 24 33 33 34 +31% -9%
Total costs (72) (84) (80) (78) (73) -14% -2%
Loan provisions (52) (59) (55) (63) (81) -11% -35%
GOP risk adjusted 133 96 113 115 106 +39% +26%
Income taxes (43) (33) (35) (34) (34) +31% +27%
Net profit 90 63 78 66 72 +43% +26%
Cost/income ratio (%) 28 35 32 30 28 -7pp -0pp
LLPs/Ls (bps) 160 183 174 196 248 -23bps -88bps
New loans (€bn) 1.8 1.9 1.6 1.5 1.5 -3% +22%
Loans (€bn) 13.1 12.9 12.8 12.8 12.9 +1% +1%
RWAs (€bn) 11.8 11.8 11.5 11.5 11.6 +0% +1%
ROAC (%) 34 24 29 30 27 +10pp +7pp
38
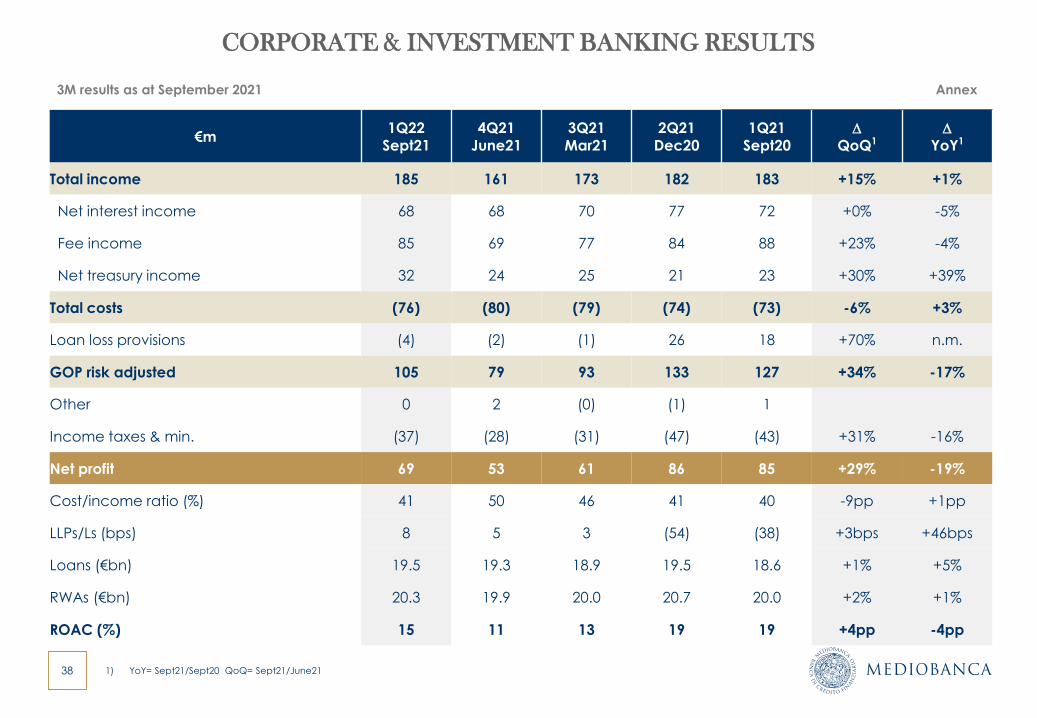
CORPORATE & INVESTMENT BANKING RESULTS
3M results as at September 2021 Annex
1) YoY= Sept21/Sept20 QoQ= Sept21/June21
€m 1Q22
Sept214Q21
June213Q21Mar21
2Q21Dec20
1Q21Sept20
D
QoQ1D
YoY1
Total income 185 161 173 182 183 +15% +1%
Net interest income 68 68 70 77 72 +0% -5%
Fee income 85 69 77 84 88 +23% -4%
Net treasury income 32 24 25 21 23 +30% +39%
Total costs (76) (80) (79) (74) (73) -6% +3%
Loan loss provisions (4) (2) (1) 26 18 +70% n.m.
GOP risk adjusted 105 79 93 133 127 +34% -17%
Other 0 2 (0) (1) 1
Income taxes & min. (37) (28) (31) (47) (43) +31% -16%
Net profit 69 53 61 86 85 +29% -19%
Cost/income ratio (%) 41 50 46 41 40 -9pp +1pp
LLPs/Ls (bps) 8 5 3 (54) (38) +3bps +46bps
Loans (€bn) 19.5 19.3 18.9 19.5 18.6 +1% +5%
RWAs (€bn) 20.3 19.9 20.0 20.7 20.0 +2% +1%
ROAC (%) 15 11 13 19 19 +4pp -4pp
39
PRINCIPAL INVESTING RESULTS
3M results as at September 2021 Annex
1) YoY= Sept21/Sept20 QoQ= Sept21/June21
€m 1Q22
Sept214Q21
June213Q21Mar21
2Q21Dec20
1Q21Sept20
D
QoQ1D
YoY1
Total income 98 111 61 78 46 -12% n.m.
Impairments 3 15 18 6 13
Net profit 97 110 70 77 52 -12% 87%
Book value (€bn) 4.5 4.4 4.6 4.4 4.2 +2% +9%
Ass. Generali (13%) 3.7 3.7 3.9 3.7 3.5 +2% +8%
AFS stakes 0.8 0.7 0.7 0.7 0.7 +1% +14%
Market value (€bn) 4.2 4.2 4.2 3.6 3.1 +1% +35%
Ass. Generali 3.5 3.4 3.5 2.9 2.4 +1% +42%
RWA (€bn) 7.1 7.2 8.1 8.3 7.9 -3% -11%
ROAC (%) 15 17 9 14 13 -2pp +2pp
40
HOLDING FUNCTIONS RESULTS
3M results as at September 2021 Annex
1) YoY= Sept21/Sept20 QoQ= Sept21/June21
€m 1Q22
Sept21
4Q21June21
3Q21Mar21
2Q21Dec20
1Q21Sept20
D
QoQ1D
YoY1
Total income (1) (6) 22 8 (3) -78% -56%
Net interest income (14) (13) (12) (9) (13) +5% +4%
Net treasury income 10 4 32 14 7 n.m. +41%
Fee income 3 3 2 3 3 -26% -26%
Total costs (36) (43) (40) (41) (37) -18% -3%
Loan provisions (2) (4) (3) (3) (3) -46% -31%
GOP risk adj. (39) (53) (20) (36) (43) -26% -9%
Other (incl. SRF/DGS contribution¹) 1 (13) (42) (25) (1)
Income taxes & minorities 12 17 18 17 14
Net profit (26) (49) (45) (43) (30) -46% -14%
LLPs/Ls (leasing, bps) 50 92 58 67 71 -42bps -21bps
Banking book (€bn) 6.2 6.1 5.8 6.2 6.3 +1% -3%
Loans (leasing, €bn) 1.7 1.8 1.8 1.8 1.8 -2% -4%
RWA 3.0 3.0 3.1 3.2 3.2 +0% -7%
41
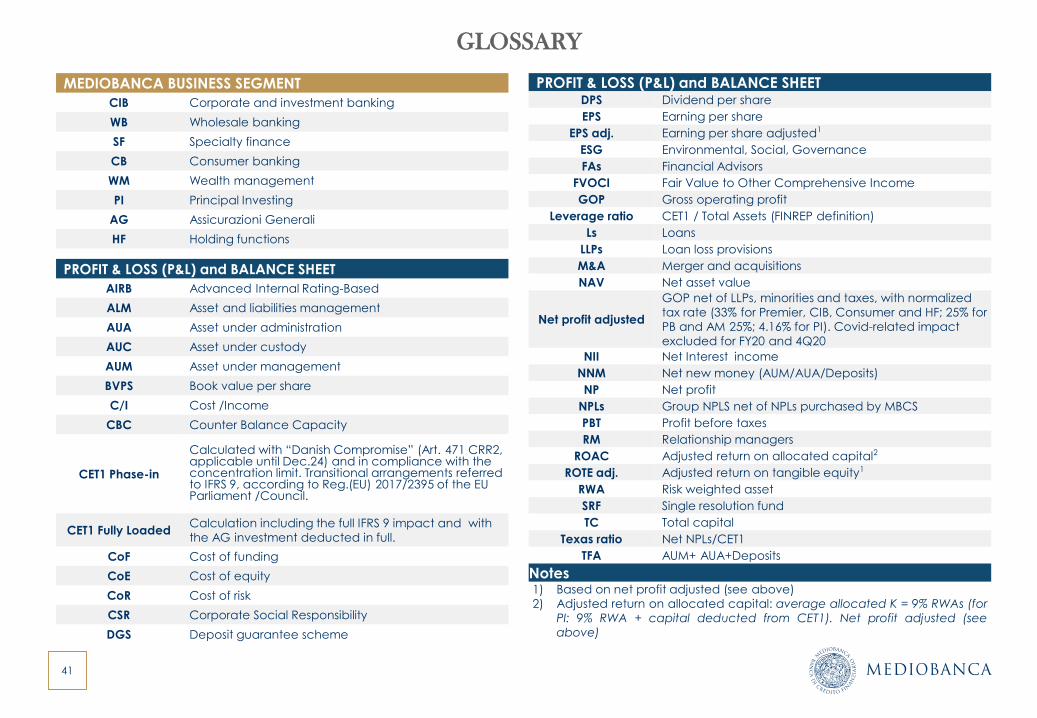
GLOSSARY
MEDIOBANCA BUSINESS SEGMENT
CIB Corporate and investment banking
WB Wholesale banking
SF Specialty finance
CB Consumer banking
WM Wealth management
PI Principal Investing
AG Assicurazioni Generali
HF Holding functions
PROFIT & LOSS (P&L) and BALANCE SHEET
AIRB Advanced Internal Rating-Based
ALM Asset and liabilities management
AUA Asset under administration
AUC Asset under custody
AUM Asset under management
BVPS Book value per share
C/I Cost /Income
CBC Counter Balance Capacity
CET1 Phase-in
Calculated with “Danish Compromise” (Art. 471 CRR2, applicable until Dec.24) and in compliance with the concentration limit. Transitional arrangements referred to IFRS 9, according to Reg.(EU) 2017/2395 of the EU Parliament /Council.
CET1 Fully LoadedCalculation including the full IFRS 9 impact and with
the AG investment deducted in full.
CoF Cost of funding
CoE Cost of equity
CoR Cost of risk
CSR Corporate Social Responsibility
DGS Deposit guarantee scheme
PROFIT & LOSS (P&L) and BALANCE SHEETDPS Dividend per share
EPS Earning per share
EPS adj. Earning per share adjusted1
ESG Environmental, Social, Governance
FAs Financial Advisors
FVOCI Fair Value to Other Comprehensive Income
GOP Gross operating profit
Leverage ratio CET1 / Total Assets (FINREP definition)
Ls Loans
LLPs Loan loss provisions
M&A Merger and acquisitions
NAV Net asset value
Net profit adjusted
GOP net of LLPs, minorities and taxes, with normalized
tax rate (33% for Premier, CIB, Consumer and HF; 25% for
PB and AM 25%; 4.16% for PI). Covid-related impact
excluded for FY20 and 4Q20
NII Net Interest income
NNM Net new money (AUM/AUA/Deposits)
NP Net profit
NPLs Group NPLS net of NPLs purchased by MBCS
PBT Profit before taxes
RM Relationship managers
ROAC Adjusted return on allocated capital2
ROTE adj. Adjusted return on tangible equity1
RWA Risk weighted asset
SRF Single resolution fund
TC Total capital
Texas ratio Net NPLs/CET1
TFA AUM+ AUA+Deposits
Notes1) Based on net profit adjusted (see above)
2) Adjusted return on allocated capital: average allocated K = 9% RWAs (for
PI: 9% RWA + capital deducted from CET1). Net profit adjusted (see
above)
42
DISCLAIMER & DECLARATION OF HEAD OF FINANCIAL REPORTING
Disclaimer
This document includes certain projections, estimates, forecasts and consequent targets which reflect the current views of
Mediobanca – Banca di Credito Finanziario S.p.A. (the “Company”) with regard to future events (“forward-looking statements”).
These forward-looking statements include, but are not limited to, all statements other than actual data, historical or current,including those regarding the Group’s future financial position and operating results, strategy, plans, objectives and futuredevelopments in the markets where the Group operates or is intending to operate.
All forward-looking statements, based on information available to the Company as of the date hereof, rely on scenarios,assumptions, expectations and projections regarding future events which are subject to uncertainties because dependent onfactors most of which are beyond the Company’s control. Such uncertainties may cause actual results and performances thatdiffer, including materially, from those projected in or implied by the data present; therefore the forward-looking statements arenot a reliable indicator of future performances.
The information and opinions included in this document refer to the date hereof and accordingly may change without notice.The Company, however, undertakes no obligation to publicly update or revise any forward-looking statement, whether as aresult of new information, future events or otherwise, except as may be required by applicable law.
Due to the risks and uncertainties described above, readers are advised not to place undue reliance on such forward-looking
statements as a prediction of actual results. No decision as to whether to execute a contract or subscribe to an investmentshould be based or rely on this document, or any part thereof, or the fact of its having been distributed.
Declaration by Head of Company Financial Reporting
As required by Article 154-bis, paragraph 2 of Italian Legislative Decree 58/98, the undersigned hereby declares that the statedaccounting information contained in this report conforms to the documents, account ledgers and book entries of the company.
Head of Company Financial ReportingEmanuele Flappini

43
INVESTOR CONTACTS
Mediobanca Group
Investor Relations
Piazzetta Cuccia 1, 20121 Milan, Italy
Jessica Spina Tel. no. (0039) 02-8829.860
Luisa Demaria Tel. no. (0039) 02-8829.647
Matteo Carotta Tel. no. (0039) 02-8829.290
Marcella Malpangotto Tel. no. (0039) 02-8829.428
Email: [email protected]
http://www.mediobanca.com