Embed Size (px)
Citation preview
DIRECT RENIN TESTING
Analytical advantages
Clinical usefulness
Endocrine Society Guidelines for Primary Aldosteronism (PA)
Dr Margherita Banci
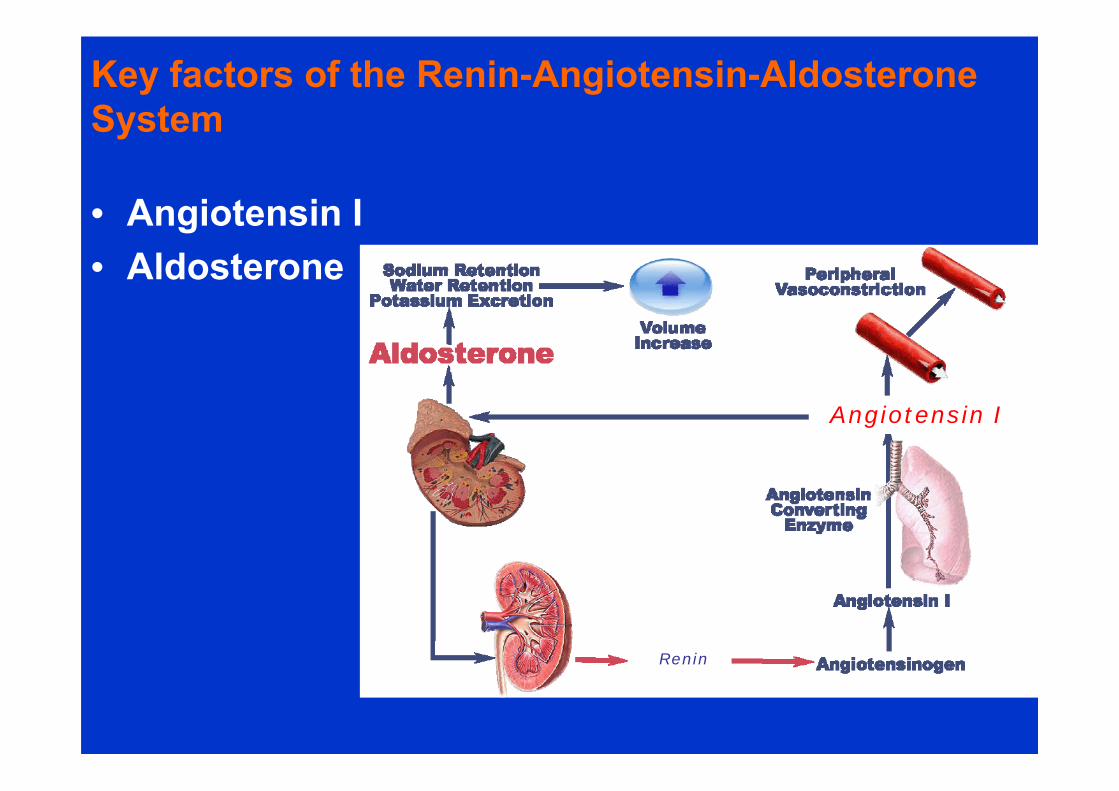
Key factors of the Renin-Angiotensin-AldosteroneSystem
• Angiotensin I• Aldosterone
Renin
Angiotensin I
1299 Mo1299 Mo
00
PRA (ng/ml/h)PRA (ng/ml/h)
00
1010
2020
3030
4040
5050
6060
7070
A II
(pg/
ml)
A II
(pg/
ml)
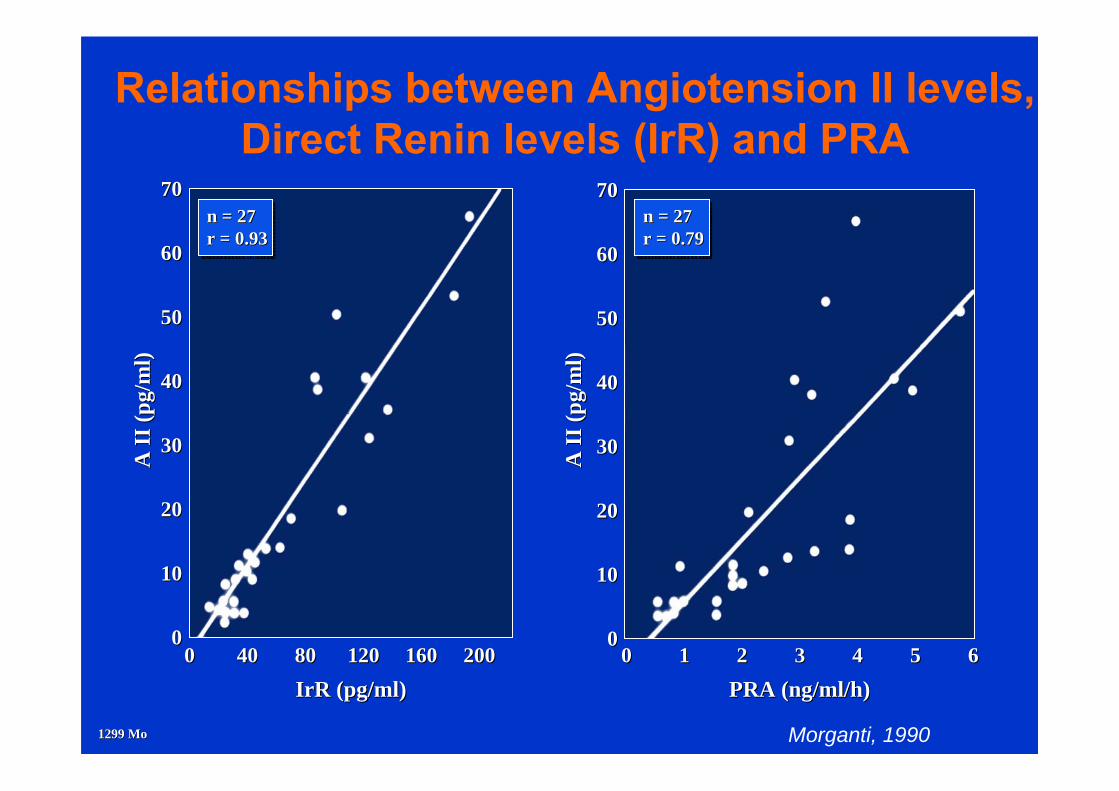
n = 27r = 0.93n = 27n = 27r = 0.93r = 0.93
Relationships between Angiotension II levels,Direct Renin levels (IrR) and PRA
n = 27r = 0.79n = 27n = 27r = 0.79r = 0.79
00
1010
2020
3030
4040
5050
6060
7070
4040 8080 120120 160160 200200
IrRIrR (pg/ml)(pg/ml)
A II
(pg/
ml)
A II
(pg/
ml)
00 11 22 33 44 55 66
Morganti, 1990
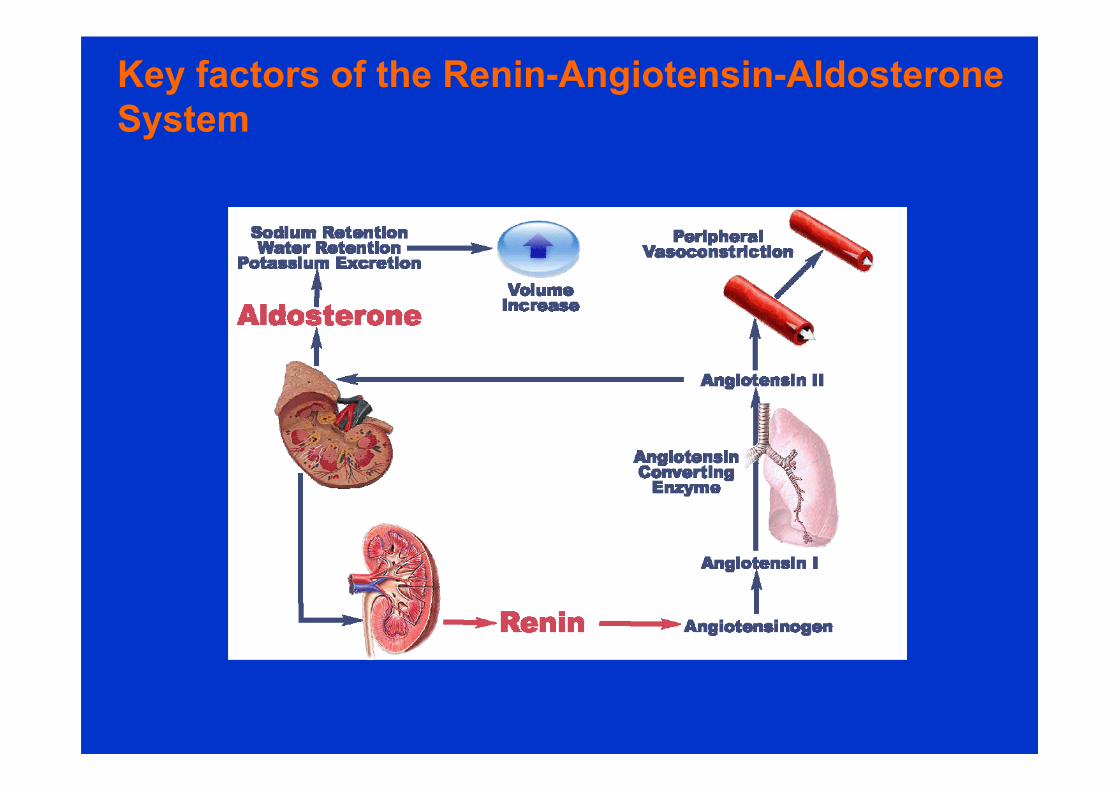
Key factors of the Renin-Angiotensin-AldosteroneSystem
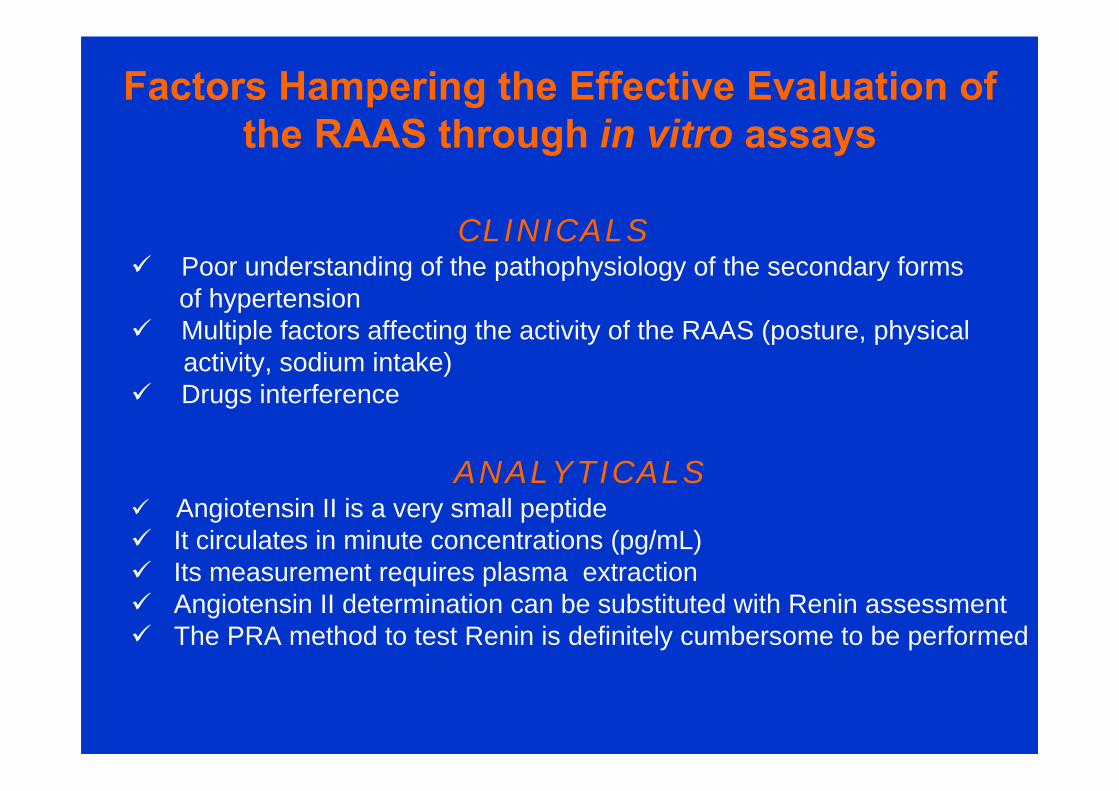
Factors Hampering the Effective Evaluation of the RAAS through in vitro assays
CLINICALS Poor understanding of the pathophysiology of the secondary forms
of hypertension Multiple factors affecting the activity of the RAAS (posture, physical
activity, sodium intake) Drugs interference
ANALYTICALS Angiotensin II is a very small peptide It circulates in minute concentrations (pg/mL) Its measurement requires plasma extraction Angiotensin II determination can be substituted with Renin assessment The PRA method to test Renin is definitely cumbersome to be performed
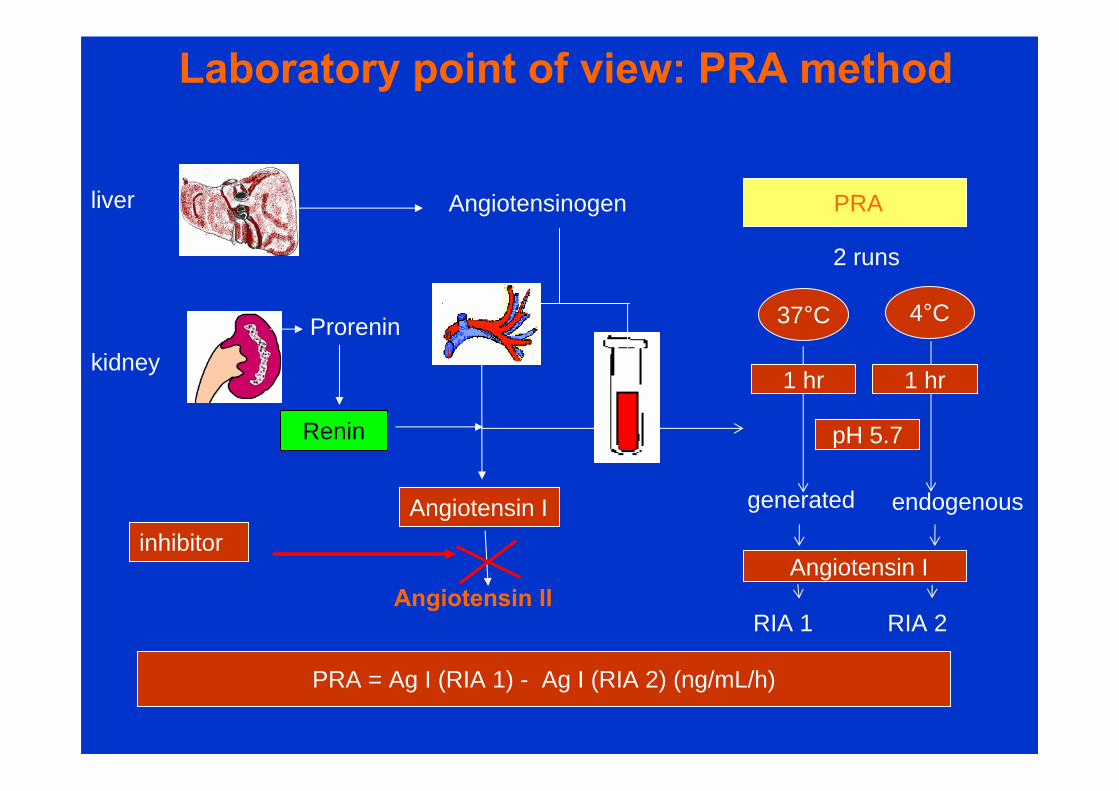
endogenousgenerated
liver
Prorenin
Renin
kidney
Angiotensinogen
Angiotensin I
Angiotensin II
PRA = Ag I (RIA 1) - Ag I (RIA 2) (ng/mL/h)
2 runs
4°C
Angiotensin I
37°C
PRA
1 hr 1 hr
pH 5.7
RIA 1 RIA 2
inhibitor
Laboratory point of view: PRA method
1592 Mo1592 Mo
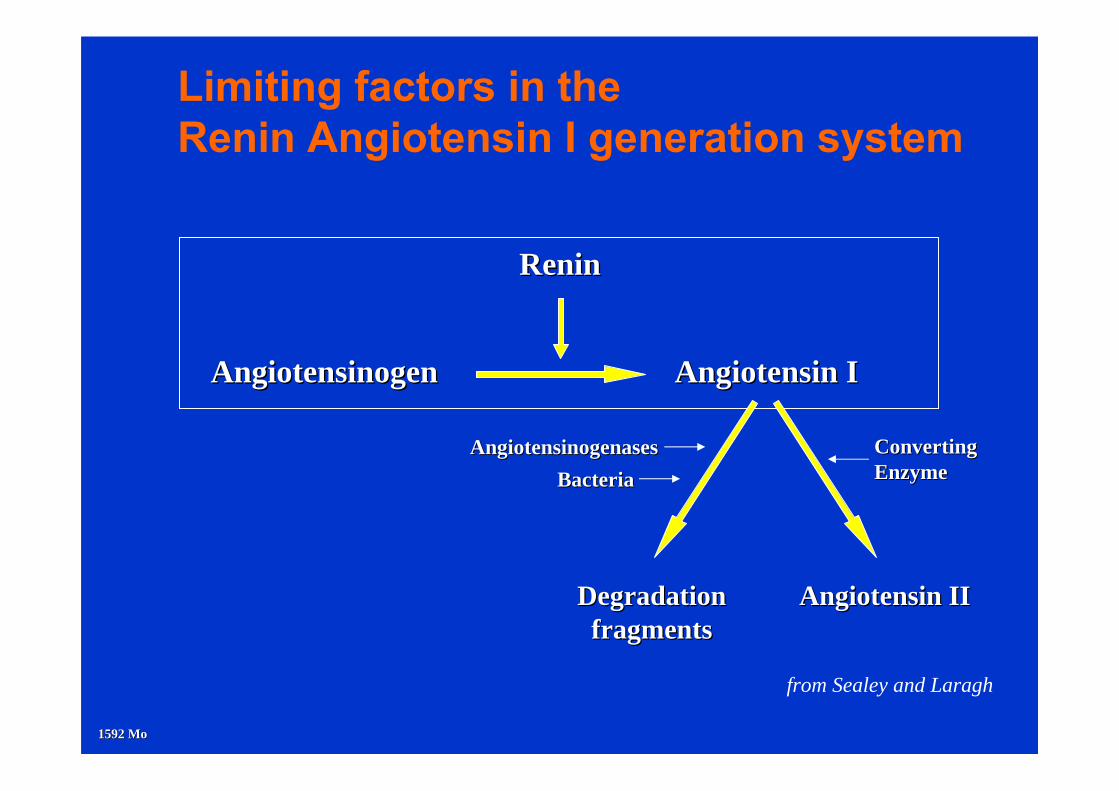
Limiting factors in the Renin Angiotensin I generation system
AngiotensinogenAngiotensinogen
from Sealey and Laragh
Angiotensin IAngiotensin I
ReninRenin
Degradation Degradation fragmentsfragments
Angiotensin IIAngiotensin II
Converting Converting EnzymeEnzymeBacteriaBacteria
AngiotensinogenasesAngiotensinogenases
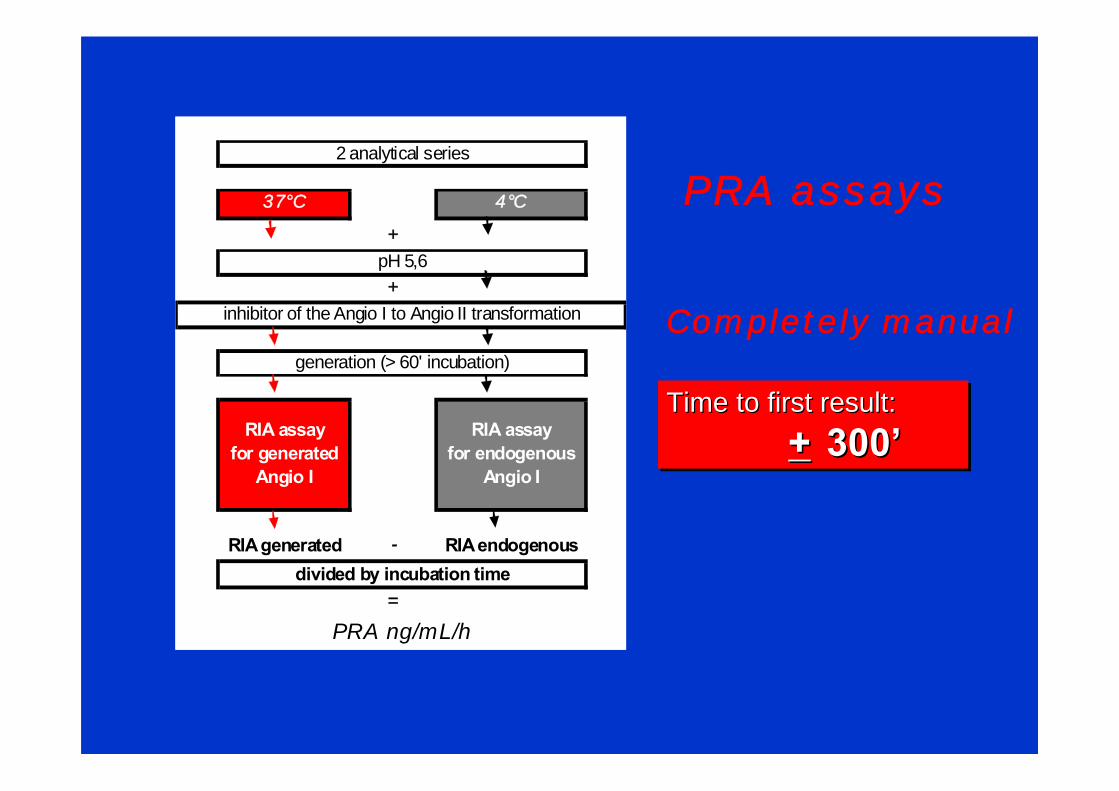
37°C 4°C
+
+
RIA generated - RIA endogenous
=
PRA ng/mL/h
divided by incubation time
generation (> 60' incubation)
2 analytical series
RIA assayfor generated
Angio I
RIA assayfor endogenous
Angio I
pH 5,6
inhibitor of the Angio I to Angio II transformation
PRA assays
Completely manual
Time to first result: + 300’
Time to first result: Time to first result: ++ 300300’’
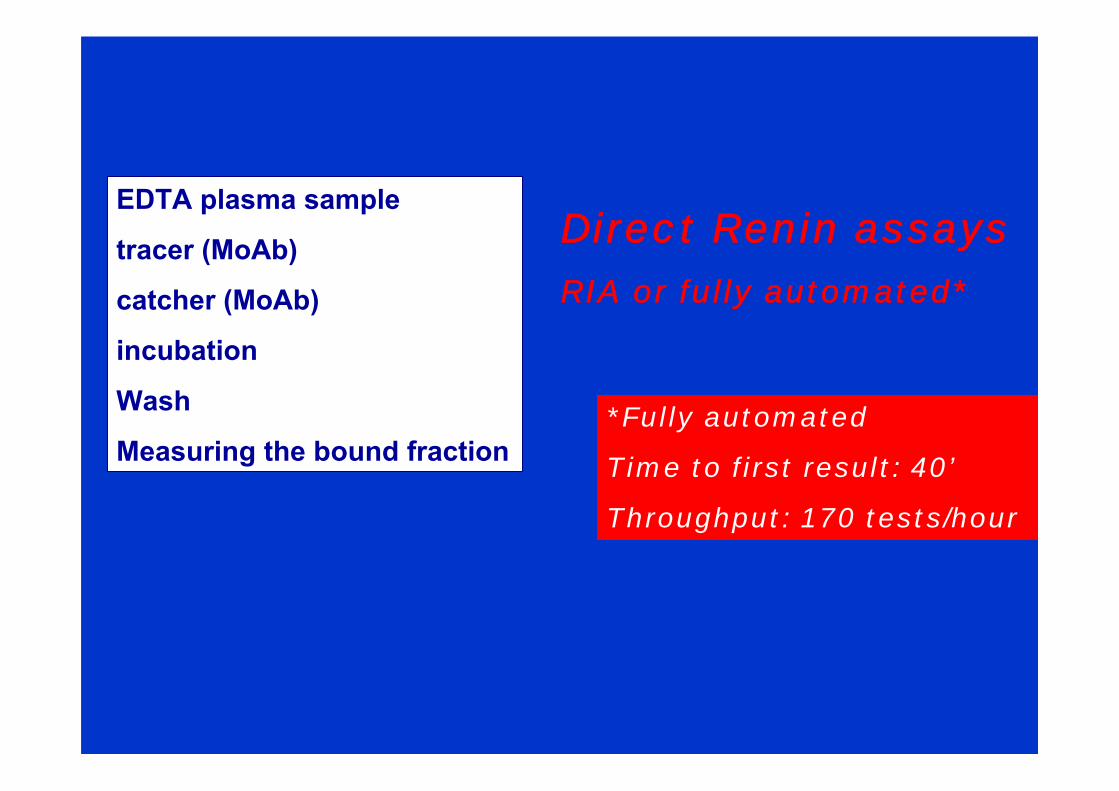
EDTA plasma sample
tracer (MoAb)
catcher (MoAb)
incubation
Wash
Measuring the bound fraction *Fully automated
Time to first result: 40’
Throughput: 170 tests/hour
Direct Renin assaysRIA or fully automated*
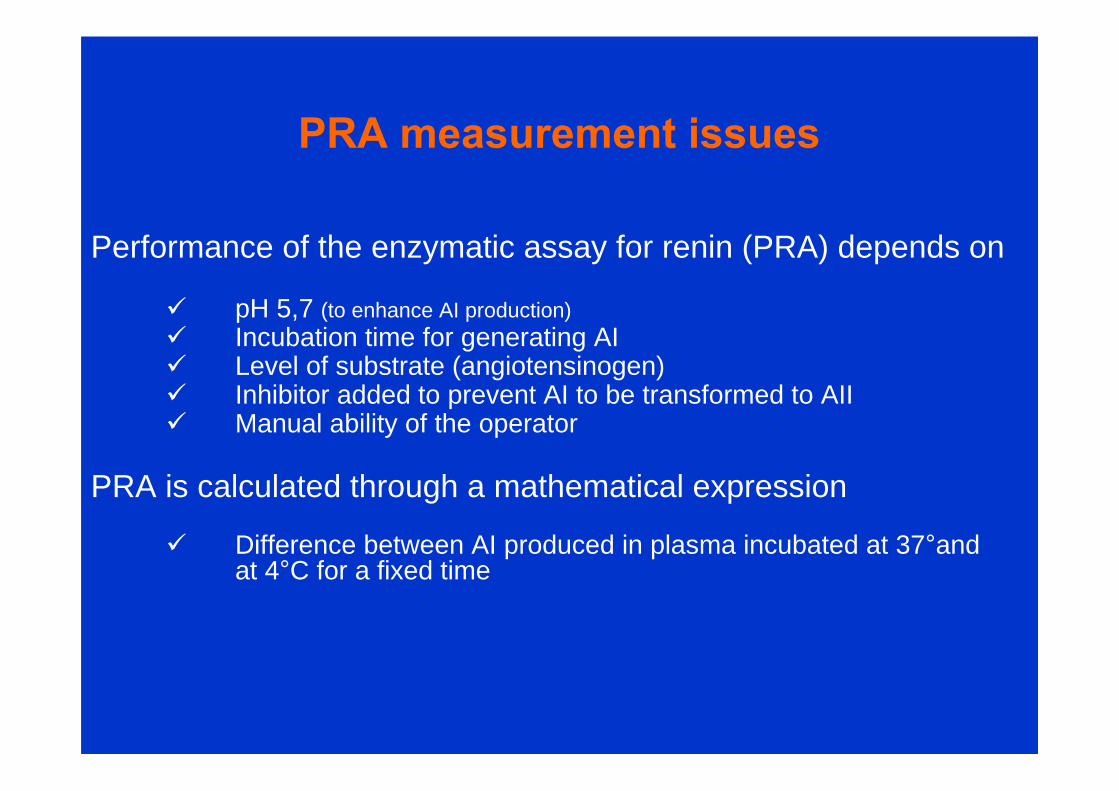
Performance of the enzymatic assay for renin (PRA) depends on
pH 5,7 (to enhance AI production) Incubation time for generating AI Level of substrate (angiotensinogen) Inhibitor added to prevent AI to be transformed to AII Manual ability of the operator
PRA is calculated through a mathematical expression
Difference between AI produced in plasma incubated at 37°and at 4°C for a fixed time
PRA measurement issues
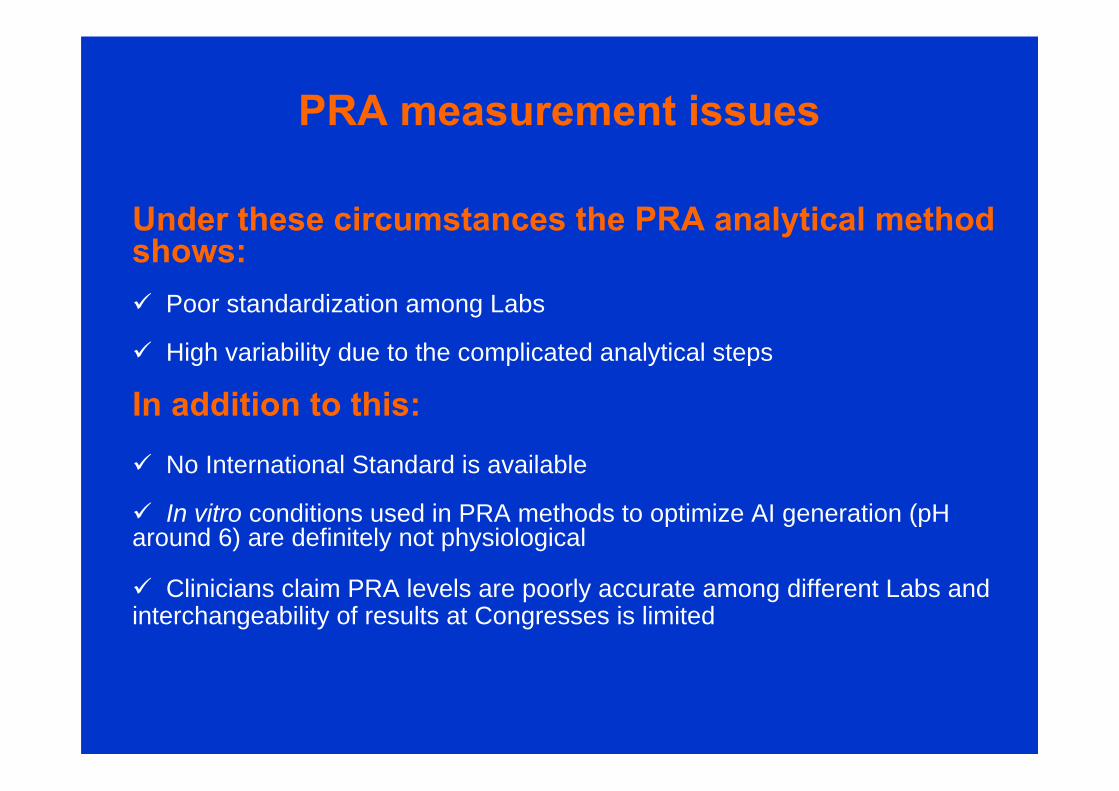
Under these circumstances the PRA analytical methodshows: Poor standardization among Labs
High variability due to the complicated analytical steps
In addition to this: No International Standard is available
In vitro conditions used in PRA methods to optimize AI generation (pH around 6) are definitely not physiological
Clinicians claim PRA levels are poorly accurate among different Labs and interchangeability of results at Congresses is limited
PRA measurement issues
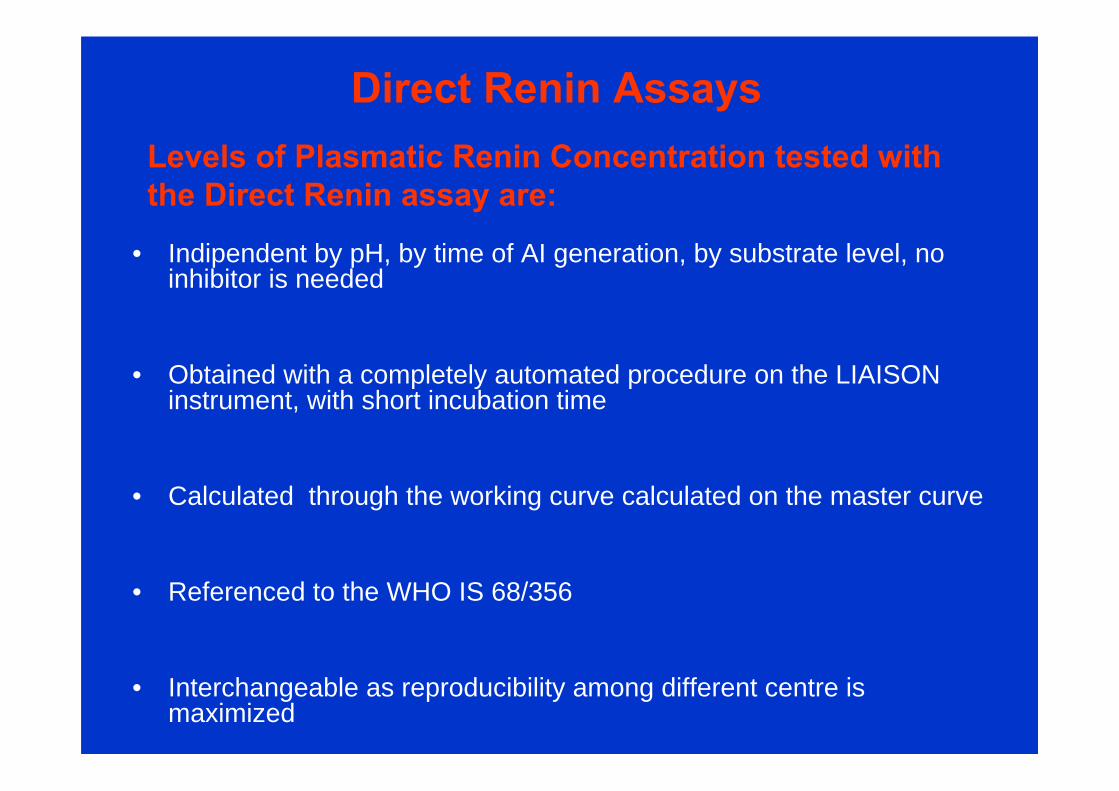
• Indipendent by pH, by time of AI generation, by substrate level, no inhibitor is needed
• Obtained with a completely automated procedure on the LIAISON instrument, with short incubation time
• Calculated through the working curve calculated on the master curve
• Referenced to the WHO IS 68/356
• Interchangeable as reproducibility among different centre is maximized
Levels of Plasmatic Renin Concentration tested withthe Direct Renin assay are:
Direct Renin Assays
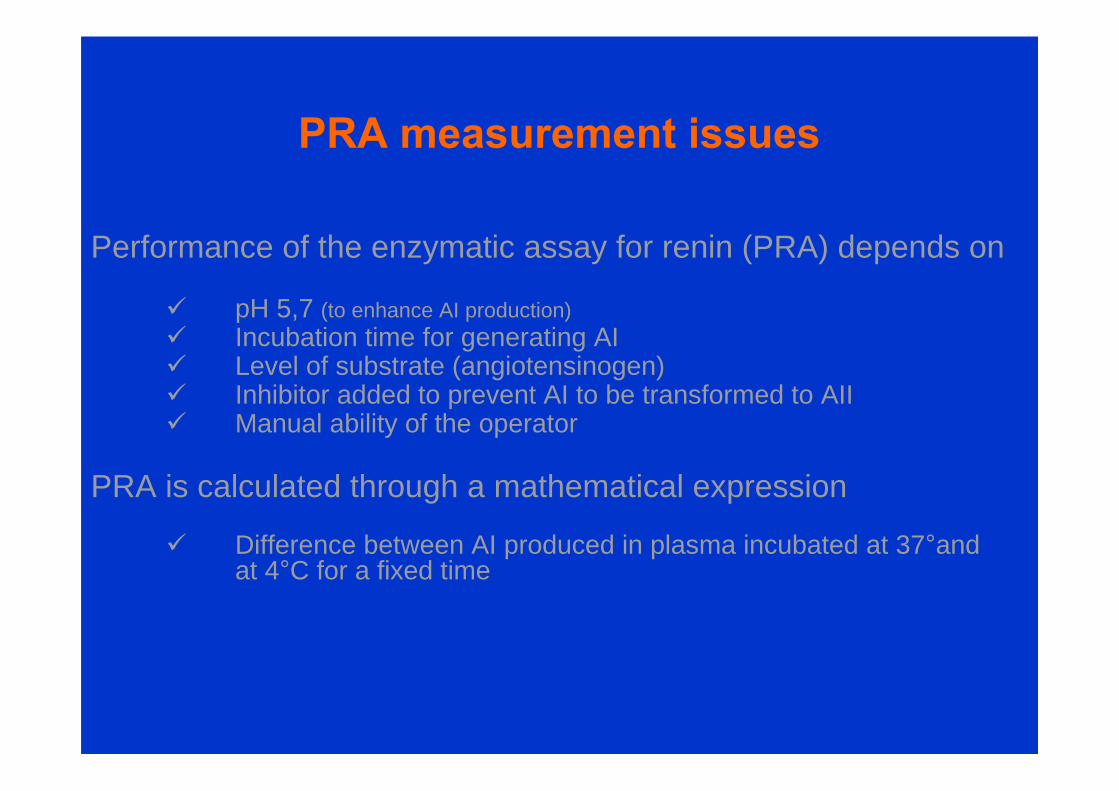
Performance of the enzymatic assay for renin (PRA) depends on
pH 5,7 (to enhance AI production) Incubation time for generating AI Level of substrate (angiotensinogen) Inhibitor added to prevent AI to be transformed to AII Manual ability of the operator
PRA is calculated through a mathematical expression
Difference between AI produced in plasma incubated at 37°and at 4°C for a fixed time
PRA measurement issues
PRA (ng/ml/h)PRA (ng/ml/h)
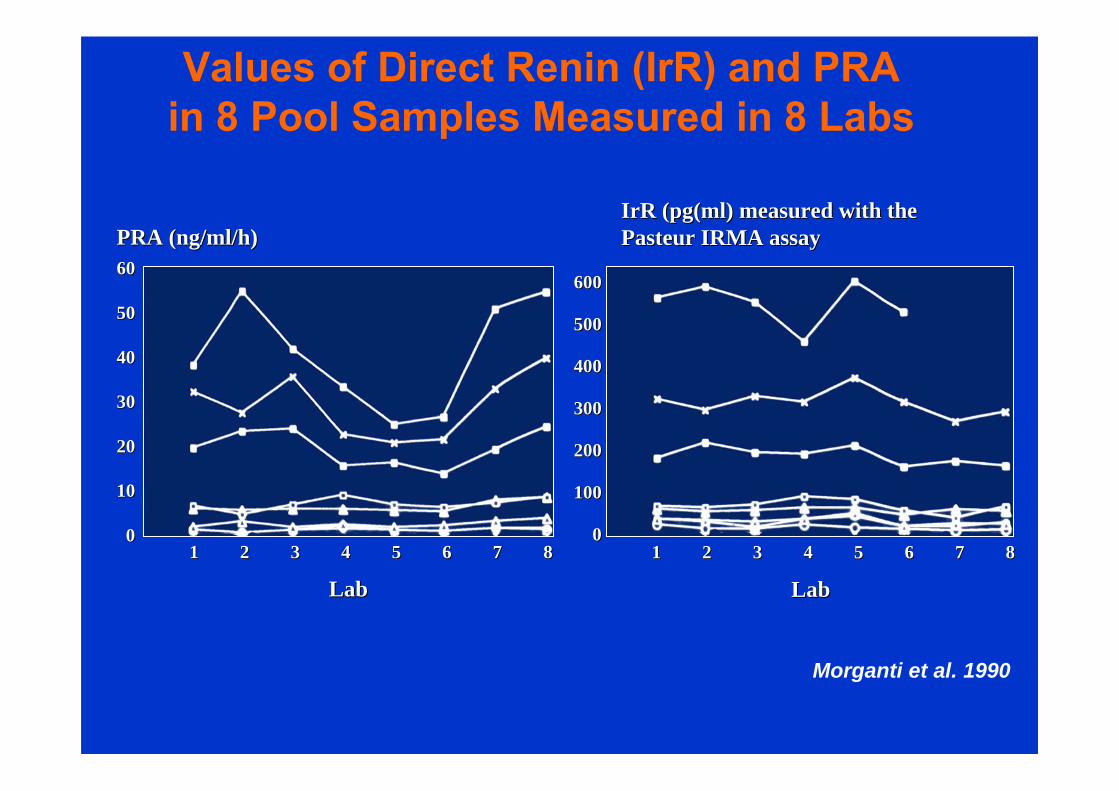
Values of Direct Renin (IrR) and PRA in 8 Pool Samples Measured in 8 Labs
00
1010
2020
3030
4040
5050
6060
00
100100
200200
300300
400400
500500
600600
IrRIrR (pg(ml) (pg(ml) measuredmeasured withwith the the Pasteur IRMA Pasteur IRMA assayassay
11 22 33 44 55 66 77 88
LabLab
11 22 33 44 55 66 77 88
LabLab
Morganti et al. 1990
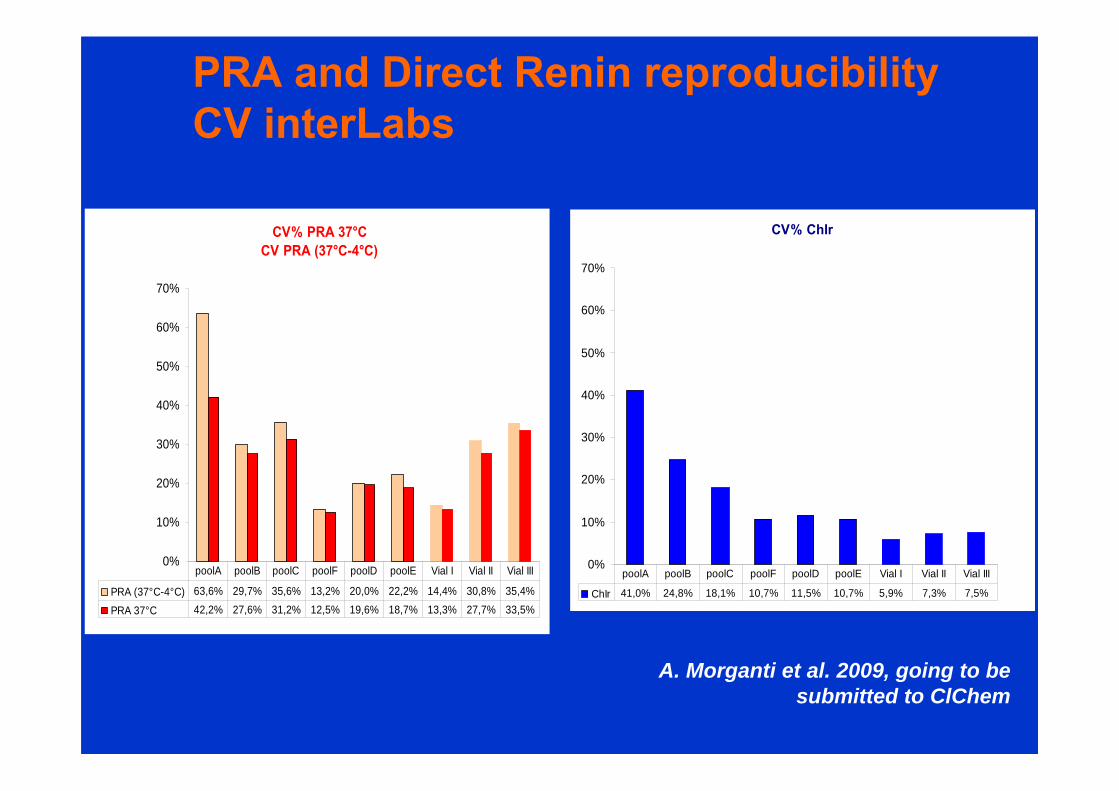
PRA and Direct Renin reproducibilityCV interLabs
CV% PRA 37°C CV PRA (37°C-4°C)
0%
10%
20%
30%
40%
50%
60%
70%
PRA (37°C-4°C) 63,6% 29,7% 35,6% 13,2% 20,0% 22,2% 14,4% 30,8% 35,4%
PRA 37°C 42,2% 27,6% 31,2% 12,5% 19,6% 18,7% 13,3% 27,7% 33,5%
poolA poolB poolC poolF poolD poolE Vial I Vial II Vial III
CV% ChIr
0%
10%
20%
30%
40%
50%
60%
70%
ChIr 41,0% 24,8% 18,1% 10,7% 11,5% 10,7% 5,9% 7,3% 7,5%
poolA poolB poolC poolF poolD poolE Vial I Vial II Vial III
A. Morganti et al. 2009, going to besubmitted to ClChem
Correlations of PRA and Direct Renin levels
it is to be considered ONLY from the Clinical point of view
NO FACTOR is to be used to calculate levels of PRA representingan activity from levels of Direct renin representing a concentration and viceversa
Each PRA assay show different slope versus the respective PRC levels estimated with Direct Renin assays
The switch between concentrations of Renin testedwith the PRA assay to Direct Renin levels
deserves a clarification
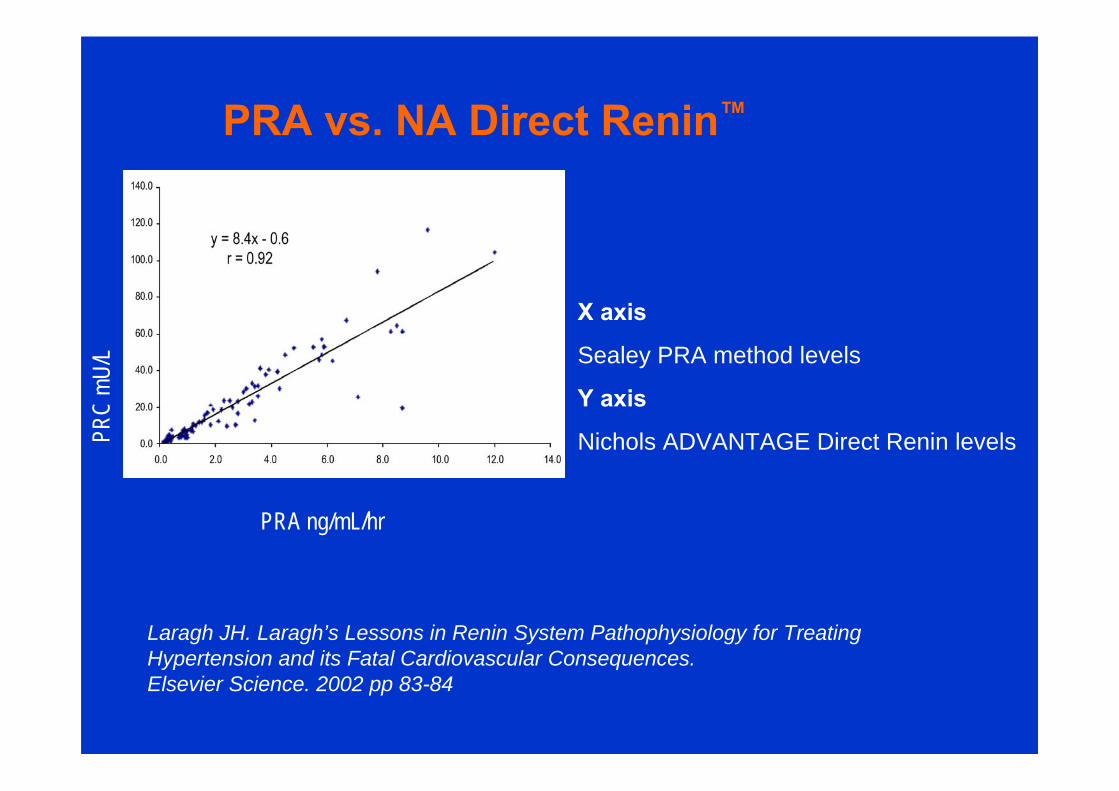
PRA vs. NA Direct Renin™
PRA ng/mL/hr
Laragh JH. Laragh’s Lessons in Renin System Pathophysiology for Treating Hypertension and its Fatal Cardiovascular Consequences. Elsevier Science. 2002 pp 83-84
P RC
m U/L
X axis
Sealey PRA method levels
Y axis
Nichols ADVANTAGE Direct Renin levels
0 2 4 6 8 10 12 14
600
500
400
300
200
100
0
Renin activity (ng/ml/h)
Ren
in m
ass
(ng/
ml)
LIA
ISO
N D
irect
Ren
in µ
U/m
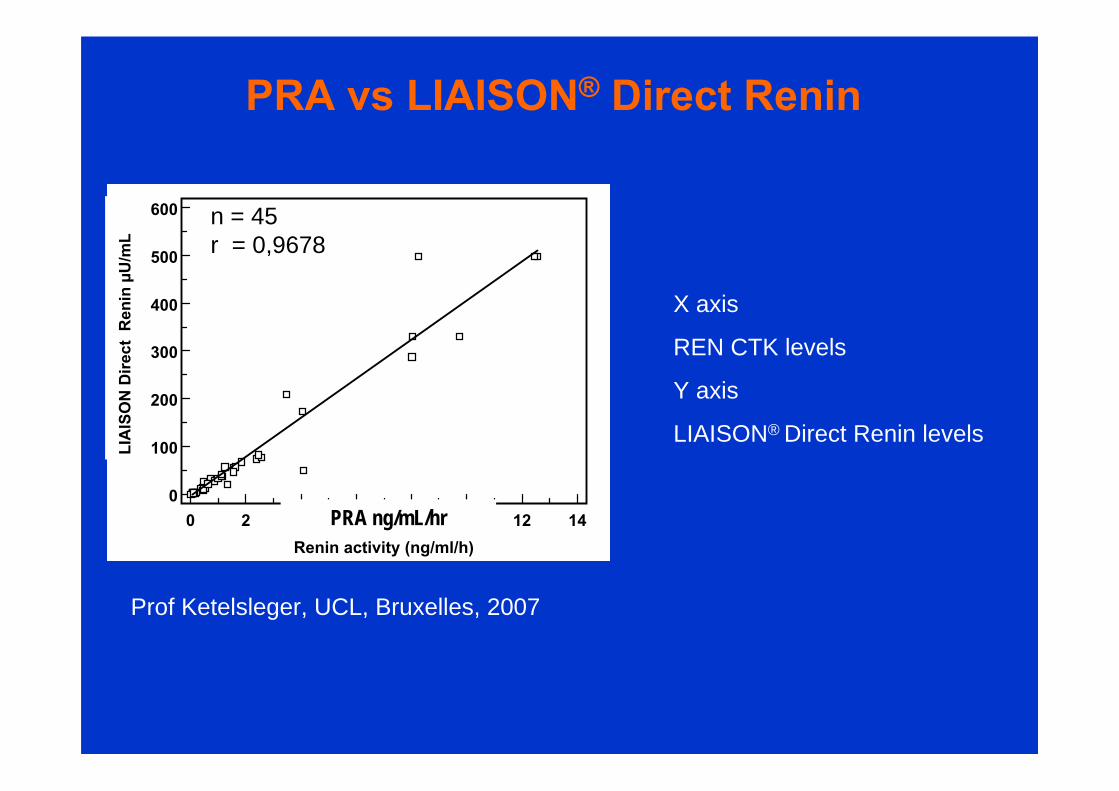
LPRA vs LIAISON® Direct Renin
X axis
REN CTK levels
Y axis
LIAISON® Direct Renin levels
PRA ng/mL/hr
Prof Ketelsleger, UCL, Bruxelles, 2007
n = 45r = 0,9678
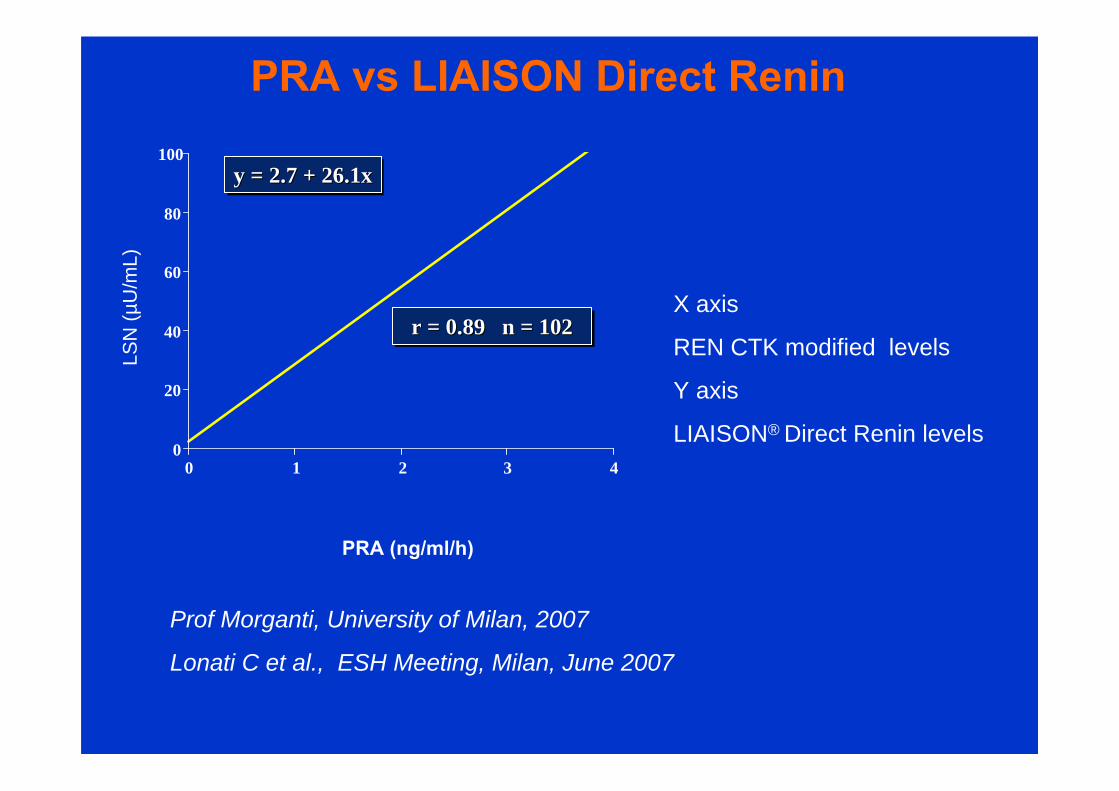
Prof Morganti, University of Milan, 2007
Lonati C et al., ESH Meeting, Milan, June 2007
r = 0.89 n = 102r = 0.89 r = 0.89 n = 102n = 102
y = 2.7 + 26.1xy = 2.7 + 26.1xy = 2.7 + 26.1x
PRA (ng/ml/h)
LSN
(µU
/mL)
0 1 2 3 40
20
40
60
80
100
PRA vs LIAISON Direct Renin
X axis
REN CTK modified levels
Y axis
LIAISON® Direct Renin levels
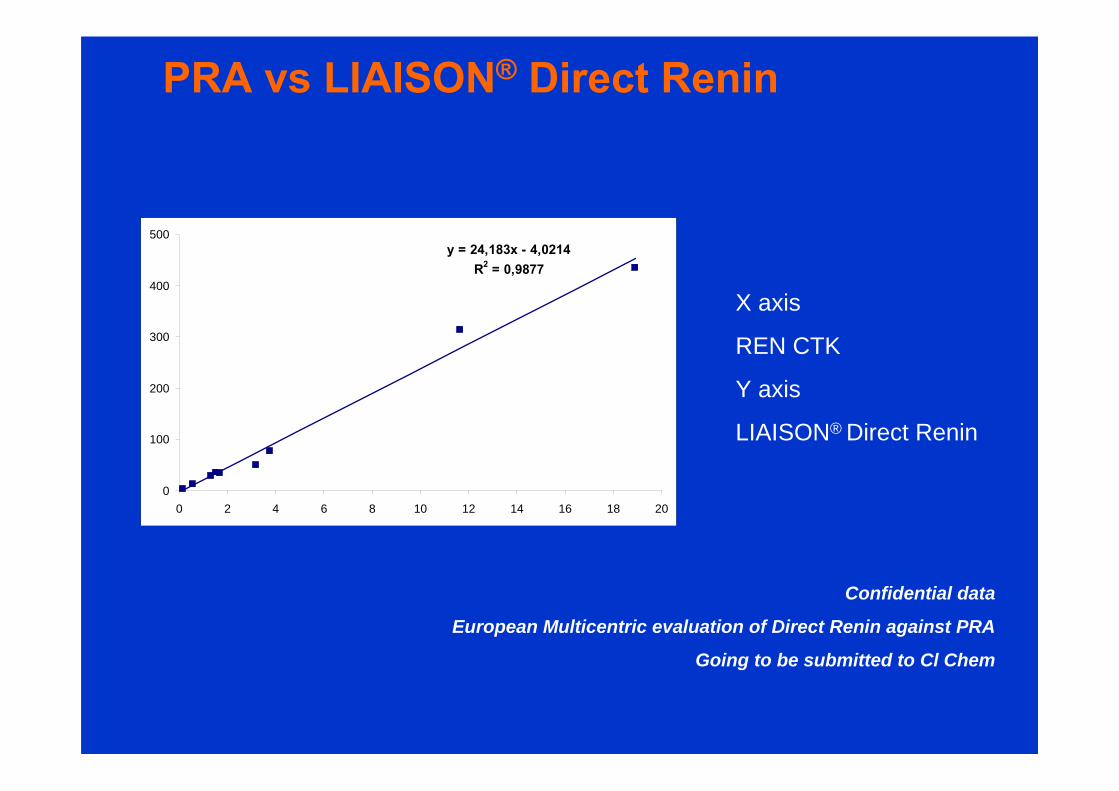
y = 24,183x - 4,0214R2 = 0,9877
0
100
200
300
400
500
0 2 4 6 8 10 12 14 16 18 20
PRA vs LIAISON® Direct Renin
Confidential data
European Multicentric evaluation of Direct Renin against PRA
Going to be submitted to Cl Chem
X axis
REN CTK
Y axis
LIAISON® Direct Renin
From PRA to Direct Renin testing
During a symposia dedicated to the effectiveness of renin testing in monitoring the new anti-hypertensive therapies
at the last Meeting of the European Society of HypertensionMilan, June 2009
Summary
FAST AND PRACTICAL
Prof J Nussberger, University of Lausannesupporter of the ‘trapping method to test PRA’
SAIDthese new methods are
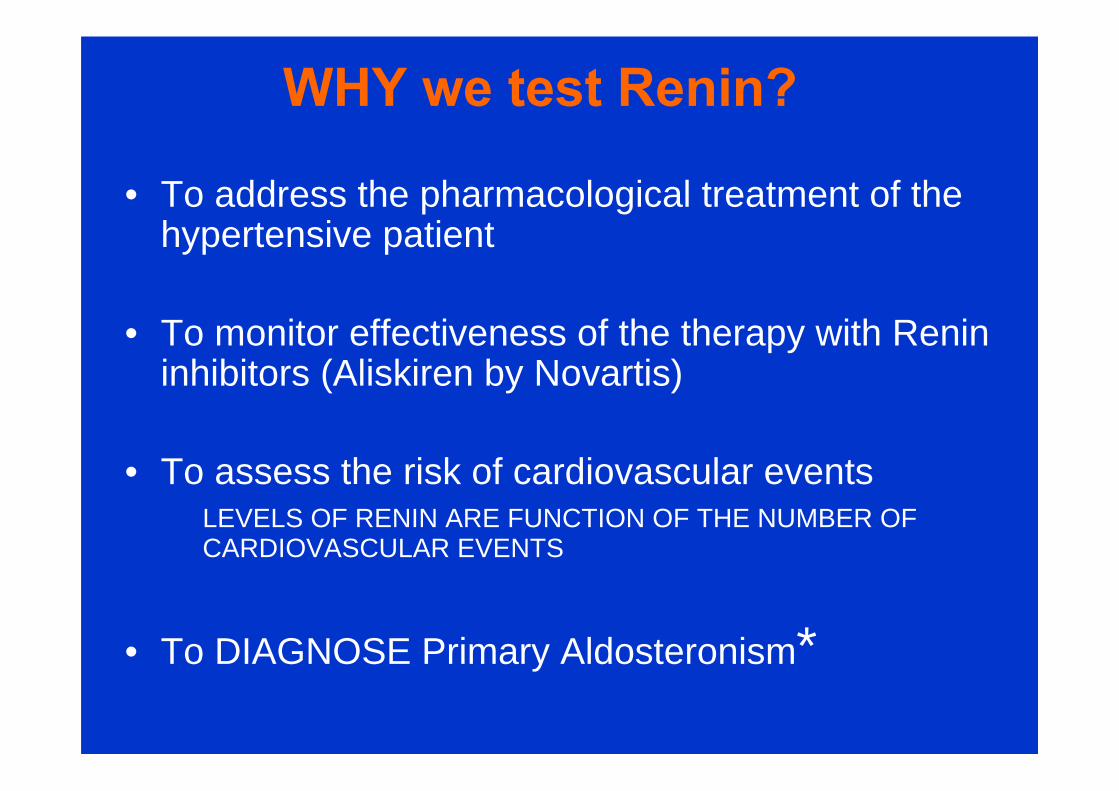
WHY we test Renin?
• To address the pharmacological treatment of the hypertensive patient
• To monitor effectiveness of the therapy with Renin inhibitors (Aliskiren by Novartis)
• To assess the risk of cardiovascular events LEVELS OF RENIN ARE FUNCTION OF THE NUMBER OF CARDIOVASCULAR EVENTS
• To DIAGNOSE Primary Aldosteronism*
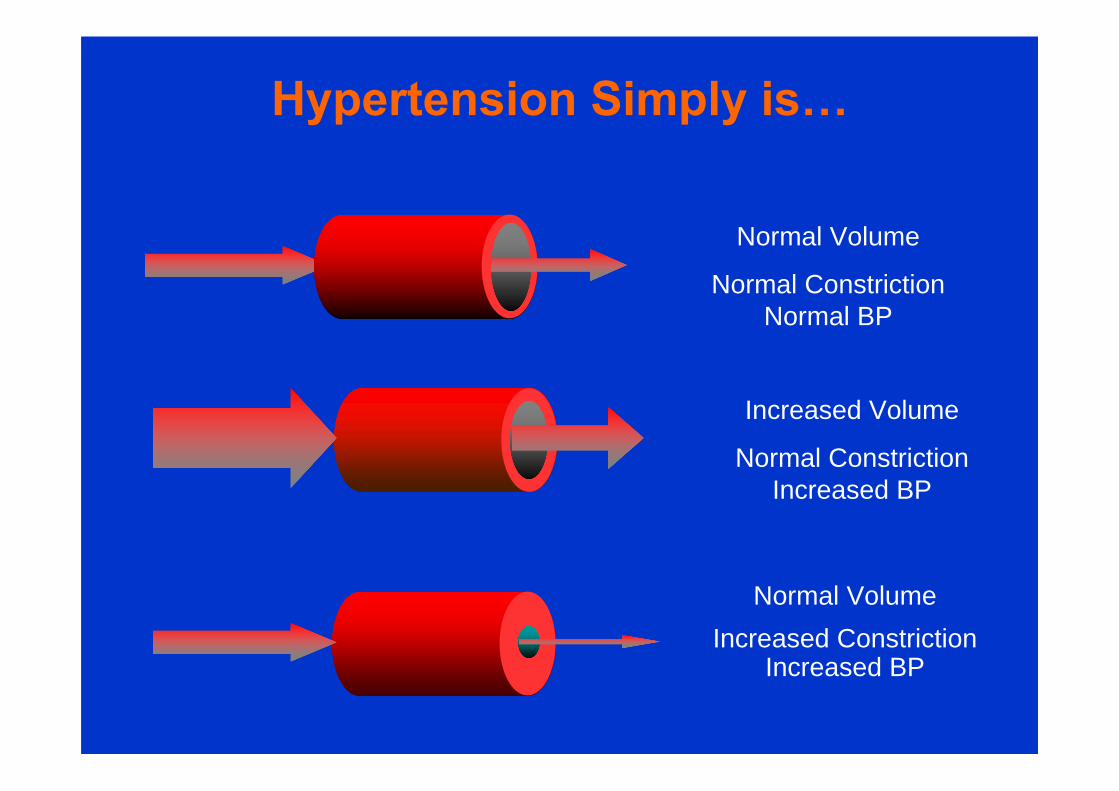
Normal Volume
Normal Constriction Normal BP
Increased Volume
Normal Constriction Increased BP
Hypertension Simply is…
Normal Volume Increased Constriction
Increased BP
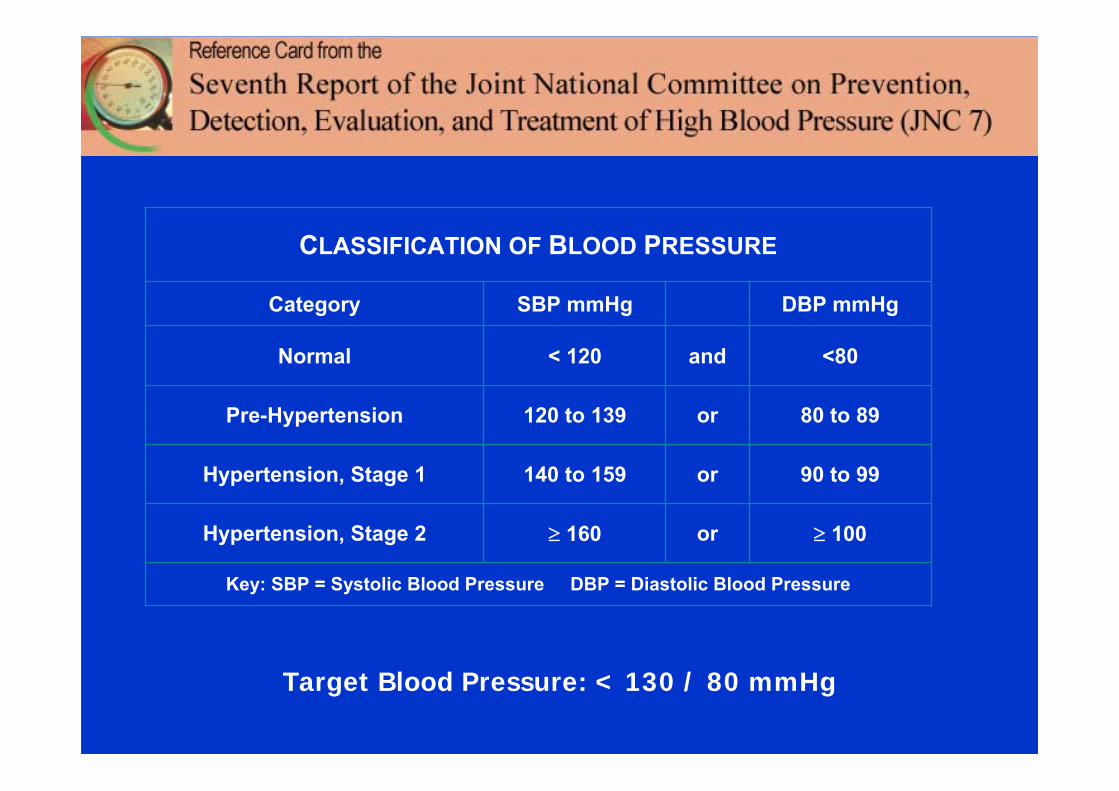
CLASSIFICATION OF BLOOD PRESSURE
Key: SBP = Systolic Blood Pressure DBP = Diastolic Blood Pressure
100or 160Hypertension, Stage 2
90 to 99or140 to 159Hypertension, Stage 1
80 to 89or120 to 139Pre-Hypertension
<80and< 120Normal
DBP mmHgSBP mmHgCategory
Target Blood Pressure: < 130 / 80 mmHg

Primary and Secondary Hypertension
Primary (Essential) Unknown Cause Genetic Factor for the MOST (90%)
over 80% of all High Blood Pressure Cases
William F Young Jr., Endocrinology 144 (6):2208-2213 (2003)Minireview: Primary Aldosteronism-Changing Concepts in Diagnosis and Treatment
Secondary
High Blood Pressure caused by different Disorder (e.g., Hyperaldosteronism, Renal Artery Disease, etc.)
…a joke?…if you are 50 years old:OR
YOU SUFFER FROM HYPERTENSIONOR YOU WILL SUFFER FROM HYPERTENSION
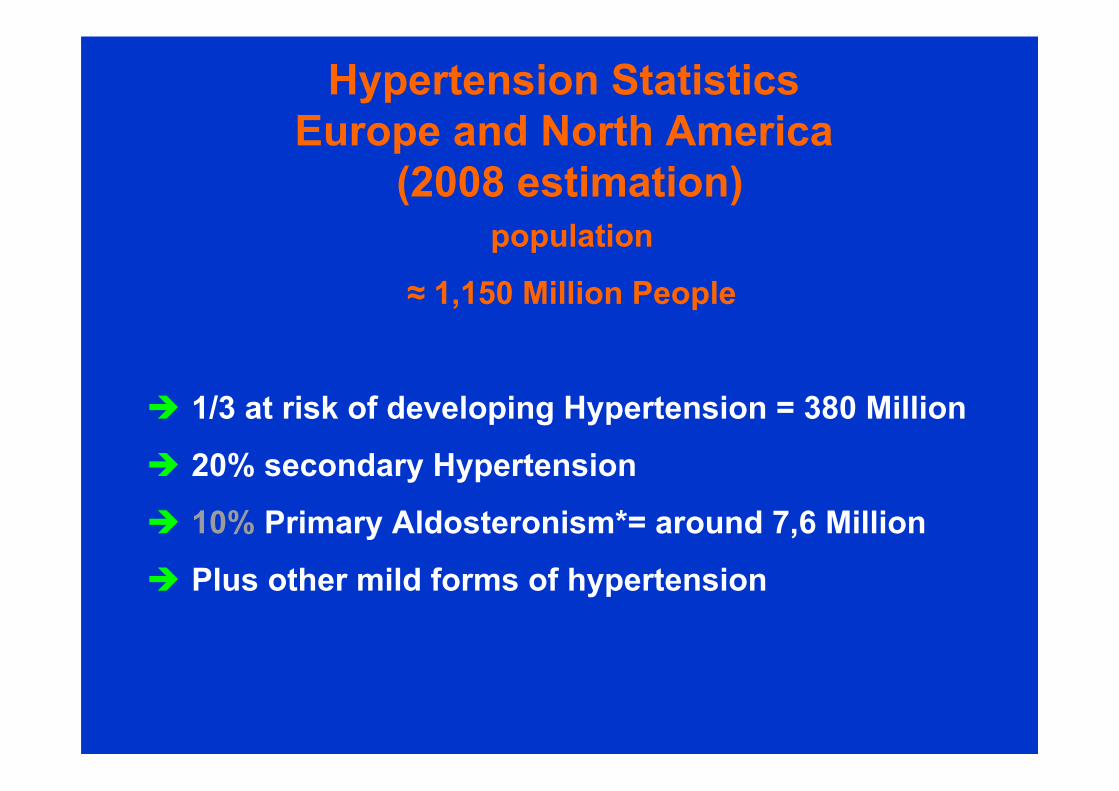
population
≈ 1,150 Million People
1/3 at risk of developing Hypertension = 380 Million
20% secondary Hypertension
10% Primary Aldosteronism*= around 7,6 Million
Plus other mild forms of hypertension
Hypertension Statistics Europe and North America
(2008 estimation)
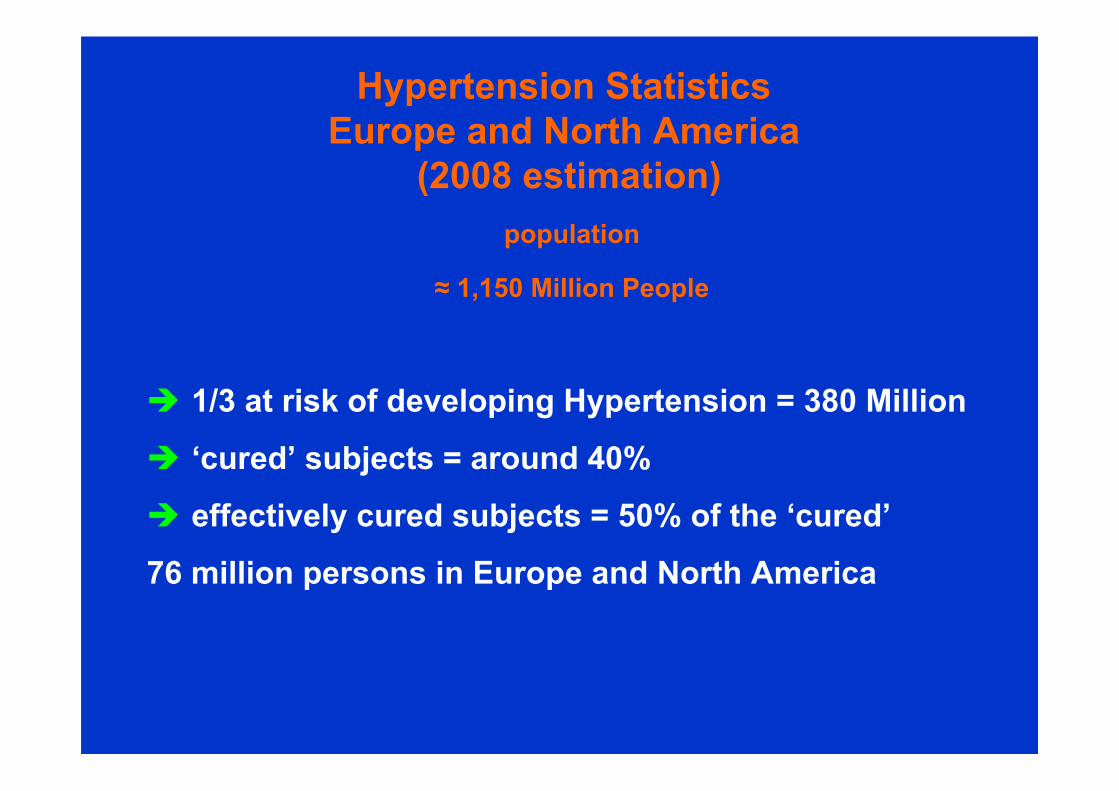
population
≈ 1,150 Million People
1/3 at risk of developing Hypertension = 380 Million
‘cured’ subjects = around 40%
effectively cured subjects = 50% of the ‘cured’
76 million persons in Europe and North America
Hypertension Statistics Europe and North America
(2008 estimation)
USING the ratio
AldosteroneRenin
to assess Primary Aldosteronism*
ARR=aldosterone to renin ratio
1310 Mo1310 Mo
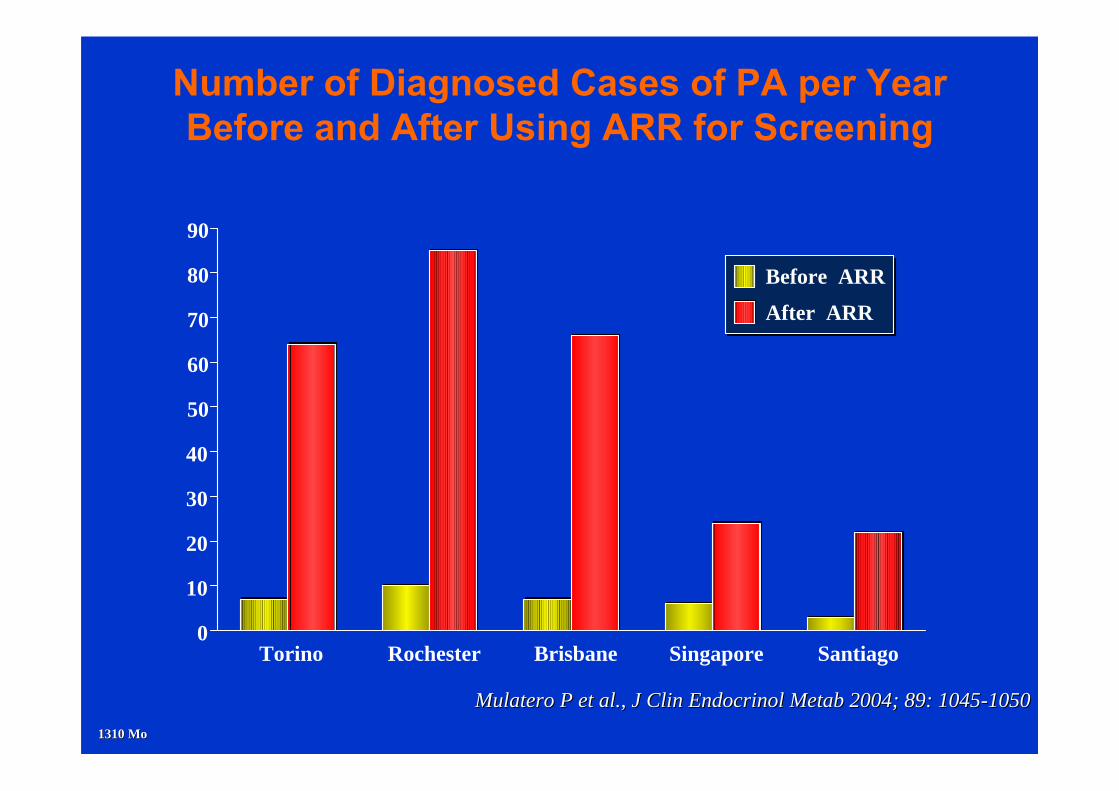
Number of Diagnosed Cases of PA per YearBefore and After Using ARR for Screening
MulateroMulatero P P etet al., J al., J ClinClin EndocrinolEndocrinol MetabMetab 2004; 89: 10452004; 89: 1045--10501050
Torino Rochester Brisbane Singapore Santiago0
10
20
30
40
50
60
70
80
90
Before ARR
After ARR
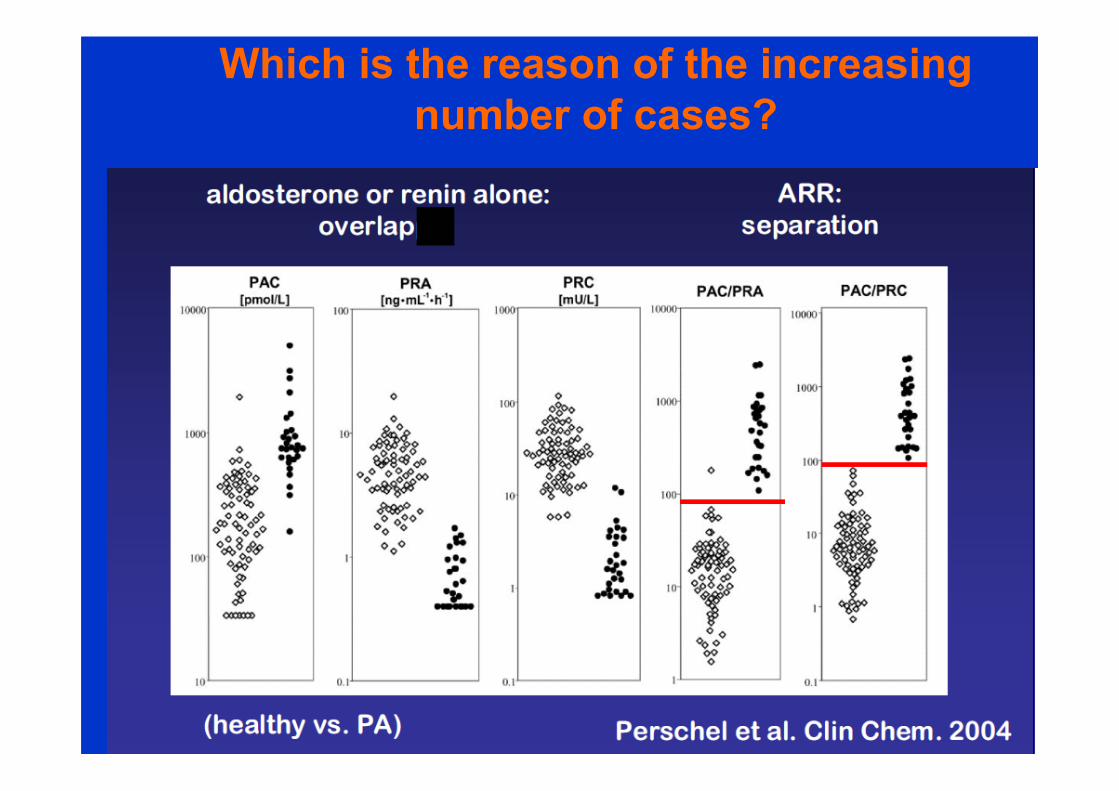
Which is the reason of the increasing number of cases?
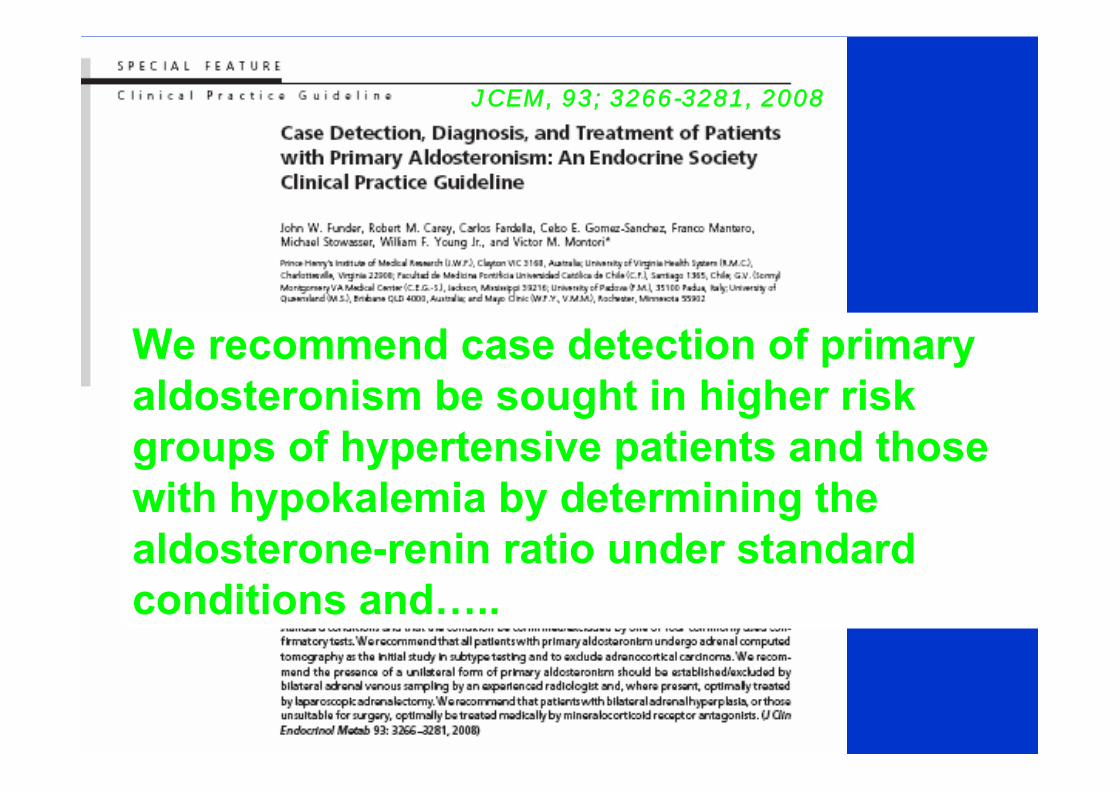
We recommend case detection of primaryaldosteronism be sought in higher riskgroups of hypertensive patients and thosewith hypokalemia by determining the aldosterone-renin ratio under standard conditions and…..
JCEM, 93; 3266-3281, 2008
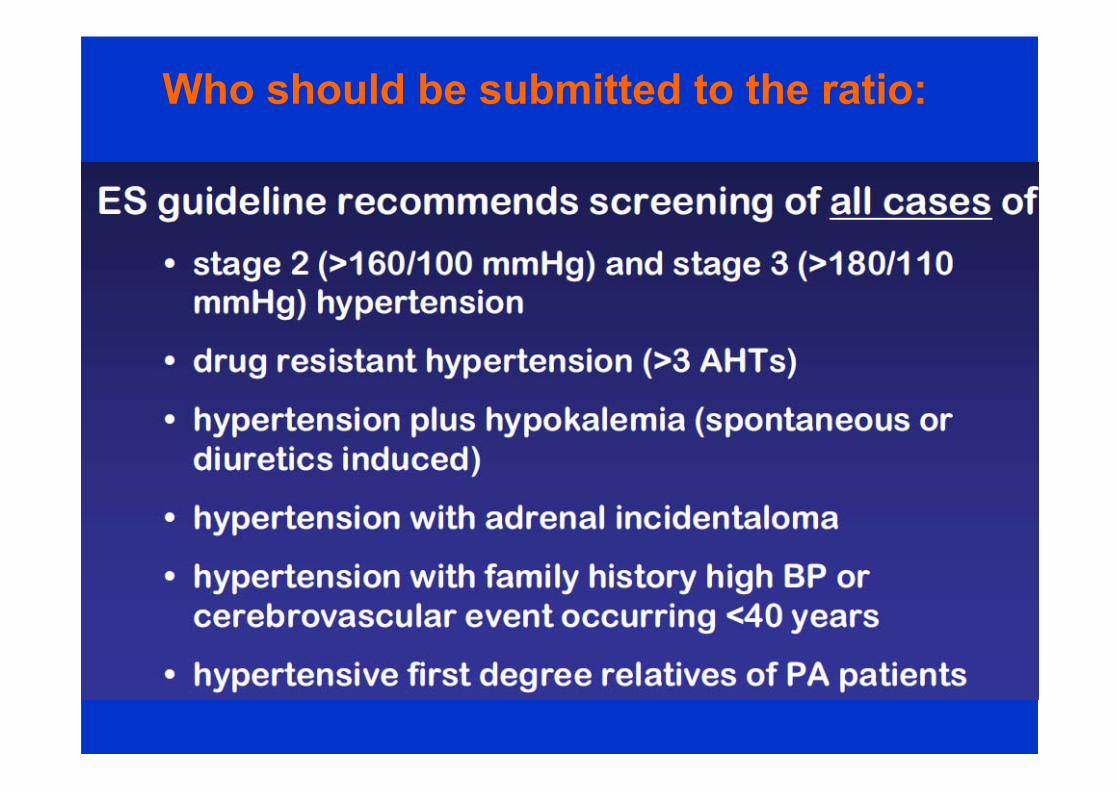
Who should be submitted to the ratio:
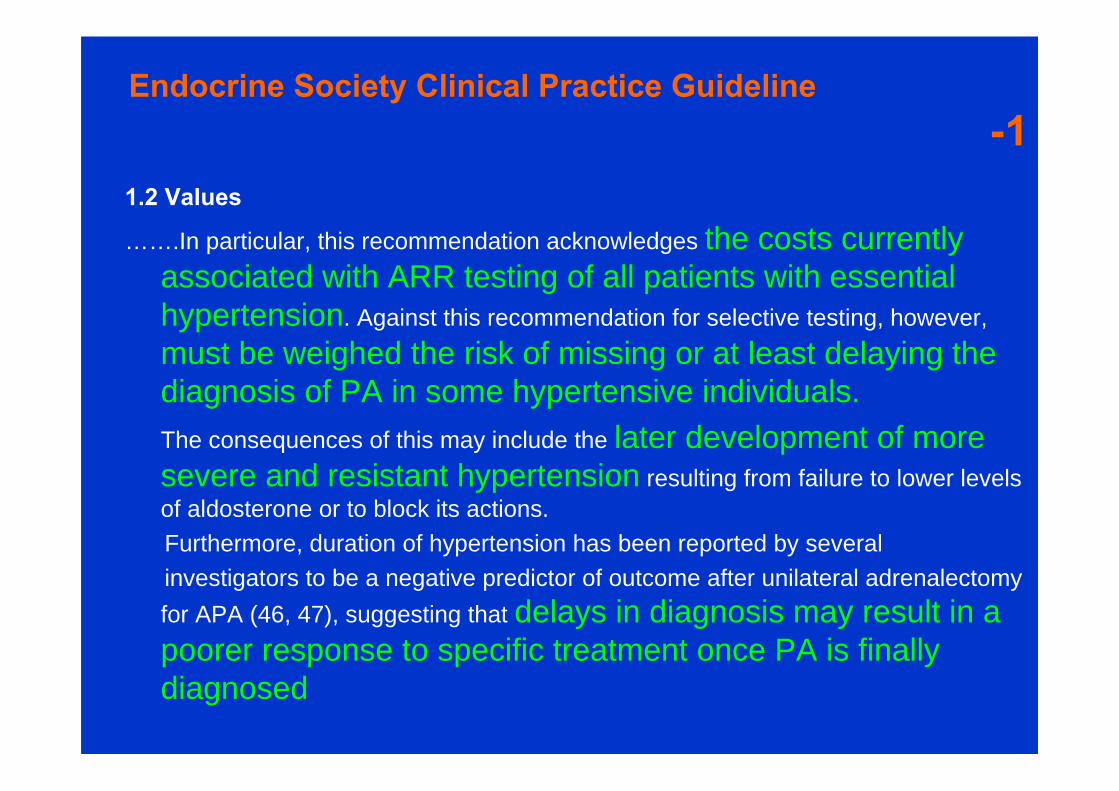
1.2 Values
…….In particular, this recommendation acknowledges the costs currentlyassociated with ARR testing of all patients with essentialhypertension. Against this recommendation for selective testing, however, must be weighed the risk of missing or at least delaying the diagnosis of PA in some hypertensive individuals. The consequences of this may include the later development of more severe and resistant hypertension resulting from failure to lower levelsof aldosterone or to block its actions.Furthermore, duration of hypertension has been reported by severalinvestigators to be a negative predictor of outcome after unilateral adrenalectomyfor APA (46, 47), suggesting that delays in diagnosis may result in a poorer response to specific treatment once PA is finallydiagnosed
Endocrine Society Clinical Practice Guideline-1
Case Detection, Diagnosis, and ………. -2
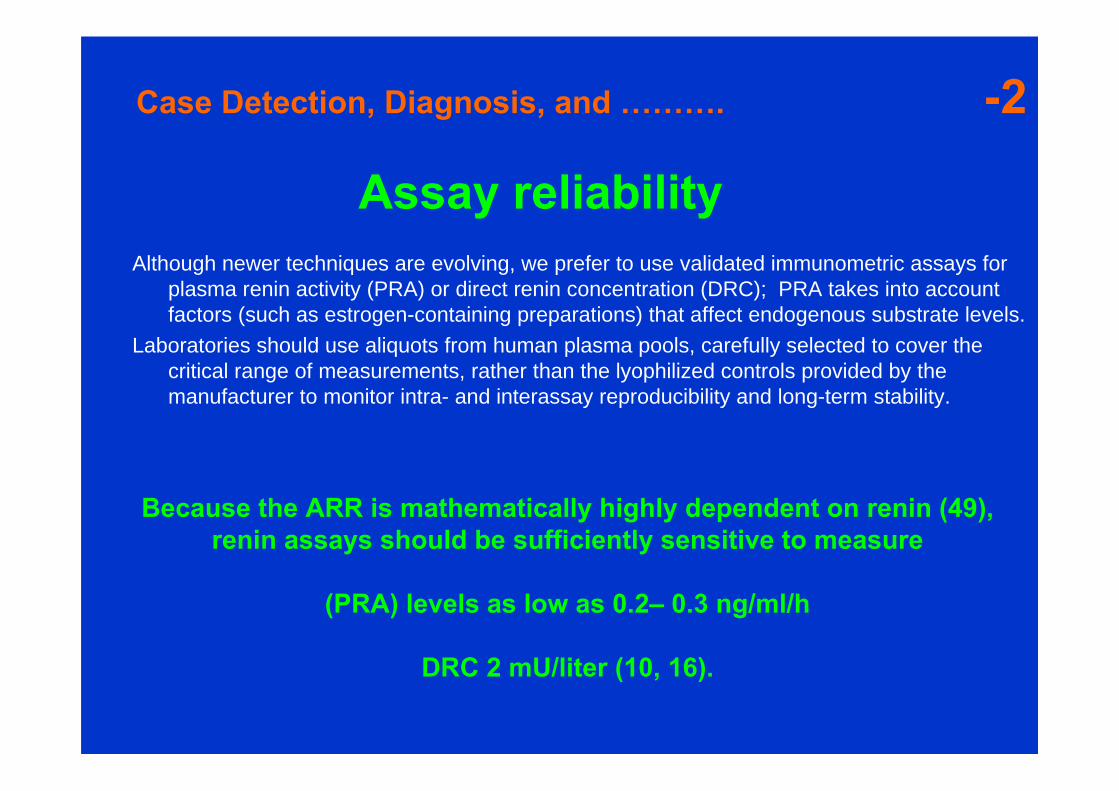
Although newer techniques are evolving, we prefer to use validated immunometric assays for plasma renin activity (PRA) or direct renin concentration (DRC); PRA takes into account factors (such as estrogen-containing preparations) that affect endogenous substrate levels.
Laboratories should use aliquots from human plasma pools, carefully selected to cover the critical range of measurements, rather than the lyophilized controls provided by the manufacturer to monitor intra- and interassay reproducibility and long-term stability.
Assay reliability
Because the ARR is mathematically highly dependent on renin (49), renin assays should be sufficiently sensitive to measure
(PRA) levels as low as 0.2– 0.3 ng/ml/h
DRC 2 mU/liter (10, 16).
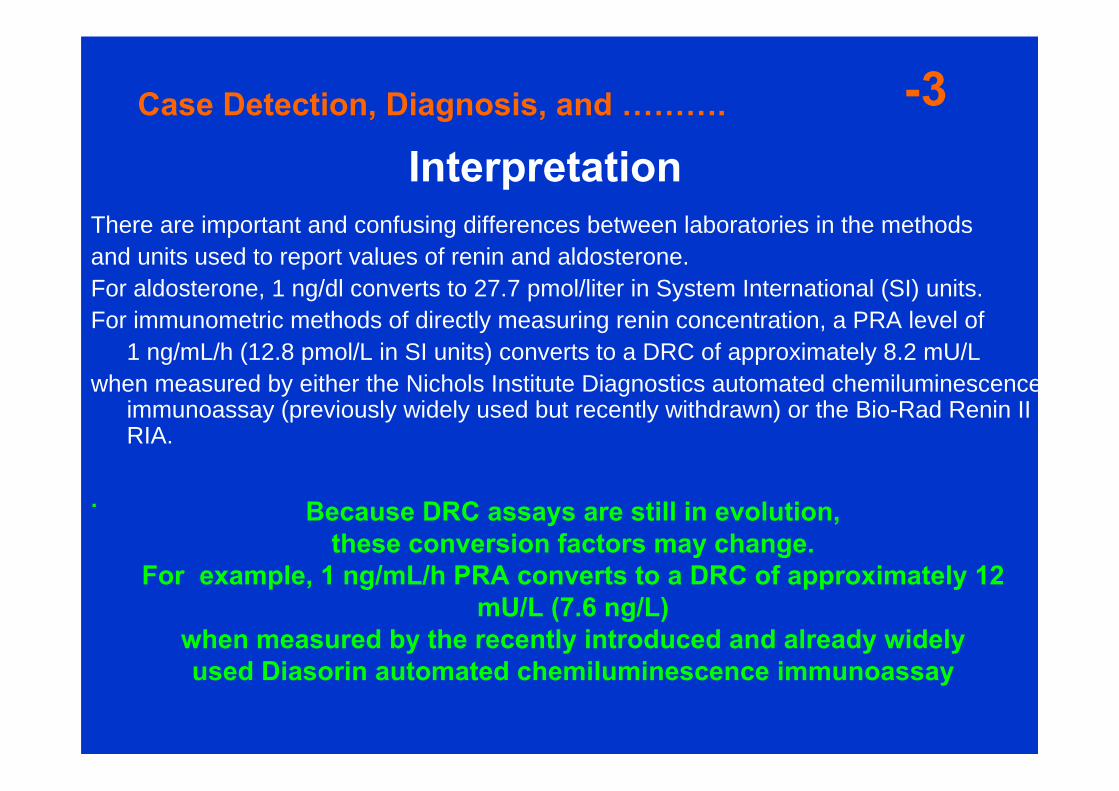
-3
There are important and confusing differences between laboratories in the methodsand units used to report values of renin and aldosterone. For aldosterone, 1 ng/dl converts to 27.7 pmol/liter in System International (SI) units. For immunometric methods of directly measuring renin concentration, a PRA level of
1 ng/mL/h (12.8 pmol/L in SI units) converts to a DRC of approximately 8.2 mU/L when measured by either the Nichols Institute Diagnostics automated chemiluminescence
immunoassay (previously widely used but recently withdrawn) or the Bio-Rad Renin II RIA.
.
Interpretation
Because DRC assays are still in evolution, these conversion factors may change.
For example, 1 ng/mL/h PRA converts to a DRC of approximately 12 mU/L (7.6 ng/L)
when measured by the recently introduced and already widelyused Diasorin automated chemiluminescence immunoassay
Case Detection, Diagnosis, and ……….
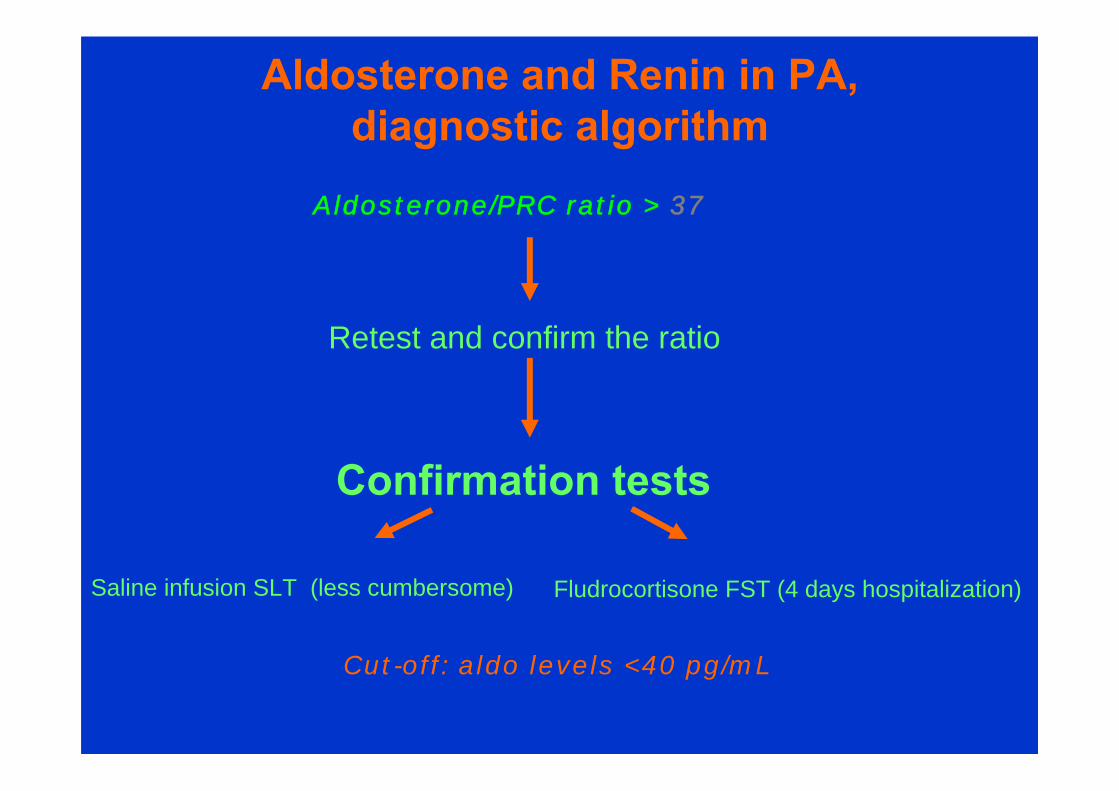
Aldosterone/PRC ratio > 37
Aldosterone and Renin in PA, diagnostic algorithm
Confirmation tests
Retest and confirm the ratio
Saline infusion SLT (less cumbersome) Fludrocortisone FST (4 days hospitalization)
Cut-off: aldo levels <40 pg/mL
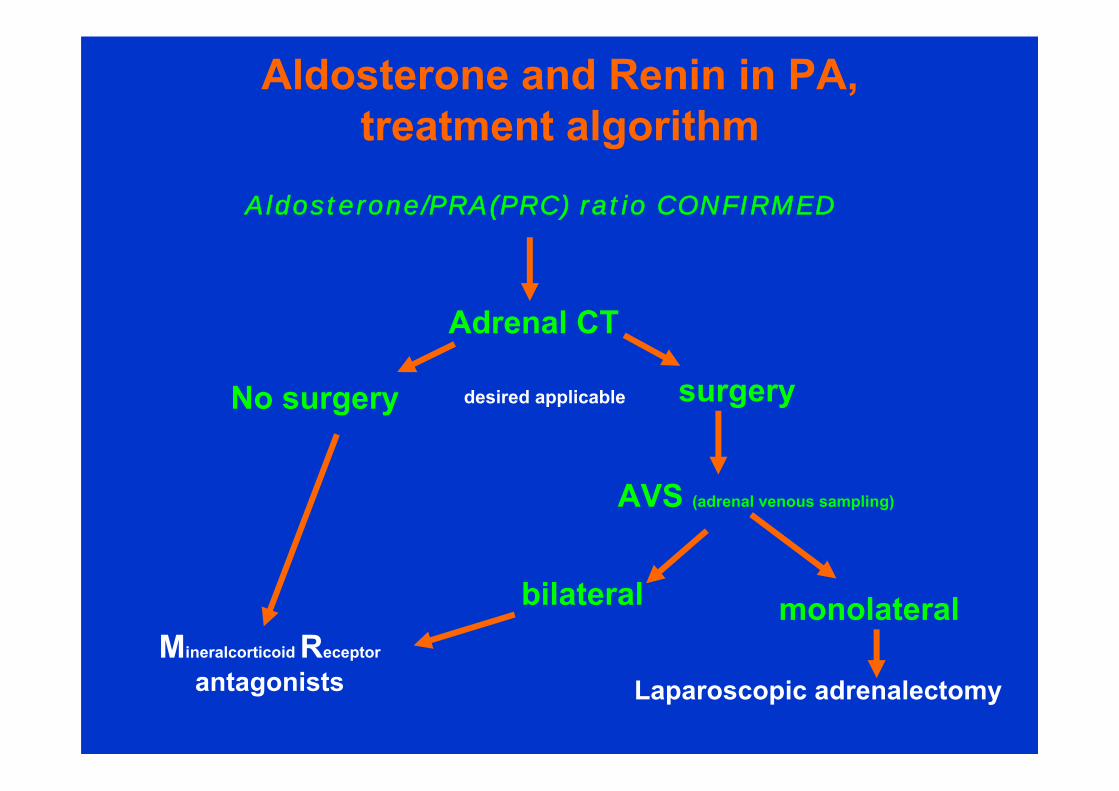
Aldosterone/PRA(PRC) ratio CONFIRMED
Adrenal CT
No surgery surgery
Mineralcorticoid Receptor
antagonists
AVS (adrenal venous sampling)
bilateral monolateral
desired applicable
Laparoscopic adrenalectomy
Aldosterone and Renin in PA, treatment algorithm
1855 Mo1855 Mo
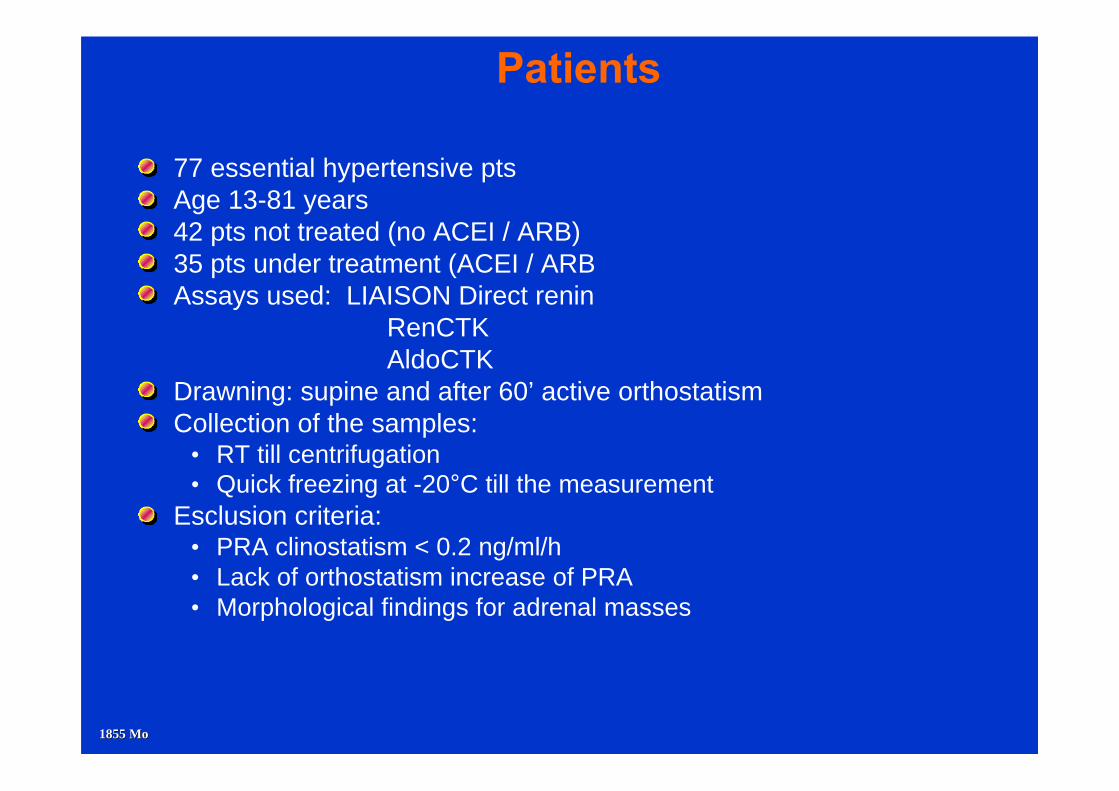
Patients
77 essential hypertensive pts Age 13-81 years42 pts not treated (no ACEI / ARB) 35 pts under treatment (ACEI / ARBAssays used: LIAISON Direct renin
RenCTKAldoCTK
Drawning: supine and after 60’ active orthostatismCollection of the samples:
• RT till centrifugation• Quick freezing at -20°C till the measurement
Esclusion criteria: • PRA clinostatism < 0.2 ng/ml/h• Lack of orthostatism increase of PRA• Morphological findings for adrenal masses
1856 Mo1856 Mo
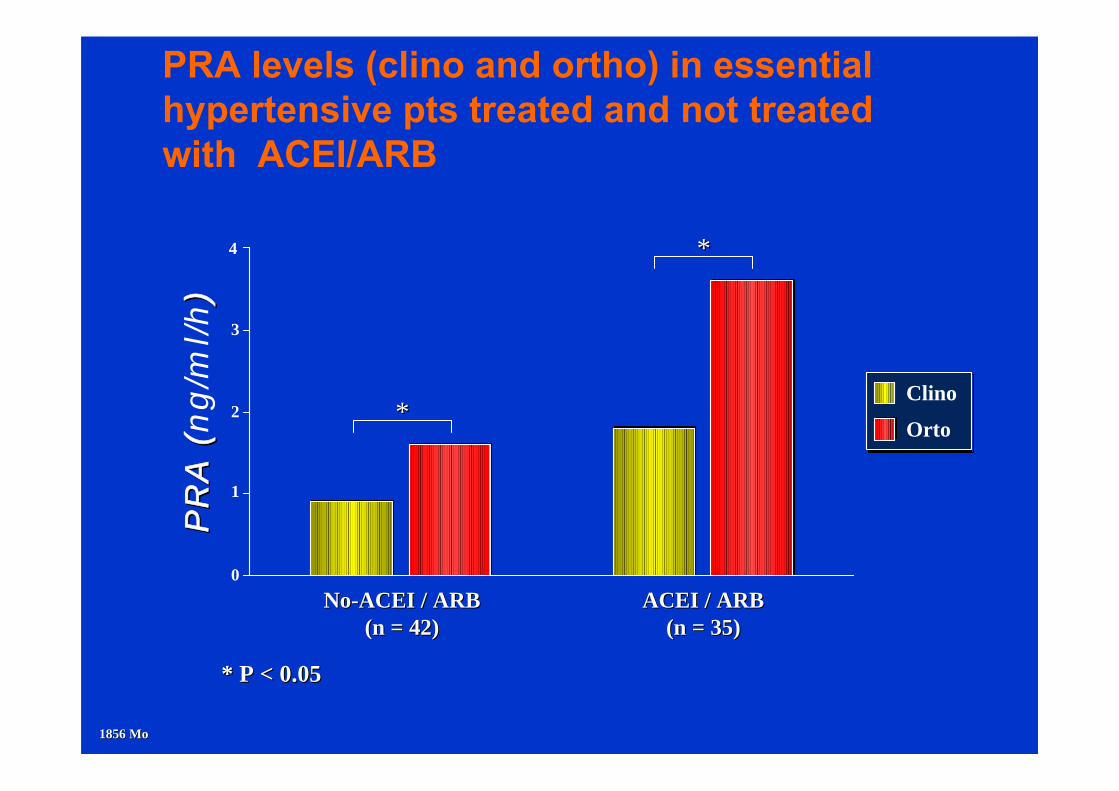
PRA levels (clino and ortho) in essential hypertensive pts treated and not treatedwith ACEI/ARB
0
1
2
3
4
Clino
Orto
PR
A (
PR
A (
ng
/ml/h))
NoNo--ACEI / ARBACEI / ARB(n = 42)(n = 42)
ACEI / ARBACEI / ARB(n = 35)(n = 35)
**
**
* P < 0.05* P < 0.05
0
2
4
6
8
10
Clino
Orto
1857 Mo1857 Mo
LS
N D
ire
ct
Re
nin
(m
U/d
L)
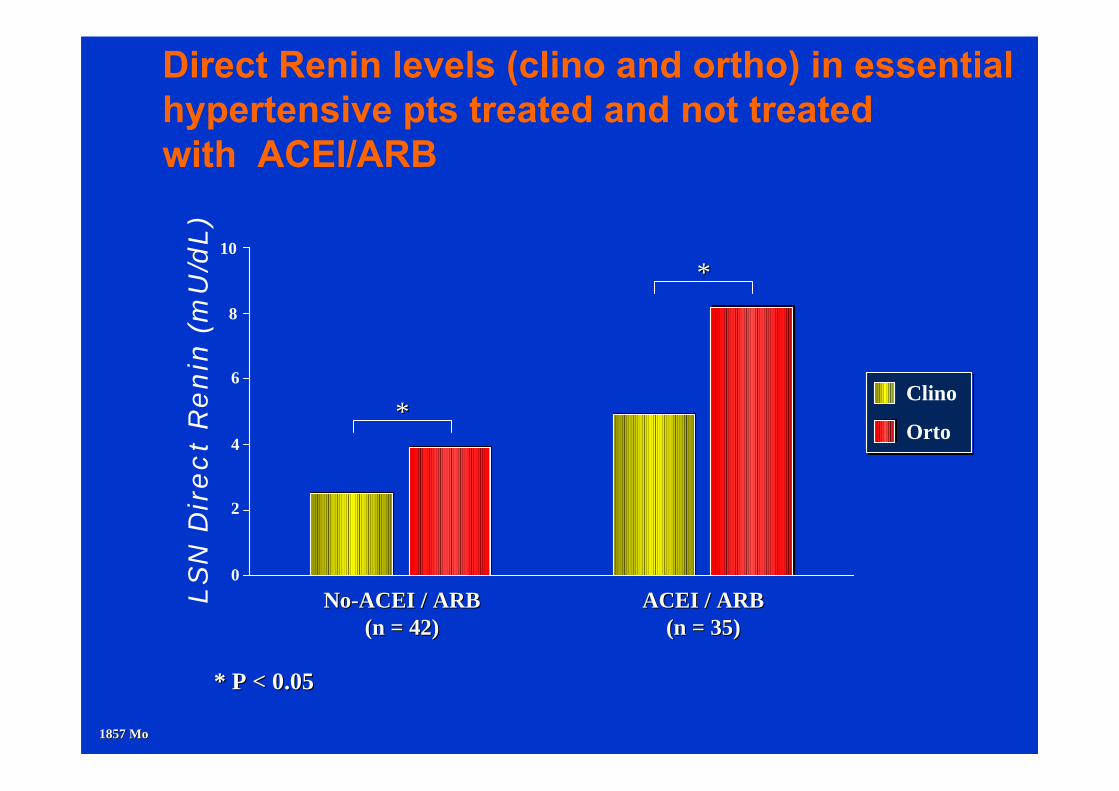
NoNo--ACEI / ARBACEI / ARB(n = 42)(n = 42)
ACEI / ARBACEI / ARB(n = 35)(n = 35)
**
**
* P < 0.05* P < 0.05
Direct Renin levels (clino and ortho) in essential hypertensive pts treated and not treatedwith ACEI/ARB
0
10
20
30
Clino
Orto
1858 Mo1858 Mo
Ald
oste
rone (
ng/d
L)
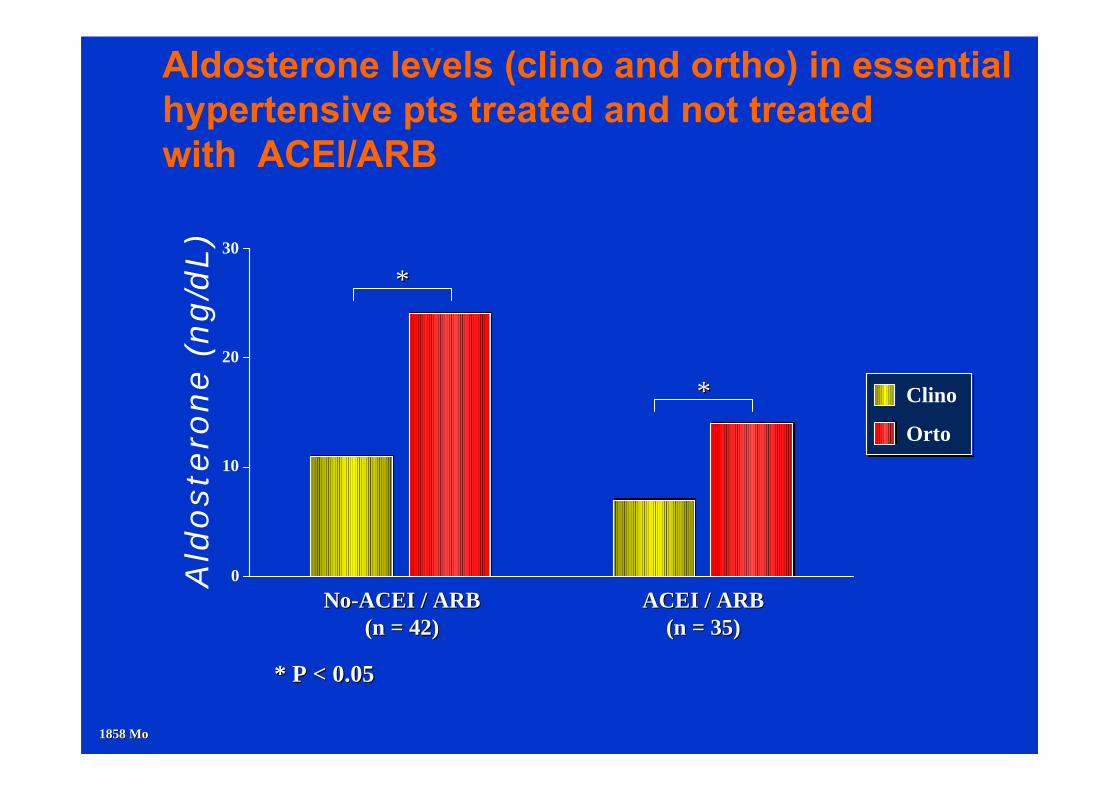
NoNo--ACEI / ARBACEI / ARB(n = 42)(n = 42)
ACEI / ARBACEI / ARB(n = 35)(n = 35)
**
**
* P < 0.05* P < 0.05
Aldosterone levels (clino and ortho) in essential hypertensive pts treated and not treatedwith ACEI/ARB
1860 Mo1860 Mo
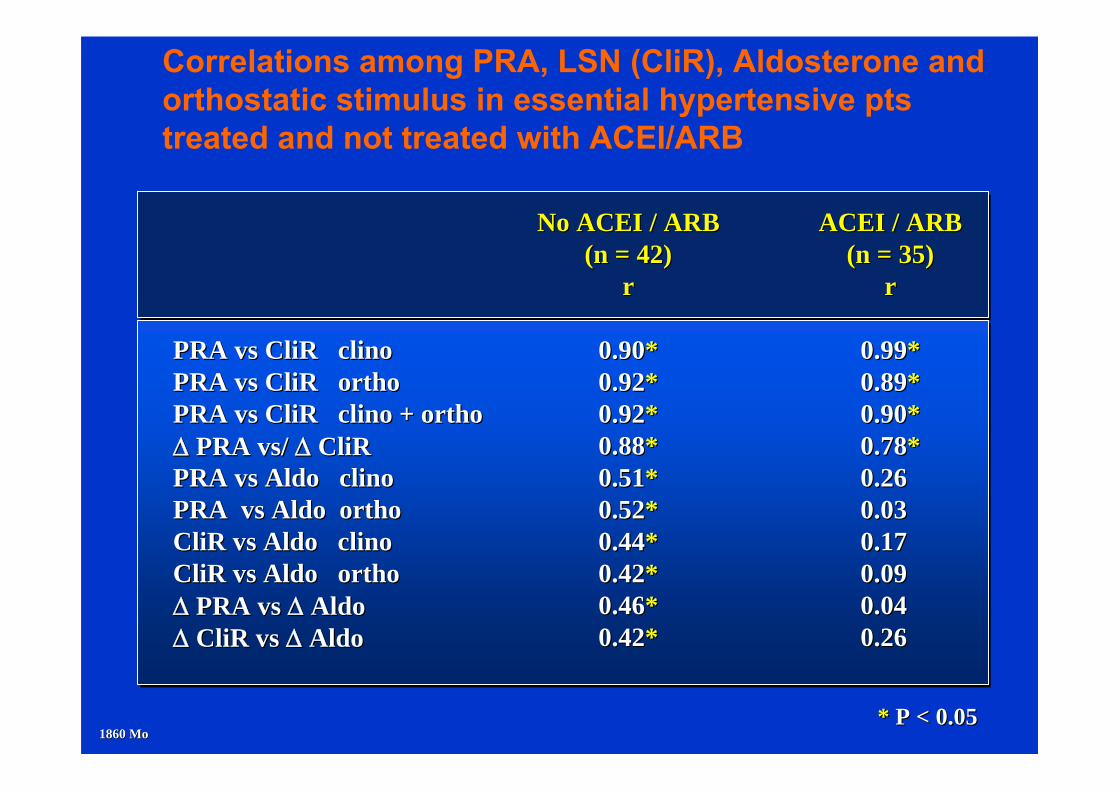
Correlations among PRA, LSN (CliR), Aldosterone andorthostatic stimulus in essential hypertensive pts treated and not treated with ACEI/ARB
No ACEI / ARBNo ACEI / ARB(n = 42)(n = 42)
rr
0.900.90**0.920.92**0.920.92**0.880.88**0.510.51**0.520.52**0.440.44**0.420.42**0.460.46**0.420.42**
ACEI / ARBACEI / ARB(n = 35)(n = 35)
rr
0.990.99**0.890.89**0.900.90**0.780.78**0.260.260.030.030.17 0.17 0.09 0.09 0.04 0.04 0.26 0.26
PRA vs PRA vs CliRCliR clinoclinoPRA vs PRA vs CliRCliR orthoorthoPRA vs PRA vs CliRCliR clino + clino + orthoortho PRA vs/ PRA vs/ CliRCliRPRA vs Aldo clinoPRA vs Aldo clinoPRA vs Aldo PRA vs Aldo orthoorthoCliRCliR vs Aldo clinovs Aldo clinoCliRCliR vs Aldo vs Aldo orthoortho PRA vs PRA vs AldoAldo CliRCliR vs vs AldoAldo
* * P < 0.05P < 0.05
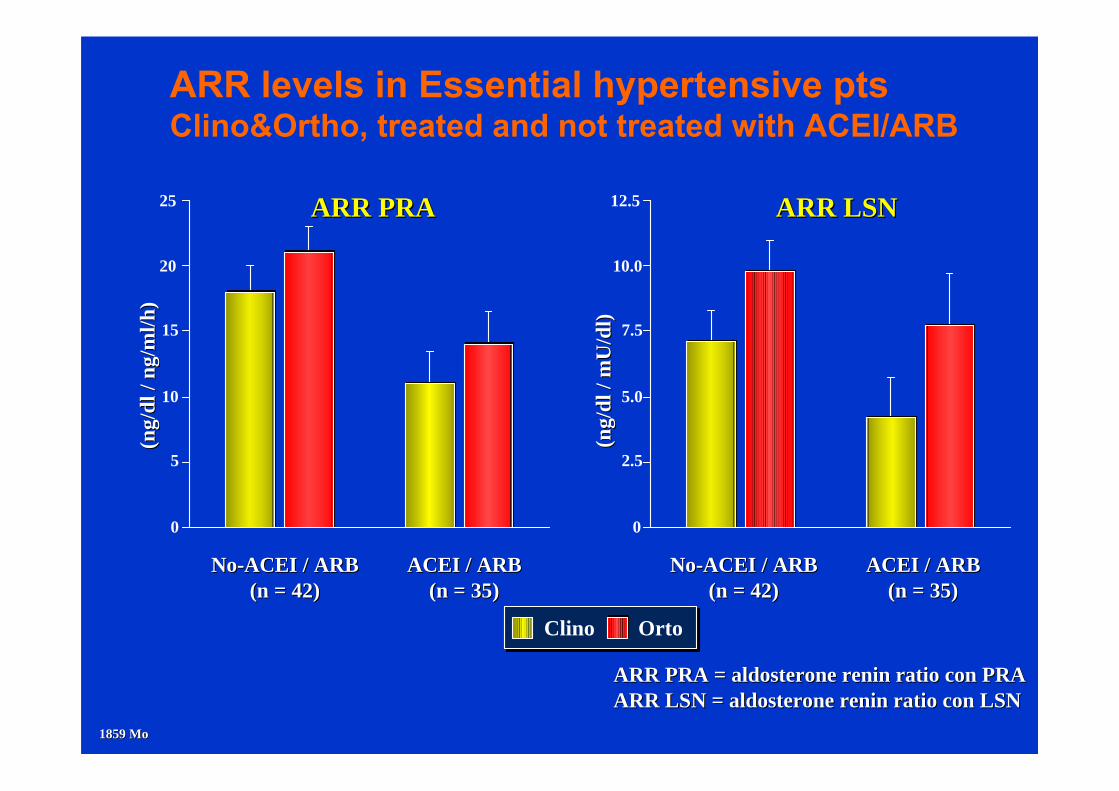
12.5
10.0
7.5
5.0
2.5
0
Orto Clino
25
20
15
10
5
0
ARR levels in Essential hypertensive ptsClino&Ortho, treated and not treated with ACEI/ARB
(ng/
dl /
ng/m
l/h)
(ng/
dl /
ng/m
l/h)
NoNo--ACEI / ARBACEI / ARB(n = 42)(n = 42)
ACEI / ARBACEI / ARB(n = 35)(n = 35)
ARR PRA = aldosterone ARR PRA = aldosterone reninrenin ratio con PRAratio con PRAARR LSN = aldosterone ARR LSN = aldosterone reninrenin ratio con LSNratio con LSN
1859 Mo1859 Mo
(ng/
dl /
(ng/
dl /
mU
mU
/dl)
/dl)
ARR PRAARR PRA ARR LSNARR LSN
NoNo--ACEI / ARBACEI / ARB(n = 42)(n = 42)
ACEI / ARBACEI / ARB(n = 35)(n = 35)
1853 Mo1853 Mo
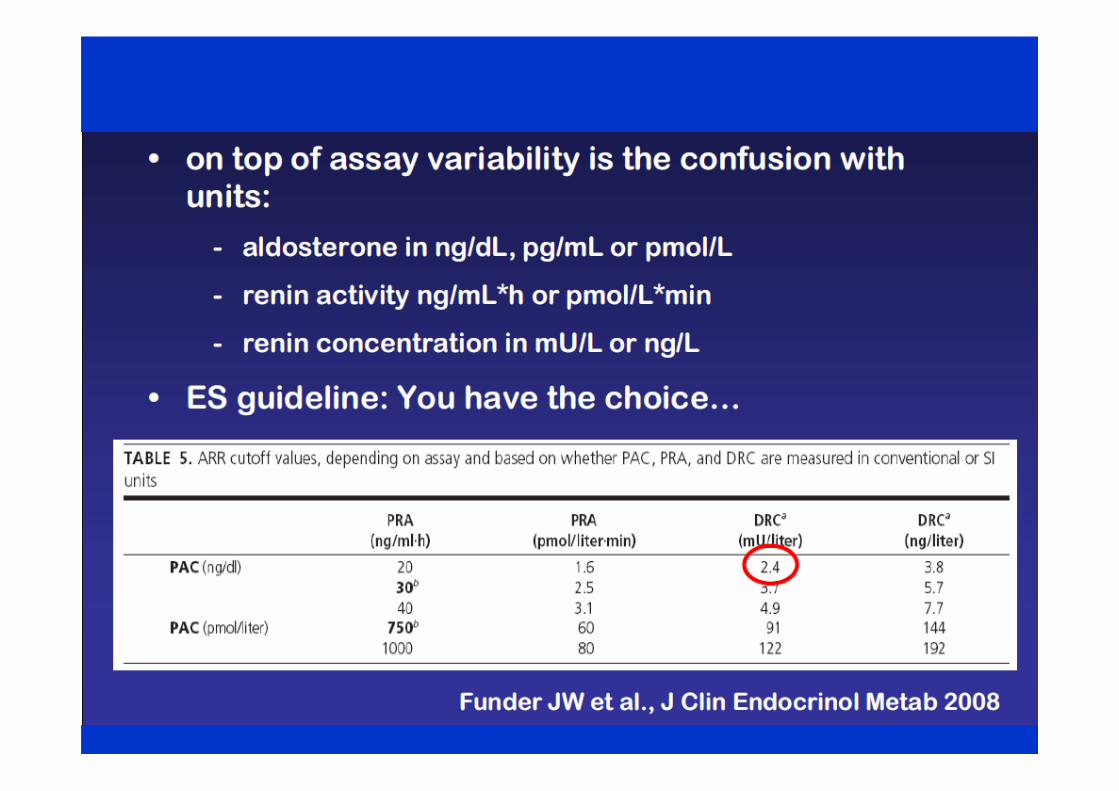
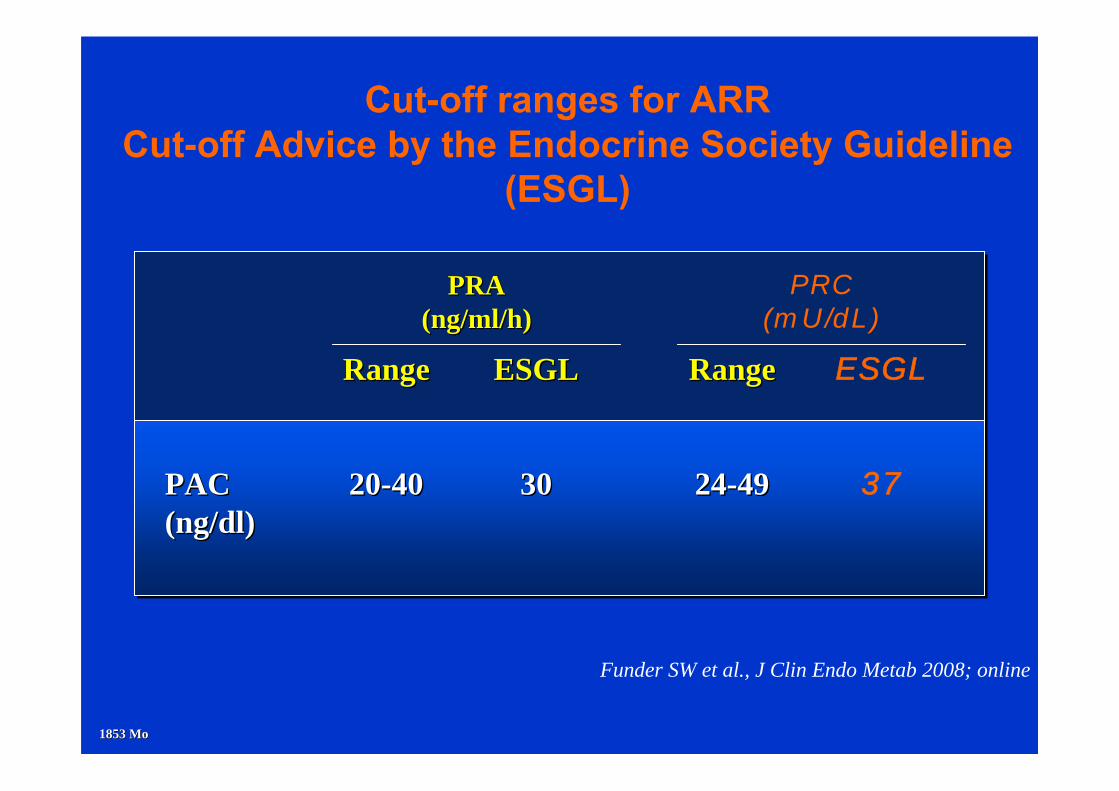
Cut-off ranges for ARR Cut-off Advice by the Endocrine Society Guideline
(ESGL)
Funder SW et al., J Clin Endo Metab 2008; online
RangeRange
2020--4040
ESGLESGL
3030
RangeRange
2424--4949
ESGL
37PACPAC(ng/dl)(ng/dl)
PRAPRA(ng/ml/h)(ng/ml/h)
PRC(mU/dL)
1861 Mo1861 Mo
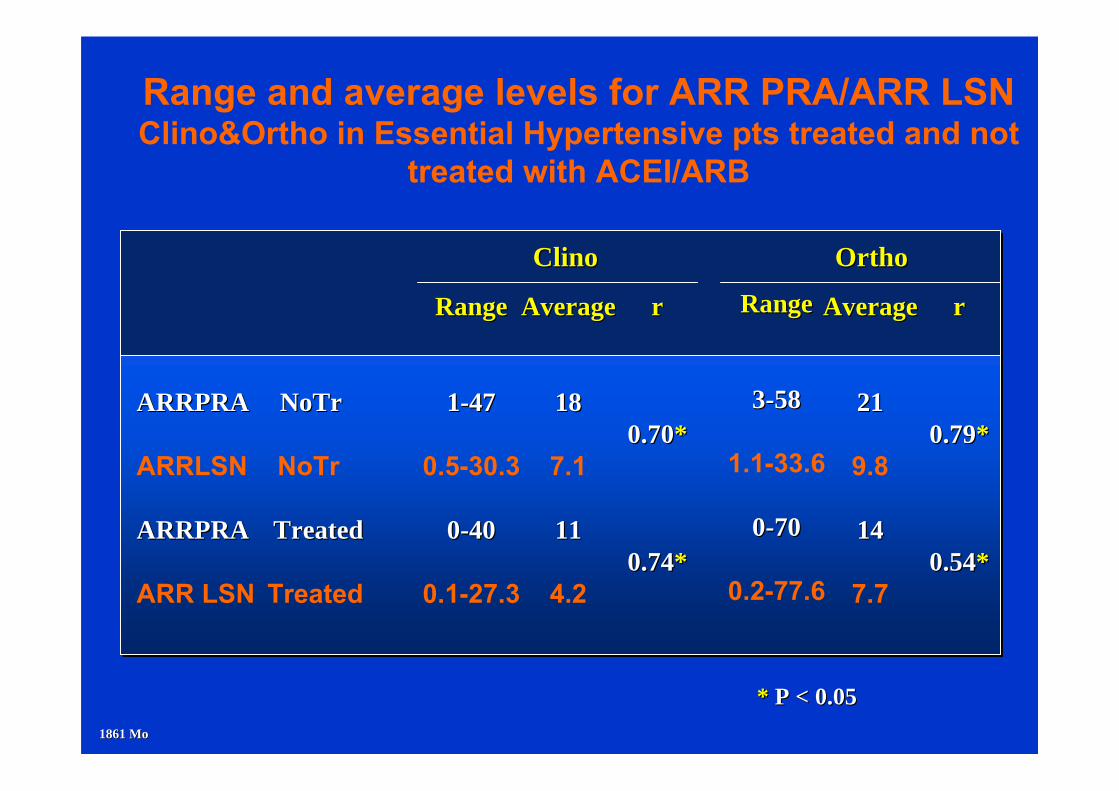
Range and average levels for ARR PRA/ARR LSN Clino&Ortho in Essential Hypertensive pts treated and not
treated with ACEI/ARB
RangeRange
11--4747
0.5-30.3
00--4040
0.1-27.3
ARRPRA ARRPRA NoTrNoTr
ARRLSN NoTr
ARRPRA ARRPRA TreatedTreated
ARR LSN Treated
* * P < 0.05P < 0.05
AverageAverage
1818
7.1
1111
4.2
rr
0.700.70**
0.740.74**
RangeRange
33--5858
1.1-33.6
00--7070
0.2-77.6
AverageAverage
2121
9.8
1414
7.7
rr
0.790.79**
0.540.54**
ClinoClino OrthoOrtho
1862 Mo1862 Mo
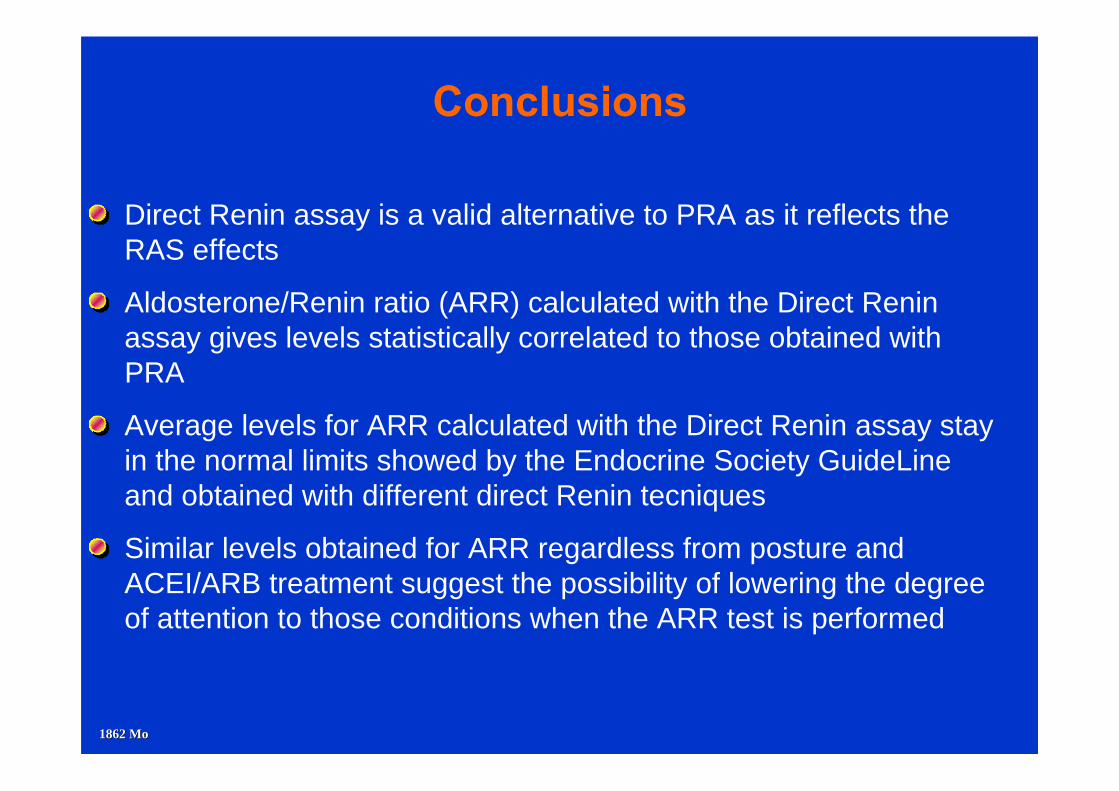
Conclusions
Direct Renin assay is a valid alternative to PRA as it reflects the RAS effects
Aldosterone/Renin ratio (ARR) calculated with the Direct Renin assay gives levels statistically correlated to those obtained with PRA
Average levels for ARR calculated with the Direct Renin assay stay in the normal limits showed by the Endocrine Society GuideLineand obtained with different direct Renin tecniques
Similar levels obtained for ARR regardless from posture and ACEI/ARB treatment suggest the possibility of lowering the degree of attention to those conditions when the ARR test is performed
Ongoing studies
• To monitor effectiveness of the therapy with Renin inhibitors (Aliskiren by Novartis)
• To assess the involvement of Renin level risk of cardiovascular events
• To DIAGNOSE Primary Aldosteronism

TODA
THANKS
GRAZIE