Embed Size (px)
Citation preview
Pak. J. Engg. & Appl. Sci. Vol. 15, July, 2014 (p. 37-49)
37
Analytical Load Displacement Curves of RC Columns under
Constant Axial and Cyclic Lateral Loads M. Rizwan
1, M. T. A. Chaudhary
2, M. Ilyas
1
1. Department of Civil Engineering, University of Engineering & Technology, Lahore,
2. Al Imam Mohammad Ibn Saud Islamic University, Riyadh, Saudi Arabia, [email protected].
Abstract
The cyclic tests of the columns are of practical relevance to the performance of compression
members during earthquake loading. The strength, ductility and energy absorption capabilities of RC
columns, subjected to cyclic loading, have been estimated by many researchers. These characteristics
are not normally inherent in plain concrete but can be achieved by effectively confining columns
through transverse reinforcement. An extensive experimental program, in which performance of four
RC columns detailed according to provisions of ACI-318-08, was studied in comparison with that of
four columns confined by a new proposed technique. Out of total eight, this paper presents
performance of three columns which were detailed according to provision of ACI-318-08 and cast
with 25 and 32 MPa concrete. The experimentally achieved load-displacement hysteresis and
backbone curves of the three columns are presented. Two approaches, which utilize moment-curvature
and shear-shear strain relationship of RC columns achieved through Response-2000, have been
suggested to draw analytical load-displacement curves of the columns. The experimental and
analytical load-displacement curves are found in good agreement. The suggested analytical technique
is simple and easy to implement. The technique will be available to the engineers involved in design to
estimate capacity of RC columns.
Key Words: RCC columns, hystereticbehaviour, Load-Displacement curves
1. Introduction
Concrete is brittle in nature. The confinement
provided in reinforced concrete structural
components introduces the properties of ductility,
deformability and energy dissipation. These
properties have important role to play in seismic
performance of RC multistorey buildings. In 1903
increase in axial capacity of a concrete column
component was found by using spiral transverse
reinforcement [1]. Since then the researchers are
focusing to quantify the contribution of confinement
to the total strength, so that the strength enhancement
can be effectively utilized towards high performance
design. In early part of 20th century most of the
experimental and modelling work, related to confined
concrete, was focused to optimize the value of
coefficient of the equivalent fluid pressure used in
proposed expressions of its compressive strength
[2,3]. With passage of time, it was realized that
compressive strength of confined concrete is also
influenced by shape, pitch, yield strength and
volumetric ratio of confining and longitudinal
reinforcement. Many models considering these
factors were proposed. In initial models it was
assumed that the confining pressure is uniformly
distributed. The assumption was adequate for closely
spaced hoops only. Later influence of spacing of
transverse reinforcement on the confined strength of
concrete was included in confinement index. [4] and
[5] considered spacing of transverse stirrups more
than the least dimension of the column section as
ineffective and calibrated coefficient Ci of their
proposed model by using data of experiments carried
out on 150 mm × 300 mm concrete cylinder. [6, 7]
carried out number of experiments on 150 mm x 300
mm cylinders cast with varied strength of concrete
and confined by varied diameter and yield strength of
spiral transverse reinforcement. A large scatter was
found between results of regression analysis
performed on the experimental data and that obtained
by using confinement index Ci proposed by [4].
Watanabe et al. [8] suggested a confining coefficient
Pak. J. Engg. & Appl. Sci. Vol.15, July, 2014
38
using the ratio of original core volume and that
defined as effectively confined core. The limit strain
given by the proposed model was found to be
conservative. [9,10] conducted experiments on axial
loaded circular columns with 500 mm diameters and
1500 mm height. The specimens were reinforced by
8 to 36 longitudinal reinforcement bars and confined
with transverse reinforcement with varied spacing
and yield strength. The test results and equation given
by [11] was used to suggest a model in form of a
fractional equation to estimate the confined
compressive strength of concrete. The model catered
for effect of volume of effectively confined core and
configuration of lateral and longitudinal
reinforcement through confining coefficient and
effective lateral confining stress. The comparison of
results of model with experimental data indicated that
its estimates were normally on higher side. It was
found that higher strength transverse reinforcement
required higher axial compression to develop
effective confining pressure. [12] and [13] found that
initial strength enhancement due to rectangular hoops
was negligible. Later [14] found evident strength
enhancement by introducing cross ties in four
prototype reinforced concrete columns. [14] modified
the basic model proposed by [15] and included the
effect of cross ties in the strength enhancement due to
rectangular hoops. [16] introduced an effectiveness
factor which utilized the configuration and spacing of
both longitudinal and transverse reinforcement. The
model of [16] was modified by [17] in the same year.
18] presented a model which related the strength and
deformability to confinement. The confinement
efficiency coefficient used by [18] was later modified
to a simpler version [19, 20]. [21] developed a model
for bridge peers using their indigenous experimental
data. The results of Hoshikuma et al. model are
conservative because it does not incorporate effects
of configuration of longitudinal and transverse
reinforcement. [22] proposed a fractional equation
which incorporated effect of spacing and
configuration of confining and longitudinal
reinforcement on strength and strain through separate
efficiency coefficient and volumetric ratio “ s ”.
[23] defined the stress-strain curve for confined
concrete. They used Popovic’s [11] equation for
ascending portion of the curve, [24] equation for
sustaining part and presented a new equation for
descending branch of the curve.
In the confinement models the effects of
configuration and spacing of longitudinal and
transverse reinforcement have been realized and
included through an efficiency coefficient. The basic
argument used in modelling indicates that stress-
strain behaviour of confined concrete is dependent on
effective confinement pressure, peak stress, peak
strain and deteriorating rate. The estimation of the
peak compressive stress of the confined concrete
presented by the models was representable, however,
conservation is observed in estimation of peak strain.
The stress-strain curves of confined concrete have
significant role to play in inelastic seismic response
of RC multistorey building structures and thus
economizing over the seismic design. Therefore,
efforts are continuous to estimate the stress-strain
curves of confined concrete while considering
different confining configuration and material
strengths. Effect of configuration and spacing on the
compressive strength of confined concrete was the
motivation for the authors to propose a confining
technique. The proposed technique has been tested in
an extensive experimental work consisting of eight
prototype column specimens. Four column specimens
were confined with proposed technique and four with
standard stirrups. The concrete strength was varied to
study its effects on proposed confining technique. In
this paper data of three columns confined with
standard stirrups and cast with different concrete
strengths is being presented. Experimentally studied
load-displacement relation of these columns is
estimated using a simple technique, which use the
section analysis of Response-2000 [25] as input. The
authors apprehend that the technique will be useful
for the reader, who might use any other appropriate
software to generate the required input data. The
techniques are presented in the form of algorithms
which can be easily implemented. The comparison of
the proposed technique with studied experimental
response is found in good agreement. The authors
are presenting the proposed technique with a view
that its linear variation approach predicts post peak
behaviour better than existing Axial-Shear-Flexure
Interaction schemes.
Analytical Load Displacement Curves of RC columns under Constant Axial and Cyclic Lateral Loads
39
2. Modeling on Response-2000
Moment-Curvature (M-ϕ) and Shear Force-
Shear Strain (V-γ) relations can be produced using
Modified Compression Field Theory [26]. Response-
2000 relates variation in stresses and strains using the
theory [27]. The program assumes that rate of
flexural stresses across a section defines shear
stresses [28] and generates a load-displacement
response by using its member response function.
When the curves generated by member response
function were compared with those studied in the lab,
the former were found deficient in estimating
ultimate displacement for the actual columns. This is
because Modified Compression Field Theory is
force-based and does not work beyond the peak
strength [29]. Therefore, two different approaches
have been suggested here in this paper.
2.1 Approaches to Plot Theoretical Load Displacement Curves
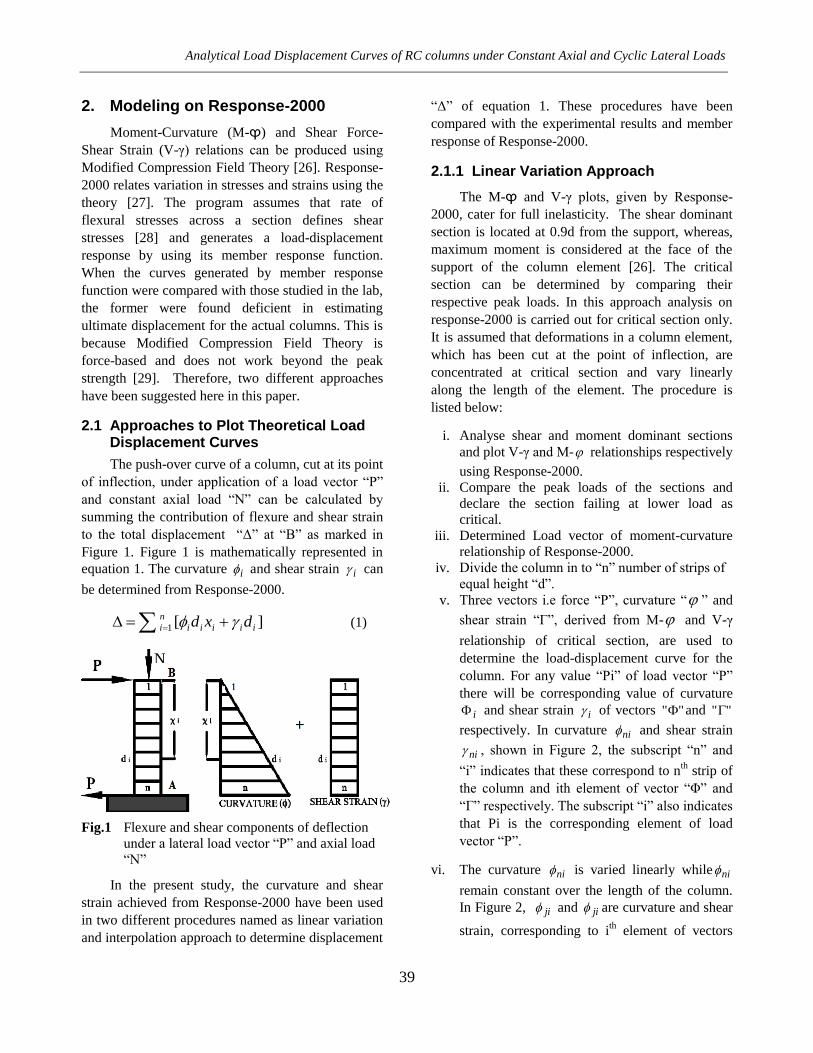
The push-over curve of a column, cut at its point
of inflection, under application of a load vector “P”
and constant axial load “N” can be calculated by
summing the contribution of flexure and shear strain
to the total displacement “Δ” at “B” as marked in
Figure 1. Figure 1 is mathematically represented in
equation 1. The curvature i and shear strain i can
be determined from Response-2000.
][1 iiiii
n
i dxd (1)
Fig.1 Flexure and shear components of deflection
under a lateral load vector “P” and axial load
“N”
In the present study, the curvature and shear
strain achieved from Response-2000 have been used
in two different procedures named as linear variation
and interpolation approach to determine displacement
“Δ” of equation 1. These procedures have been
compared with the experimental results and member
response of Response-2000.
2.1.1 Linear Variation Approach
The M-ϕ and V-γ plots, given by Response-
2000, cater for full inelasticity. The shear dominant
section is located at 0.9d from the support, whereas,
maximum moment is considered at the face of the
support of the column element [26]. The critical
section can be determined by comparing their
respective peak loads. In this approach analysis on
response-2000 is carried out for critical section only.
It is assumed that deformations in a column element,
which has been cut at the point of inflection, are
concentrated at critical section and vary linearly
along the length of the element. The procedure is
listed below:
i. Analyse shear and moment dominant sections
and plot V-γ and M- relationships respectively
using Response-2000.
ii. Compare the peak loads of the sections and
declare the section failing at lower load as
critical.
iii. Determined Load vector of moment-curvature
relationship of Response-2000.
iv. Divide the column in to “n” number of strips of
equal height “d”.
v. Three vectors i.e force “P”, curvature “ ” and
shear strain “Γ”, derived from M- and V-γ
relationship of critical section, are used to
determine the load-displacement curve for the
column. For any value “Pi” of load vector “P”
there will be corresponding value of curvature
i and shear strain i of vectors "" and ""
respectively. In curvature ni and shear strain
ni , shown in Figure 2, the subscript “n” and
“i” indicates that these correspond to nth strip of
the column and ith element of vector “Φ” and
“Γ” respectively. The subscript “i” also indicates
that Pi is the corresponding element of load
vector “P”.
vi. The curvature ni is varied linearly while ni
remain constant over the length of the column.
In Figure 2, ji and ji are curvature and shear
strain, corresponding to ith element of vectors
N

Pak. J. Engg. & Appl. Sci. Vol.15, July, 2014
40
“Φ” and “Γ” respectively, of jth
strip of the
column.
vi. The curvature is assumed to remain constant for
entire height “d” of the element.
vii. The curvature of the jth
strip is calculated as
jnniji xx )/( .
viii. Flexure contribution of jth
strip to “Δi”
corresponding to “Pi” is given as .dx jiji
ix. The shear strain of Jth is niji and its
contribution to “Δi” is dni .
x. Total contribution of jth
strip to “Δi” under load
Pi is given by ddx nijiji .
xi. Deflection “Δi” corresponding to load Pi is
determined by integrating contribution of strips.
This can be represented as equation 2.
...... ddxddx nijijinininii
ddx niii 11 (2)
xii . Change the value of i and i for next value of
Pi of the load vector and determine the complete
load deflection curve.
xiii. In cases where shear section is critical the values
of i are determined by linearly extending
curvatures of critical section to the base. The
shear strain i is considered constant at the face
of the support.
ni ni
Fig.2 Graphical representation of linear variation
approach
2.1.2 Interpolation Approach
In this approach it is assumed that deformation
in a column, as shown in Figure 1, is concentrated at
critical section and its variation, along the length,
depends on M-ϕ and V-γ relationship of different
sections. In this approach curvature and shear strain
for each strip, at given load step, are found by
interpolating in M-ϕ and V-γ relationship of a
section existing in the mid of that strip. The
procedure is explained below.
i. Find the critical section, as is done in linear
variation approach.
ii. The force vector “P” is achieved from analysis
of critical section.
iii. Divide the load vector into two branches i.e.,
ascending up to peak load and descending from
peak till ultimate load.
iv. Divide the column into “n” strips of thickness
“d”.
v. For each strip carryout the analysis on
Response-2000 i.e., if you have “n” strips of
thickness “d”, there will be “n” analysis.
Therefore, there will be “n” M-ϕ and V-γ
relationships.
vi. Drive load vector from analysed M-ϕ and V-γ
relationship of each strip so that there are “n”
load vectors “pn”, where “n” represent the
number of strip. The maximum and minimum
load of each load vector is denoted by pmax and
pmin. Similar to load vector “P” divide each “pn”
and corresponding “Φn” and “Γn” into two
branches.
vii. At any load step “Pi” of load vector “P”, if
pmax≥Pi≥ pmin , search in each load vector “pn”
for value “pni” equal to “Pi”. If value “pni” is not
found, then interpolation within load vector “pn”
will be adopted. Similarly, corresponding value
of curvature ni and shear strain ni will be
found, for each strip, in vectors “Φn” and “Γn”.
Subscript “n” and “i” represents number of strip
and load step of the load vector “P”.
viii. In step “vi” above “Pi”, “pni”, and
referred to same branch i.e ascending or
descending.

Analytical Load Displacement Curves of RC columns under Constant Axial and Cyclic Lateral Loads
41
ix. The contribution of any strip, for which pmax<Pi
or Pi< pmin, is considered as negligible and is
ignored.
x. Mathematically the displacement “Δi” for load
“Pi” is given by equation 2 above. In the
equation jini , and i1 and ,ni ji and y1
are the curvatures and shear strains for nth, j
th
and lst strip corresponding to Pi and xn, xj and xl
are respective moment arms of strips. The
thickness of the strip is represented by “d”.
xi. Graphically it is also presented by Figure 2 but
difference is in ni and ni as described in step
“v” above.
3. Experimental Work
The suggested techniques have been applied to
the studied response of RC columns tested under
application of constant axial and static cyclic lateral
force. The effect of concrete compressive strength on
the response of columns has been taken into account
through material properties assigned to respective
sections in response-2000.
3.1 Specimen and Loading
The detail of test specimen is summarized in
Table 1. The transverse reinforcement is provided
according to provision of ACI-318-08. Two columns
cast with 25 MPa concrete were confined with 415
and 275 MPa transverse reinforcement. The column
cast with 32 MPa concrete was confined with 415
MPa concrete. The dimensions of shear block,
provided with the column, were enough to ensure that
there is no contribution of the base to the response of
the column. In the first cycle 0.25% drift level was
applied. In the second cycle it was increased to 0.5%.
After second cycle each drift level was repeated once
to ensure that response of column at each drift level
is thoroughly studied. An increment of 0.5% in drift
levels was adopted up to 5% drift level. At 5% the
increment was reduced to 0.25%. The final drift level
of 5.5% was repeated until 20% degradation in
strength was achieved. Throughout the test the axial
load was monitored and variation of 7 to 10% has
been observed. The nomenclature assigned to
columns is listed in Table 1. In the Table 1 CRCS
represents Conventionally Reinforced Concrete
Stirrup.
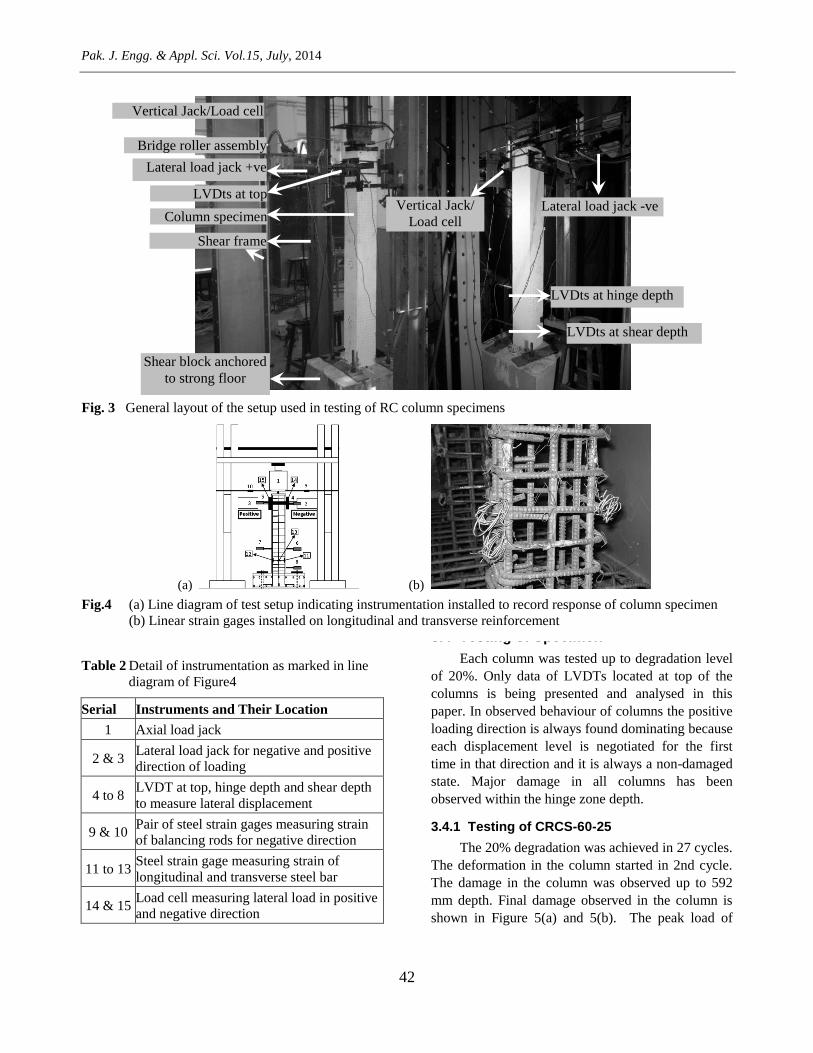
3.2 Testing Arrangement
Standard test assembly for static cyclic loading
was used as shown in Figure 3. In order to include
details two views, from different angles, has been
combined in Figure 3. The shear block was anchored
on the strong floor. The axial load was applied
through bridge roller assembly which ensured
application of lateral and axial loads simultaneously
without any unnecessary restrain. The axial and
lateral loads were applied through different assembly
of shear frames so that the effect of one loading does
not influence the other. The test setup is shown in
Figure 3 and its details are also given.
3.3 Instrumentation
The displacements were measured by means of
LVDTs installed at 1734 mm, 515.5 mm and 169 mm
from shear block. These locations represented full,
hinge and shear depth of the specimen. Three steel
strain gages were installed to measure strain variation
of two longitudinal and one transverse reinforcement
bar within the hinge zone. The force acting on the
balance rods of bridge roller assembly was calculated
from recorded strains and subtracted from lateral
loads applied. All the loads were measured through
load cells. All the gages and load cells were attached
to Strain Smart-5000 scanner. The instrumentation is
shown in Figure 4 and its details are given in Table 2.
Table 1 Specimen geometry, reinforcement, material properties and applied load
Column
Index
Column
Size
(mm)
Column
Size
(mm)
Concrete
strength
(MPa)
Longitudinal
steel (mm)
415 MPa
Transverse
steel
Size (mm),
fy(MPa)
Hinge
length (lo)
(mm)
Spacing
lateral
(within lo)
(mm)
Spacing
lateral(out
of lo) (mm)
Axial Load
(kN)
Transverse
Load
CRCS-60-25 230x230 1734 25 8#12 10, 415 515.5 57 76 132.25 Static cyclic
CRCS-40-25 230x230 1734 25 8#12 10, 275 515.5 57 76 132.25 Static cyclic
CRCS-60-32 230x230 1734 32 8#12 10,415 515.5 57 76 169.28 Static cyclic
Pak. J. Engg. & Appl. Sci. Vol.15, July, 2014
42
Table 2 Detail of instrumentation as marked in line
diagram of Figure4
Serial Instruments and Their Location
1 Axial load jack
2 & 3 Lateral load jack for negative and positive
direction of loading
4 to 8 LVDT at top, hinge depth and shear depth
to measure lateral displacement
9 & 10 Pair of steel strain gages measuring strain
of balancing rods for negative direction
11 to 13 Steel strain gage measuring strain of
longitudinal and transverse steel bar
14 & 15 Load cell measuring lateral load in positive
and negative direction
3.4 Testing of Specimen
Each column was tested up to degradation level
of 20%. Only data of LVDTs located at top of the
columns is being presented and analysed in this
paper. In observed behaviour of columns the positive
loading direction is always found dominating because
each displacement level is negotiated for the first
time in that direction and it is always a non-damaged
state. Major damage in all columns has been
observed within the hinge zone depth.
3.4.1 Testing of CRCS-60-25
The 20% degradation was achieved in 27 cycles.
The deformation in the column started in 2nd cycle.
The damage in the column was observed up to 592
mm depth. Final damage observed in the column is
shown in Figure 5(a) and 5(b). The peak load of
Vertical Jack/Load cell
Bridge roller assembly
Lateral load jack +ve
LVDts at top
Column specimen
Shear frame
Shear block anchored
to strong floor
Vertical Jack/
Load cell Lateral load jack -ve
LVDts at hinge depth
LVDts at shear depth
Fig. 3 General layout of the setup used in testing of RC column specimens
(a) (b)
Fig.4 (a) Line diagram of test setup indicating instrumentation installed to record response of column specimen
(b) Linear strain gages installed on longitudinal and transverse reinforcement
Analytical Load Displacement Curves of RC columns under Constant Axial and Cyclic Lateral Loads
43
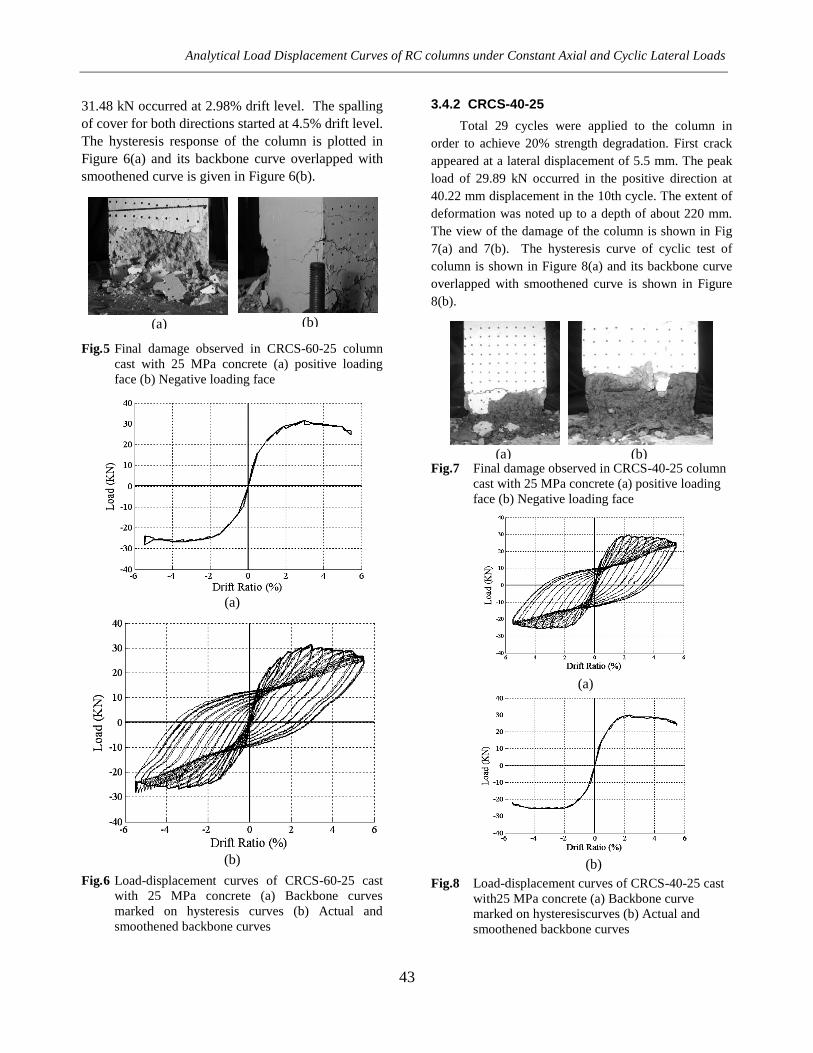
31.48 kN occurred at 2.98% drift level. The spalling
of cover for both directions started at 4.5% drift level.
The hysteresis response of the column is plotted in
Figure 6(a) and its backbone curve overlapped with
smoothened curve is given in Figure 6(b).
Fig.5 Final damage observed in CRCS-60-25 column
cast with 25 MPa concrete (a) positive loading
face (b) Negative loading face
(a)
(b)
Fig.6 Load-displacement curves of CRCS-60-25 cast
with 25 MPa concrete (a) Backbone curves
marked on hysteresis curves (b) Actual and
smoothened backbone curves
3.4.2 CRCS-40-25
Total 29 cycles were applied to the column in
order to achieve 20% strength degradation. First crack
appeared at a lateral displacement of 5.5 mm. The peak
load of 29.89 kN occurred in the positive direction at
40.22 mm displacement in the 10th cycle. The extent of
deformation was noted up to a depth of about 220 mm.
The view of the damage of the column is shown in Fig
7(a) and 7(b). The hysteresis curve of cyclic test of
column is shown in Figure 8(a) and its backbone curve
overlapped with smoothened curve is shown in Figure
8(b).
Fig.7 Final damage observed in CRCS-40-25 column
cast with 25 MPa concrete (a) positive loading
face (b) Negative loading face
Fig.8 Load-displacement curves of CRCS-40-25 cast
with25 MPa concrete (a) Backbone curve
marked on hysteresiscurves (b) Actual and
smoothened backbone curves
(b)
(a)
(b)
(b) (a)
(a)
Pak. J. Engg. & Appl. Sci. Vol.15, July, 2014
44
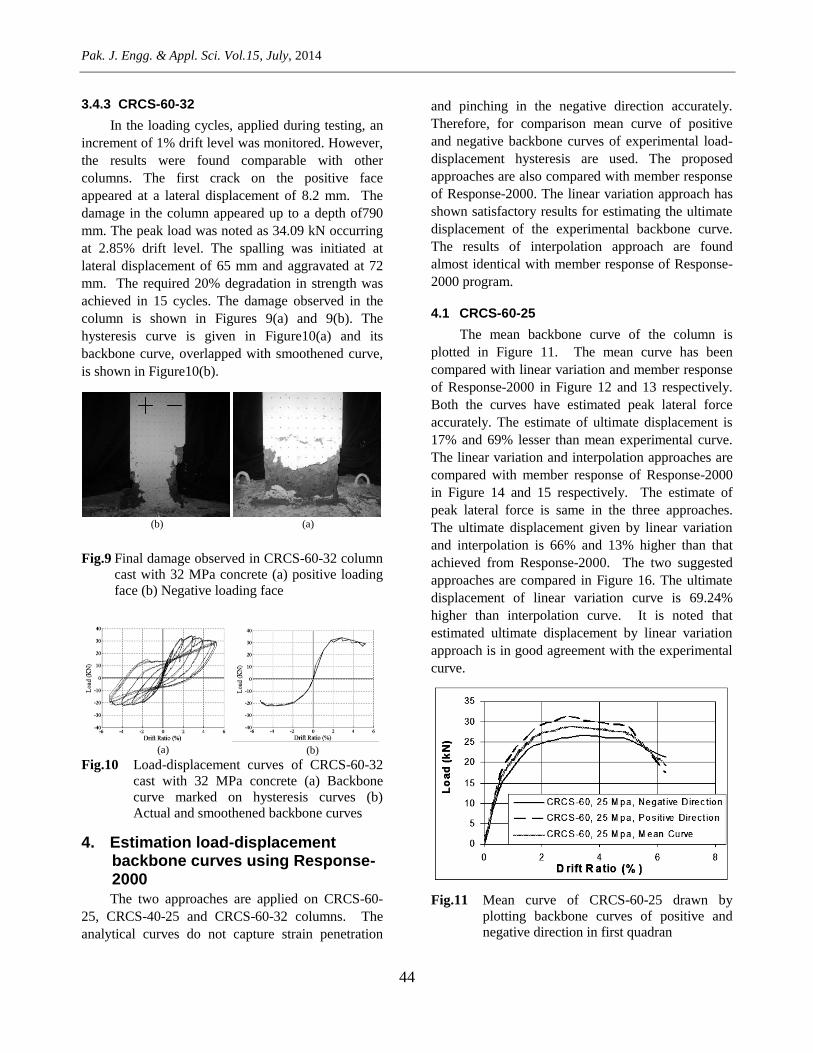
3.4.3 CRCS-60-32
In the loading cycles, applied during testing, an
increment of 1% drift level was monitored. However,
the results were found comparable with other
columns. The first crack on the positive face
appeared at a lateral displacement of 8.2 mm. The
damage in the column appeared up to a depth of790
mm. The peak load was noted as 34.09 kN occurring
at 2.85% drift level. The spalling was initiated at
lateral displacement of 65 mm and aggravated at 72
mm. The required 20% degradation in strength was
achieved in 15 cycles. The damage observed in the
column is shown in Figures 9(a) and 9(b). The
hysteresis curve is given in Figure10(a) and its
backbone curve, overlapped with smoothened curve,
is shown in Figure10(b).
Fig.9 Final damage observed in CRCS-60-32 column
cast with 32 MPa concrete (a) positive loading
face (b) Negative loading face
Fig.10 Load-displacement curves of CRCS-60-32
cast with 32 MPa concrete (a) Backbone
curve marked on hysteresis curves (b)
Actual and smoothened backbone curves
4. Estimation load-displacement backbone curves using Response-2000
The two approaches are applied on CRCS-60-
25, CRCS-40-25 and CRCS-60-32 columns. The
analytical curves do not capture strain penetration
and pinching in the negative direction accurately.
Therefore, for comparison mean curve of positive
and negative backbone curves of experimental load-
displacement hysteresis are used. The proposed
approaches are also compared with member response
of Response-2000. The linear variation approach has
shown satisfactory results for estimating the ultimate
displacement of the experimental backbone curve.
The results of interpolation approach are found
almost identical with member response of Response-
2000 program.
4.1 CRCS-60-25
The mean backbone curve of the column is
plotted in Figure 11. The mean curve has been
compared with linear variation and member response
of Response-2000 in Figure 12 and 13 respectively.
Both the curves have estimated peak lateral force
accurately. The estimate of ultimate displacement is
17% and 69% lesser than mean experimental curve.
The linear variation and interpolation approaches are
compared with member response of Response-2000
in Figure 14 and 15 respectively. The estimate of
peak lateral force is same in the three approaches.
The ultimate displacement given by linear variation
and interpolation is 66% and 13% higher than that
achieved from Response-2000. The two suggested
approaches are compared in Figure 16. The ultimate
displacement of linear variation curve is 69.24%
higher than interpolation curve. It is noted that
estimated ultimate displacement by linear variation
approach is in good agreement with the experimental
curve.
Fig.11 Mean curve of CRCS-60-25 drawn by
plotting backbone curves of positive and
negative direction in first quadran
(b) (a)
(a) (b)

Analytical Load Displacement Curves of RC columns under Constant Axial and Cyclic Lateral Loads
45
Fig. 12 Experimental and linear variation curves of
CRCS-60-25 overlapped
Fig. 13 Experimental and member response curves
of CRCS-60-25overlapped
Fig. 14 Linear variation and member response
curves of CRCS-60-25 overlapped
Fig. 15 Member response and interpolation curves of CRCS-60-25 overlapped
Fig. 16 Linear variation and interpolation curves of
CRCS-60-25 overlapped
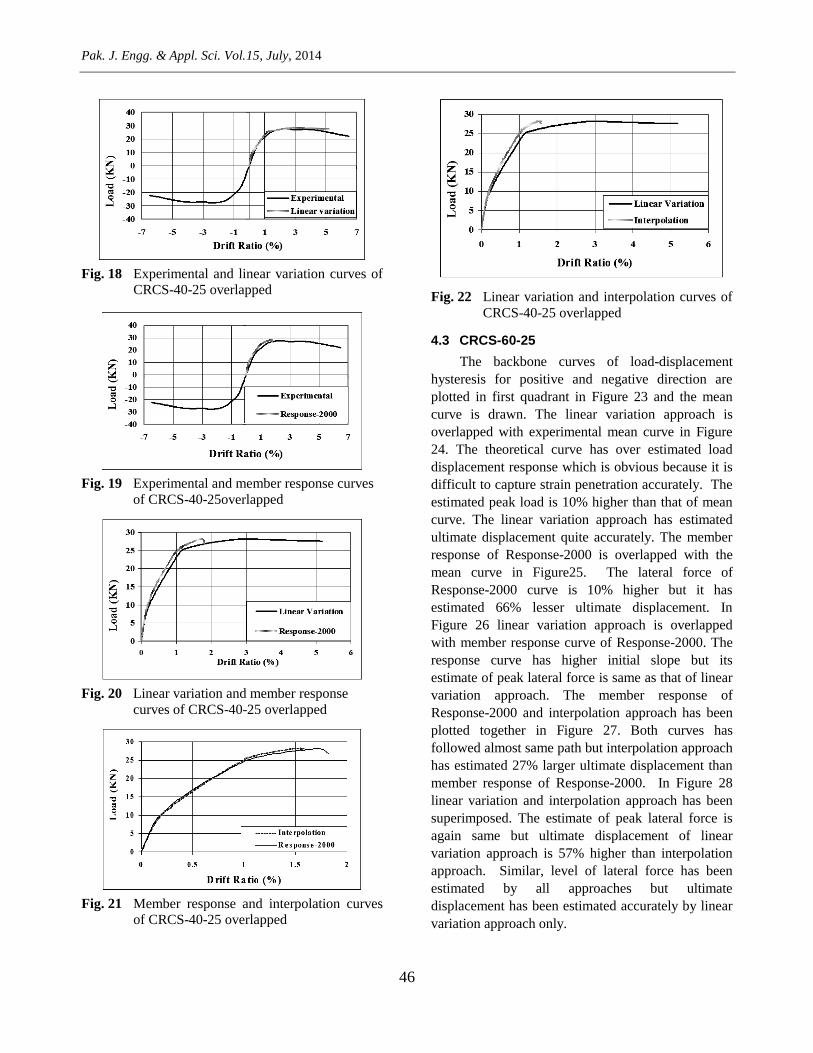
4.2 CRCS-40-25
The backbone curves, in negative and positive
direction, of CRCS-40-25 have been plotted in first
quadrant and their mean is drawn in Figure 17. The
peak lateral load estimated by all approaches, for
CRCS-40-25 column, is approximately equal and
closely matches the value of peak load of mean
experimental curve. The ultimate displacement
estimated by linear variation approach is 20.21%
lesser than mean experimental curve, shown in
Figure 18. The Response-2000 curve has under
estimated ultimate displacement by 72% plotted in
Figure 19. The linear variation and interpolation
approach has been compared with Response-2000
curve in Figure 20 and 21. The estimate of ultimate
displacement of interpolation and linear variation
approach is 12.6% and 64.7% higher than the value
given by Response curve. The linear variation and
interpolation approach has been compared with each
other in Figure 22. The ultimate displacement of
linear variation curve is 69.4% higher than
interpolation curve. Comparison carried out here
dictates that estimate of linear variation approach has
been more realistic due to its accuracy in calculation
of ultimate displacement.
Fig. 17 Mean curve of CRCS-40-25 drawn by
plotting backbone curves of positive and
negative direction in first quadrant
Pak. J. Engg. & Appl. Sci. Vol.15, July, 2014
46
Fig. 18 Experimental and linear variation curves of
CRCS-40-25 overlapped
Fig. 19 Experimental and member response curves
of CRCS-40-25overlapped
Fig. 20 Linear variation and member response
curves of CRCS-40-25 overlapped
Fig. 21 Member response and interpolation curves
of CRCS-40-25 overlapped
Fig. 22 Linear variation and interpolation curves of
CRCS-40-25 overlapped
4.3 CRCS-60-25
The backbone curves of load-displacement
hysteresis for positive and negative direction are
plotted in first quadrant in Figure 23 and the mean
curve is drawn. The linear variation approach is
overlapped with experimental mean curve in Figure
24. The theoretical curve has over estimated load
displacement response which is obvious because it is
difficult to capture strain penetration accurately. The
estimated peak load is 10% higher than that of mean
curve. The linear variation approach has estimated
ultimate displacement quite accurately. The member
response of Response-2000 is overlapped with the
mean curve in Figure25. The lateral force of
Response-2000 curve is 10% higher but it has
estimated 66% lesser ultimate displacement. In
Figure 26 linear variation approach is overlapped
with member response curve of Response-2000. The
response curve has higher initial slope but its
estimate of peak lateral force is same as that of linear
variation approach. The member response of
Response-2000 and interpolation approach has been
plotted together in Figure 27. Both curves has
followed almost same path but interpolation approach
has estimated 27% larger ultimate displacement than
member response of Response-2000. In Figure 28
linear variation and interpolation approach has been
superimposed. The estimate of peak lateral force is
again same but ultimate displacement of linear
variation approach is 57% higher than interpolation
approach. Similar, level of lateral force has been
estimated by all approaches but ultimate
displacement has been estimated accurately by linear
variation approach only.

Analytical Load Displacement Curves of RC columns under Constant Axial and Cyclic Lateral Loads
47
Fig. 23 Mean curve of CRCS-60-32 Mpa concrete
drawn by plotting backbone curves of positive
and negative direction in first quadrant
Fig. 24 Experimental and linear variation curves of
CRCS-60-32 overlapped
Fig. 25 Experimental and member response curves of
CRCS-60-32 overlapped
Fig. 26 Linear variation and member response curves
of CRCS-60-32 overlapped
Fig. 27 Interpolation and member response curves of
CRCS-60-32 overlapped
Fig. 28 Linear variation and interpolation curves of
CRCS-60-32 overlapped
5. Limitation
The approaches are applicable for unidirectional
lateral and constant axial load cases. The response of
RC columns is affected with pattern of loading. The
approaches cannot address the complexity involved
in combing moment-curvature relation of two
orthogonal directions.
6. Conclusions
The use of mean experimental curves catered for
any short fall which may be present in experimental
setup. Mostly, hysteresis plotted by analytical
procedure has similar properties in both positive and
negative direction. The use of mean of backbone
curve of positive and negative directions has
accommodated limitation of analytical procedures.
Estimate of ultimate displacement of load-
displacement curves by response-2000 has been
much conservative. The estimation of load-
displacement curves of RC columns by interpolation
approach approximately matches member response
option of response-2000. The load-displacement
curves estimated by linear variation approach were
found closest to the mean experimental curves.

Pak. J. Engg. & Appl. Sci. Vol.15, July, 2014
48
7. Acknowledgement
The authors acknowledge the support of
Pakistan Higher Education Commission, Islamabad
for funding this research work.
References
[1] Sheikh S A, 1978. Effectiveness of Rectangular
Ties as Confinement Steel in Reinforced
Concrete Columns.” Ph.D Thesis, Department
of Civil Engineering, University of Toronto,
Canada, pp. 256.
[2] Richart, F. E., Brandzaeg, A. and Brown, R. L.
1928. “A study of the failure of concrete under
Combined Compressive Stresses”. University
of Illinois Engineering Station, Bulletin No.
185, 104 pp.
[3] Balmer, G.G. 1943. “Shearing Strength of
Concrete under High Triaxial Stresses –
Computation of Mohr’s Envelope as a Curve”.
Structural Research Laboratory Report No. SP-
23, U.S. Bureau of Reclamation, 13 pp. plus
tables and Figures.
[4] Iyengar, S.R., Desayi, K.P.T., and Nagi, R.K.;
Desayi and Nagi Reddy, K., 1970. “Stress-
Strain Characteristics of concrete Confined in
Steel Binder”, Magazine of Concrete Research,
Vol. 22, No 72, pp. 173-184.
[5] Parakash Desayi, Sundara Raja Iyengar, K.T.
and Sanjeeva Reddy, T. 1978. “Equation for
Stress-Strain Curve of Concrete Confined in
Circular Steel Spiral”, Matériau et
Constructions, Vol. 11 – No 65, pp. 339-345.
[6] Muguruma, H., Watanabe, F., Tanaka, H.,
Sakurai, K. and Nakamura, E. 1979. “Effect of
Confinement by High Yield Strength Hoop
Reinforcement upon the Compressive Ductility
of Concrete”, Proceedings of the Twenty-
Second Japan Congress on Material Research,
The Society of Material Science, Japan, pp.
377-382.
[7] Muguruma, H., Watanabe, F., Tanaka, H.,
Sakurai, K. and Nakamura, E. 1979. “Study on
Improving the Flexure and Shear Deformation
Capacity of Concrete Member by Using Lateral
Confining Reinforcement with High Yield
Strength”, Comité Euro-International du Béton,
BULLETIN D'INFORMATION No 132,
Volume 2 – Technical Papers, AICAP-CEB
Symposium, Rome, May, pp. 37-44.
[8] Watanabe, F., Muguruma, H., Tanaka, H. and
Katsuda, S., 1980. “Improving the Flexural
Ductility of Prestressed Concrete Beam by
Using the High Yield Strength Lateral Hoop
Reinforcement”, FIP, Symposia on Partial
Prestressing and Practical Construction in
Prestressed and Reinforced Concrete,
Proceedings: Part 2, Bucuresti-România, pp.
398-406.
[9] Mander, J. B., Priestley, M.J.N. and Park, R.
1988. “Theoretical Stress Strain Model for
Confined Concrete” Journal of Structural
Engineering, American Society of Civil
Engineers, vol. 114, No. 8, pp. 1804-1826.
[10] Mander, J. B., Priestley, M.J.N. and Park, R.
1988. “Observed Stress-Strain Behavior of
Confined Concrete” Journal of Structural
Engineering, American Society of Civil
Engineers, No. 8, pp. 1827-1849.
[11] Popovics, S. 1973. “A Numerical Approach to
the complete Stress-Strain Curves of
Concrete”, Cement and Concrete Research,
Vol. 3, No. 5, pp. 583-599.
[12] Roy, H.E.H. and Sozen, M.A. 1964. “Ductility
of Concrete”, Proceedings of the International
Symposium on Flexural Mechanics of
Reinforced Concrete, ASCE-ACI, Miami, pp.
213-224.
[13] Soliman, S.A. and Uzumeri, S.M., 1979.
“Properties of Concrete Confined by
Rectangular Tie”, AICAP-CEB Symposium on
Structural Concrete under Seismic Actions
(Rome, May 1979), Bulletin d'Information No.
132, Comité Euro-International du Beton,
Paris, pp-53-60.
[14] Park, R., Priestley, M.J.N. and W.D. Gill.
1982. “Ductility of Square Confined Concrete
Columns” Proceedings ASCE, Vol. 108, ST4,
pp-929-950.
Analytical Load Displacement Curves of RC columns under Constant Axial and Cyclic Lateral Loads
49
[15] Kent, D. C. and Park, R. 1971. “Flexural
Members with Confined Concrete”,
Proceedings of ASCE, Vol. 97, No. ST 7, pp.
1969-1990.
[16] Sheikh S. A. and Uzumeri , S. M., 1980.
“Strength and ductility of tied concrete
columns”, Journal of the structure division,
ASCE, 106(5), pp 1079-1102.
[17] Sheikh S. A. and Yeh C.C., 1982. “Flexural
behavior of confined concrete columns”, ACI
Journal, pp-389–404.
[18] Saatcioglu, M. and Razvi, S. R., 1992.
“Strength and ductility of confined concrete”,
Journal of Structural Engineering, ASCE, 118
(6), pp. 1590-1607.
[19] Razvi, S. R. and Saatcioglu, M. 1996. “Design
of RC columns for confinement based on
lateral drift”, Ottawa-Carleton Earthquake
Engineering Research Center, Report
OCEERC 96-02, Dept. of Civil Engineering,
Univ. of Ottawa, Ottawa, Canada, pp. 92.
[20] Razvi, S. R. and Saatcioglu, M. 1999. “Stress-
strain relationship for confined high strength
concrete”, Journal of Structural Engineering,
ASCE, 125 (3).
[21] Hoshikuma, J. , Kawashima, K., Nayaga, K.
and Taylor, A.W. 1994. “Stress–strain model
for confined RC in bridge piers”, Journal of
Structural Engineering, Vol.123(5), pp-624–
633.
[22] EL-Dash. K. M. and Ahmad. S. H. 1994. “A
model for the stress-strain relationship of
rectangular confined normal and high strength
concrete columns”, Material and structures,
No. 27, pages 572-579.
[23] Bousalem, B. and Chikh, N. 2006.
“Development of a confined model for
rectangular ordinary reinforced concrete
columns”, Journal of Material and Structures,
DOI 10.1617/s11527-06-9172-2.
[24] Bing, L., Park, R. and Tanaka, H. 2001. Stress–
strain behavior of high strength concrete
confined by ultra-high and normal strength
transverse reinforcements. Structural Journal,
ACI, May–June, pp-395–406.
[25] Response 2000. 2013. “A sectional analysis
program that will calculate the strength and
ductility of a reinforced concrete cross-section
subjected to shear, moment, and axial load”
http://www.ecf.utoronto.ca/~bentz/r2k.htm, last
visited on August 2013.
[26] Vecchio F.J and Collins M. P 1988. “Predicting
the response of reinforced concrete beams
subjected to shear using modified compression
field theory”. ACI Structural Journal, Vol 85
No 3, pp-258-268.
[27] Bentz E. C. and Collins M. P 2009. “Load-
Deformation Response of Reinforced Concrete
Sections”.
http://www.ecf.utoronto.ca/~bentz/inter4/inter4
.shtml, Visited on 19 March 2013.
[28] Bentz E. 2001. “Response 2000, Shell 2000,
Triax 2000 and Membrane 2000”, User
Manual. Version 1.1.
[29] Shi-Yu Xu and Jian Zhang., 2008. “Hysteresis
Models for Reinforced Concrete Columns
Considering Axial-Shear-Flexure Interaction”.
The 14th World Conference on Earthquake
Engineering October 12-17, Beijing, China.