Embed Size (px)
Citation preview
CHAPTER 3
ANALYTICAL
METHOD
DEVELOPMENT
Analytical Methods
3.1 PREPARATION OF CALIBRATION PLOT OF RGZ IN METHANOL
3.1.1 Reagents
3.1.2 Method
3.2 PREPARATION OF CALIBRATION PLOT OF RGZ IN DIFFUSION
MEDIUM [50 mM HPBCD, 20 mM HEPES, pH 7.4]
3.2.1 Reagents
3.2.2 Method
3.3 PREPARATION OF CALIBRATION PLOT OF CDS IN METHANOL
3.3.1 Reagents
3.3.2 Method
3.4 PREPARATION OF CALIBRATION PLOT OF CDS IN DIFFUSION
MEDIUM (100 mM HPBCD, 20 mM HEPES, pH 7.4)
3.4.1 Reagents
3.4.2 Method
3.5 PREPARATION OF CALIBRATION PLOT OF RGZ IN PLASMA BY HPLC
METHOD
3.5.1 Reagents
3.5.2 Preparation of standard solutions and calibration standards
3.5.3 Instrumentation
3.5.4 Extraction procedure
3.5.5 HPLC conditions
3.6 PREPARATION OF CALIBRATION PLOT OF CDS IN PLASMA BY HPLC
METHOD
3.6.1 Reagents
3.6.2 Preparation of standard solutions and calibration standards
3.6.3 Instrumentation
3.6.4 Extraction procedure
3.6.5 HPLC conditions
3.7 DETERMINATION OF D-MANNOSE
3.7.1 Reagents
3.7.2 Procedure
3.8 DETERMINATION OF PHOSPHORUS.
3.8.1 Principle
3.8.2 Reagents
3.8.3 Procedure
3.9 DETERMINATION OF TOTAL PROTEINS
3.9.1 Principle
3.9.2 Reagents
3.9.3 Procedure
3.9.4 Calculation
3.10 DETERMINATION OF ALBUMIN IN SERUM
3.10.1 Principle
3.10.2 Reagents
3.10.3 Procedure
3.10.4 Calculation
3.11 DETERMINATION OF GLOBULIN IN SERUM
3.12 DETERMINATION OF ASPARTATE AMINOTRANSFERASE (AST) IN
SERUM
3.12.1 Principle
3.12.2 Reagents
3.12.3 Procedure
3.12.4 Calculation
3.13 DETERMINATION OF ALANINE AMINOTRANSFERASE (ALT) IN
SERUM
3.13.1 Principle
3.13.2 Reagents
3.13.3 Procedure
3.13.4 Calculation
3.14 DETERMINATION OF HYDROXYPROLINE IN TISSUE
3.14.1 Reagents:
3.14.2 Procedure
3.14.2.1 Tissue hydrolysis
3.14.2.2 Hydroxyproline determination
3.14.2.3 Special considerations
3.15 DETERMINATION OF HYALURONIC ACID IN SERUM
3.15.1 Background
3.15.2 Reagent Preparation
3.15.3 Assay Procedure
3.15.4 Reference Values
3.16 DETERMINATION OF TOTAL BILIRUBIN IN SERUM
3.16.1 Principle
3.16.2 Reagents
3.16.3 Procedure
3.16.4 Calculation
3.17 CONCLUSIONS
3.18 REFERENCES
Functionalized Nanocarriers for Effective Treatment of Liver Fibrosis
Chapter 3 Analytical Method Development
147
In this investigation, lyophilized formulation comprising functionalized liposomes of
RGZ and CDS were prepared for the treatment of liver fibrosis. The chemical
characterization of liposomes and developed formulation were carried out to
determine the percentage drug entrapment and percentage drug retention. The stability
studies were conducted to determine percentage drug retained in liposomes over stage
of six months period. In vitro drug diffusion studies followed by in vivo
pharmacokinetic studies were also carried out. The analytical methods employed in
these investigations are discussed below.
3.1 PREPARATION OF CALIBRATION PLOT OF RGZ IN METHANOL
The spectroscopic determination of RGZ is based on the zero order UV spectra of
RGZ giving maxima at 311.8 nm in methanol (The Merck Index, 2001; Martindale,
1996; Goyal and Singhvi, 2007; Jagathi et al., 2010).
3.1.1 Reagents
(i) Methanol for spectroscopy Uvasol®.
(ii) Stock solution of RGZ: 1 mg/mL solution of RGZ was prepared in methanol.
3.1.2 Method
Appropriate aliquots of the stock solution of RGZ were transferred to 10 mL
volumetric flasks and were diluted up to the mark with methanol. The absorption
maxima (λmax) was determined by scanning 10 µg/mL solution against reagent blank
on UV-Visible Spectrophotometer (UV-1700, Schimadzu). The absorption of all the
prepared solutions was then measured at the absorbance maxima, 311.8 nm against
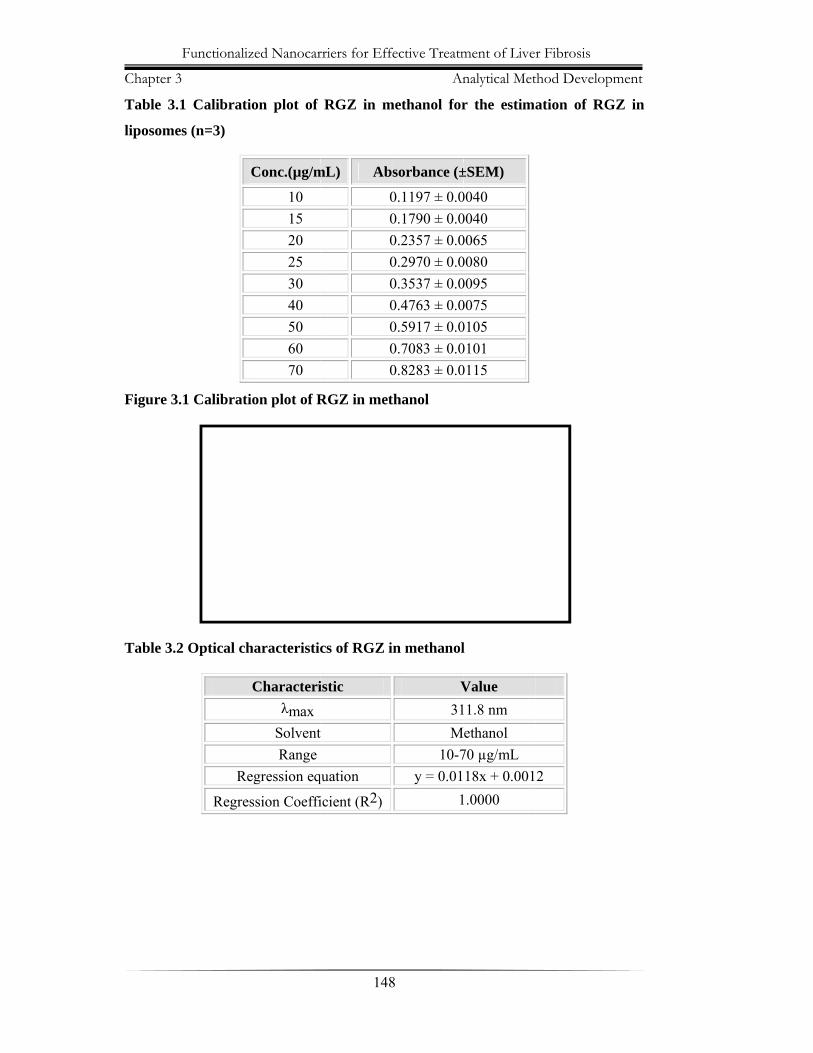
the reagent blank. The readings were recorded in triplicate. Mean value (n=3) along
with the standard error of mean (SEM) are recorded in Table 3.1. The regressed
values of absorption were plotted graphically against the concentrations, as shown in
Figure 3.1.
Stability of the solutions of RGZ in methanol used for preparing the calibration plot
was ascertained by observing the changes in the absorbance of the solution at the
analytical wavelength, over a period of 48 hr at room temperature.
Chapter 3
Table 3.
liposome
Figure 3
Table 3.2
Functionaliz
3
.1 Calibrati
es (n=3)
.1 Calibrati
2 Optical ch
Re
Regre
zed Nanocar
ion plot of
Conc.(µg/m
10 15 20 25 30 40 50 60 70
ion plot of R
haracteristic
Characteriλmax
Solvent Range
egression eq
ssion Coeffi
rriers for Eff
148
RGZ in m
mL) Ab
000000000
RGZ in met
cs of RGZ i
istic
t
quation
icient (R2)
fective Treatm
An
8
methanol for
sorbance (±
0.1197 ± 0.00.1790 ± 0.00.2357 ± 0.00.2970 ± 0.00.3537 ± 0.00.4763 ± 0.00.5917 ± 0.00.7083 ± 0.00.8283 ± 0.0
thanol
in methanol
V31M
10-7y = 0.01
1
ment of Live
nalytical Met
r the estim
±SEM)
0040 0040 0065 0080 0095 0075 0105 0101 0115
l
Value 11.8 nm ethanol
70 µg/mL 18x + 0.001
1.0000
r Fibrosis
thod Develop
ation of RG
2
pment
GZ in
Functionalized Nanocarriers for Effective Treatment of Liver Fibrosis
Chapter 3 Analytical Method Development
149
Table 3.3 Accuracy and precision of RGZ estimation by UV- specroscopic
method in methanol (n=6)
Conc.(µg/mL)
Obtained Conc. (µg/mL) (±SEM) % Recovery % RSD
10 10.026 ± 0.082 100.244 1.370 20 20.067 ± 0.115 100.335 0.995 40 40.104 ± 0.237 100.261 1.022 70 69.752 ± 0.398 99.645 0.988
Accuracy is reflected from % Recovery and precision from % RSD
3.2 PREPARATION OF CALIBRATION PLOT OF RGZ IN DIFFUSION
MEDIUM [50 mM HPBCD, 20 mM HEPES, pH 7.4]
The spectroscopic determination of RGZ is based on the zero order UV spectra of
RGZ giving maxima at 313.8 nm in diffusion medium (50 mM HPBCD, 20 mM
HEPES, pH 7.4) (The Merck Index, 2001; Martindale, 1996; Goyal and Singhvi,
2007; Jagathi et al., 2010).
3.2.1 Reagents
(i) Freshly prepared diffusion medium (50 mM HPBCD, 20 mM HEPES, pH 7.4).
(ii) Stock solution of RGZ: 0.5 mg/mL solution of RGZ was prepared in diffusion
medium (50 mM HPBCD, 20 mM HEPES, pH 7.4).
3.2.2 Method
Appropriate aliquots of the stock solution of RGZ were transferred to 10mL
volumetric flasks and were diluted up to the mark with diffusion medium (50 mM
HPBCD, 20 mM HEPES, pH 7.4). The absorption maxima (λmax) was determined by
scanning 10 µg/mL solution against reagent blank on UV-Visible Spectrophotometer
(UV-1700, Schimadzu). The absorption of all the prepared solutions was then
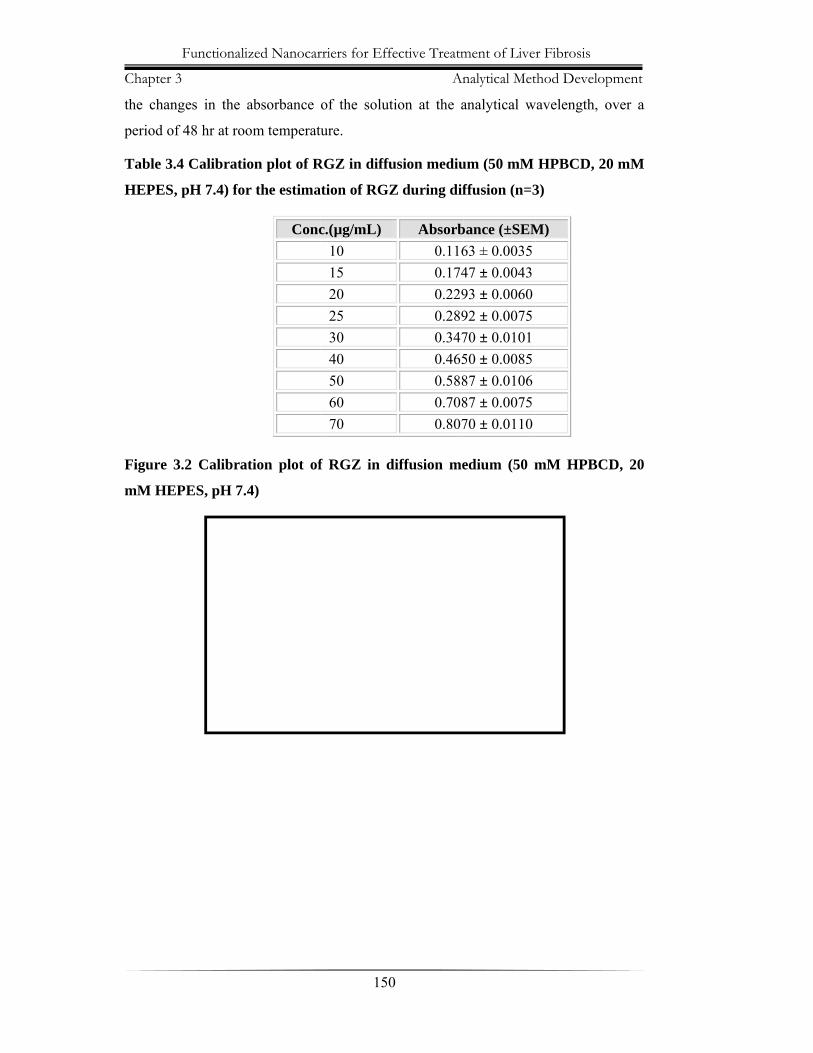
measured at the absorbance maxima, 313.8 nm against the reagent blank. The
readings were recorded in triplicate. Mean value (n=3) along with the standard error
of mean (SEM) are recorded in Table 3.4. The regressed values of absorption were
plotted graphically against the concentrations, as shown in Figure 3.2.
Stability of the solutions of RGZ in diffusion medium (50 mM HPBCD, 20 mM
HEPES, pH 7.4) used for preparing the calibration plot, was ascertained by observing
Chapter 3
the chan
period of
Table 3.4
HEPES,
Figure 3
mM HEP
Functionaliz
3
ges in the a
f 48 hr at roo
4 Calibratio
pH 7.4) for
3.2 Calibrat
PES, pH 7.4
zed Nanocar
absorbance
om temperatu
on plot of R
r the estima
tion plot of
4)
Conc
rriers for Eff
150
of the solut
ure.
RGZ in diffu
ation of RGZ
f RGZ in d
c.(µg/mL) 10 15 20 25 30 40 50 60 70
fective Treatm
An
0
tion at the a
usion mediu
Z during dif
diffusion me
Absorb0.1160.1740.2290.2890.3470.4650.5880.7080.807
ment of Live
nalytical Met
analytical w
um (50 mM
ffusion (n=3
edium (50 m
bance (±SEM63 ± 0.003547 ± 0.004393 ± 0.006092 ± 0.007570 ± 0.010150 ± 0.008587 ± 0.010687 ± 0.007570 ± 0.0110
r Fibrosis
thod Develop
wavelength, o
HPBCD, 20
3)
mM HPBC
M)
pment
over a
0 mM
CD, 20
Functionalized Nanocarriers for Effective Treatment of Liver Fibrosis
Chapter 3 Analytical Method Development
151
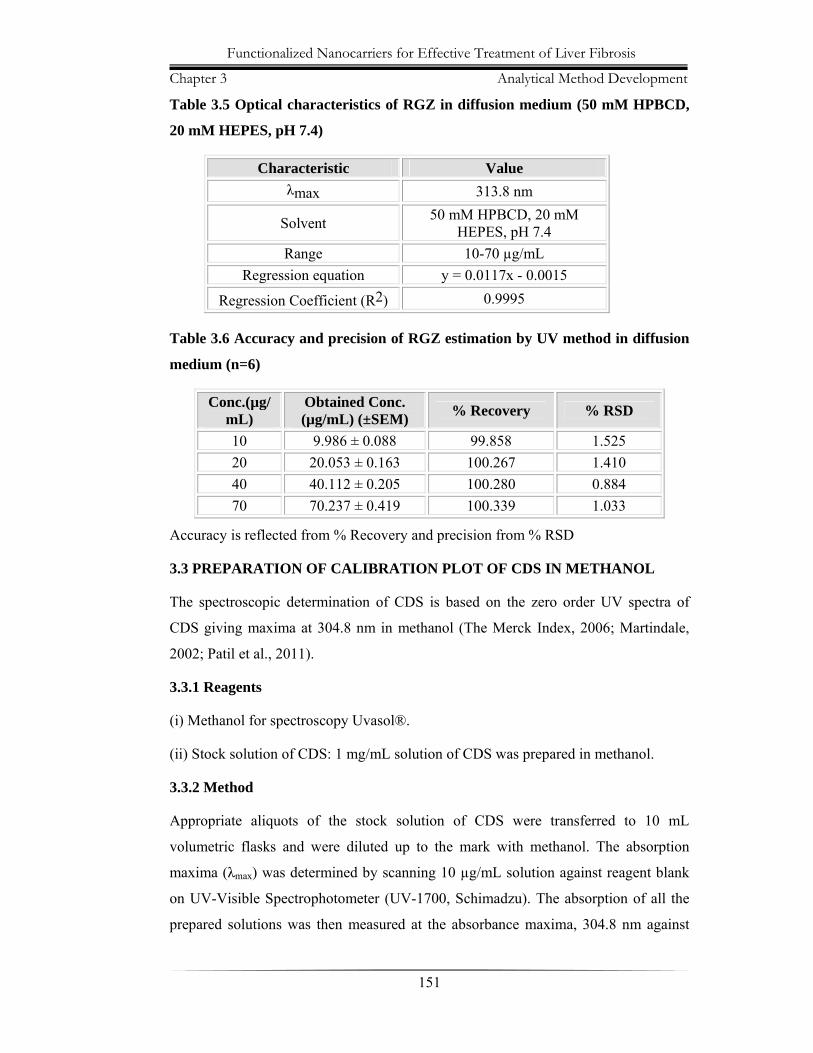
Table 3.5 Optical characteristics of RGZ in diffusion medium (50 mM HPBCD,
20 mM HEPES, pH 7.4)
Table 3.6 Accuracy and precision of RGZ estimation by UV method in diffusion
medium (n=6)
Conc.(µg/mL)
Obtained Conc. (µg/mL) (±SEM) % Recovery % RSD
10 9.986 ± 0.088 99.858 1.525 20 20.053 ± 0.163 100.267 1.410 40 40.112 ± 0.205 100.280 0.884 70 70.237 ± 0.419 100.339 1.033
Accuracy is reflected from % Recovery and precision from % RSD
3.3 PREPARATION OF CALIBRATION PLOT OF CDS IN METHANOL
The spectroscopic determination of CDS is based on the zero order UV spectra of
CDS giving maxima at 304.8 nm in methanol (The Merck Index, 2006; Martindale,
2002; Patil et al., 2011).
3.3.1 Reagents
(i) Methanol for spectroscopy Uvasol®.
(ii) Stock solution of CDS: 1 mg/mL solution of CDS was prepared in methanol.
3.3.2 Method
Appropriate aliquots of the stock solution of CDS were transferred to 10 mL
volumetric flasks and were diluted up to the mark with methanol. The absorption
maxima (λmax) was determined by scanning 10 µg/mL solution against reagent blank
on UV-Visible Spectrophotometer (UV-1700, Schimadzu). The absorption of all the
prepared solutions was then measured at the absorbance maxima, 304.8 nm against
Characteristic Value λmax 313.8 nm
Solvent 50 mM HPBCD, 20 mM HEPES, pH 7.4
Range 10-70 µg/mL Regression equation y = 0.0117x - 0.0015
Regression Coefficient (R2) 0.9995
Chapter 3
the reage
with the
values of
Figure 3.
Stability
was asce
analytica
Table 3.
liposome
Figure 3
Functionaliz
3
ent blank. Th
standard er
f absorption
.3.
of the solut
ertained by
al wavelength
.7 Calibrati
es (n=3)
C
.3 Calibrati
zed Nanocar
he readings
rror of mea
were plotte
tions of CDS
observing th
h, over a per
ion Plot of
Conc.(µg/mL5
10 15 20 25 30 35 40 50 60 70 80
ion plot of C
rriers for Eff
152
were record
an (SEM) ar
d graphicall
S in methan
he changes
riod of 48 hr
f CDS in m
L) A
CDS in meth
fective Treatm
An
2
ded in triplic
re recorded
ly against th
nol used for
in the abso
r at room tem
methanol for
Absorbance0.0467 ± 00.0933 ± 00.1437 ± 00.1983 ± 00.2393 ± 00.2890 ± 00.3313 ± 00.3807 ± 00.4803 ± 00.5677 ± 00.6723 ± 00.7663 ± 0
hanol
ment of Live
nalytical Met
cate. Mean v
in Table 3
he concentrat
preparing th
rbance of th
mperature.
r the estim
e (±SEM) 0.0015 0.0040 0.0051 0.0067 0.0086 0.0105 0.0116 0.0097 0.0120 0.0111 0.0115 0.0120
r Fibrosis
thod Develop
value (n=3)
.7. The reg
tions, as sho
he calibratio
he solution
mation of CD
pment
along
ressed
own in
on Plot
at the
DS in
Functionalized Nanocarriers for Effective Treatment of Liver Fibrosis
Chapter 3 Analytical Method Development
153
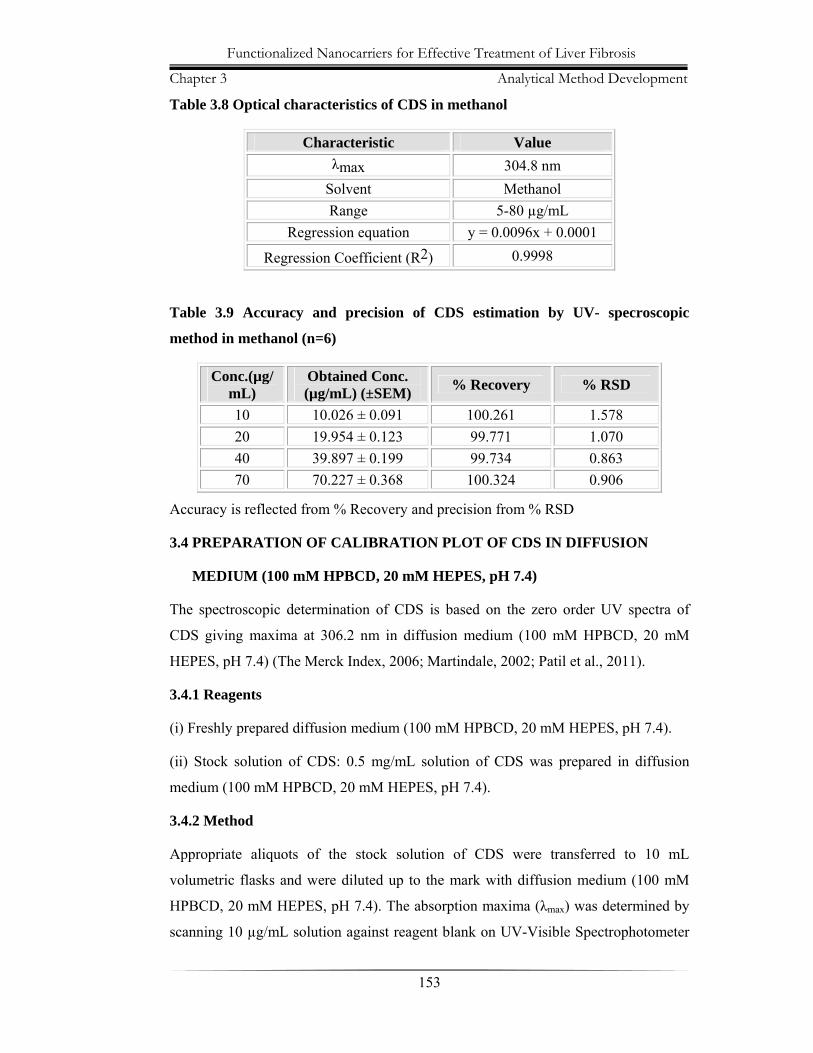
Table 3.8 Optical characteristics of CDS in methanol
Table 3.9 Accuracy and precision of CDS estimation by UV- specroscopic
method in methanol (n=6)
Conc.(µg/mL)
Obtained Conc. (µg/mL) (±SEM) % Recovery % RSD
10 10.026 ± 0.091 100.261 1.578 20 19.954 ± 0.123 99.771 1.070 40 39.897 ± 0.199 99.734 0.863 70 70.227 ± 0.368 100.324 0.906
Accuracy is reflected from % Recovery and precision from % RSD
3.4 PREPARATION OF CALIBRATION PLOT OF CDS IN DIFFUSION
MEDIUM (100 mM HPBCD, 20 mM HEPES, pH 7.4)
The spectroscopic determination of CDS is based on the zero order UV spectra of
CDS giving maxima at 306.2 nm in diffusion medium (100 mM HPBCD, 20 mM
HEPES, pH 7.4) (The Merck Index, 2006; Martindale, 2002; Patil et al., 2011).
3.4.1 Reagents
(i) Freshly prepared diffusion medium (100 mM HPBCD, 20 mM HEPES, pH 7.4).
(ii) Stock solution of CDS: 0.5 mg/mL solution of CDS was prepared in diffusion
medium (100 mM HPBCD, 20 mM HEPES, pH 7.4).
3.4.2 Method
Appropriate aliquots of the stock solution of CDS were transferred to 10 mL
volumetric flasks and were diluted up to the mark with diffusion medium (100 mM
HPBCD, 20 mM HEPES, pH 7.4). The absorption maxima (λmax) was determined by
scanning 10 µg/mL solution against reagent blank on UV-Visible Spectrophotometer
Characteristic Value λmax 304.8 nm
Solvent Methanol Range 5-80 µg/mL
Regression equation y = 0.0096x + 0.0001
Regression Coefficient (R2) 0.9998
Chapter 3
(UV-170
measured
readings
of mean
plotted gr
Stability
HEPES,
the chan
period of
Table 3.
mM HEP
Figure 3
mM HEP
Functionaliz
3
00, Schimad
d at the ab
were record
(SEM) are r
raphically ag
of the solu
pH 7.4) use
ges in the a
f 48 hr at roo
10 Calibrat
PES, pH 7.4
C
3.4 Calibrat
PES, pH 7.4
zed Nanocar
dzu). The a
bsorbance m
ded in triplic
recorded in
gainst the co
utions of CD
d for prepar
absorbance
om temperatu
tion plot of
4) for the es
onc. (µg/mL5
10 15 20 25 30 35 40 50 60 70 80
tion plot of
4)
rriers for Eff
154
absorption o
maxima, 306
cate. Mean v
Table 3.10.
oncentrations
DS in diffus
ring the calib
of the solut
ure.
f CDS in di
stimation of
L)
f CDS in di
fective Treatm
An
4
of all the p
6.2 nm aga
value (n=3)
The regress
s, as shown
ion medium
bration plot,
tion at the a
iffusion med
f CDS durin
Absorbanc0.0493 ±0.0977 ±0.1523 ±0.2117 ±0.2557 ±0.3090 ±0.3527 ±0.4050 ±0.5107 ±0.6040 ±0.7080 ±0.8247 ±
iffusion med
ment of Live
nalytical Met
prepared so
ainst the rea
along with
sed values o
in Figure 3.4
m (100 mM
was ascerta
analytical w
dium (100
ng diffusion
ce (±SEM)± 0.0035 ± 0.0047 ± 0.0057 ± 0.0075 ± 0.0095 ± 0.0125 ± 0.0111 ± 0.0092 ± 0.0115 ± 0.0105 ± 0.0122 ± 0.0106
dium (100
r Fibrosis
thod Develop
olutions was
agent blank
the standard
of absorption
4.
HPBCD, 20
ained by obse
wavelength, o
mM HPBC
(n=3)
mM HPBC
pment
s then
k. The
d error
n were
0 mM
erving
over a
CD, 20
CD, 20
Functionalized Nanocarriers for Effective Treatment of Liver Fibrosis
Chapter 3 Analytical Method Development
155
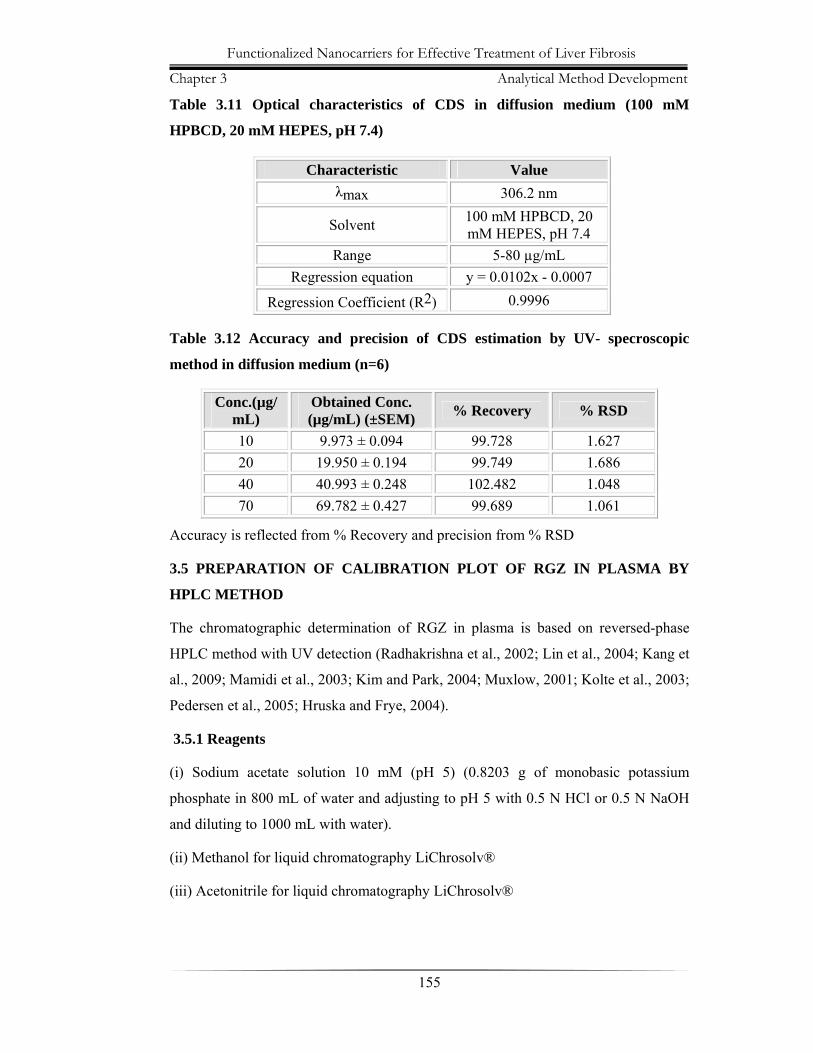
Table 3.11 Optical characteristics of CDS in diffusion medium (100 mM
HPBCD, 20 mM HEPES, pH 7.4)
Table 3.12 Accuracy and precision of CDS estimation by UV- specroscopic
method in diffusion medium (n=6)
Conc.(µg/mL)
Obtained Conc. (µg/mL) (±SEM) % Recovery % RSD
10 9.973 ± 0.094 99.728 1.627 20 19.950 ± 0.194 99.749 1.686 40 40.993 ± 0.248 102.482 1.048 70 69.782 ± 0.427 99.689 1.061
Accuracy is reflected from % Recovery and precision from % RSD
3.5 PREPARATION OF CALIBRATION PLOT OF RGZ IN PLASMA BY
HPLC METHOD
The chromatographic determination of RGZ in plasma is based on reversed-phase
HPLC method with UV detection (Radhakrishna et al., 2002; Lin et al., 2004; Kang et
al., 2009; Mamidi et al., 2003; Kim and Park, 2004; Muxlow, 2001; Kolte et al., 2003;
Pedersen et al., 2005; Hruska and Frye, 2004).
3.5.1 Reagents
(i) Sodium acetate solution 10 mM (pH 5) (0.8203 g of monobasic potassium
phosphate in 800 mL of water and adjusting to pH 5 with 0.5 N HCl or 0.5 N NaOH
and diluting to 1000 mL with water).
(ii) Methanol for liquid chromatography LiChrosolv®
(iii) Acetonitrile for liquid chromatography LiChrosolv®
Characteristic Value λmax 306.2 nm
Solvent 100 mM HPBCD, 20 mM HEPES, pH 7.4
Range 5-80 µg/mL Regression equation y = 0.0102x - 0.0007
Regression Coefficient (R2) 0.9996
Functionalized Nanocarriers for Effective Treatment of Liver Fibrosis
Chapter 3 Analytical Method Development
156
(iv) Freshly prepared mobile phase (10mM sodium acetate pH 5: acetonitrile:
methanol (40 : 40 : 20, v/v/v))
(v) Stock solution of RGZ: 1 mg/mL solution of RGZ was prepared in mobile phase.
3.5.2 Preparation of standard solutions and calibration standards
Stock solutions were prepared by dissolving RGZ in mobile phase to yield primary
solutions with a concentration of 1 mg/mL of RGZ. Calibration standards were
prepared by spiking working standard solutions into drug-free plasma to yield
concentrations of 0.05 µg/mL – 10 µg/mL of RGZ. Triplicate calibration plots were
analyzed daily for 3 days.
3.5.3 Instrumentation
The HPLC system Prominence LC-20AT (Shimadzu, Kyoto, Japan) consisted of a
LC-20AT pump with a manual injector 20 µL fixed loop, equipped with a UV-VIS
detector set at 245.0 nm, with Spinchrom CFR software version 2.4.1.93.
3.5.4 Extraction procedure
RGZ solutions (50 µL) were added and the tube was vortexed for 1 min, was added to
plasma samples (200 µL) in microcentrifuge tubes and vortexed briefly. ACN (600
µL) was then added to each sample, vortexed for 2 min, and centrifuged at 3500 g for
10 min. Supernatant was evaporated using nitrogen gas at 45 ◦C. Dried samples were
reconstituted with 200 µL of mobile phase and were ready for analysis by HPLC.
3.5.5 HPLC conditions
The chromatographic analysis was carried out on a GRACE Brava™ BDS C18 (5
µm, 25 cm × 4.6 mm) column maintained at 30 ± 0.5oC. RGZ was eluted using a
mobile phase composition of 10mM sodium acetate (pH 5): acetonitrile: methanol
(40:40:20, v/v/v) at a flow rate 1.0 mL·min-1. The mobile phase was premixed, filtered
through a 0.45 mm Nylon 66 membrane filter and degassed before use. RGZ was
detected at 245.0 nm and was eluted in 6.7 min after injection.
The calibration plot was linear (r2 > 0.9996) in the concentration range of 0.05-10
µg/mL, and the quantitation limit at 5:1 signal to noice ratio was 0.05 µg/mL.
C
T
F
Fun
Chapter 3
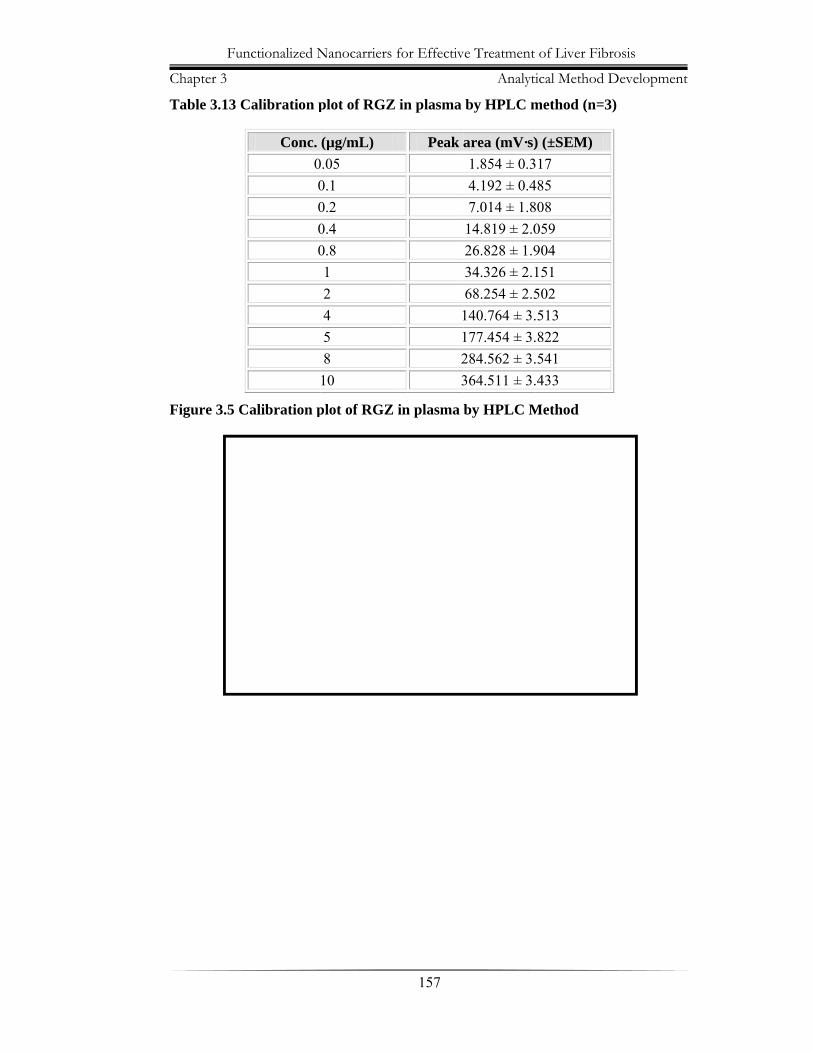
Table 3.13 C
Figure 3.5 C
nctionalized N
Calibration p
Conc. 00000
alibration p
Nanocarriers
plot of RGZ
(µg/mL) 0.05 0.1 0.2 0.4 0.8 1 24 5 8
10
plot of RGZ
for Effectiv
157
Z in plasma
Peak
1123
Z in plasma
ve Treatment
Analyti
by HPLC m
area (mV·s)1.854 ± 0.34.192 ± 0.47.014 ± 1.8
14.819 ± 2.026.828 ± 1.934.326 ± 2.168.254 ± 2.5
140.764 ± 3.177.454 ± 3.284.562 ± 3.364.511 ± 3.
by HPLC M
of Liver Fib
ical Method
method (n=3
) (±SEM) 317 485 808 059 904 151 502.513 .822 .541 .433
Method
brosis
Developmen
3)
nt
Functionalized Nanocarriers for Effective Treatment of Liver Fibrosis
Chapter 3 Analytical Method Development
158
Table 3.14 Chromatographic conditions
Table 3.15 Accuracy and precision of RGZ estimation by HPLC method (n=6)
Conc.(µg/mL)
Obtained Conc. (µg/mL) (±SEM) % Recovery % RSD
0.8 0.802 ± 0.0073 100.276 1.576 2 1.992 ± 0.0173 99.585 1.506 4 3.916 ± 0.0219 97.910 0.970 8 8.029 ± 0.0399 100.357 0.861
Accuracy is reflected from % Recovery and precision from % RSD
3.6 PREPARATION OF CALIBRATION PLOT OF CDS IN PLASMA BY
HPLC METHOD
The chromatographic determination of CDS in plasma is based on reversed-phase
HPLC method with UV detection (Gonzalez et al., 2000; Daneshtalab et al., 2002;
Qutab et al., 2007; Subba Rao et al., 2007; Stenhoff et al., 1999; Erk, 2003).
3.6.1 Reagents
(i) Potassium dihydrogen phosphate 10 mM (1.3609 g of Potassium dihydrogen
phosphate in 1000 mL of water).
(ii) Methanol for liquid chromatography LiChrosolv®
(iii) Acetonitrile for liquid chromatography LiChrosolv®
(iv) Freshly prepared mobile phase (methanol: acetonitrile: 10mM sodium acetate pH
5 (74 : 16 : 10, v/v/v) pH 2.5 adjusted with 0.5 N HCl or 0.5 N NaOH)
Characteristic Condition
Column GRACE Brava™ BDS C18 (5 µm, 25
cm × 4.6 mm) Column temperature 30 ± 0.5oC
Mobile phase 10mM sodium acetate (pH 5): acetonitrile: methanol (40:40:20, v/v/v)
Flow rate 1.0 mL·min-1 Injection volume 20 µL
Detection wavelength 245.0 Range 0.05-10 µg/mL
Regression equation y = 36.1473x - 1.5747
Regression Coefficient (R2) 0.9996
Functionalized Nanocarriers for Effective Treatment of Liver Fibrosis
Chapter 3 Analytical Method Development
159
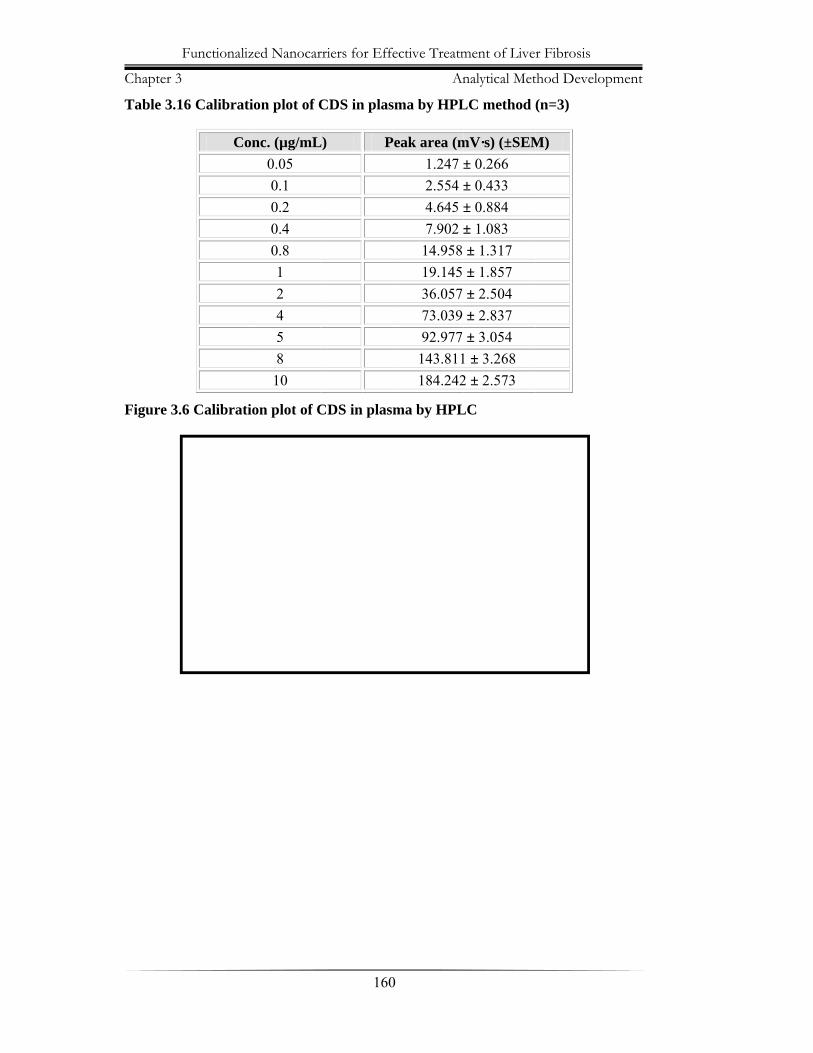
(v) Stock solution of CDS: 1 mg/mL solution of CDS was prepared in mobile phase.
3.6.2 Preparation of standard solutions and calibration standards
Stock solutions were prepared by dissolving CDS in mobile phase to yield primary
solutions with a concentration of 1 mg/mL of CDS. Calibration standards were
prepared by spiking working standard solutions into drug-free plasma to yield
concentrations of 0.05 µg/mL – 10 µg/mL of CDS. Triplicate calibration plots were
analyzed daily for 3 days.
3.6.3 Instrumentation
The HPLC system Prominence LC-20AT (Shimadzu, Kyoto, Japan) consisted of a
LC-20AT pump with a manual injector 20 µL fixed loop, equipped with a UV-VIS
detector set at 260.0 nm, with Spinchrom CFR software version 2.4.1.93.
3.6.4 Extraction procedure
CDS solutions (50 µL) were added and the tube was vortexed for 1 min, was added to
plasma samples (200 µL) in microcentrifuge tubes and vortexed briefly. ACN (600
µL) was then added to each sample, vortexed for 2 min, and centrifuged at 3500 g for
10 min. Supernatant was evaporated using nitrogen gas at 45 oC. Dried samples were
reconstituted with 200 µL of mobile phase and were ready for analysis by HPLC.
3.6.5 HPLC conditions
The chromatographic analysis was carried out on a GRACE Brava™ BDS C18 (5
µm, 25 cm × 4.6 mm) column maintained at 30 ± 0.5oC. CDS was eluted using a
mobile phase composition of methanol: acetonitrile: 10mM sodium acetate pH 5 (74 :
16 : 10, v/v/v) (pH 2.5) at a flow rate 1.0 mL·min-1. The mobile phase was premixed,
filtered through a 0.45 mm Nylon 66 membrane filter and degassed before use. CDS
was detected at 260.0 nm and was eluted in 4.5 min after injection.
The calibration plot was linear (r2 > 0.9997) in the concentration range of 0.05-10
µg/mL, and the quantitation limit at 5:1 signal to noice ratio was 0.05 µg/mL.
Chapter 3
Table 3.1
Figure 3
Functionaliz
3
16 Calibrat
Co
.6 Calibrati
zed Nanocar
ion plot of C
onc. (µg/mL0.05 0.1 0.2 0.4 0.8 1 2 4 5 8
10
ion plot of C
rriers for Eff
160
CDS in plas
L) P
CDS in plas
fective Treatm
An
0
sma by HPL
Peak area (m1.247 ±2.554 ±4.645 ±7.902 ±
14.958 19.145 36.057 73.039 92.977
143.811184.242
ma by HPL
ment of Live
nalytical Met
LC method
mV·s) (±SEM± 0.266 ± 0.433 ± 0.884 ± 1.083 ± 1.317 ± 1.857 ± 2.504± 2.837 ± 3.054
1 ± 3.268 2 ± 2.573
LC
r Fibrosis
thod Develop
(n=3)
M)
pment
Functionalized Nanocarriers for Effective Treatment of Liver Fibrosis
Chapter 3 Analytical Method Development
161
Table 3.17 Chromatographic conditions
Table 3.18 Accuracy and precision of CDS estimation by HPLC method (n=6)
Conc.(µg/mL)
Obtained Conc. (µg/mL) (±SEM) % Recovery % RSD
0.8 0.799 ± 0.0081 99.874 1.756 2 1.995 ± 0.0152 99.749 1.320 4 4.100 ± 0.0229 102.488 0.966 8 7.966 ± 0.0319 99.571 0.694
Accuracy is reflected from % Recovery and precision from % RSD
3.7 DETERMINATION OF D-MANNOSE (Dubois et al., 1956)
3.7.1 Reagents
Reagent 1: Sulfuric acid
Reagent 2: Phenol (80% by weight in water)
3.7.2 Procedure
2 mL of sugar solution containing between 10-70 µg of D-Mannose is pipette into a
colorimetric tube, and 0.05 mL of 80% phenol is added. Then 5 mL of concentrated
sulfuric acid is added rapidly, the stream of acid being directed against the liquid
surface rather than against the side of the test tube in order to obtain good mixing. The
tubes are allowed to stand for 10 minutes, and then they are shaken and placed for 10
to 20 minutes in a water bath at 25o to 30oC before readings are taken. The color is
stable for several hours and readings may be made later if necessary. The absorbance
Characteristic Condition
Column GRACE Brava™ BDS C18 (5 µm, 25
cm × 4.6 mm) Column temperature 30 ± 0.5oC
Mobile phase Methanol: acetonitrile: 10mM sodium acetate pH 5 (74 : 16 : 10, v/v/v) (pH 2.5)
Flow rate 1.0 mL·min-1 Injection volume 20 µL
Detection wavelength 260.0 Range 0.05-10 µg/mL
Regression equation y = 18.2094x + 0.5733
Regression Coefficient (R2) 0.9997
Functionalized Nanocarriers for Effective Treatment of Liver Fibrosis
Chapter 3 Analytical Method Development
162
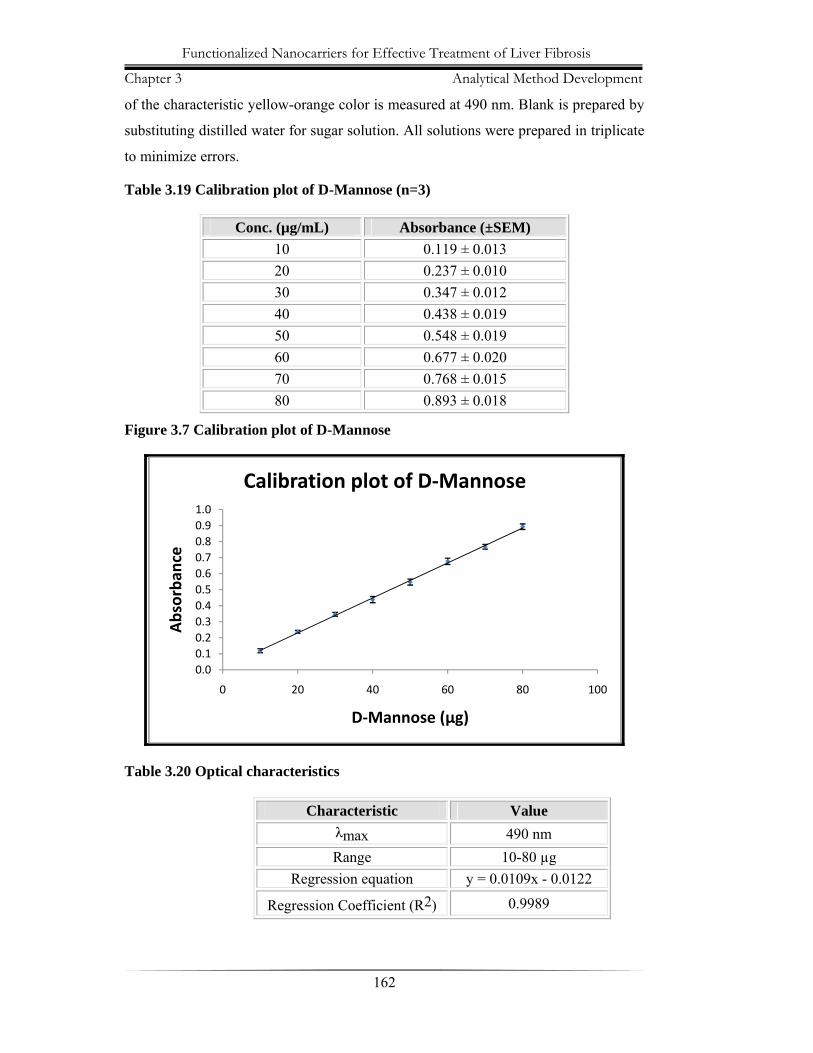
of the characteristic yellow-orange color is measured at 490 nm. Blank is prepared by
substituting distilled water for sugar solution. All solutions were prepared in triplicate
to minimize errors.
Table 3.19 Calibration plot of D-Mannose (n=3)
Conc. (µg/mL) Absorbance (±SEM) 10 0.119 ± 0.013 20 0.237 ± 0.010 30 0.347 ± 0.012 40 0.438 ± 0.019 50 0.548 ± 0.019 60 0.677 ± 0.020 70 0.768 ± 0.015 80 0.893 ± 0.018
Figure 3.7 Calibration plot of D-Mannose
Table 3.20 Optical characteristics
Characteristic Value λmax 490 nm Range 10-80 µg
Regression equation y = 0.0109x - 0.0122
Regression Coefficient (R2) 0.9989
0.00.10.20.30.40.50.60.70.80.91.0
0 20 40 60 80 100
Absorba
nce
D‐Mannose (µg)
Calibration plot of D‐Mannose
Functionalized Nanocarriers for Effective Treatment of Liver Fibrosis
Chapter 3 Analytical Method Development
163
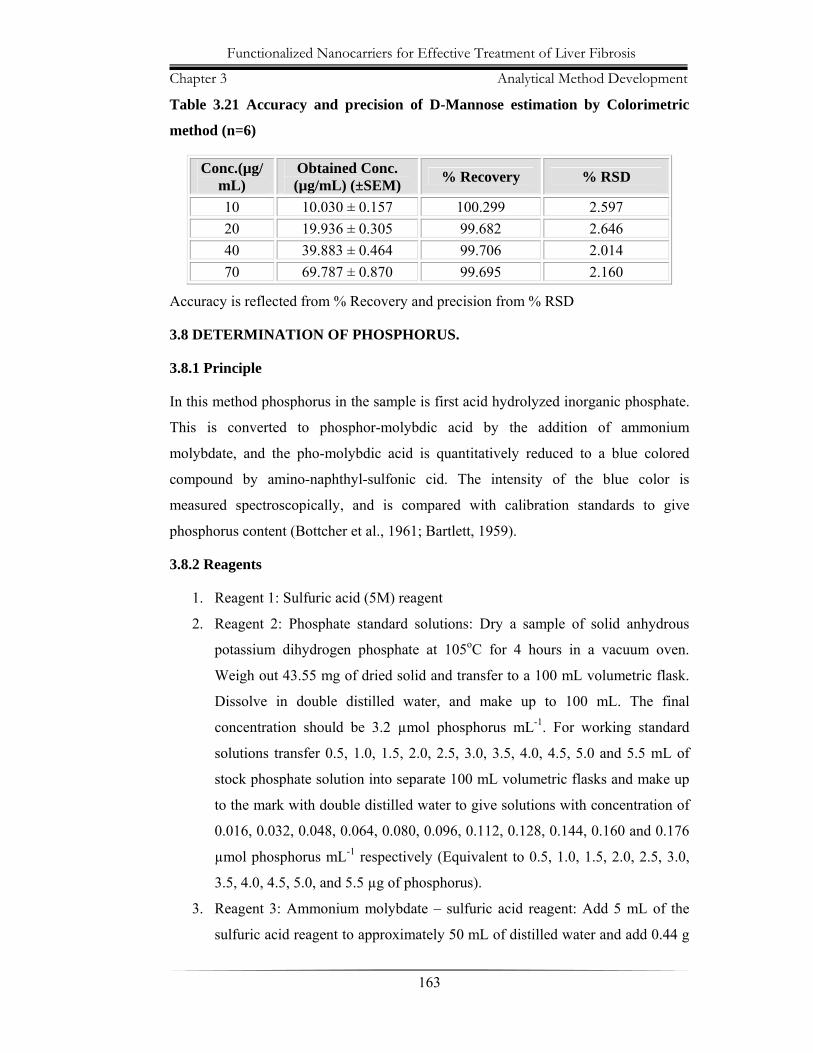
Table 3.21 Accuracy and precision of D-Mannose estimation by Colorimetric
method (n=6)
Conc.(µg/mL)
Obtained Conc. (µg/mL) (±SEM) % Recovery % RSD
10 10.030 ± 0.157 100.299 2.597 20 19.936 ± 0.305 99.682 2.646 40 39.883 ± 0.464 99.706 2.014 70 69.787 ± 0.870 99.695 2.160
Accuracy is reflected from % Recovery and precision from % RSD
3.8 DETERMINATION OF PHOSPHORUS.
3.8.1 Principle
In this method phosphorus in the sample is first acid hydrolyzed inorganic phosphate.
This is converted to phosphor-molybdic acid by the addition of ammonium
molybdate, and the pho-molybdic acid is quantitatively reduced to a blue colored
compound by amino-naphthyl-sulfonic cid. The intensity of the blue color is
measured spectroscopically, and is compared with calibration standards to give
phosphorus content (Bottcher et al., 1961; Bartlett, 1959).
3.8.2 Reagents
1. Reagent 1: Sulfuric acid (5M) reagent
2. Reagent 2: Phosphate standard solutions: Dry a sample of solid anhydrous
potassium dihydrogen phosphate at 105oC for 4 hours in a vacuum oven.
Weigh out 43.55 mg of dried solid and transfer to a 100 mL volumetric flask.
Dissolve in double distilled water, and make up to 100 mL. The final
concentration should be 3.2 µmol phosphorus mL-1. For working standard
solutions transfer 0.5, 1.0, 1.5, 2.0, 2.5, 3.0, 3.5, 4.0, 4.5, 5.0 and 5.5 mL of
stock phosphate solution into separate 100 mL volumetric flasks and make up
to the mark with double distilled water to give solutions with concentration of
0.016, 0.032, 0.048, 0.064, 0.080, 0.096, 0.112, 0.128, 0.144, 0.160 and 0.176
µmol phosphorus mL-1 respectively (Equivalent to 0.5, 1.0, 1.5, 2.0, 2.5, 3.0,
3.5, 4.0, 4.5, 5.0, and 5.5 µg of phosphorus).
3. Reagent 3: Ammonium molybdate – sulfuric acid reagent: Add 5 mL of the
sulfuric acid reagent to approximately 50 mL of distilled water and add 0.44 g
Functionalized Nanocarriers for Effective Treatment of Liver Fibrosis
Chapter 3 Analytical Method Development
164
of ammonium molybdate. Mix well and make up to 200 mL with distilled
water.
4. Reagent 4: 1-Amino 2-naphthyl 4-sulfonic acid reagent: Weigh out 0.8 g and
dissolve in 5 mL of double distilled water. Prepare fresh on day of use.
5. Reagent 5: Hydrogen peroxide: Add 1 mL of 100 % hydrogen peroxide to 9
mL of distilled water and mix well. Prepare fresh immediately before use.
3.8.3 Procedure
1. Equilibrate heating block by pre-heating at 200oC for 30 min.
2. Set up calibration curve by pipetting, into separate 16 × 150 mm disposable
borosilicate tubes, 0.5 mL of each working standard solution, together with a
blank (0.5 mL of double distilled water).
3. Prepare sample tube in triplicate by adding 50 µL of the sample to each three
empty tubes. Dry down and resuspend in 0.5 mL of distilled water.
4. Add 0.4 mL of sulfuric acid reagent to each tube, cover and incubate in a
heating block in a fume hood at 180 – 200 oC for an hour.
5. Allow the tubes to cool by standing them at room temperature.
6. Prepare diluted hydrogen peroxide (10%) fresh.
7. To each tube add 0.1 mL of diluted hydrogen peroxide and incubate on the
heating block at 180 – 200 for 30 min to achieve a clear solution. (If
necessary, repeat addition and heating until solution is clear.)
8. Cool the tubes by standing them at room temperature.
9. Add 4.6 mL of acid – molybdate solution to each tube and mix thoroughly by
vortexing.
10. Add 0.2 mL of reagent 4 to each tube and mix thoroughly by vortexing after
addition.
11. Cover the tubes and place them in boiling water bath.
12. Leave the tubes in the bath for 7 min after boiling recommences.
13. Cool the tubes to room temperature.
14. Measure absorbance of all tubes against distilled water at 830 nm. The
concentration in the starting sample is ten times that read off the graph of the
standard curve.
Functionalized Nanocarriers for Effective Treatment of Liver Fibrosis
Chapter 3 Analytical Method Development
165
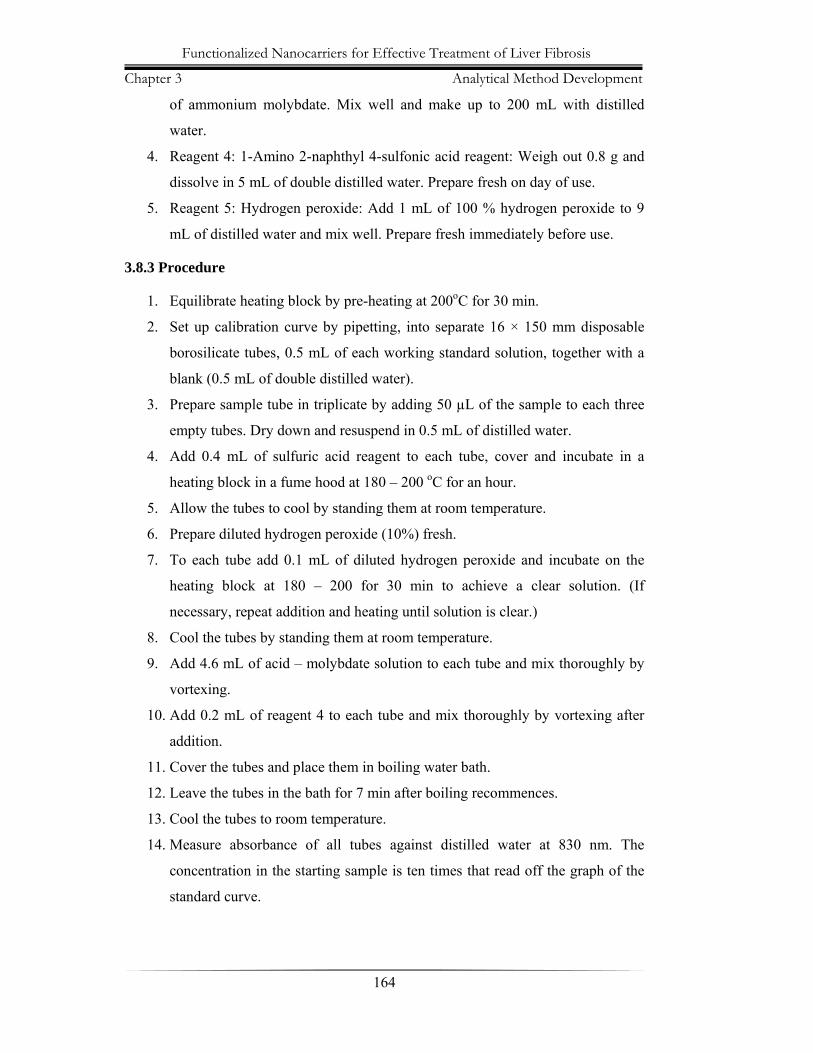
Table 3.22 Calibration plot of Phosphorus (n=3)
Conc. (µmol phosphorus/mL) [µg
of phosphorus] Absorbance (±SEM)
0.016 [0.5] 0.079 ± 0.0051 0.032 [1.0] 0.172 ± 0.0090 0.048 [1.5] 0.238 ± 0.0070 0.064 [2.0] 0.341 ± 0.0080 0.080 [2.5] 0.406 ± 0.0075 0.096 [3.0] 0.514 ± 0.0099 0.112 [3.5] 0.582 ± 0.0111 0.128 [4.0] 0.678 ± 0.0074 0.144 [4.5] 0.749 ± 0.0115 0.160 [5.0] 0.846 ± 0.0086 0.176 [5.5] 0.904 ± 0.0132
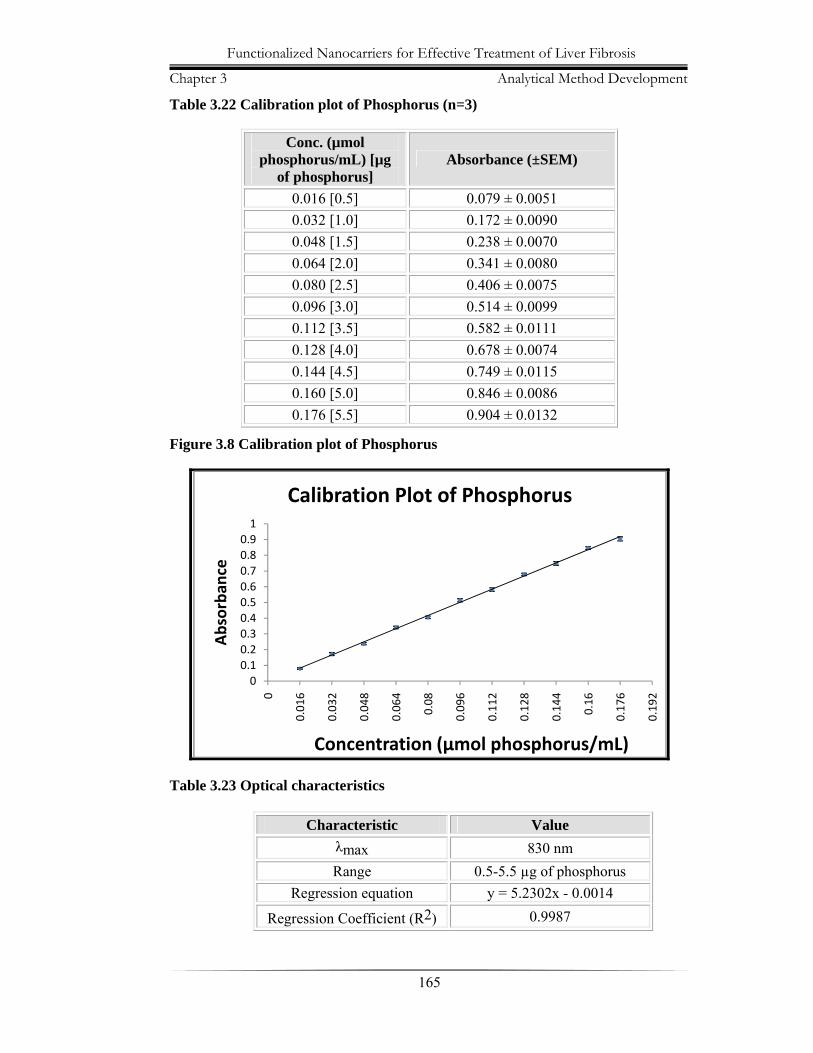
Figure 3.8 Calibration plot of Phosphorus
Table 3.23 Optical characteristics
Characteristic Value λmax 830 nm Range 0.5-5.5 µg of phosphorus
Regression equation y = 5.2302x - 0.0014
Regression Coefficient (R2) 0.9987
00.10.20.30.40.50.60.70.80.91
0
0.01
6
0.03
2
0.04
8
0.06
4
0.08
0.09
6
0.11
2
0.12
8
0.14
4
0.16
0.17
6
0.19
2
Absorba
nce
Concentration (µmol phosphorus/mL)
Calibration Plot of Phosphorus
Functionalized Nanocarriers for Effective Treatment of Liver Fibrosis
Chapter 3 Analytical Method Development
166
Table 3.24 Accuracy and precision of Phosphorus by spectroscopic method (n=6)
Conc.(µmol/mL)
Obtained Conc. (µmol/mL) (±SEM) % Recovery % RSD
0.032 0.0320 ± 0.0008 100.125 4.207 0.064 0.0646 ± 0.0014 100.953 3.753 0.128 0.1264 ± 0.0022 98.719 3.016 0.176 0.1771 ± 0.0026 100.648 2.542
Accuracy is reflected from % Recovery and precision from % RSD
3.9 DETERMINATION OF TOTAL PROTEINS
3.9.1 Principle
Proteins react with copper of Biuret reagent in alkaline medium to form a blue purple
complex with absorption maximum at 550 nm (Gornall et al., 1949; Smith et al.,
1985.
3.9.2 Reagents
Reagent 1: Biuret reagent
Reagent 2: Protein standard
3.9.3 Procedure
Table 3.25 Procedure for determination of total protein
Mix well. Allow tubes to stand at R.T. for 5 min. measure the O.D. of Standard(S)
and Test(T) at 550 nm on spectrophotometer.
3.9.4 Calculation
. .. . . . .
Blank (B) Standard (S) Test (T)
Sample --- --- 0.1 mL Reagent 2: Protein
standard --- 0.1 mL ---
Reagent 1: Biuret reagent 2.5 mL 2.5 mL 2.5 mL
Functionalized Nanocarriers for Effective Treatment of Liver Fibrosis
Chapter 3 Analytical Method Development
167
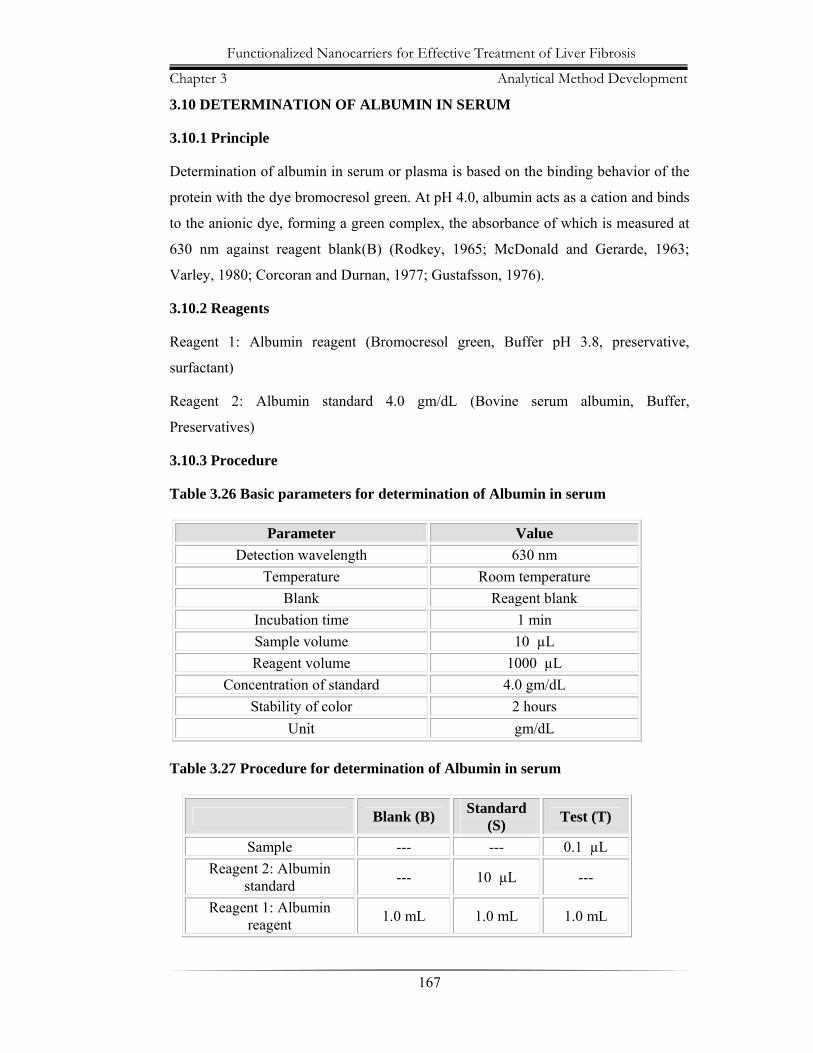
3.10 DETERMINATION OF ALBUMIN IN SERUM
3.10.1 Principle
Determination of albumin in serum or plasma is based on the binding behavior of the
protein with the dye bromocresol green. At pH 4.0, albumin acts as a cation and binds
to the anionic dye, forming a green complex, the absorbance of which is measured at
630 nm against reagent blank(B) (Rodkey, 1965; McDonald and Gerarde, 1963;
Varley, 1980; Corcoran and Durnan, 1977; Gustafsson, 1976).
3.10.2 Reagents
Reagent 1: Albumin reagent (Bromocresol green, Buffer pH 3.8, preservative,
surfactant)
Reagent 2: Albumin standard 4.0 gm/dL (Bovine serum albumin, Buffer,
Preservatives)
3.10.3 Procedure
Table 3.26 Basic parameters for determination of Albumin in serum
Table 3.27 Procedure for determination of Albumin in serum
Parameter Value Detection wavelength 630 nm
Temperature Room temperature Blank Reagent blank
Incubation time 1 min Sample volume 10 µL Reagent volume 1000 µL
Concentration of standard 4.0 gm/dL Stability of color 2 hours
Unit gm/dL
Blank (B) Standard (S) Test (T)
Sample --- --- 0.1 µL Reagent 2: Albumin
standard --- 10 µL ---
Reagent 1: Albumin reagent 1.0 mL 1.0 mL 1.0 mL
Functionalized Nanocarriers for Effective Treatment of Liver Fibrosis
Chapter 3 Analytical Method Development
168
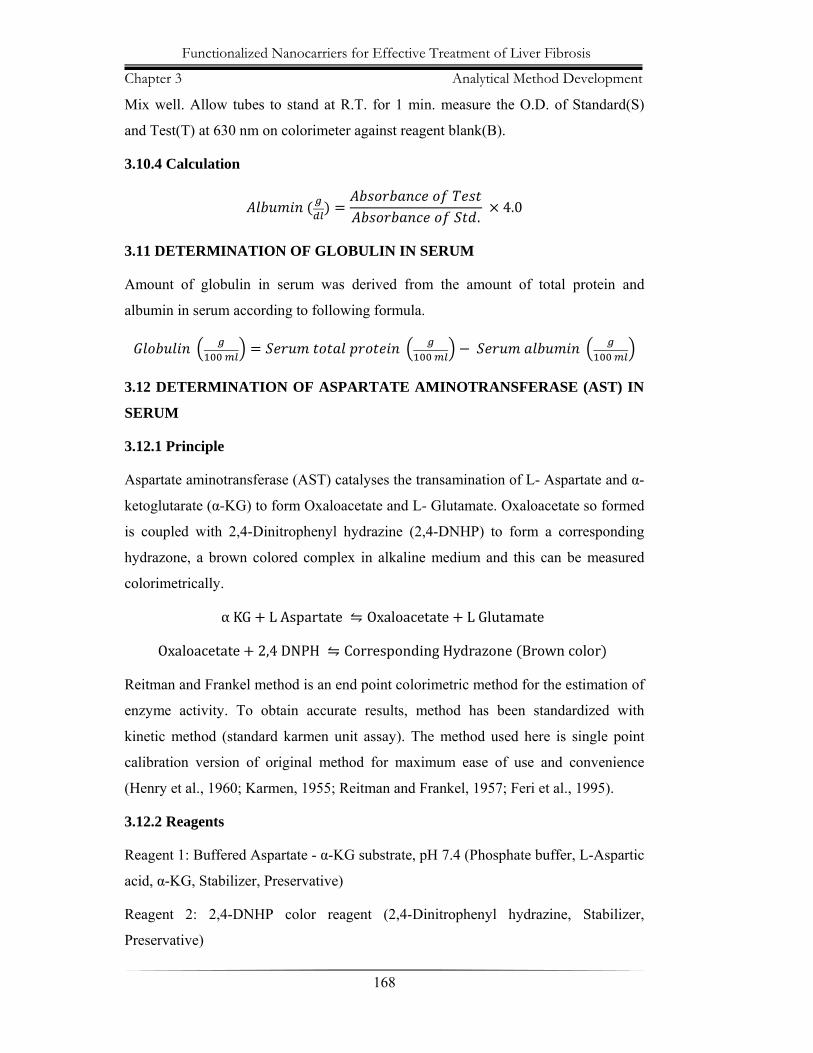
Mix well. Allow tubes to stand at R.T. for 1 min. measure the O.D. of Standard(S)
and Test(T) at 630 nm on colorimeter against reagent blank(B).
3.10.4 Calculation
. 4.0
3.11 DETERMINATION OF GLOBULIN IN SERUM
Amount of globulin in serum was derived from the amount of total protein and
albumin in serum according to following formula.
3.12 DETERMINATION OF ASPARTATE AMINOTRANSFERASE (AST) IN
SERUM
3.12.1 Principle
Aspartate aminotransferase (AST) catalyses the transamination of L- Aspartate and α-
ketoglutarate (α-KG) to form Oxaloacetate and L- Glutamate. Oxaloacetate so formed
is coupled with 2,4-Dinitrophenyl hydrazine (2,4-DNHP) to form a corresponding
hydrazone, a brown colored complex in alkaline medium and this can be measured
colorimetrically.
α KG L Aspartate Oxaloacetate L Glutamate
Oxaloacetate 2,4 DNPH Corresponding Hydrazone Brown color
Reitman and Frankel method is an end point colorimetric method for the estimation of
enzyme activity. To obtain accurate results, method has been standardized with
kinetic method (standard karmen unit assay). The method used here is single point
calibration version of original method for maximum ease of use and convenience
(Henry et al., 1960; Karmen, 1955; Reitman and Frankel, 1957; Feri et al., 1995).
3.12.2 Reagents
Reagent 1: Buffered Aspartate - α-KG substrate, pH 7.4 (Phosphate buffer, L-Aspartic
acid, α-KG, Stabilizer, Preservative)
Reagent 2: 2,4-DNHP color reagent (2,4-Dinitrophenyl hydrazine, Stabilizer,
Preservative)
Functionalized Nanocarriers for Effective Treatment of Liver Fibrosis
Chapter 3 Analytical Method Development
169
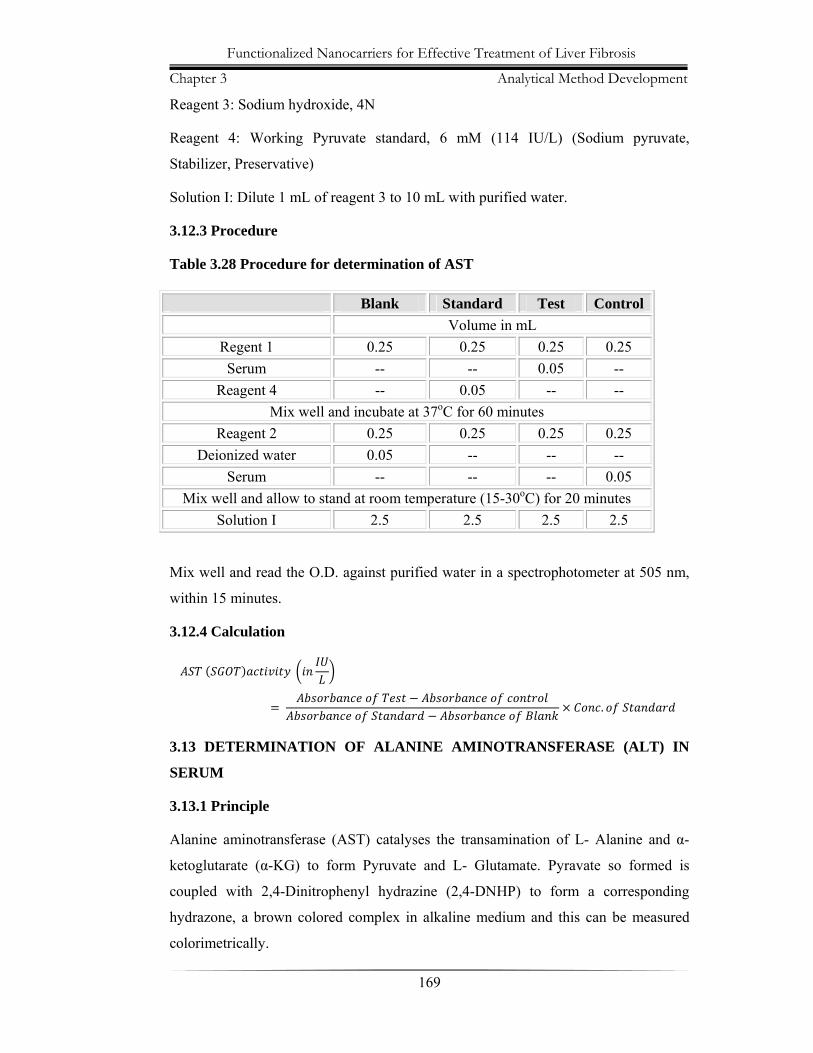
Reagent 3: Sodium hydroxide, 4N
Reagent 4: Working Pyruvate standard, 6 mM (114 IU/L) (Sodium pyruvate,
Stabilizer, Preservative)
Solution I: Dilute 1 mL of reagent 3 to 10 mL with purified water.
3.12.3 Procedure
Table 3.28 Procedure for determination of AST
Mix well and read the O.D. against purified water in a spectrophotometer at 505 nm,
within 15 minutes.
3.12.4 Calculation
.
3.13 DETERMINATION OF ALANINE AMINOTRANSFERASE (ALT) IN
SERUM
3.13.1 Principle
Alanine aminotransferase (AST) catalyses the transamination of L- Alanine and α-
ketoglutarate (α-KG) to form Pyruvate and L- Glutamate. Pyravate so formed is
coupled with 2,4-Dinitrophenyl hydrazine (2,4-DNHP) to form a corresponding
hydrazone, a brown colored complex in alkaline medium and this can be measured
colorimetrically.
Blank Standard Test Control Volume in mL
Regent 1 0.25 0.25 0.25 0.25 Serum -- -- 0.05 --
Reagent 4 -- 0.05 -- -- Mix well and incubate at 37oC for 60 minutes
Reagent 2 0.25 0.25 0.25 0.25 Deionized water 0.05 -- -- --
Serum -- -- -- 0.05 Mix well and allow to stand at room temperature (15-30oC) for 20 minutes
Solution I 2.5 2.5 2.5 2.5
Functionalized Nanocarriers for Effective Treatment of Liver Fibrosis
Chapter 3 Analytical Method Development
170
α KG L Alanine Pyruvate L Glutamate
Pyruvate 2,4 DNPH Corresponding Hydrazone Brown color
Reitman and Frankel method is an end point colorimetric method for the estimation of
enzyme activity. To obtain accurate results, method has been standardized with
kinetic method (standard karmen unit assay). The method used here is single point
calibration version of original method for maximum ease of use and convenience
(Henry et al., 1960; Karmen, 1955; Reitman and Frankel, 1957; Feri et al., 1995).
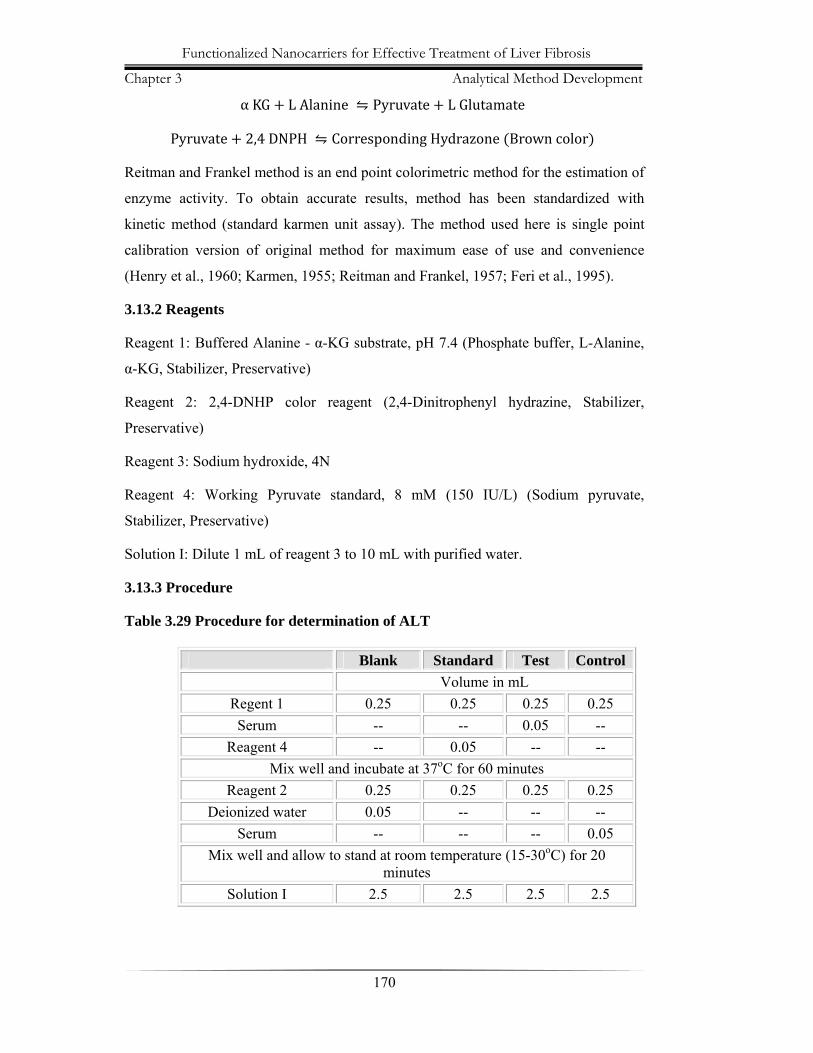
3.13.2 Reagents
Reagent 1: Buffered Alanine - α-KG substrate, pH 7.4 (Phosphate buffer, L-Alanine,
α-KG, Stabilizer, Preservative)
Reagent 2: 2,4-DNHP color reagent (2,4-Dinitrophenyl hydrazine, Stabilizer,
Preservative)
Reagent 3: Sodium hydroxide, 4N
Reagent 4: Working Pyruvate standard, 8 mM (150 IU/L) (Sodium pyruvate,
Stabilizer, Preservative)
Solution I: Dilute 1 mL of reagent 3 to 10 mL with purified water.
3.13.3 Procedure
Table 3.29 Procedure for determination of ALT
Blank Standard Test Control Volume in mL
Regent 1 0.25 0.25 0.25 0.25 Serum -- -- 0.05 --
Reagent 4 -- 0.05 -- -- Mix well and incubate at 37oC for 60 minutes
Reagent 2 0.25 0.25 0.25 0.25 Deionized water 0.05 -- -- --
Serum -- -- -- 0.05 Mix well and allow to stand at room temperature (15-30oC) for 20
minutes Solution I 2.5 2.5 2.5 2.5
Functionalized Nanocarriers for Effective Treatment of Liver Fibrosis
Chapter 3 Analytical Method Development
171
Mix well and read the O.D. against purified water in a spectrophotometer at 505 nm,
within 15 minutes.
3.13.4 Calculation
.
3.14 DETERMINATION OF HYDROXYPROLINE IN TISSUE (Switzer, 1991)
3.14.1 Reagents:
I. Hydroxyproline standard, 0.1 mg/mL. Dissolve 250 mg of vacuum-dried L-
hydroxyproline (Sigma, Cat. No. H-6002) in 25 mL 0.001 N HC1. One mL of
this solution is diluted to 100 mL with 0.001 N HC1.
II. Hydroxyproline working standard, 10 µg/mL. Dilute 10 mL 0.I mg/mL
hydroxyproline standard with deionized water to 100 mL.
III. Potassium borate buffer, pH 8.7. Mix 61.84 g boric acid and 225 g KCI in
about 800 mL deionized water. Adjust the pH to 8.7 with I0 N and 1 N KOH
and make the final volume up to 1 liter. Prepare a 1:5 dilution of buffer as
needed.
IV. Chloramine T solution. Prepare fresh daily a solution of 536.4 mg of
chloramine T (Sigma, Cat. No. C-9887) in l0 mL methyl cellosolve (ethylene
glycol monomethyl ether, Fisher, Cat. No. E-182).
V. Sodium thiosulfate, 3.6 M. Dissolve 893.4 g sodium thiosulfate in about 900
mL deionized water and bring the final volume to 1 liter. Store under toluene
at room temperature for several weeks.
VI. Ehrlich's reagent. Add 27.4 mL concentrated sulfuric acid to 200 mL
absolute ethanol in a beaker and cool the mixture. In another beaker, place 120
g p-dimethylaminobenzaldehyde (Fisher, Cat. No. D7 l- 100) and 200 mL
absolute ethanol and then add slowly with stirring the acid-ethanol mixture
from the first beaker. The solution can be stored in the refrigerator for several
weeks and the crystals that form can be redissolved by warming the solution.

Functionalized Nanocarriers for Effective Treatment of Liver Fibrosis
Chapter 3 Analytical Method Development
172
VII. Glass culture tubes, 150×16 ram, screw-capped with Teflon liners (Fisher,
Cat. No. 14-930-10E) are used both for hydrolysis and for hydroxyproline
oxidation.
3.14.2 Procedure
3.14.2.1 Tissue hydrolysis
1. Place 25-350 mg wet weight of tissue in dry culture tube of known weight.
2. Dry the samples in an oven at 65 ° C for 18-24 hours and then allow the tubes
to cool to room temperature in a desiccator.
3. Weigh the tubes.
4. Add 2.0 mL 6 N HCI, cap and hydrolyze the samples at 110 ° C for 24 hr.
5. Evaporate the samples to dryness with a stream of nitrogen.
6. Add 10.0 mL deionized water to each tube and mix well.
3.14.2.2 Hydroxyproline determination
1. Transfer 0.2 mL hydrolyzate to a clean, labeled culture tube followed by 1.6
mL deionized water.
2. Prepare a set of tubes containing known amounts of hydroxyproline (1.0-8.0
µg) and water as reagent blank.
3. Add 1.0 mL 1:5 diluted borate buffer to all tubes.
4. Add 0.3 mL chloramine T to each tube in a timed sequence to oxidize the
hydroxyproline and mix well.
5. After 20 min, add 1.0 mL sodium thiosulfate and mix well.
6. Add about 1.5 g potassium chloride to saturate all tubes. If indole,
dehydroproline, or similar compounds are anticipated in the samples, extract
with 2.5 mL toluene and discard the toluene extract.
7. Cap and heat the tubes in boiling water for 20 min.
8. Cool tubes to room temperature, add 2.5 mL toluene, and cap all tubes tightly.
Invert the tubes 100 times or shake them about 5 min.
Functionalized Nanocarriers for Effective Treatment of Liver Fibrosis
Chapter 3 Analytical Method Development
173
9. Centrifuge the tubes at low speed briefly and transfer 1.0 mL toluene extract to
labeled 12 × 75 mm test tubes.
10. Add 0.4 mL Ehrlich's reagent and allow the color to develop by 30 min.
11. Read the absorbances at 565 nm against a reagent blank.
12. A linear regression of absorbance versus µg hydroxyproline standard can be
used to calculate the hydroxyproline content of each unknown sample.
Multiply the values by the dilution factor of 50 to determine the
hydroxyproline content of the original hydrolyzate.
3.14.2.3 Special considerations
1. The toluene extract in step 6 of hydroxyproline determination can be used to
determine the concentration of proline by a periodate oxidation method.
2. The potassium chloride can be added at any point before oxidation with
chloramine T without any effect on the color yield.
3. Toluene may be added before heating the samples in order to save time in
removing caps and recapping tubes in step 8. Any toluene lost appears to be
proportional in all tubes, but the caps need to be checked for tightness since
they frequently become loose on cooling after heating.
4. Centrifugation in step 9 may not be necessary if no emulsion is present in any
of the samples.
5. Hydroxyproline can be determined in 48-60 samples in about 4 hours.
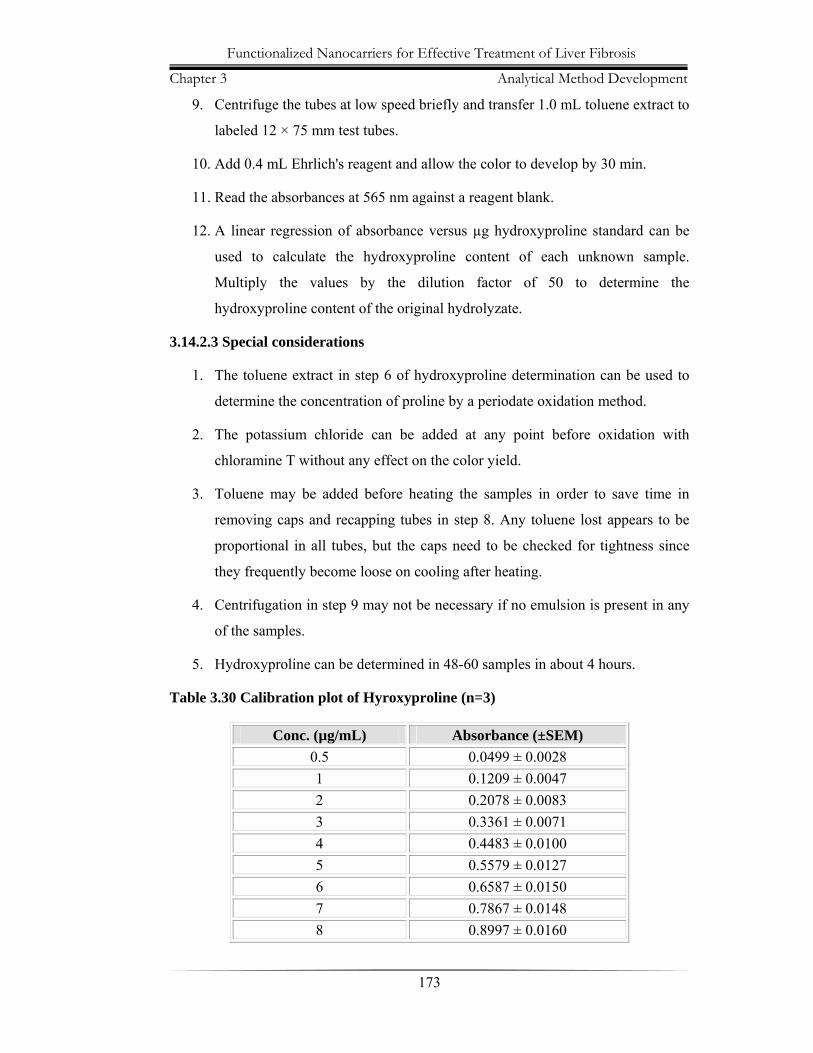
Table 3.30 Calibration plot of Hyroxyproline (n=3)
Conc. (µg/mL) Absorbance (±SEM) 0.5 0.0499 ± 0.0028 1 0.1209 ± 0.0047 2 0.2078 ± 0.0083 3 0.3361 ± 0.0071 4 0.4483 ± 0.0100 5 0.5579 ± 0.0127 6 0.6587 ± 0.0150 7 0.7867 ± 0.0148 8 0.8997 ± 0.0160
Chapter 3
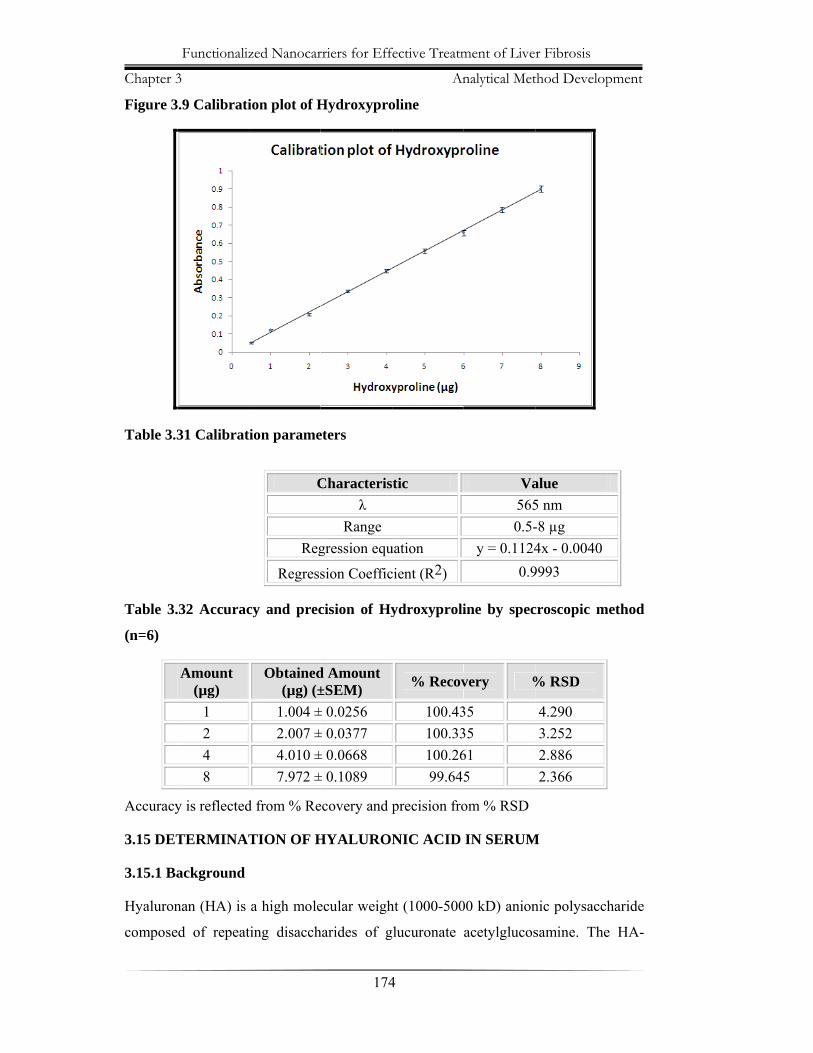
Figure 3
Table 3.3
Table 3.
(n=6)
Accuracy
3.15 DET
3.15.1 Ba
Hyaluron
compose
Functionaliz
3
.9 Calibrati
31 Calibrat
.32 Accurac
Amount (µg)
1 2 4 8
y is reflected
TERMINAT
ackground
nan (HA) is
d of repeat
zed Nanocar
ion plot of H
ion parame
cy and prec
Obtained(µg) (±
1.004 ±2.007 ±4.010 ±7.972 ±
d from % Re
TION OF H
a high mole
ting disacch
C
Reg
Regress
rriers for Eff
174
Hydroxypro
eters
cision of Hy
d Amount ±SEM) ± 0.0256 ± 0.0377 ± 0.0668 ± 0.1089
ecovery and p
HYALURON
ecular weigh
harides of g
Characterisλ
Range gression equ
sion Coeffic
fective Treatm
An
4
oline
ydroxyproli
% Recov
100.43100.33100.2699.645
precision fro
NIC ACID
ht (1000-500
glucuronate
tic
uation
cient (R2)
ment of Live
nalytical Met
ine by spec
very %
35 35 61 5
om % RSD
IN SERUM
00 kD) anion
acetylglucos
Va5650.5-
y = 0.11240.9
r Fibrosis
thod Develop
croscopic m
% RSD
4.290 3.252 2.886 2.366
M
nic polysacch
samine. The
alue 5 nm -8 µg 4x - 0.0040 9993
pment
method
haride
e HA-
Functionalized Nanocarriers for Effective Treatment of Liver Fibrosis
Chapter 3 Analytical Method Development
175
ELISA is a quantitative enzyme-linked immunoassay designed for the in vitro
measurement of HA levels in human or animal biological fluids (blood, serum, urine,
diffusate, synovial fluid) or cell-culture supernatant.
The HA-ELISA is a competitive ELISA assay in which the colorimetric signal is
inversely proportional to the amount of HA present in the sample. Samples to be
assayed are first mixed with the Detector, then added to the HA ELISA Plate for
competitive binding. An enzyme-linked antibody and colorimetric detection is used to
detect the HA detector bound to the plate. The concentration of HA in the sample is
determined using a standard plot of known amounts of HA (Kongtawelert and Ghosh,
1989; Plevris et al., 2000; McHutchison et al., 2000).
3.15.2 Reagent Preparation
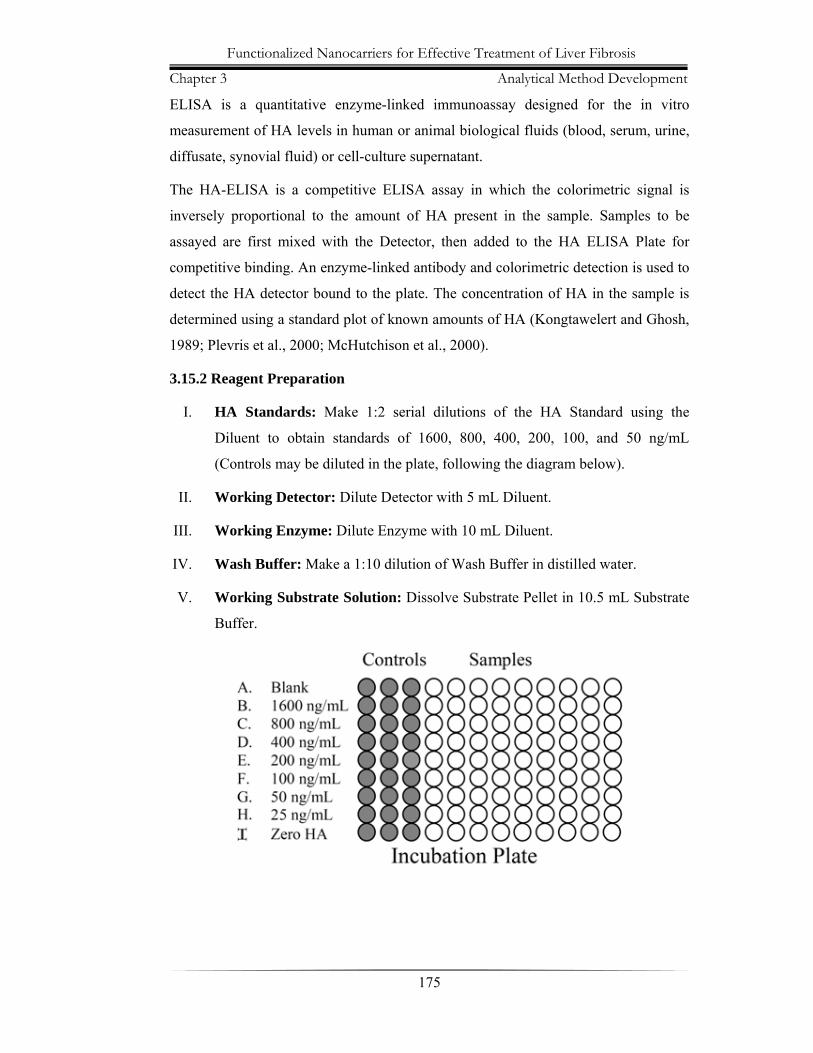
I. HA Standards: Make 1:2 serial dilutions of the HA Standard using the
Diluent to obtain standards of 1600, 800, 400, 200, 100, and 50 ng/mL
(Controls may be diluted in the plate, following the diagram below).
II. Working Detector: Dilute Detector with 5 mL Diluent.
III. Working Enzyme: Dilute Enzyme with 10 mL Diluent.
IV. Wash Buffer: Make a 1:10 dilution of Wash Buffer in distilled water.
V. Working Substrate Solution: Dissolve Substrate Pellet in 10.5 mL Substrate
Buffer.
Functionalized Nanocarriers for Effective Treatment of Liver Fibrosis
Chapter 3 Analytical Method Development
176
3.15.3 Assay Procedure
1. Set up the incubation plate as illustrated above. We suggest the HA Standard
dilution series be run in triplicate for best results. Add 100 μL of Standards
and samples into corresponding wells. Add 150 μL of Diluent to Blank
Control and 100 μL of Diluent to Zero HA Control wells. Add 50 μL of
Working Detector to all wells except the Blank. Mix well. Cover plate and
incubate for one hour at 37°C.
2. Following the incubation, transfer 100 μL of controls and samples to the
corresponding wells of the HA ELISA plate. Cover plate and incubate for 30
minutes at 4°C.
3. Discard the solution and wash the wells four times with 300 μL of 1X Wash
Buffer.
4. Add 100 μL of Working Enzyme to each well. Cover plate and incubate at
37°C for 30 minutes.
5. Repeat wash step 3.
6. Add 100 μL Working Substrate Solution to each well. Incubate the plate in the
dark at room temperature for 30-45 minutes
7. Measure the absorbance of each well at 405 nm. The Blank should have an
absorbance of < 0.10 and the ratio of the Zero HA Control to the 1600 ng/mL
HA Standard should be > 4.0. If the ratio is < 4.0, continue incubation and
read plate every 15 minutes until ratio is reached.
8. Stop the reaction by adding 50μL Stop Solution to each well.
9. Calculate the binding percentage for each sample using the formula:
% 100
Using linear or nonlinear regression, plot a standard plot of percent binding versus
concentrations of HA standards. A Log2 plot with linear regression is shown as an
example. Determine HA levels of unknowns by comparing their percentage of
binding relative to the standard plot.
C
T
F
T
Fun
Chapter 3
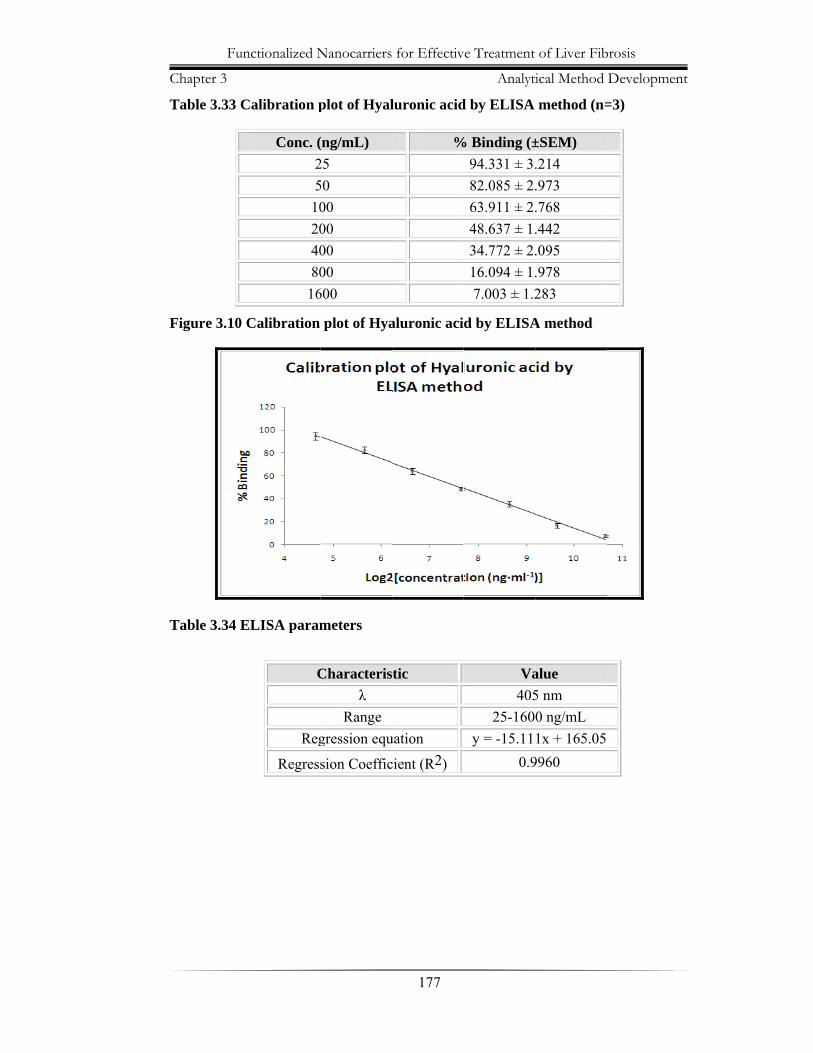
Table 3.33 C
Figure 3.10 C
Table 3.34 E
nctionalized N
Calibration p
Conc. (25
10204080
16
Calibration
ELISA param
C
Reg
Regress
Nanocarriers
plot of Hyal
(ng/mL) 25 50 00 00 00 00
600
plot of Hya
meters
Characterisλ
Range gression equ
sion Coeffic
for Effectiv
177
luronic acid
%
aluronic aci
tic
uation
cient (R2)
ve Treatment
Analyti
d by ELISA
% Binding (±94.331 ± 3.82.085 ± 2.63.911 ± 2.48.637 ± 1.34.772 ± 2.16.094 ± 1.7.003 ± 1.2
d by ELISA
Va405
25-160y = -15.11
0.9
of Liver Fib
ical Method
method (n=
±SEM) .214 .973 .768 .442 .095 .978 283
A method
alue 5 nm 0 ng/mL 1x + 165.05
9960
brosis
Developmen
=3)
nt
Functionalized Nanocarriers for Effective Treatment of Liver Fibrosis
Chapter 3 Analytical Method Development
178
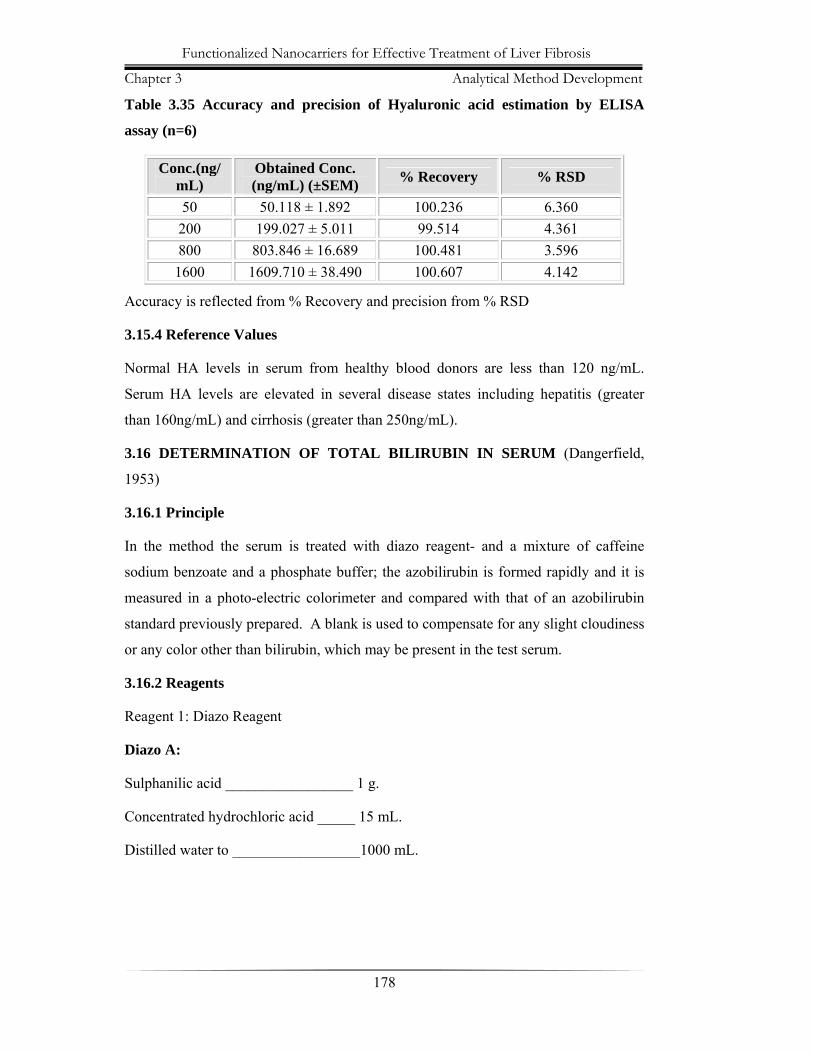
Table 3.35 Accuracy and precision of Hyaluronic acid estimation by ELISA
assay (n=6)
Conc.(ng/mL)
Obtained Conc. (ng/mL) (±SEM) % Recovery % RSD
50 50.118 ± 1.892 100.236 6.360 200 199.027 ± 5.011 99.514 4.361 800 803.846 ± 16.689 100.481 3.596 1600 1609.710 ± 38.490 100.607 4.142
Accuracy is reflected from % Recovery and precision from % RSD
3.15.4 Reference Values
Normal HA levels in serum from healthy blood donors are less than 120 ng/mL.
Serum HA levels are elevated in several disease states including hepatitis (greater
than 160ng/mL) and cirrhosis (greater than 250ng/mL).
3.16 DETERMINATION OF TOTAL BILIRUBIN IN SERUM (Dangerfield,
1953)
3.16.1 Principle
In the method the serum is treated with diazo reagent- and a mixture of caffeine
sodium benzoate and a phosphate buffer; the azobilirubin is formed rapidly and it is
measured in a photo-electric colorimeter and compared with that of an azobilirubin
standard previously prepared. A blank is used to compensate for any slight cloudiness
or any color other than bilirubin, which may be present in the test serum.
3.16.2 Reagents
Reagent 1: Diazo Reagent
Diazo A:
Sulphanilic acid _________________ 1 g.
Concentrated hydrochloric acid _____ 15 mL.
Distilled water to _________________1000 mL.
Functionalized Nanocarriers for Effective Treatment of Liver Fibrosis
Chapter 3 Analytical Method Development
179
Diazo B:
Sodium nitrite ___________________ 0.5 g.
Distilled water to_________________ 100 mL.
For use 10 mL of diazo A is mixed with 0.3 mL. of diazo B.
Reagent 2: Diazo Blank
Concentrated hydrochloric acid ______15 mL.
Distilled water to _________________ 1000 mL.
Reagent 3: Caffeine Buffer Mixture
Caffeine (25 g) and sodium benzoate (25 g) are dissolved in about 400 mL warm
distilled water then cooled and potassium dihydrogen phosphate (4.1 g) and 1N
sodium hydroxide (3.4 mL) are added. The mixture is diluted to 500 mL with water.
The mixture, which should be filtered if not clear, will keep for at least a month.
Reagent 4: Bilirubin Solution
About 20 mg of pure bilirubin is weighed accurately and 0.2 mL wetting agent added
(10% lissapol or 10% teepol). When wetting is complete 7 mL of 0.2N sodium
hydroxide is added and the mixture is stirred until the bilirubin is completely
dissolved. It is diluted with 0.1N sodium carbonate to a volume of 500 mL. It is
important that this preparation should be carried out rapidly (within five minutes).
Immediately after this solution has been made it should be used for the preparation of
the standard azobilirubin and standard blank solution as below.
Reagent 5: Azobilirubin Standard
This standard solution should be prepared in duplicate. To 50 mL of caffeine buffer
mixture 5 mL of diazo solution is added, followed by 10 mL of bilirubin solution,
mixed, and allowed to stand for 10 minutes. Then its optical density (S) is measured
using a green filter. If stored in the dark this solution can be used for checking the
photometer in the subsequent serum determinations made during the following two
weeks.
Functionalized Nanocarriers for Effective Treatment of Liver Fibrosis
Chapter 3 Analytical Method Development
180
Reagent 6: Standard Blank Solution
This solution also should be prepared in duplicate. To 10 mL of caffeine buffer
mixture, 1 mL water is added, followed by 2 mL of bilirubin solution. The solution is
mixed and allowed to stand for 10 minutes, and then its optical density (SB) is
measured using the same green filter as employed in measuring the density of the
standard.
3.16.3 Procedure
Fresh serum (1 mL) is pipetted into each of two test tubes. To one tube (the test) 0.5
mL diazo reagent is added and to the other tube (the blank) 0.5 mL diazo blank. The
tubes are shaken and stood for approximately one minute and it is noted if a red
develops in the test solution indicating a positive direct van den Bergh reaction. To
both tubes 5 mL of caffeine buffer mixture is added. The contents are mixed well and
stood for 15 minutes to allow for full color development. The color is stable for at
least one hour.
The optical densities of the test (T) and the blank (B) are measured in a photoelectric
colorimeter using a green light filter or in a spectrophotometer at 525 nm, making the
zero setting with water.
3.16.4 Calculation
100 5
Where W= weight of bilirubin in mg. taken in preparing the bilirubin solution, and T,
B, S, and SB, the optical densities of the solutions indicated above.
3.17 CONCLUSIONS
From above mentioned experimentation it was found that analytical methods for
estimation of both RGZ and CDS in the dosage forms, in diffusion medium and in
plasma as well as estimation of D-mannose, phosphorus, total protein, albumin,
globulin, aspartate aminotransferase, alanine aminotransferase, hydroxyproline and
hyaluronic acid showed good linearity, accuracy and precision. So these methods can
be used for further study.
Functionalized Nanocarriers for Effective Treatment of Liver Fibrosis
Chapter 3 Analytical Method Development
181
3.18 REFERENCES
Bartlett GR. Phosphorus assay in column chromatography. J Biol Chem. 1959
Mar;234(3):466-8.
Bottcher CSF, van Gent CM, Fries C. A rapid and sensitive sub-micro phosphorus
determination. Anal Chim Acta 1961;24:203–4.
Corcoran RM, Durnan SM. Albumin determination by a modified bromcresol green
method. Clin Chem. 1977;23(4):765-6.
Daneshtalab N, Lewanczuk RZ, Jamali F. High-performance liquid chromatographic
analysis of angiotensin II receptor antagonist valsartan using a liquid extraction
method. J Chromatogr B Analyt Technol Biomed Life Sci. 2002 Jan 25;766(2):345-9.
Dangerfield WG, Finlayson R. Estimation of bilirubin in serum. J Clin Pathol.
1953;6(3):173-7.
Dubois M, Gilles KA, Hamilton JK, Rebers PA, Smith F. Colorimetric method for
determination of sugars and related substances. Anal Chem. 1956;28:350-6.
Erk N. Simultaneous analysis of candesartan cilexetil and hydrochlorothiazide in
human plasma and dosage forms using HPLC with a photodiode array detector. J Liq
Chromatogr Relat Technol. 2003;26(15):2581-91.
Feri J, Heuck CC, Riesen W, Lang H, Hill PG, EL-Nageh NM, Poller L. Production
of basic diagnostic laboratory reagents, Eastern Mediterranean Series: 11 (WHO
regional publication):1995:40-4.
Gonzalez L, Alonso RM, Jimenez RM. A high-performance liquid chromatographic
method for screening angiotensin II receptor antagonists in human urine.
Chromatographia 2000;52(11/12):735-40.
Gornall AG, Bardawill CJ, David MM. Determination of serum proteins by means of
the biuret reaction. J Biol Chem. 1949 Feb;177(2):751-66.
Goyal A, Singhvi I. Simultaneous spectrophotometric estimation of rosiglitazone
maleate and glimepiride in tablet dosage forms. Indian J Pharm Sci. 2007;69:780-3.
Gustafsson JE. Improved specificity of serum albumin determination and estimation
of "acute phase reactants" by use of the bromcresol green reaction. Clin Chem. 1976
May;22(5):616-22.
Functionalized Nanocarriers for Effective Treatment of Liver Fibrosis
Chapter 3 Analytical Method Development
182
Henry RJ, Chiamori N, Golub OJ, Berkman S. Revised spectrophotometric methods
for the determination of glutamic-oxalacetic transaminase, glutamic-pyruvic
transaminase, and lactic acid dehydrogenase. Am J Clin Pathol. 1960 Oct;34:381-98.
Hruska MW, Frye RF. Simplified method for determination of rosiglitazone in
human plasma. J Chromatogr B Analyt Technol Biomed Life Sci. 2004 Apr
25;803(2):317-20.
Jagathi V, Devala Rao G, Sai Praveen P, Manohar Babu CH. Assay of rosiglitazone
by visible spectrophotometry. International Journal of Pharmacy and Technology.
2010;2(3):757-61.
Kang X, Wang F, Xie Z, Li H. A high performance liquid chromatography method
for simultaneous determination of rosiglitazone and gemfibrozil in human plasma. J
Chromatogr B Analyt Technol Biomed Life Sci. 2009 Mar 1;877(7):645-8.
Karmen A. A note on the spectrometric assay of glutamic-oxalacetic transaminase in
human blood serum. J Clin Invest. 1955 Jan;34(1):131-3.
Kim KA, Park JY. Simple and extractionless high-performance liquid
chromatographic determination of rosiglitazone in human plasma and application to
pharmacokinetics in humans. Biomed Chromatogr. 2004 Oct;18(8):613-5.
Kolte BL, Raut BB, Deo AA, Bagool MA, Shinde DB. Liquid chromatographic
method for the determination of rosiglitazone in human plasma. J Chromatogr B
Analyt Technol Biomed Life Sci. 2003 May 5;788(1):37-44.
Kongtawelert P, Ghosh P. An enzyme-linked immunosorbent-inhibition assay for
quantitation of hyaluronan (hyaluronic acid) in biological fluids. Anal Biochem. 1989
May 1;178(2):367-72.
Lin ZJ, Desai-Krieger D, Shum L. Simultaneous determination of glipizide and
rosiglitazone unbound drug concentrations in plasma by equilibrium dialysis and
liquid chromatography-tandem mass spectrometry. J Chromatogr B Analyt Technol
Biomed Life Sci. 2004 Mar 5;801(2):265-72.
Mamidi RN, Benjamin B, Ramesh M, Srinivas NR. Simple method for the
determination of rosiglitazone in human plasma using a commercially available
internal standard. Biomed Chromatogr. 2003 Sep;17(6):417-20.
Functionalized Nanocarriers for Effective Treatment of Liver Fibrosis
Chapter 3 Analytical Method Development
183
Martindale, The Extra Pharmacopoeia, 31st ed., Reynolds, J. E. F., ed., Royal
Pharmaceutical Society (London, UK: 1996), p. 1165.
Martindale, The Extra Pharmacopoeia, 33rd ed., Sweetman SC, ed., The
pharmaceutical press, (London, UK: 2002), p. 907.
McDonald C, Gerarde HW. A spectrophotometric micromethod for the direct
determination of serum albumin. Microchem J. 1963;7(1):57-62.
McHutchison JG, Blatt LM, de Medina M, Craig JR, Conrad A, Schiff ER, Tong
MJ. Measurement of serum hyaluronic acid in patients with chronic hepatitis C and its
relationship to liver histology. Consensus Interferon Study Group. J Gastroenterol
Hepatol. 2000 Aug;15(8):945-51.
Muxlow AM, Fowles S, Russell P. Automated high-performance liquid
chromatography method for the determination of rosiglitazone in human plasma. J
Chromatogr B Biomed Sci Appl. 2001 Mar;752(1):77-84.
Patil BS, Rao RNG, Jadhav S, Kulkarni U, Gada MM. Estimation of candesartan
cilexetil in bulk and tablet dosage form by UV spectrophotometric method.
International Journal of Research in Ayurveda and Pharmacy. 2011;2(1):204-6.
Pedersen RS, Brosen K, Nielsen F. HPLC method for determination of rosiglitazone
in plasma. Chromatographia 2005 Aug,62(3/4),197–201.
Plevris JN, Haydon GH, Simpson KJ, Dawkes R, Ludlum CA, Harrison DJ, Hayes
PC. Serum hyaluronan--a non-invasive test for diagnosing liver cirrhosis. Eur J
Gastroenterol Hepatol. 2000 Oct;12(10):1121-7.
Qutab SS, Razzaq SN, Ashfaq M, Shuja ZA, and Khan IU. Simple and sensitive LC–
UV method for simultaneous analysis of hydrochlorothiazide and candesartan
cilexetil in pharmaceutical formulations. Acta Chromatogr. 2007;19:119-29.
Radhakrishna T, Satyanarayana J, Satyanarayana A. LC determination of
rosiglitazone in bulk and pharmaceutical formulation. J Pharm Biomed Anal. 2002 Jul
31;29(5):873-80.
Reitman S, Frankel S. A colorimetric method for the determination of serum
glutamic oxalacetic and glutamic pyruvic transaminases. Am J Clin Pathol. 1957
Jul;28(1):56–63.
Functionalized Nanocarriers for Effective Treatment of Liver Fibrosis
Chapter 3 Analytical Method Development
184
Rodkey FL. Direct spectrophotometric determination of albumin in human serum.
Clin Chem. 1965 Apr;11:478-87.
Smith PK, Krohn RI, Hermanson GT, Mallia AK, Gartner FH, Provenzano MD,
Fujimoto EK, Goeke NM, Olson BJ, Klenk DC. Measurement of protein using
bicinchoninic acid. Anal Biochem. 1985;150(1):76-85.
Stenhoff H, Lagerstrom PO, Andersen C. Determination of candesartan cilexetil,
candesartan and a metabolite in human plasma and urine by liquid chromatography
and fluorometric detection. J Chromatogr B Biomed Sci Appl. 1999 Aug;731(2):411-
7.
Subba Rao DV, Radhakrishnanand P, Suryanarayana MV, Himabindu V. A Stability-
Indicating LC Method for Candesartan Cilexetil. Chromatographia 2007
Oct;66(7/8):499-507.
Switzer BR. Determination of hydroxyproline in tissue. J Nutr Biochem. 1991;2:229-
31.
The Merck Index, 13th edition, Merck Research laboratories, White House station,
NJ, 2001, pg.1041.
The Merck Index, 14th edition, Merck Research laboratories, White House station,
NJ, 2006, pg.281.
Varley H. (1980). Practical ClinicaI Biochemistry, 5th edn. William Hienemann
Medical Books Ltd., London, pp 550-5.


![cRGD-functionalized, DOX-conjugated, and 64Cu-labeled ... · properties, multifunctional nanocarriers simultaneously exhibiting these eight functionalities are extremely rare [3e7]](https://img.pdfslide.net/doc/110x75/5f8a7bf14348d04f514aabe1/crgd-functionalized-dox-conjugated-and-64cu-labeled-properties-multifunctional.jpg)