Embed Size (px)
Citation preview

CHAPTER VII
Analytical Method Development
CHEMISTRY OF THE IRON-THIOCYANATE COMPLEX IN THE PRESENCE OF
SURF ACT ANTS AND OTHER REAGENTS
Analytical ShJdks on the Atmospheric /kposltions
ANALYTICAL METHOD DEVELOPMENT
CHEMISTRY OF THE IRON-THIOCYANATE COMPLEX IN THE PRESENCE OF SURF ACT ANTS AND OTHER REAGENTS
1. ABSTRACT
The sensitivity of the reaction between the iron(III) and thiocyanate is largely
dependent on the number of the thiocyanate ions co-ordinated with iron(III). The
reaction mechanism and composition of the iron(III)-thiocyanate complex in the
presence of the surfactant mixture is elucidated. This composition is compared with
few other reported complexes to describe the chemistry of the iron complexation. A
new spectrophotometric method for the trace determination of various chemical
species of iron has been developed and applied for its determination in the rainwater,
groundwater and the boiler feed water. In the method, iron(IIl) complexes with
thiocyanate ions in the presence of a cationic surfactant (e.g. CPC) and an anionic
surfactant (Tx-100). Other reagents evaluated in the conjunction with the cationic
surfactants are various amides. Molar absorptivities of the various thiocyanate
complexes in organic solvents with these reagents lie between (1.1-3.5) xl04 L mole ·l
cm·1 at absorption maxima between 460-500 nm. Effect of various reagents on the
spectral characteristics of the complex, optimisation of the analytical variables and the
effect of foreign ions has been described. None of the foreign ions tested in the
environment samples and boiler feed water interfered up to the normal levels
observed in the applications described. Iron is quantitatively pre-concentrated at the
least I 0-15 fold by the proposed method. The detection limit at 6-fold pre
concentration is 4-ppb iron. The proposed method has been applied for the field
determination of total iron and its speciation in the above-mentioned samples.
Key words: Iron, spectrophotometry, thiocyanate, surfactants, amide, boiler feed water,
groundwater, rainwater.
}OJ
Analytical studies on tht Atmospheric Depositions
2. INTRODUCTION
Iron is one of the most widely distributed elements in the earth. It is also an essential
element biologically, required for a variety of enzymatic and biochemical reactions.
Iron is the major trace element identified in the atmospheric particulate near ferrous
metallurgical industries. Presence of higher concentration of iron in the boiler feed
water is an industrial problem. Chemical characterisation of iron is also required in
various other disciplines like toxicology, chemical process analysis, geology, aquatic
studies, etc. (Eljalde eta!., 1992; Beyer et al., 1975; Parry eta!., 1973, Zhu et al., 1992;
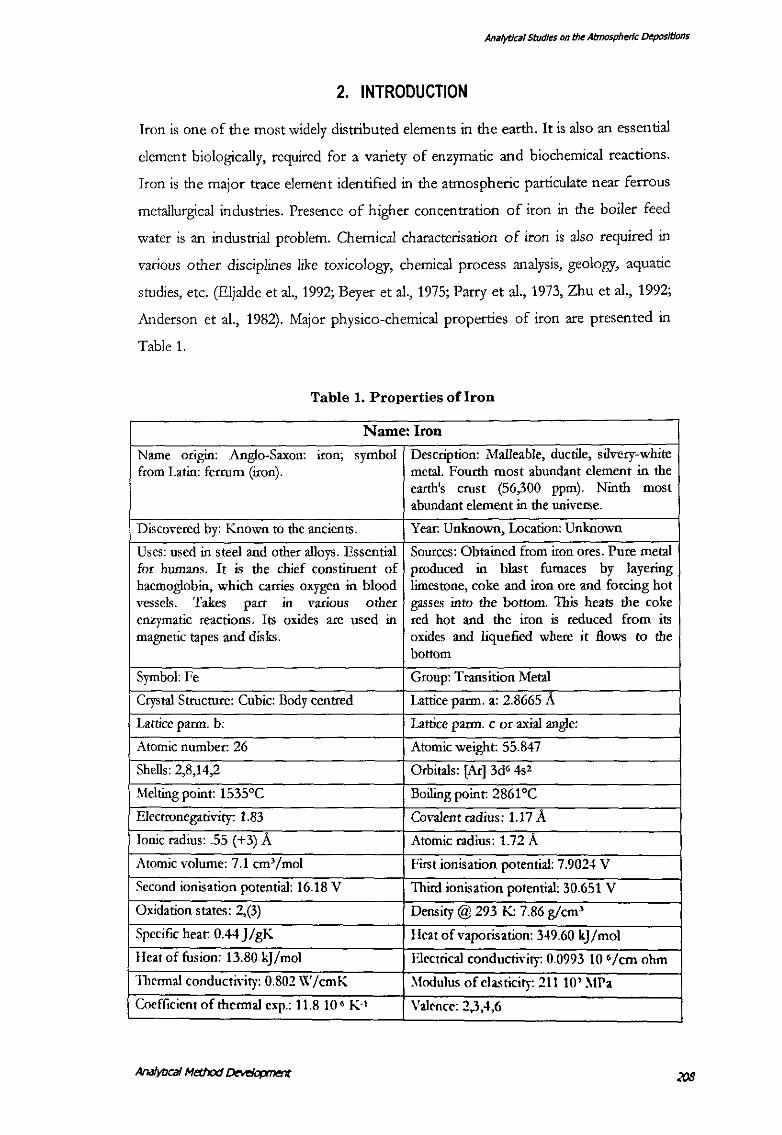
Anderson et a!., 1982). Major physico-chemical properties of iron are presented in
Table 1.
Table 1. Properties of Iron
Name: Iron
Name ..
Anglo-Saxon: iron; symbol Description: Malleable, ductile, silvery-white ongm: from Latin: ferrum (iron). metal. Fourth most abundant element in the
earth's crust (56,300 ppm). Ninth most abundant element in the universe.
Discovered by: Known to the ancients. Year: Unknown, Location: Unknown
Uses: used in steel and other alloys. Essential Sources: Obtained from iron ores. Pure metal for humans. It is the chief constituent of produced 1fi blast furnaces by layering haemoglobin, which carries oxygen in blood limestone, coke and iron ore and forcing hot vessels. Takes part 1fi vanous other gasses into the bottom. This heats the coke enzymatic reactions. Its oxides are used in red hot and the iron is reduced from its magnetic tapes and disks. oxides and liquefied where it flows to the
bottom
Symbol: Fe Group: Transition Metal
Crystal Structure: Cubic: Body centred Lattice parm. a: 2.8665 A Lattice parm. b: Lattice parm. c or axial angle:
Atomic number: 26 Atomic weight: 55.847
Shells: 2,8,14,2 Orbitals: (Ar) 3d• 4s2
Melting point: 1535°C Boiling point: 2861 °C
Electronegativity: 1.83 Covalent radius: 1.17 A Ionic radius: .55 (+3) A Atomic radius: 1.72 A Atomic volume: 7.1 cm'/mol First ionisation potential: 7.9024 V
Second ionisation potential: 16.18 V Third ionisation potential: 30.651 V
Oxidation states: 2,(3) Density@ 293 K: 7.86 g/cm'
Specific heat: 0.44 J/gK Heat of vaporisation: 349.60 kJ/mol
Heat of fusion: 13.80 kJ/mol Electrical conductivity: 0.0993 10 •!em ohm
'111cnnal conducti,·ity: 0.802 W/cmK ~lodulus of elasticity: 21110' ~!Pa
Coefficient of thennal exp.: 11.8 I 0 • K' Valence: 2,3,4,6
Ana!ytJCal Method Development
Ana!ytJcal Studies on the Atmospheric Deposltlons
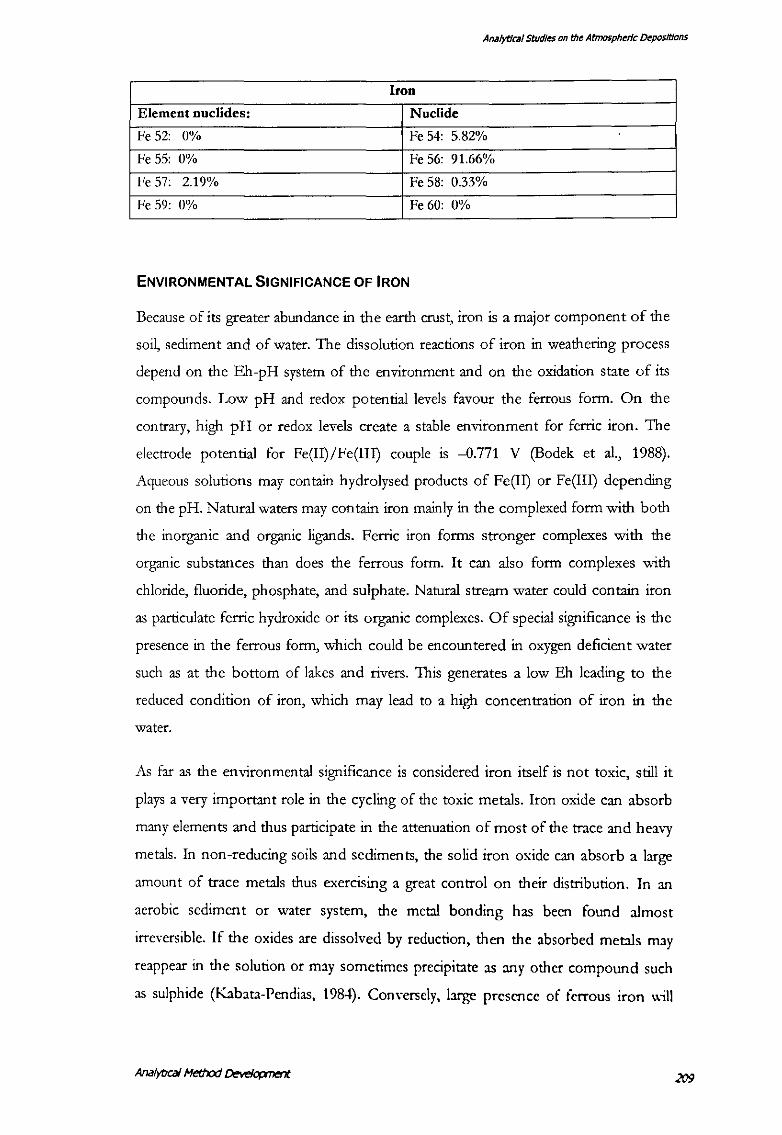
Iron
Element nuclides: Nuclide
Fe 52: 0% Fe 54: 5.82%
Fe 55: 0% Fe 56: 91.66%
Fe 57: 2.19% Fe 58: 0.33%
Fe 59: 0% Fe 60: 0%
ENVIRONMENTAL SIGNIFICANCE OF IRON
Because of its greater abundance in the earth crust, iron is a major component of the
soil, sediment and of water. The dissolution reactions of iron in weathering process
depend on the Eh-pH system of the environment and on the oxidation state of its
compounds. Low pH and redox potential levels favour the ferrous form. On the
contrary, high pH or redox levels create a stable environment for ferric iron. The
electrode potential for Fe(II)/Fe(III) couple is --0.771 V (Bodek et al., 1988).
Aqueous solutions may contain hydrolysed products of Fe(II) or Fe(III) depending
on the pH. Natural waters may contain iron mainly in the complexed form with both
the inorganic and organic ligands. Ferric iron forms stronger complexes with the
organic substances than does the ferrous form. It can also form complexes with
chloride, fluoride, phosphate, and sulphate. Natural stream water could contain iron
as particulate ferric hydroxide or its organic complexes. Of special significance is the
presence in the ferrous form, which could be encountered in oxygen deficient water
such as at the bottom of lakes and rivers. This generates a low Eh leading to the
reduced condition of iron, which may lead to a high concentration of iron in the
water.
As far as the environmental significance is considered iron itself is not toxic, still it
plays a very important role in the cycling of the toxic metals. Iron oxide can absorb
many elements and thus participate in the attenuation of most of the trace and heavy
metals. In non-reducing soils and sediments, the solid iron oxide can absorb a large
amount of trace metals thus exercising a great control on their distribution. In an
aerobic sediment or water system, the metal bonding has been found almost
irreversible. If the oxides are dissolved by reduction, then the absorbed metals may
reappear in the solution or may sometimes precipitate as any other compound such
as sulphide (Kabata-Pendias, 1984). Conversely, b.rge presence of ferrous iron ";n
Analytical studies on th~ AtmosphMc tkposltlons
deplete other complexing ligands, e.g., sulphide thus not providing sufficient amounts
to precipitate other heavy metals (Khalid eta!., 1977).
In wastewater treatment iron and manganese oxides are used as scavengers and thus
retard the harmful effects of the pollutants (Drever, 1982). Similarly, the deep-sea
nodules, which are now considered an important source of many important metals,
could concentrate trace metals viz. Co, Ni, Zn, and Pb due to iron and manganese
oxides only.
A similar effect could be seen on the soils also where trace metals are concentrated
by iron oxide. These metals include Zn, Pb, Mn, Ni, Cu, Co, V, Mo, and Cr. The
absorption is dependent on pH and is greatest for various ions on iron oxide at pH
of 4-5 (Kabata-Pendias, 1984). Thus, it can be seen that determining the iron levels
and its speciation could provide a valuable data to predict the distribution of many
other toxics or trace metals.
BIOLOGICAL SIGNIFICANCE OF THE IRON FOR HUMANS
Iron is an essential element, which is intimately involved in the oxygen transport and
oxygen utilisation in the body. As the oxygen is vital for the various life processes,
iron can also be considered as the most important metal, biologically. Its deficiency in
humans can lead to various disorders viz., anorexia, depressed growth, decreased
resistance to the infections, iron-deficiency anaemia, abnormalities of the gastro
intestinal tract etc. The symptoms of the deficiency are fatigue, listlessness,
palpitation on exertion, sore tongue angular dysphagia and koilonychia etc. (Oehme,
1973). Iron deficiency is much more common in women than in men as they lose a
large quantity of blood in the fertile cycles, pregnancy and lactation. Haemoglobin
levels of less than 13.5 and 12.5 mg/ dl in men and women respectively are considered
low. The worldwide prevalence of the iron deficiency anaemia in the year 1996 was
1,788,600,000 people and it is ranked as the top most deficiency disorder (WHO,
1997).
The increase m the serum or plasma iron can be brought about by the certain
conditions viz., the increased red cell destruction (t.e., haemolytic anaemia where the
sunival time of the red cell is remarkably decreased), lower utilisation of the iron
(decrea.~ed blood formation in case of lead poisoning), in situations where release of
.lJO
Analytfcal Studies on the Atmosphtt!rlc Depositions
iron occurs (necrotic hepatitis) and in conditions where there is an increased
absorption of the iron take place (e.g., in hemochromatosis, and hemosiderosis)
(Oehme, 1973). A large number of people particularly belonging to the 'Sahu'
community in the Chattisgarh region, are affected by a particular type of 'Sickle Cell
Anaemia.' This disease is attributed to some defective genes and is hereditary in
nature.
INDUSTRIAL SIGNIFICANCE OF THE IRON IN CONDENSER AND BOILER FEED
WATER
The boiler operations hold a place of utmost importance in thermal and nuclear
power plants. The boiler is the device where the water is heated by the energy
obtained by sources such as coal or nuclear reactions and the super-heated steam
obtained is used to operate the turbines for generating the electricity. Thus, boilers
could act as a huge concentrator of the impurities depending on the feed water
quality. These impurities then can lead to the problems viz., a carry-over of the
impurities with the steam, priming, foaming, scales and sludge formation and the
corrosion of boiler walls, turbines, condensers etc. These problems can pose a grave
hazard to the safe and economic operations of the various industries.
Only the effect of metallic impurities will be briefly considered here. The presence of
the metallic impurities in boiler feed water leads to the problem of formation of
internal deposits in the boiler walls. These deposits being the poor conductor of the
heat can lead to the over-heating of the boiler tubes at the spots where such deposits
exceed a certain thickness. In other words, the heat transfer from the fireside through
the tube to the boiler water is reduced at such spots, which becomes over-heated.
Consequently, blisters appear on the boiler tube that may ultimately burst. This type
of problem may also take place with tubes of super-heater and re-heater. The deposit
analysis usually shows the presence of the oxides of Fe, Cu, Ni and Zn that originate
either naturally or from the components bearing these metals in the pre-boiler
section (Venkateswarlu, 1997). Modem boilers of the chemical industries and power
plants operate at high heat transfer rates and posses the evaporation capacities in the
range of 20,000 kg/h. The pressure in the boiler can be 15 kg/ cm2 (Low-pressure
boilers) to more than 64 kg/cm2 (lligh-pressure boilers). Higher is the boiler pressure
more strict is the quality control regime for the feed water quality. Therefore, it is
needed that the feed water may be analysed Ycry correctly at Yery low leYcls to ensure
211
Analytical Studies 011 th~ Atmosph~rlc ~positions
a safe boiler operation. The permissible iron content of the feed water depends on
the boiler pressures etc. and it can range from as high as 10 mg/L to as low as 5
Jlg/L.
METHODS OF THE DETERMINATION OF IRON
Several techniques; polarography (Beyer eta!., 1975; Parry et al., 1973; Kennedy et al.,
1990), spectrophotometry (Bruguera et al., 1984; Senior et al., 1987), photochemical
analysis (Liu et al., 1992) and the X-ray fluorescence spectroscopy (XFS) (Battison et
al., 1993) have been in vogue for the characterisation of iron. Now the atomic
absorption spectrophotometry (AAS) and the inductively coupled plasma- atomic
emission spectrophotometry have become the method of choice in view of their
sensitivity and the selectivity (Cox et al., 1988, Zhu et al., 1988, Dixon et al., 1993,
Zach eta!., 1994, Carrion et al., 1994, Gorm et al., 1994). However, these advance
techniques are not applicable for the field detection and determination of iron and
the availability of the instrument is limited due to the cost factor.
The spectrophotometric approaches are very simple and cheap and are readily
adaptable for the fieldwork. Such methods are based on inter-conversion of one
redox state to another and subsequent complexation with organic, inorganic or both
types of ligands. There are many colorimetric methods but the thiocyanate method
has always been a method of choice as it is cheap, rapid, simple and can be used in
the acid medium. In the presented work, a simple extraction-spectrophotometric
method is described, which is selective and sensitive for the determination of iron.
The proposed method modifies the thiocyanate method to make it even more
sensitive and selective. The presented method is fully adaptable for the field
application and has been successfully used for many such applications. Examples are
the determination and speciation of the iron in groundwater of the Rajnandgaon
district of 1\fll, in the atmospheric particulate and the rainwater of Bhilai city and in
the boiler feed water of a steel industry at Raipur.
In the method, the iron(III) is complexed with thiocyanate ions in the presence of a
cationic surfactant, cetylpyridinium chloride (CPq and an anionic surfactant, Triton
X-100 (Tx-100) and is subsequently extracted in organic solvents. ll1e complexation
wtth the thiocyanate in the presence of the surfactants greatly enhances the scnsiti,;ty
}I]
of the plain thiocyanate complex and its extraction in the organic phase helps in
furthering the sensitivity and the selectivity.
3. EXPERIMENTAL
Apparatus
A Sicco-Feedback (Digispec-110 D) matched with 1-cm quartz cells was used for the
spectrophotometric determination. A GBC make atomic absorption
spectrophotometer (902BC) was employed for the calculation of the percentage
extraction and comparison of the data. Systronics make pH-meter type MK-VI was
used to measure the pH of solution.
Reagents
All reagents used in this experiment were of analytical grade (E. Merck). The standard
solution of iron was prepared by digesting pure iron wire with acids, and by
dissolving the residue in 1 Lit of double distilled de-ionised water. Other solutions
used were: 3.4x1o-J,potassium dichromate, 2.8 x 10-~CPC and 4.0 M solution of
ammonium thiocyanate and, 1.8 x 10 -~solution of Tx-100. The 5 M HCl was used
for acidity or pH adjustment of the solution. De-ionised and double distilled water
was used for the solution preparation.
Procedure of the determination
An aliquot of the standard iron solution containing up-to 10 j..lg iron was placed in a
100-ml separatory funnel. It was then mixed with 0.1-ml K2Cr,07, 1.5-ml HCl, 2.0-ml
NH,SCN, 0.5-ml CPC, and 0.1-ml Tx-100 and was diluted to 30-ml with distilled
water. The aqueous phase was extracted with 5-ml chloroform and washed with a
1x2-ml portion of chloroform. The extract was dried over anhydrous sodium
sulphate (2g). Volume of the combined extract was made up to 10 ml in a volumetric
tlask_ A blank was run in the same manner excepting the addition of iron.
Absorbance of the sample extract was measured against a blank at the wavelength of
500 nm_
AIM/ytlc31 Studies on the Atmospheric Depositions
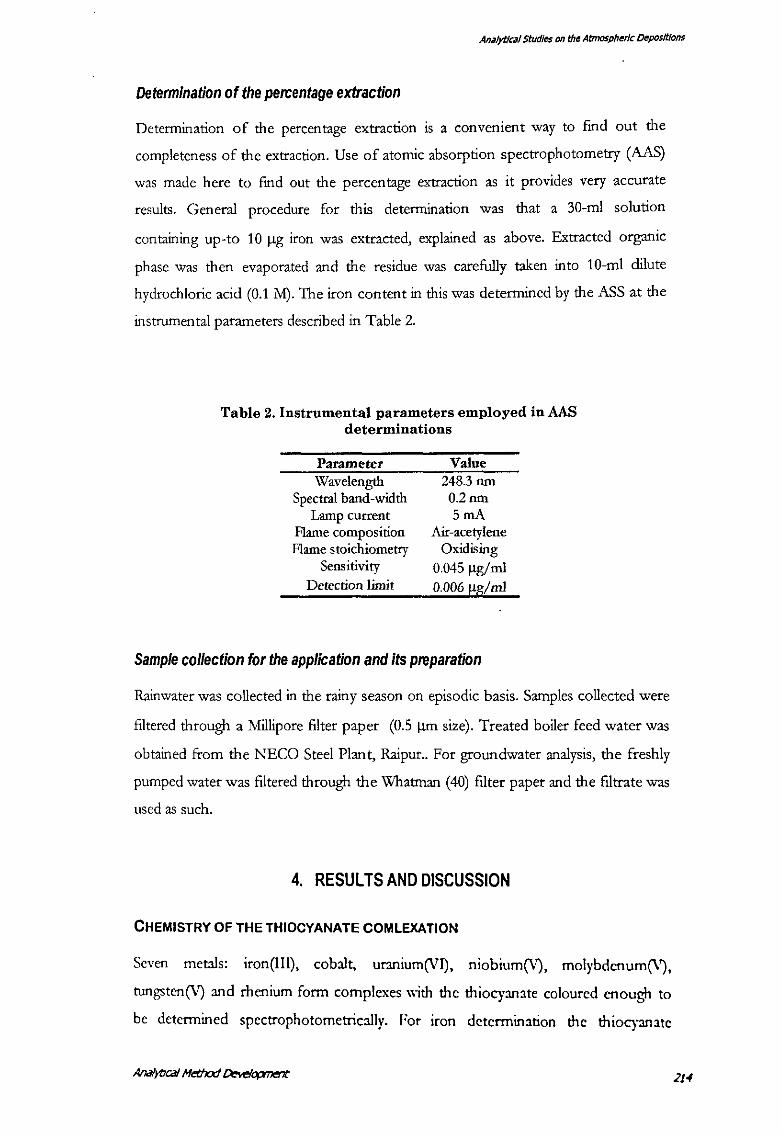
Determination of the percentage extraction
Determination of the percentage extraction is a convenient way to fmd out the
completeness of the extraction. Use of atomic absorption spectrophotometry (AAS)
was made here to fmd out the percentage extraction as it provides very accurate
results. General procedure for this determination was that a 30-ml solution
containing up-to 10 ].lg iron was extracted, explained as above. Extracted organic
phase was then evaporated and the residue was carefully taken into 10-ml dilute
hydrochloric acid (0.1 M). The iron content in this was determined by the ASS at the
instrumental parameters described in Table 2.
Table 2. Instrumental parameters employed in AAS determinations
Parameter Wavelength
Spectral band-width Lamp current
Flame composition Flame stoichiometry
Sensitivity Detection limit
Value 248.3nm 0.2 nm SmA
Air-acetylene Oxidising
0.045 ].lg/ml 0.006 ).lg/ml
Sample collection for the application and its preparation
Rainwater was collected in the rainy season on episodic basis. Samples collected were
filtered through a Millipore filter paper (0.5 J.l.m size). Treated boiler feed water was
obtained from the NECO Steel Plant, Raipur .. For groundwater analysis, the freshly
pumped water was filtered through the Whatman (40) filter paper and the filtrate was
used as such.
4. RESULTS AND DISCUSSION
CHEMISTRY OF THE THIOCYANATE COMLEXATION
Seven metals: iron(III), cobalt, uranium(VI), niobium(\'), molybdenum(\\
tungsten(\') and rhenium form complexes \\ith the thiocyanate coloured enough to
be determined spectrophotometrically. For iron determination the thiocyanate
Analytical StUdll$ on th~ Atmosph~rlc D~posltions
method is attractive as the determinations can be carried out even in the strongly
acidic solution with good sensitivity. It is because the thiocyanic acid is highly ionised.
Nevertheless, the selectivity of the method is low because of its reactions with the
above-mentioned metals, if present and other probable elements viz. titanium,
ruthenium, osmium, iridium and bismuth. Generally, the thiocyanate forms a series of
consecutive complexes wherein the absorption peaks are shifted to longer
wavelengths with the increasing thiocyanate concentrations but the exact
compositions are still not very clear (Sandel, 1959, Home, 1978). A maJor
shortcoming in the thiocyanate chemistry is the instability of the coloured solutions
that may be caused by the reducing property of the thiocyanates, its decomposition
products causing the fading of the Fe(III)-cyanate complex or by the slow
decomposition of the thiocyanate in acidic medium. The decomposition caused
essentially by the polymerisation of the thiocyanic acid results in the formation of
yellow coloured products (Sandel, 1959) and is the main cause of the colour
instability. The use of acetone to improve the colour constancy and the intensity was
extensively studied (Crouthamel et al., 1952, 54). Still, there are many drawbacks
associated, such as the increased interference and the volume limitations. Thus, need
to increase the selectivity and the stability of the iron -thiocyanate complex for
determining the trace quantities of iron in various type of samples, is evident. This
can be done by an understanding of the Fe(III)-thiocyanate chemistry and suitable
modifications to it.
This study has attempted to address the aforesaid issues and to make the method
applicable for the field determination of iron. The iron(III)-thiocyanate complex can
not be extracted into non-polar solvents, which is desirable to minimise the
interferences associated with the use of polar solvents. Such an extraction in a non
polar solvent can be achieved by adding a reagent or a mixture of such reagents that
can act as the counter ions or the adducts, to cause the extraction. In the paper
communicated for publication (Pandey, Chandrawanshi, Patel, 1997) the use of a two
pronged strategy had been proposed. First is the use of a cationic surfactant in
conjunction with amides and the second is the use of a mixture of cationic and
anionic surfactant for the extraction of iron. Both methods prO\;de good extraction
efficiency over a wide range of acidity with increased scnsiti,;ty. Part of the work
concerning the surfactant-amide usage has been presented in a Ph.D. thesis
(Chandrawanshi, 1997). This chapter reports here the usc of the surfactant mixtures
]JS
Analytical Stud/a on the Atmospheric Depositions
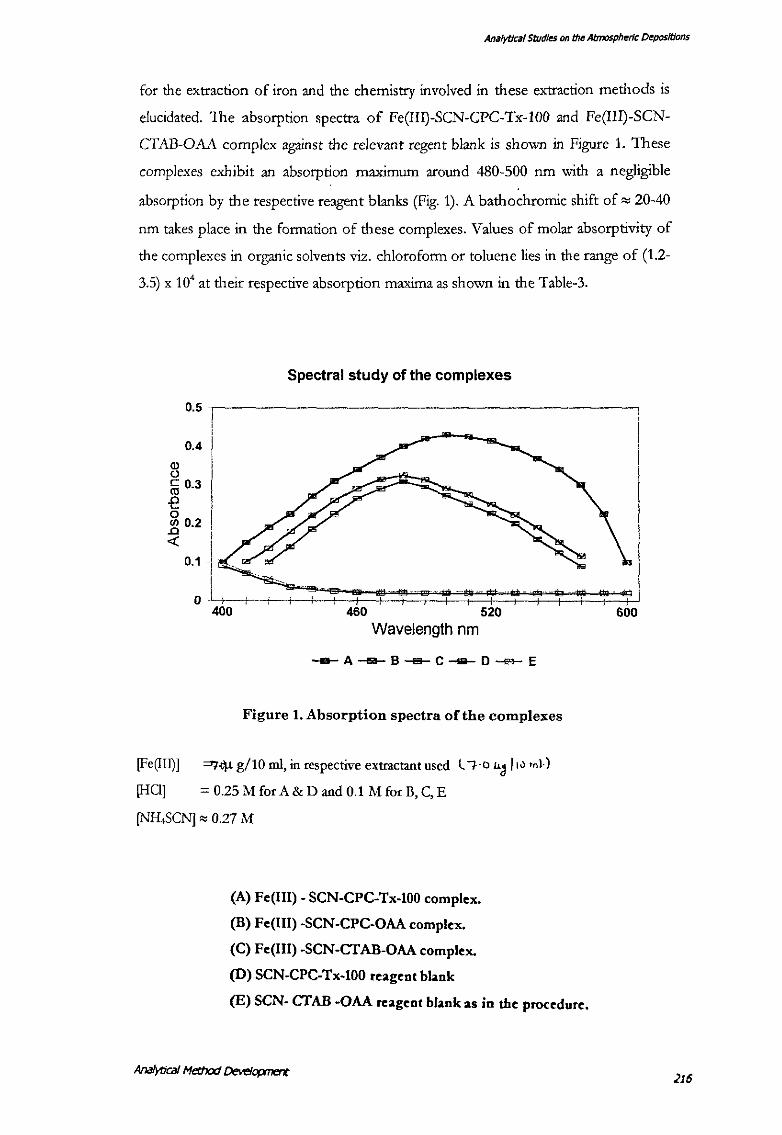
for the extraction of iron and the chemistry involved in these extraction methods is
elucidated. The absorption spectra of Fe(III)-SCN-CPC-Tx-100 and Fe(III)-SCN
CTAB-OAA complex against the relevant regent blank is shown in Figure 1. These
complexes exhibit an absorption maximum around 480-500 nm with a negligible
absorption by the respective reagent blanks (Fig. 1). A bathochromic shift of"' 20-40
nm takes place in the formation of these complexes. Values of molar absorptivity of
the complexes in organic solvents viz. chloroform or toluene lies in the range of (1.2-
3.5) x 104 at their respective absorption maxima as shown in the Table-3.
Spectral study of the complexes
0.5.------
Q) 0
0.4
ai 0.3
-e 0 .2 0.2 <(
I
--0.1-rs:--0 - ' :::::~~~\":=;'~~~~--~-=--~~
400 460 520
Wavelength nm
-e- A -e-- B -e- C ....,._ D __.,._. E
Figure 1. Absorption spectra of the complexes
[Fe(III)] ='7~ g/10 ml, in respective extractant used l To~ l1~ ml·)
[HCl] = 0.25MforA&DandO.l MforB,C,E
[NH.SCN] "' 0.27 M
(A) Fe(lll)- SCN-CPC-Tx-100 complex.
(B) Fe(lll) -SCN-CPC-OAA complex.
(C) Fe(lll) -SCN-CTAB-OAA complex.
(D) SCN-CPC-Tx-100 reagent blank
(E) SCN- CTAB -OAA reagent blank as in tbe procedure.
600
}16
Ana/ytlal studies on th~ Atmospheric Depositions
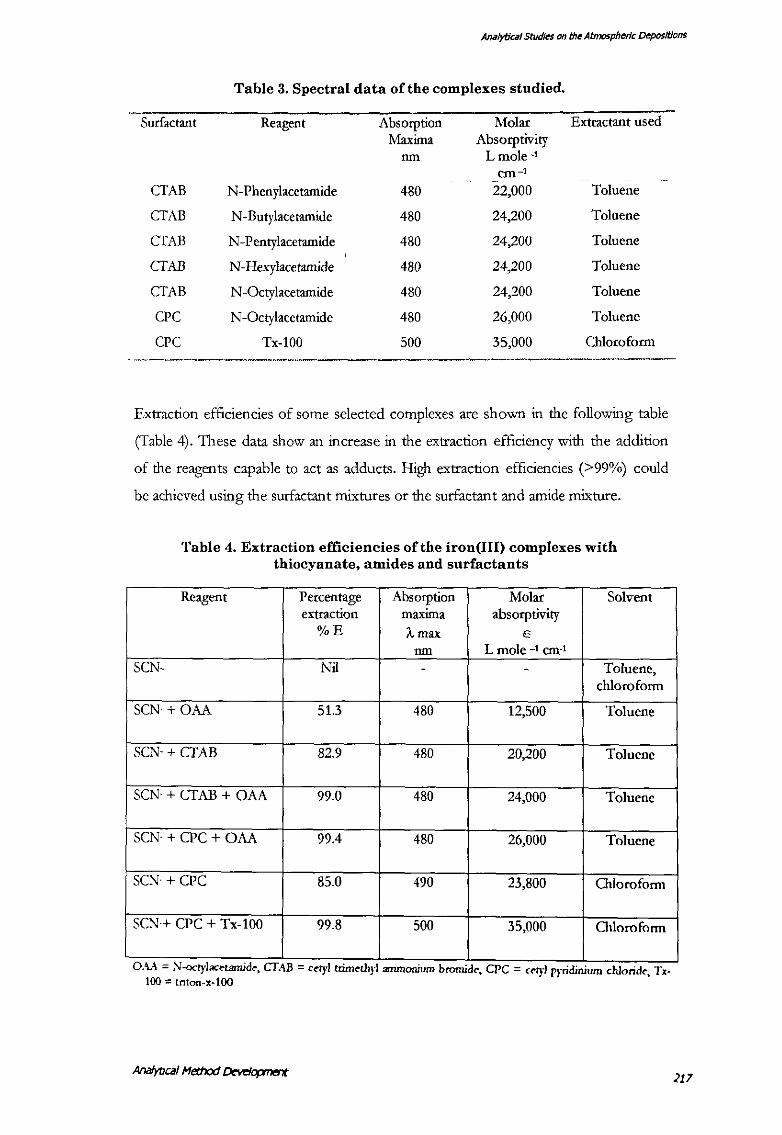
Table 3. Spectral data of the complexes studied.
Surfactant Reagent Absorption Molar Extractant used Maxima Absorptivity
nm L mole ·1
cm-1
CTAB N-Phenylacetamide 480 22,000 Toluene
CTAB N-Butylacetamide 480 24,200 Toluene
CTAB N-Pentylacetamide 480 24,200 Toluene
CTAB N-Hexylacetamide 480 24,200 Toluene
CTAB N -Octylacetamide 480 24,200 Toluene
CPC N -Octylacetamide 480 26,000 Toluene
CPC Tx-100 500 35,000 Chloroform
Extraction efficiencies of some selected complexes are shown in the following table
(Table 4). These data show an increase in the extraction efficiency with the addition
of the reagents capable to act as adducts. High extraction efficiencies (>99%) could
be achieved using the surfactant mixtures or the surfactant and amide mixture.
Table 4. Extraction efficiencies of the iron(III) complexes with thiocyanate, amides and surfactants
Reagent
SCN-
SCN-+ OAA
SCN-+ CTAB
SCN- + CTAB + OAA
SCN- + CPC + OAA
SC'-.1· + CPC
SOH CPC + Tx-100
0.\A N-ocl)lacNamzde, CTAB 100 = tnton-x-100
Percentage Absorption Molar Solvent extraction maxtma absorptivity
%E ;\.max E
nm L mole -1 em·' Nil - - Toluene,
chloroform
51.3 480 12,500 Toluene
82.9 480 20,200 Toluene
99.0 480 24,000 Toluene
99.4 480 26,000 Toluene
85.0 490 23,800 Chloroform
99.8 500 35,000 01loroform
uryl tnmethJI ammoruum brorrud<". CPC- uryJ rrndinmm chlonde. Tx-
)17
Analytical Studies on the Af:mosph~rlc ~positions
OPTIMISATION OF THE ANALYTICAL PARAMETERS FOR THE DETERMINATION OF
IRON(III)-THIOCYANATE-CPC-TX-1 00 METHOD
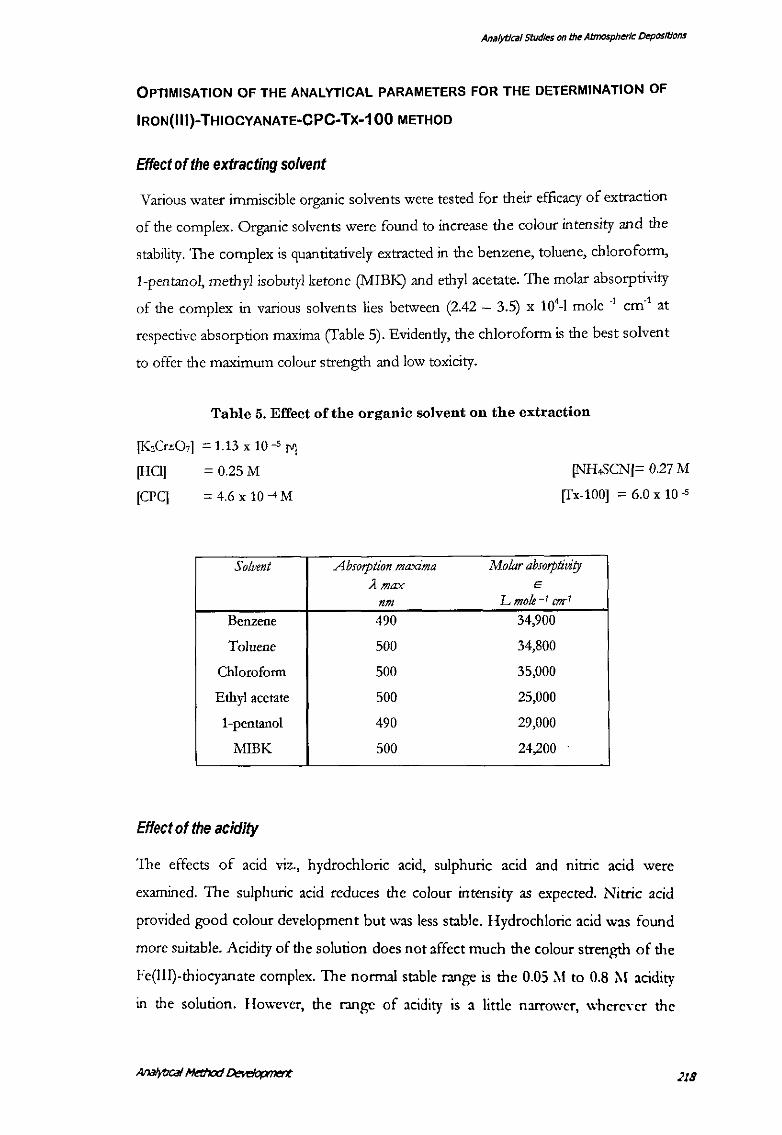
Effect of the extracting solvent
Various water immiscible organic solvents were tested for their efficacy of extraction
of the complex. Organic solvents were found to increase the colour intensity and the
stability. The complex is quantitatively extracted in the benzene, toluene, chloroform,
1-pentanol, methyl isobutyl ketone (MIBK) and ethyl acetate. The molar absorptivity
of the complex in various solvents lies between (2.42 - 3.5) x 104-l mole _, em·' at
respective absorption maxima (Table 5). Evidently, the chloroform is the best solvent
to offer the maximum colour strength and low toxicity.
Table 5. Effect of the organic solvent on the extraction
[KzCrt:O,] = 1.13 x 10⁻⁵M
[HCI] = 0.25 M
[CPq = 4.6 X 10 -4 M
[NH,SCN]= 0.27 M
[fx-100] = 6.0 x 10 -5
Solvent Absorption maxima Molar absorptivity A max E
nm L mole -t cur'
Benzene 490 34,900
Toluene 500 34,800
Chloroform 500 35,000
Ethyl acetate 500 25,000
1-pentanol 490 29,000
MIBK 500 24,200
Effect of the acidity
The effects of acid VIZ., hydrochloric acid, sulphuric acid and nitric acid were
examined. The sulphuric acid reduces the colour intensity as expected. Nitric acid
provided good colour development but was less stable. Hydrochloric acid was found
more suitable. Acidity of the solution does not affect much the colour strength of tl1e
Fe(III)-thiocyanate complex. The normal stable range is the 0.05 ~I to 0.8 M acidity
in the solution. However, the range of acidity is a little narrower, whereYer the
.218
Analytical studies on the Atmospheric Depositions
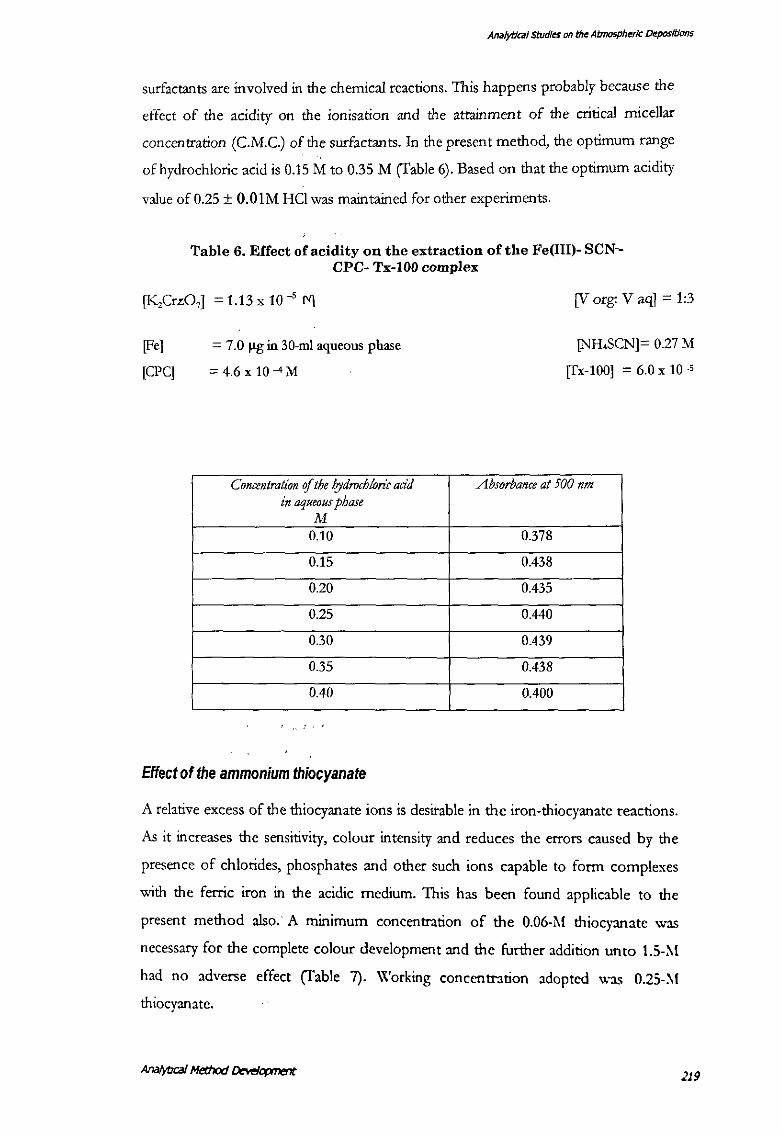
surfactants are involved in the chemical reactions. This happens probably because the
effect of the acidity on the ionisation and the attainment of the critical micellar
concentration (C.M.C.) of the surfactants. In the present method, the optimum range
of hydrochloric acid is 0.15 M to 0.35 M (Table 6). Based on that the optimum acidity
value of 0.25 ± O.OlM HCl was maintained for other experiments.
Table 6. Effect of acidity on the extraction of the Fe(III)- SCN-CPC- Tx-100 complex
[K2CrL07
] = 1.13 x 10 _, f'l] [V org: V aq] = 1:3
[Fe]
[CPC]
= 7.0 f!g in 30-ml aqueous phase
= 4.6 X 10⁻⁴M
[NH.SCN]= 0.27 M
[fx-100] = 6.0 x 10 -5
Concentration of the f(ydroch!oric acid Absorbance at 500 nm in aqueous phase
M 0.10 0.378
0.15 0.438
0.20 0.435
0.25 0.440
0.30 0.439
0.35 0.438
0.40 0.400
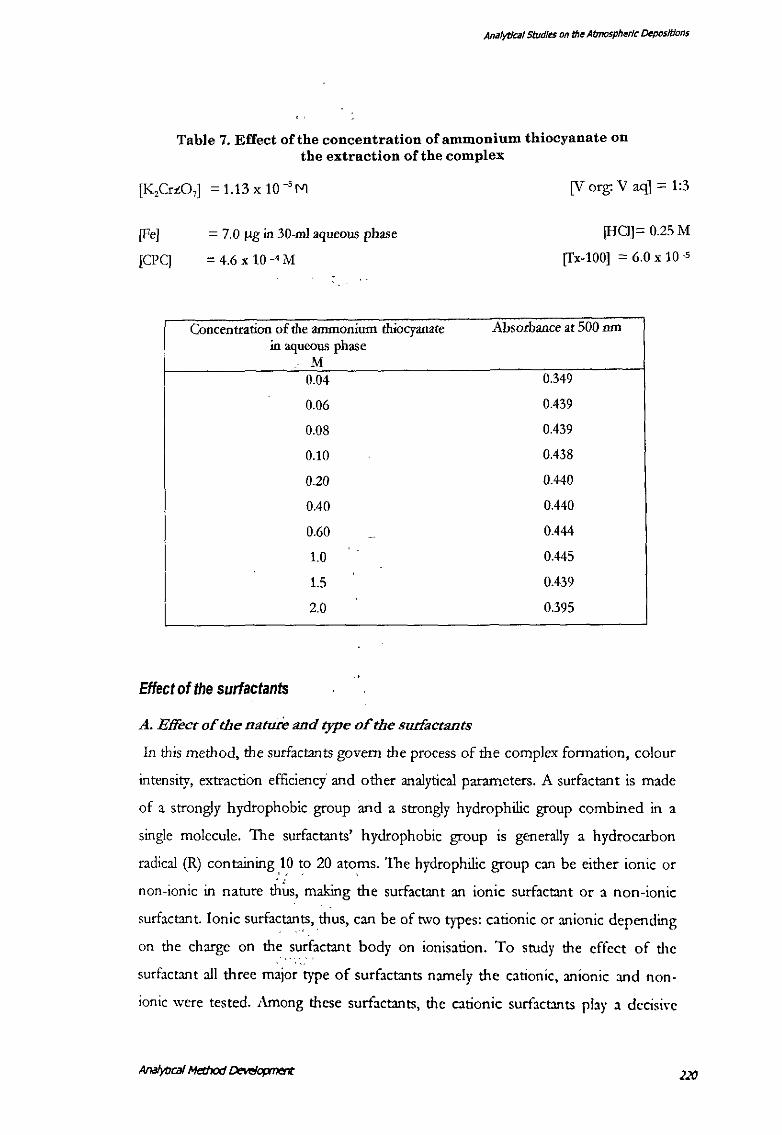
Effect of the ammonium thiocyanate
A relative excess of the thiocyanate ions is desirable in the iron-thiocyanate reactions.
As it increases the sensitivity, colour intensity and reduces the errors caused by the
presence of chlorides, phosphates and other such ions capable to form complexes
with the ferric iron in the acidic medium. This has been found applicable to the
present method also.' A minimum concentration of the 0.06-l\l thiocyanate was
necessary for the complete colour development and the further addition unto 1.5-:\l
had no adverse effect (Table 7). \"\'orking concentration adopted was 0.25-:\1
thiocyanate.
AndlytJca/ Method lJeo.elopment 219
Analytical Stud!~ on th~ Almospht!tlc ~positions
Table 7. Effect of the concentration of ammonium thiocyanate on the extraction of the complex
[K,Crz07] = 1.13 x 10 -sM
[Fe]
[CPC]
= 7.0 ~gin 30-ml aqueous phase
= 4.6 X 10⁻⁴M
Concentration of the ammonium thiocyanate in aqueous phase
M 0.04
0.06
0.08
0.10
0.20
0.40
0.60
1.0
1.5
2.0
Effect of the surfactants
A. Effect of the natUie and type of the surfactants
[V org: Vag]= 1:3
[HO]= 0.25M
[Tx-100] = 6.0 x 10 -s
Absorbance at 500 nm
0.349
0.439
0.439
0.438
0.440
0.440
0.444
0.445
0.439
0.395
In this method, the surfactants govern the process of the complex formation, colour
intensity, extraction efficiency and other analytical parameters. A surfactant is made
of a strongly hydrophobic group and a strongly hydrophilic group combined in a
single molecule. The surfactants' hydrophobic group is generally a hydrocarbon
radical (R) containing 10 to 20 atoms. The hydrophilic group can be either ionic or ',- - '
non-ionic in nature th~s, making the surfactant an ionic surfactant or a non-ionic
surfactant. Ionic surfactants, thus, can be of two types: cationic or anionic depending ,·· '
on the charge on the surfactant body on ionisation. To study the effect of the
surfactant all three major type of surfactants namely the cationic, anionic and non
ionic were tested. Among these surfactants, the cationic surfactants play a decisi\·e
Analytical Stud/~ on the Atmospheric Depositions
role in the chemistry of colour formation and extraction and the reactions are
influenced by the non-ionic surfactants. Table 8, presents the effect of the types of
surfactan ts.
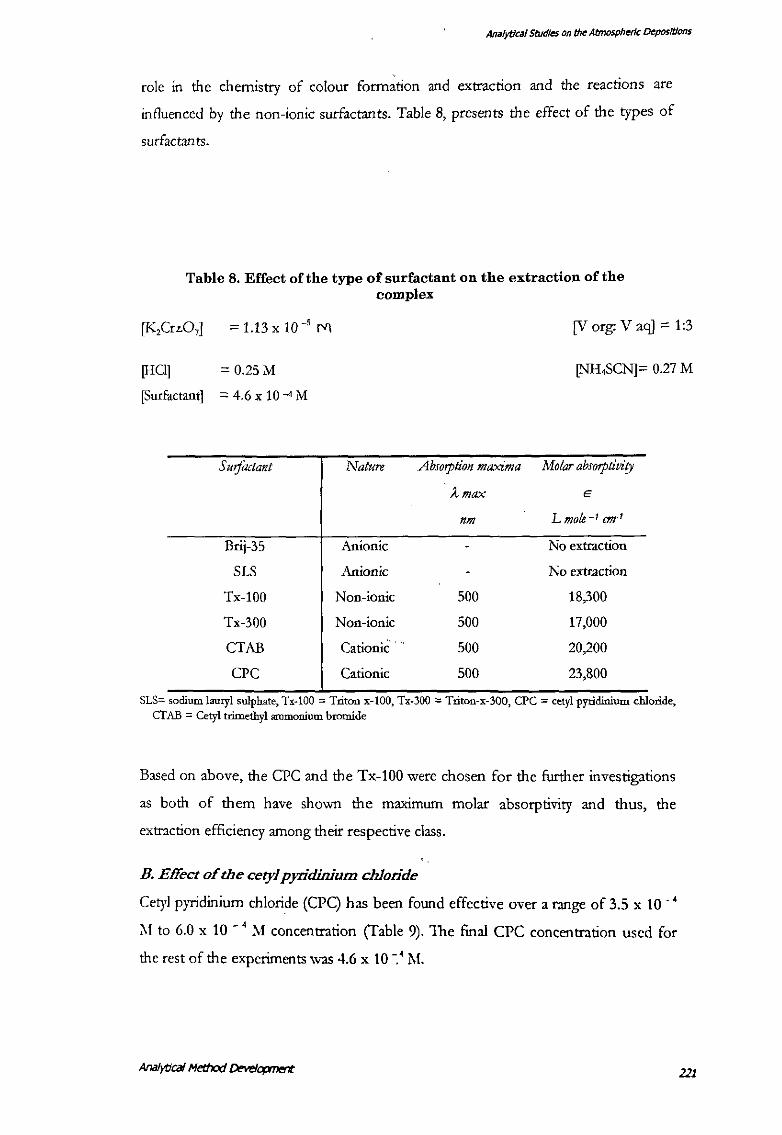
Table 8. Effect of the type of surfactant on the extraction of the complex
[K,Crz.O,] = 1.13 X 10 -S M [V org: V aq] = 1:3
[HCI] = 0.25 M [NH,SCN]= 0.27 M
[Surfactant] = 4.6 x 10⁻⁴M
Surfactant
Brij-35
SLS
Tx-100
Tx-300
CTAB
CPC
Nature
Anionic
Anionic
Non-ionic
Non-ionic
Cationic-·
Cationic
Absotption maxima Molar absotptitity
A-max E
nm L mole - 1 cnr1
No extraction
No extraction
500 18,300
500 17,000
500 20,200
500 23,800
SLS= sodium Iaury! sulphate, Tx-100 =Triton x-100, Tx-300 = Triton-x-300, CPC =cetyl pyridiniurn chloride, CT AB = Cetyl trimethyl ammonium bromide
Based on above, the CPC and the Tx-100 were chosen for the further investigations
as both of them have shown the maximum molar absorptivity and thus, the
extraction efficiency among their respective class.
B. Effect of the cetylpyridinium chloride
Cetyl pyridinium chloride (CPq has been found effective over a range of 3.5 x I 0 · 4
;'II to 6.0 x 10 -4
M concentration (fable 9). The final CPC concentration used for
the rest of the experiments was 4.6 x 10 -.• J\1.
221
AnHiytlcal Studies on th~ AtmosphMc Depositions
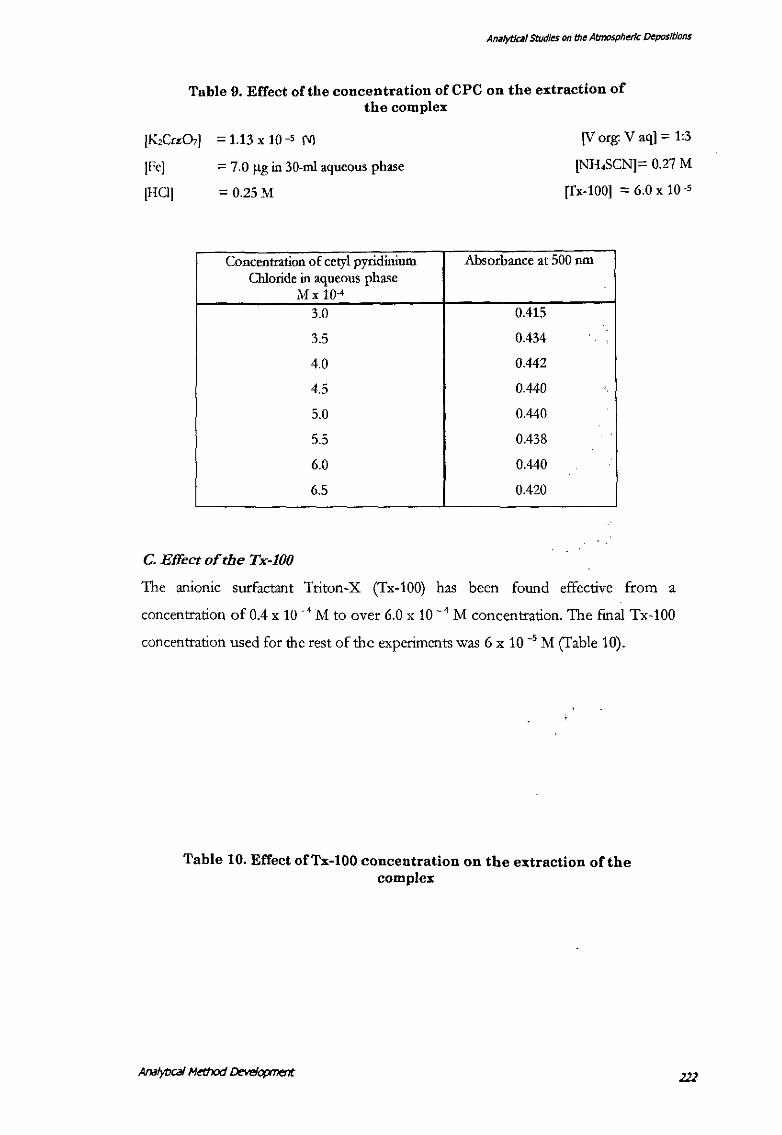
Table 9. Effect of the concentration of CPC on the extraction of the complex
[K,Cn:O,] = 1.13 X 10⁻⁵ 1\']
IFeJ = 7.0 f(g in 30-ml aqueous phase
[HCl] = 0.25 M
Concentration of cetylpyridinium Chloride in aqueous phase
Mx 10·4
3.0
3.5
4.0
4.5
5.0
5.5
6.0
6.5
C. Effectofthe Tx-100
[V org: V aq] = 1:3
[NH,SCN]== 0.27 M
[Tx-100] = 6.0 x 10 ·5
Absorbance at 500 nm
0.415
0.434
0.442
0.440
0.440
0.438
0.440
0.420
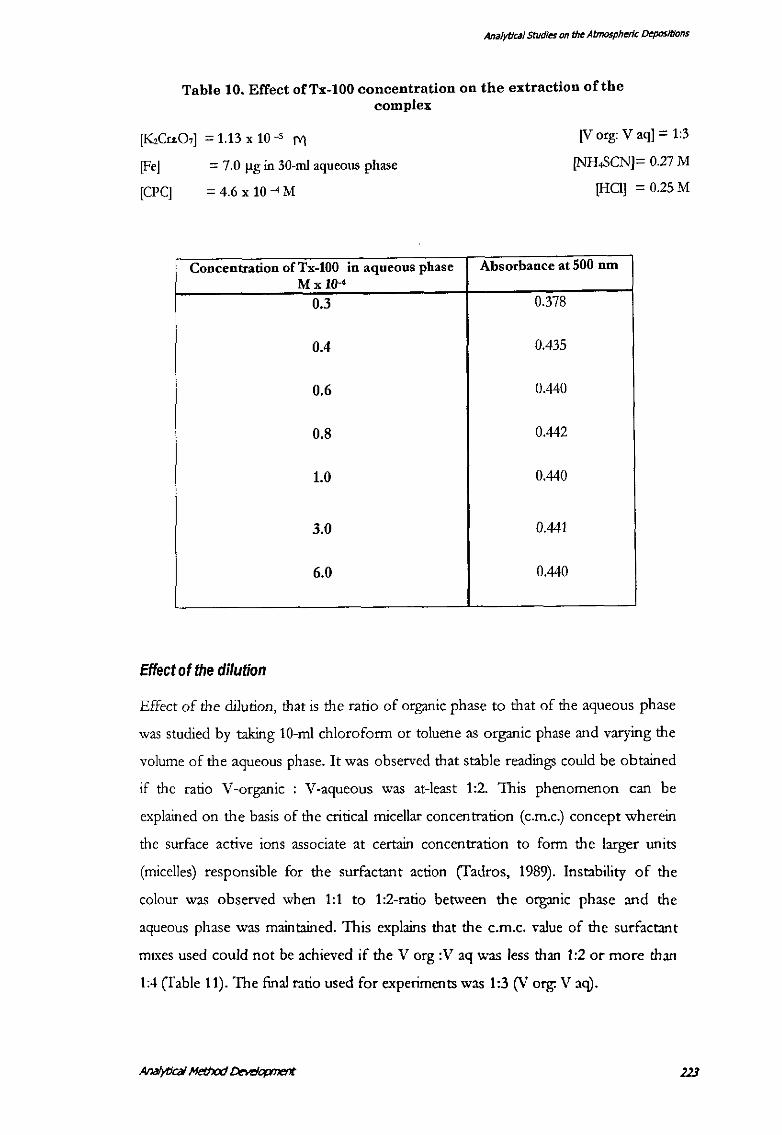
The anionic surfactant Triton-X (Tx-100) has been found effective from a
concentration of0.4 x 10 ·• M to over 6.0 x 10 -• M concentration. The final Tx-100
concentration used for the rest of the experiments was 6 x 10 -s M (Table 10).
Table 10. Effect ofTx-100 concentration on the extraction ofthe complex
Analytical Studies on the Atmospheric ~positions
Table 10. Effect ofTx-100 concentration on the extraction of the complex
[K2CaO,] = 1.13 x 10 -s M
[Fe]
[CPC]
= 7.0 flg in 30-ml aqueous phase
= 4.6 X 10⁻⁴M
Concentration ofTx-100 in aqueous phase M X 10-•
0.3
0.4
0.6
0.8
1.0
3.0
6.0
Effect of the dilution
[V org: V aq] = 1:3
[NH.SCN]= 0.27 M
[HCI] = 0.25 M
Absorbance at 500 nm
0.378
0.435
0.440
0.442
0.440
0.441
0.440
Effect of the dilution, that is the ratio of organic phase to that of the aqueous phase
was studied by taking 1 0-ml chloroform or toluene as organic phase and varying the
volume of the aqueous phase. It was observed that stable readings could be obtained
if the ratio V-organic : V-aqueous was at-least 1:2. This phenomenon can be
explained on the basis of the critical micellar concentration (c.m.c.) concept wherein
the surface active ions associate at certain concentration to form the larger units
(micelles) responsible for the surfactant action (Tadros, 1989). Instability of the
colour was observed when 1:1 to 1:2-ratio between the organic phase and the
aqueous phase was maintained. This explains that the c.m.c. value of the surfactant
mtxes used could not be achieved if the V org :V aq was less than 1:2 or more than
1:4 (fable 11). The fmal ratio used for experiments was 1:3 (V org: V aq).
Analytict~lstudles on th~ Atmospheric Depositions
Table 11. Study of the effect of dilution on the extraction of the complex
[KzCrL07] = 1.13 x 10 -5 M
[Fe]
[CPC]
= 7.0 Jlg in 30-ml aqueous phase
= 4.6 X 10⁻⁴M
Volume ratio of organic to aqueous phase
1:1
1:2
1:3
1:4
1:5
Effect of the temperature
[HCI] = 0.25 M
[NH.SCN]= 0.27 M
[Tx-100] = 6.0 x 10 -5
Absorbance at 500 nm
0.390
0.433
0.440
0.440
0.361
Temperature affects the colour intensity and the stability of the ferric thiocyanate
solutions and a decrease of about 7% has been reported (Sandel, 1959) when the
temperature is raised from 15° to 30° C. The rate of fading is greater at higher
temperature. The present method too is subject to the effects of the temperature and
it affects the reproducibility and the molar absorptivity of the complex, particularly
when only a mixture of the surfactant was used. The Kraft temperature of the
surfactants probably governs this wherein the temperature affects the process of
attainment of the critical micellar concentration (Tadros, 1989). The results were
reproducible between 20-25°C, which is the normal temperature. Therefore, the
experimental work was carried at room temperatures (23 ± 2°C).
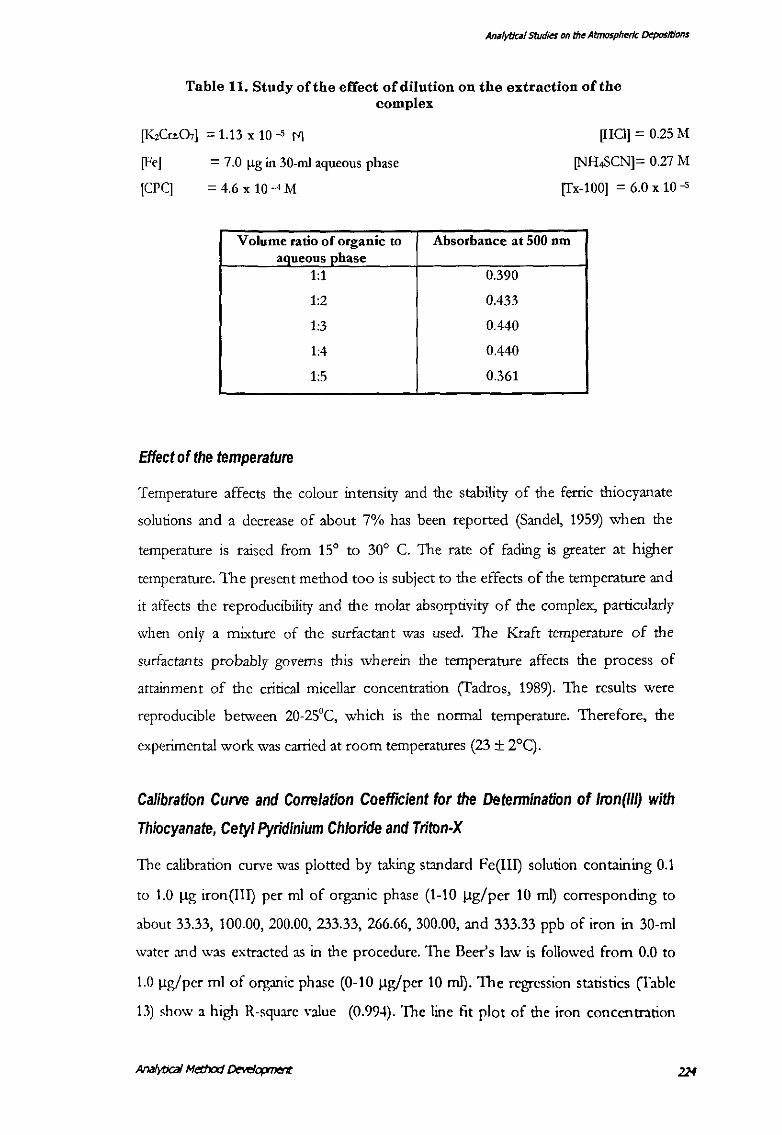
Calibration Curve and Correlation Coefficient for the Detennination of lron(/11) with
Thiocyanate, CetylPyridinium Chloride and Triton·X
The calibration curve was plotted by taking standard Fe(III) solution containing 0.1
to 1.0 !lg iron(Ill) per ml of organic phase (1-10 !lg/per 10 mQ corresponding to
about 33.33, I 00.00, 200.00, 233.33, 266.66, 300.00, and 333.33 ppb of iron in 30-ml
water and was extracted as in the procedure. The Beer's law is followed from 0.0 to
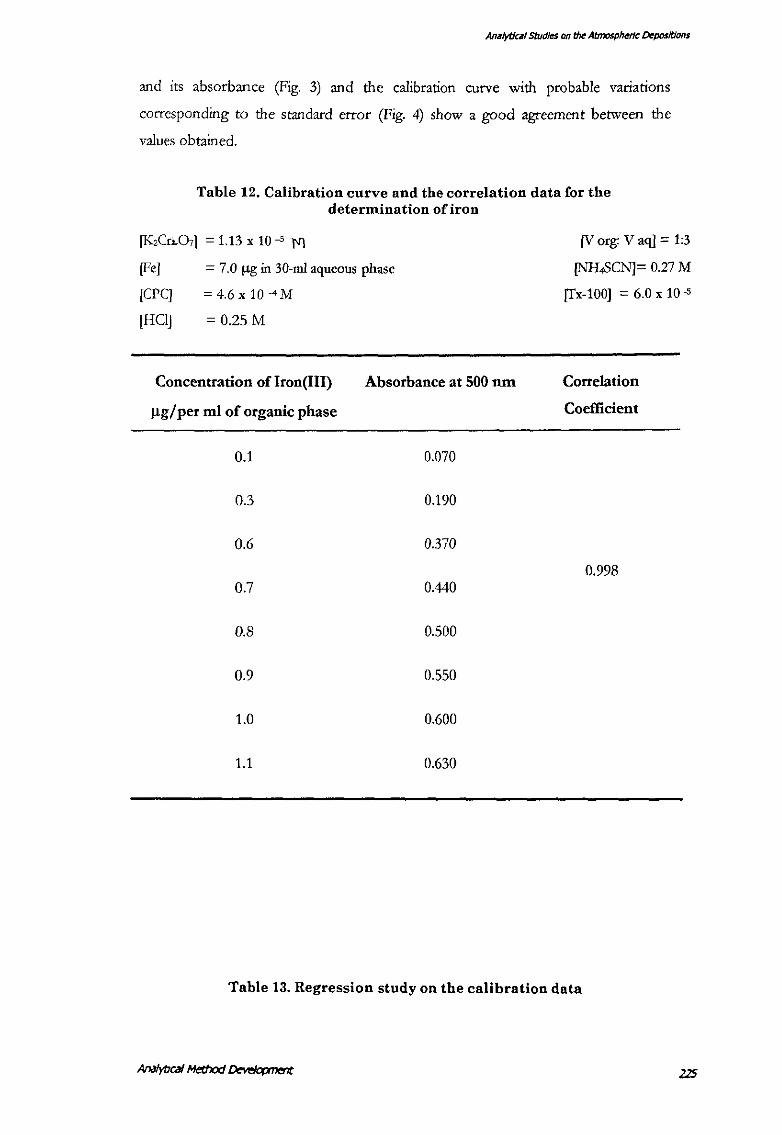
1.0 llg/pcr ml of organic phase (0-10 !lg/per 10 mQ. The regression statistics (I'able
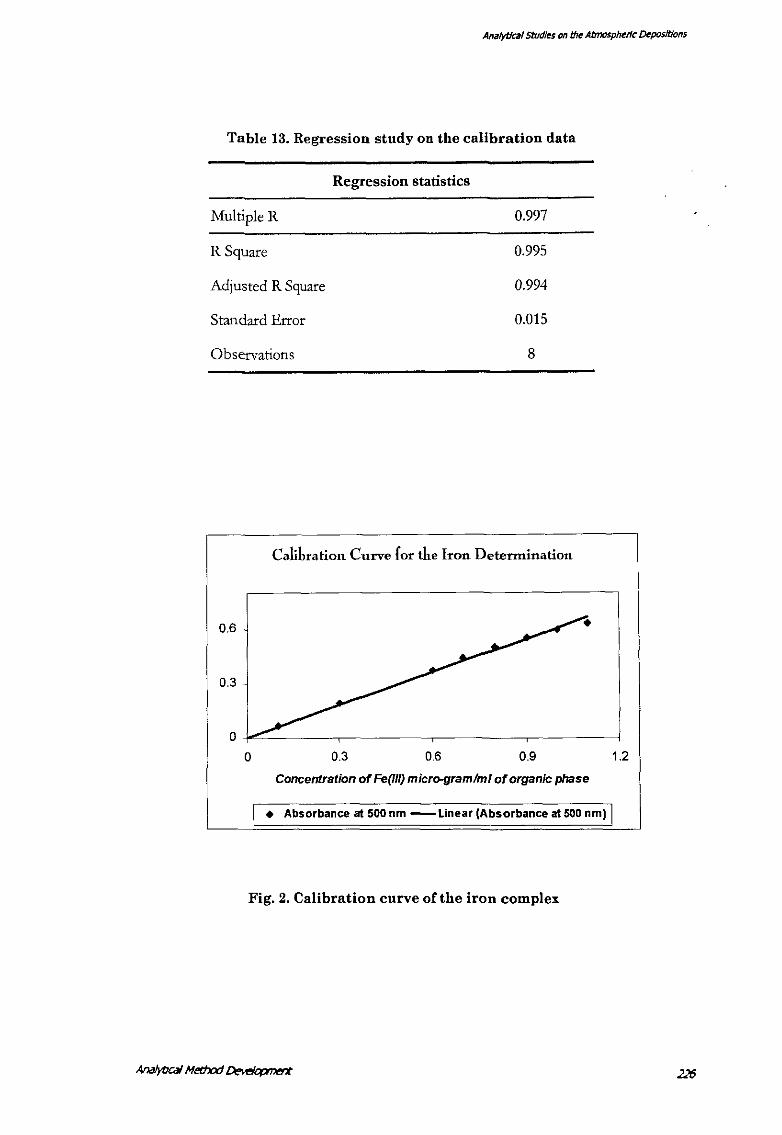
13) show a high R-square ,-alue (0.994). The line fit plot of the iron concentration
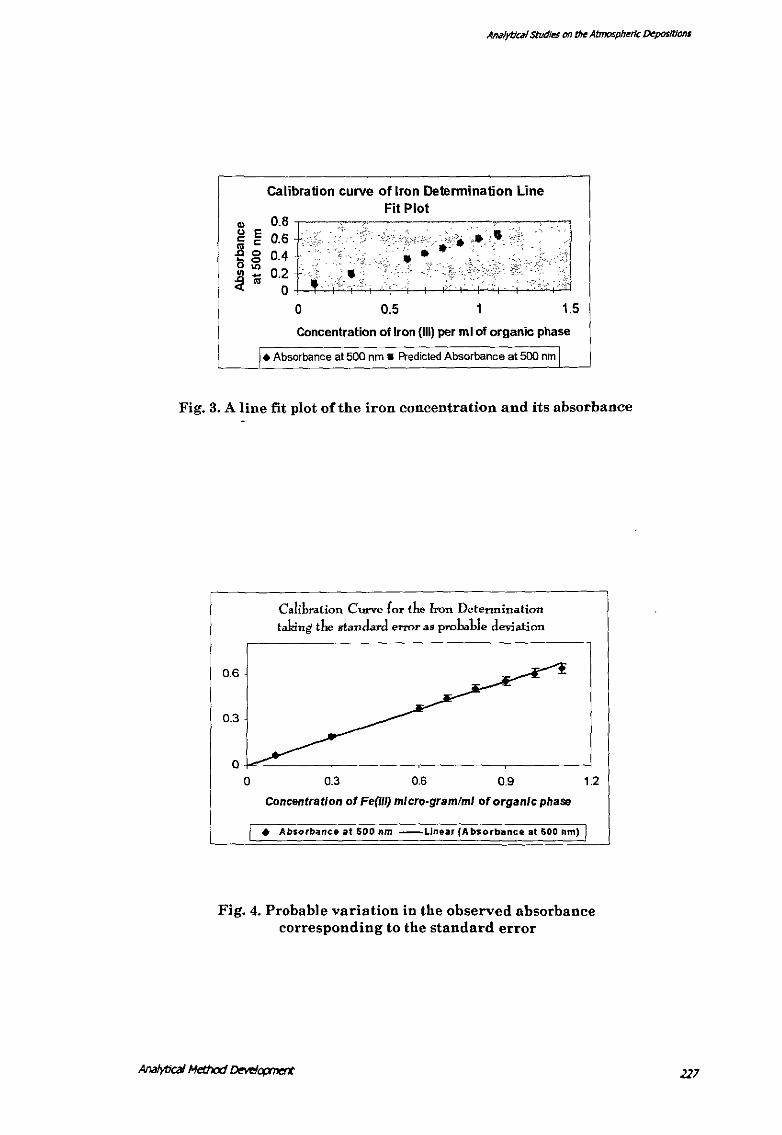
Anil/yt/cill studies on the Atmospheric Depositions
and its absorbance (Fig. 3) and the calibration curve with probable variations
corresponding to the standard error (Fig. 4) show a good agreement between the
values obtained.
[Fe]
[CPC]
[HCI]
Table 12. Calibration cnrve and the correlation data for the determination of iron
= 7.0 f.1g in 30-ml aqueous phase
= 4.6x 10⁻⁴M
= 0.25M
[V org: V aq] = 1:3
[NH,SCN]= 0.27 M
[Tx-100] = 6.0 x 10 .s
Concentration of Iron(III) Absorbance at 500 run Correlation
J.lg/per ml of organic phase Coefficient
0.1 0.070
0.3 0.190
0.6 0.370
0.998 0.7 0.440
0.8 0.500
0.9 0.550
1.0 0.600
1.1 0.630
Table 13. Regression study on the calibration data
Analytical Studt~ on th~ Atmosph~rlc CMposltions
Table 13. Regression study on the calibration data
Multiple R
R Square
Adjusted R Square
Standard Error
Observations
Regression statistics
0.997
0.995
0.994
O.DlS
8
Calibration Curve for the Iron Determination
0 0.3 0.6 0.9
Concentration of Fe(IIQ micr<H}ramhn/ of organic phase
• Absorbance at 500 nm -Linear (Absorbance at 500 nm)
Fig. 2. Calibration curve of the iron complex
1.2
"' " E c c .2 0 6 0
"' ~ -"'
Calibration curve of Iron Determination Line Fit Plot
0.8
r ~
_ _; -.2·"'": 0.6 .. -;',· ..
0.4 ,, '': _',.;/
·--<~:.
0.2
__ ,,,
C, • i ·, ... . 0 --, I . I
0 0.5 1 1.5
Concentration of Iron (Ill) per ml of organic phase
• Absorbance at 500 nm • Predicted Absorbance at 500 nm
Fig. 3. A line fit plot of the iron concentration and its absorbance
0
Calibration Curve for the Tron Determination talcing the standard error as probable deviation
0.3 0.6 0.9
Concentration of Fe(lll) mlcro-gramlml of organic phase
• Absorbance at 500 nm --Linear (Absorbance at 600 nm)
1.2
Fig. 4. Probable variation in the observed absorbance corresponding to the standard error
lll
Anil/yt/~11 studies on th~ Atmosph~rlc ~positions
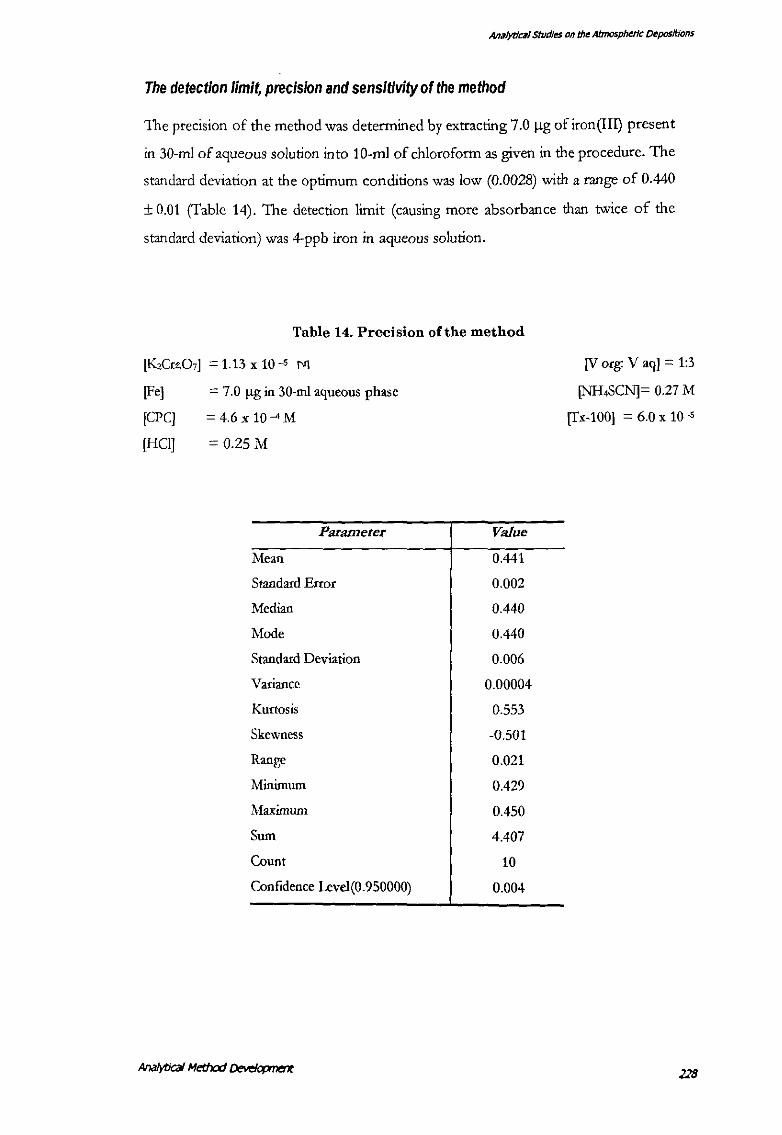
The detection limit, precision and sensitivity of the method
The precision of the method was determined by extracting 7.0 ~g of iron(III) present
in 30-ml of aqueous solution into 1 0-ml of chloroform as given in the procedure. The
standard deviation at the optimum conditions was low (0.0028) with a range of 0.440
± 0.01 (Table 14). The detection limit (causing more absorbance than twice of the
standard deviation) was 4-ppb iron in aqueous solution.
[Fe]
[CPC]
[HCl]
Table 14. Precision of the method
= 7.0 Jlg in 30-ml aqueous phase
= 4.6 X 10⁻⁴M
= 0.25M
Parameter
Mean
Standatd Error
Median
Mode
Standard Deviation
Variance
Kurtosis
Skewness
Range
Minimum
Maximum
Sum
Count
Confidence Level(0.950000)
Value
0.441
0.002
0.440
0.440
0.006
0.00004
0.553
-0.501
0.021
0.429
0.450
4.407
10
0.004
IV org: V aq] = 1:3
[NH..SCN]= 0.27 M
[fx-100] = 6.0 x 10 ·S
COMPOSITION OF THE COMPLEX
Iron(III) can form a variety of complexes depending on the number of the
thiocyanate ions co-ordinated with the Fe(III). This can be depicted as:
Fe>+ + n sew~ [Fe (SCN)n )'' -n
Where the value of n could be 1 ... 6. At low thiocyanate ion concentrations iron(III)
forms [Fe (SCN)J 2+ predominantly (Lewin et a!, 1955). At 0.1 M concentration of
thiocyanate the resulting complex is mainly [Fe (CNS),f. It is predicted that above
0.2 M concentration of thiocyanate, negatively charged complexes may predominate.
However, the lower log K values prevented the formation of a stable complex. The
approximate log K'. values were reported as 2.3, 1.94, 1.4, 0.8, and 0.02 for n = 1. ..
5, respectively (Babko, 1946). In the present investigation, the thiocyanate
concentration was 0.27 M, which should favour the formation of negatively charged
iron(III)-thiocyanate complex. Further, as the stability of the complex is good it can
be presumed that the cationic surfactants added in the solution stabilise the complex.
The anionic surfactant or amides help in the quantitative extraction of the complex
leading to higher extraction efficiency and the molar absorptivity.
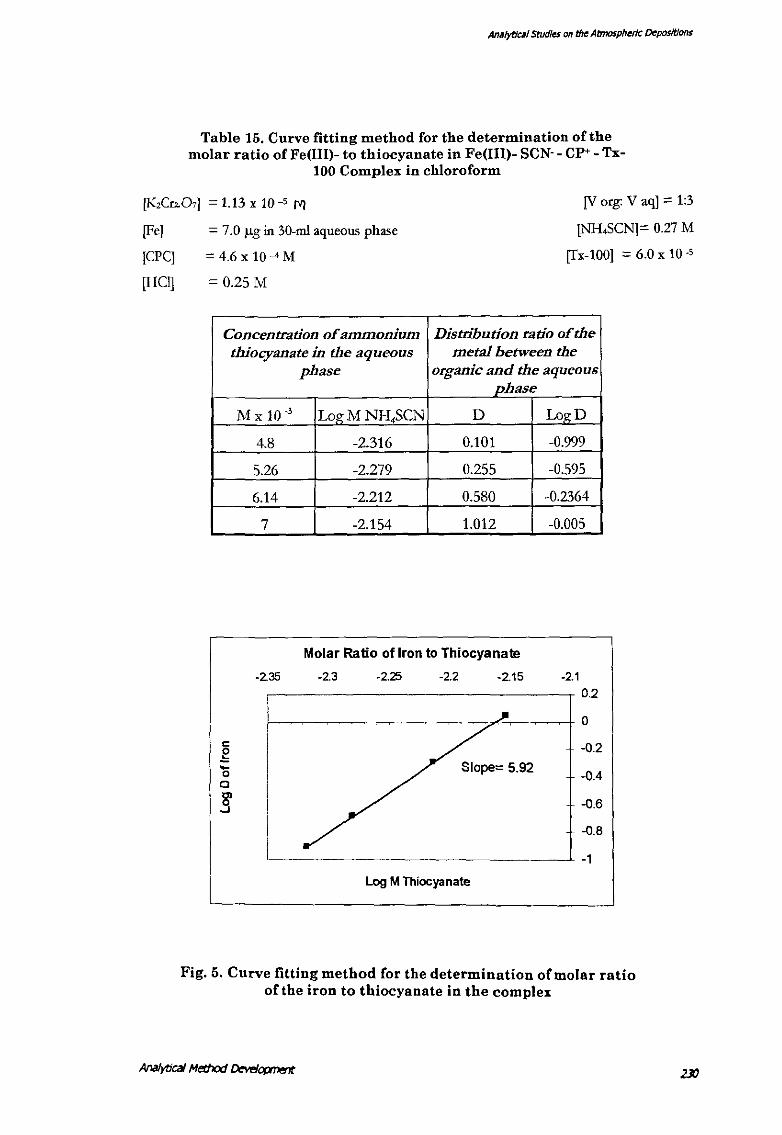
To verify the above by fmding out the composition of the complex, methods such as
the mole ratio, slope ratio, Job's ratio of continuous variation and the curve-fitting
were tested and the curve fitting method (Sillen, 1956) was found applicable. For this
7.0 !lg of iron solution was extracted as described in the procedure and the log
distribution ratio [Log D) of the metal was plotted against the log molar
concentration [Log M] of the reagent. The distribution ratio [OJ was calculated by
the formula:
[D) =A eq I (A max- A eq)
Where A eq is the absorbance of the complex when the reagent is in equilibrium and
A max is the absorbance of the complex when the reagent is in constant excess.
Table 15, presents the data on the pog M) and pog D) and the figure (Fig. 5) shows
the regression between the data set.
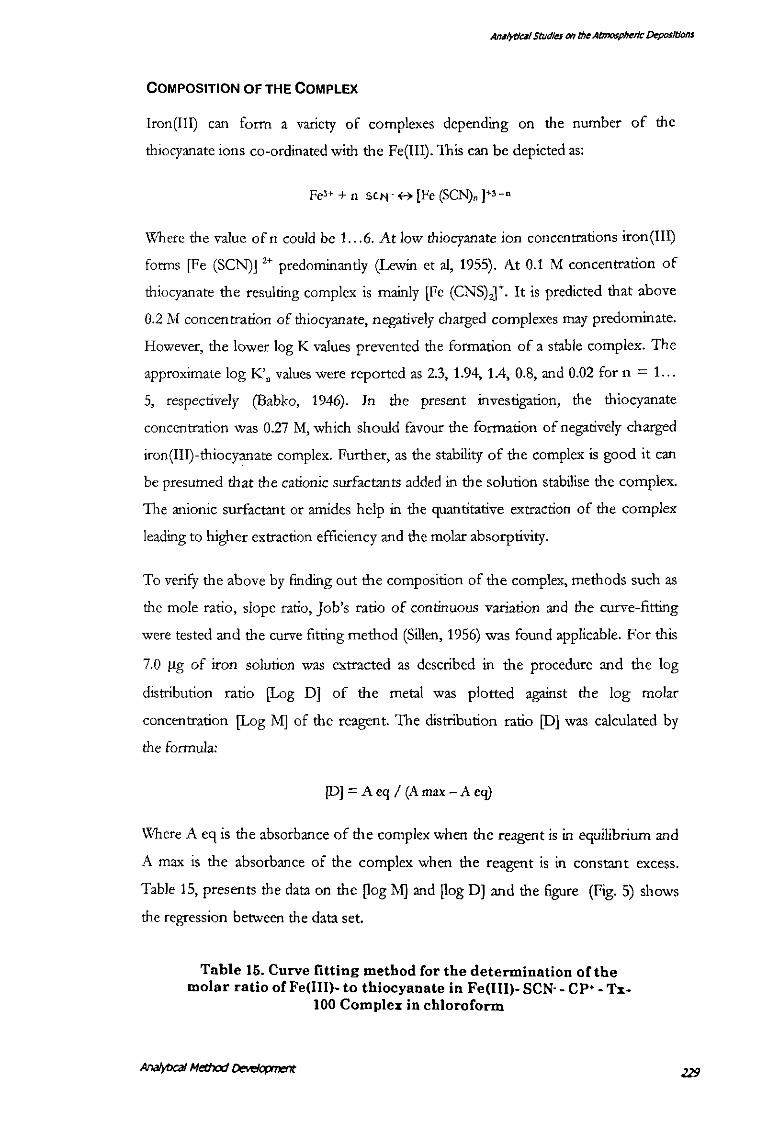
Table 15. Curve fitting method for the determination of the molar ratio of Fe(III)- to thiocyanate in Fe (Ill)- SCN·- CP• - Tx-
100 Complex in chloroform
Ana/ytJcaJ Method I:Jewjopment
Analytical Studies on the Atmospheric Depositions
Table 15. Curve fitting method for the determination of the molar ratio of Fe(III)- to thiocyanate in Fe(lll)- SCN-- CP+- Tx-
100 Complex in chloroform
[KzCrL07] = 1.13 x 10 -5 M [V org: V aq] = 1:3
[NH.SCN]= 0.27 M
[Tx-100] = 6.0 x 10 -5
[Fe] = 7.0 /-Lg in 30-ml aqueous phase
[CPC]
[HCl]
= 4.6 X 10⁻⁴M
= 0.25M
Concentration of ammonium Distribution ratio of the thiocyanate in the aqueous metal between the
c g 0 c
.§'
phase organic and the aqueous phase
M X 10 _, LogMNH4SCN D LogD
4.8 -2.316 0.101 -0.999
5.26 -2.279 0.255 -0.595
6.14 -2.212 0.580 -0.2364
7 -2.154 1.012 -0.005
Molar Ratio of Iron to Thiocyanate
-2.35 -21
,---------------------.- 0.2 -2.3 -2.25 -2.2 -2.15
f-----~~~-~~~~~~~~---}0
-0.2
Slope= 5.92 -0.4
-0.6
-0.8
Log M Thiocyanate
Fig. 5. Curve fitting method Cor the determination oC molar ratio of the iron to thiocyanate in the complex
Analytical studies on the Atmospheric Depositions
Table 16. Summary regression statistics of the regression between the log M and log D values .of the complex formation
Parameters Value
Multiple R 0.979
R Square 0.959
Adjusted R Square 0.938
Standard Error 0.108
Observations 4
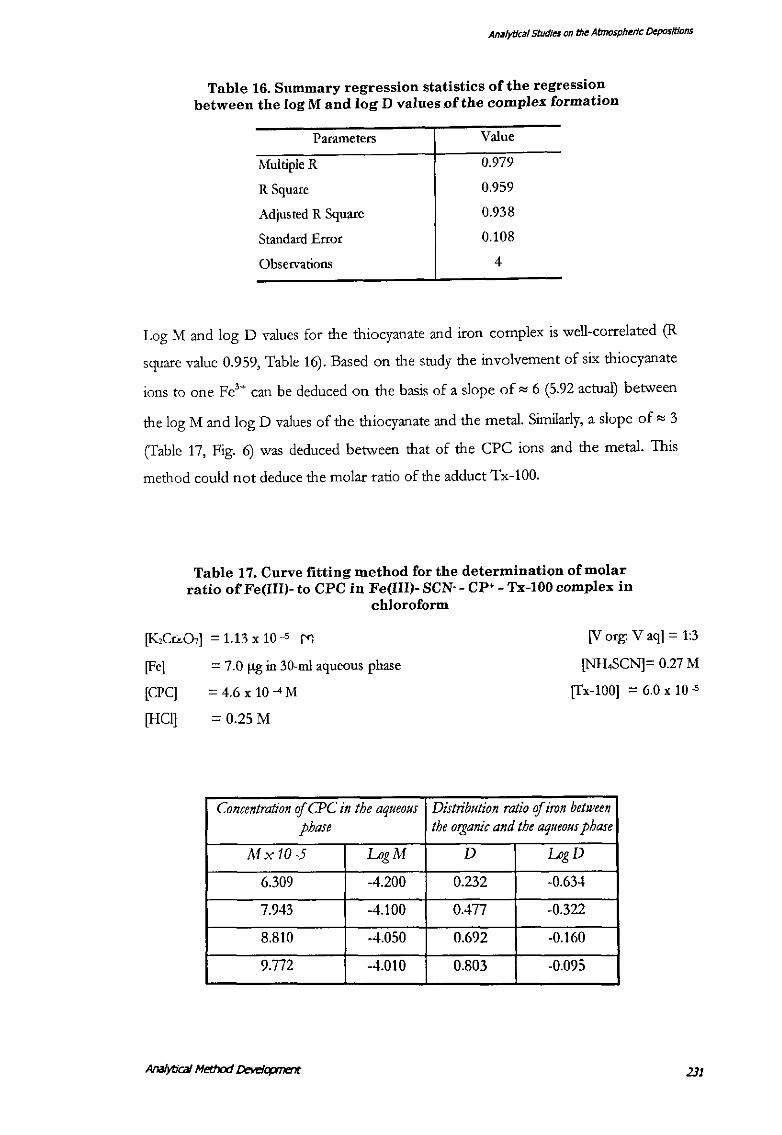
Log M and log D values for the thiocyanate and iron complex is well-correlated (R
square value 0.959, Table 16). Based on the study the involvement of six thiocyanate
ions to one Fe'+ can be deduced on the basis of a slope of"" 6 (5.92 actual) between
the log M and log D values of the thiocyanate and the metal. Similarly, a slope of"" 3
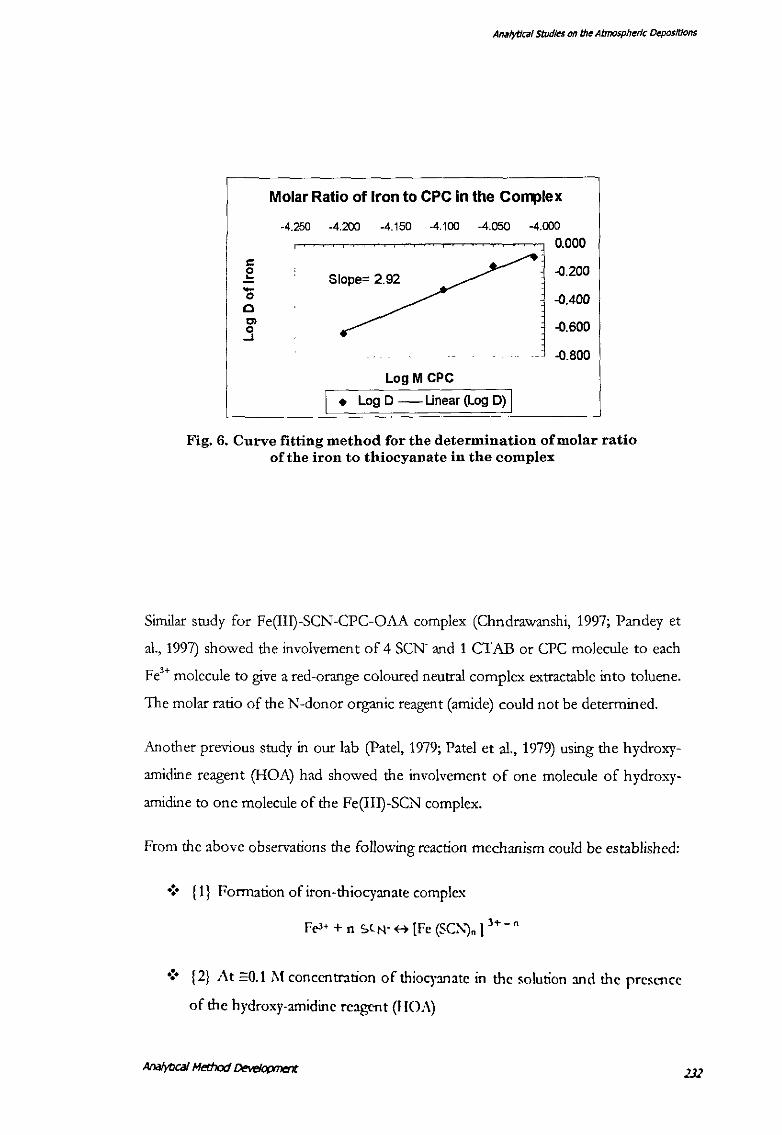
(Table 17, Fig. 6) was deduced between that of the CPC ions and the metal. This
method could not deduce the molar ratio of the adduct Tx-100.
Table 17. Curve fitting method for the determination of molar ratio of Fe(III)- to CPC in Fe(III)- SCN-- CP+- Tx-100 complex in
chloroform
[KzCr:.O,] = 1.13 x 10⁻⁵ M
[Fe)
[CPC]
[HCl]
= 7.0 ftg in 30-ml aqueous phase
= 4.6 X 10⁻⁴M
[V org: V aq) = 1:3
[NH.SCN]= 0.27 M
[fx-100) = 6.0 x 10 -5
= 0.25M
Concentration of CPC in the aqueous Distribution ratio of iron between phase the organic and the aqueous phase
Mx 10-5 LogM D LogD
6.309 -4.200 0.232 -0.634
7.943 -4.100 0.477 -0.322
8.810 -4.050 0.692 -0.160
9.772 -·t.010 0.803 -0.095
EI
AnH/ytJCHI studies on the Atmospheric ~positions
Molar Ratio of Iron to CPC in the Co~lex
-4.250 -4.200 -4.150 -4.100 -4.050 -4.000
0.000 c e Slope= 2.92 -0.200
-0.400 '0 0
-0.600 "' ..9 -0.800
Log M CPC
I • Log D - Unear (Log D) I
Fig. 6. Curve fitting method for the determination of molar ratio of the iron to thiocyanate in the complex
Similar study for Fe(Ill)-SCN-CPC-OAA complex (Chndrawanshi, 1997; Pandey et
aL, 1997) showed the involvement of 4 SeN· and 1 CTAB or CPC molecule to each
Fe,. molecule to give a red-orange coloured neutral complex extractable into toluene.
The molar ratio of the N-donor organic reagent (amide) could not be determined.
Another previous study in our lab (Patel, 1979; Patel et al., 1979) using the hydroxy
amidine reagent (HOA) had showed the involvement of one molecule of hydroxy
amidine to one molecule of the Fe(III)-SCN complex.
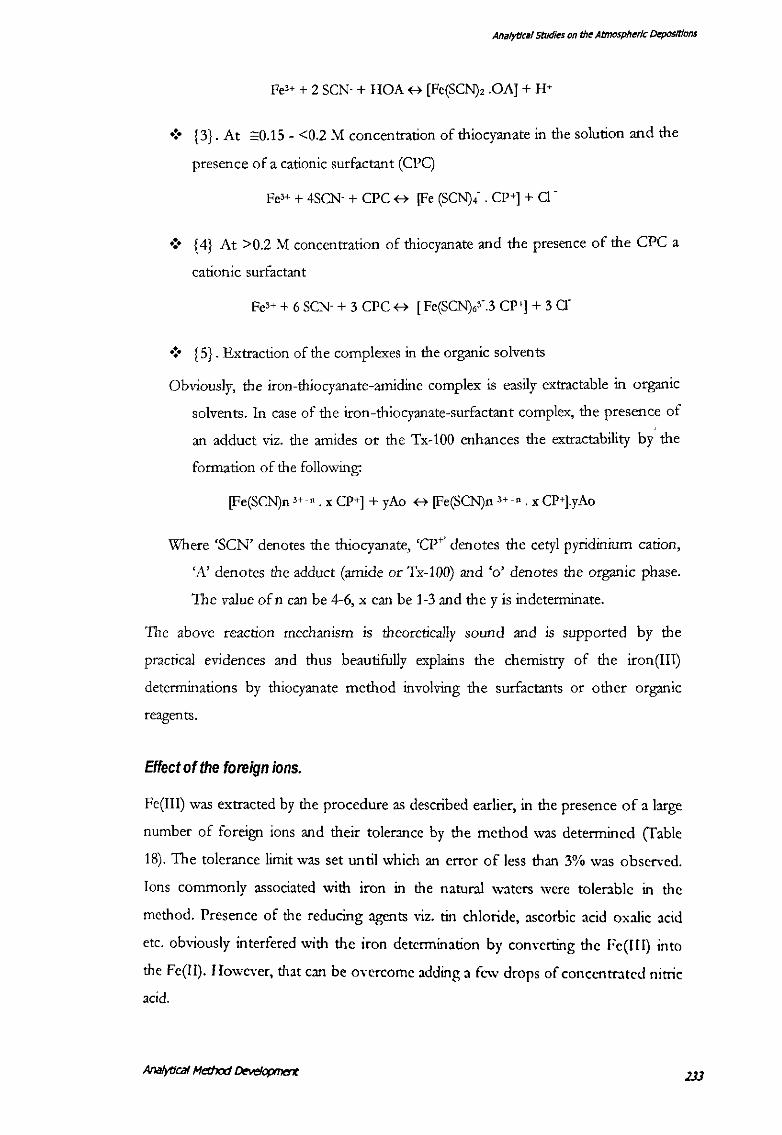
From the above observations the following reaction mechanism could be established:
•!• { 1} Formation of iron-thiocyanate complex
Fe-'+ + n St N- +-t [Fe (SC::-..j. ) 3+- 0
•!• { 2} At =o.t i\1 concentration of thiocyanate in the solution and the presence
of the hydroxy-amidine reagent (I lOA)
Analytical studies on the Atmospheric Depositions
Fe'++ 2 SCN- + HOA ++ [Fe(SCN), .OAJ + JI+
•:• {3}. At :=0.15- <0.2 M concentration of thiocyanate in the solution and the
presence of a cationic surfactant (CPC)
FeH + 4SCN- + CPC ++ [Fe (SCN).- . CP+J + 0.
•:• ( 4} At >0.2 M concentration of thiocyanate and the presence of the CPC a
cationic surfactant
Fe'+ + 6 SCN- + 3 CPC ++ [ Fe(SCN)o3 .. 3 CP+J + 3 Cr
•:• { 5}. Extraction of the complexes in the organic solvents
Obviously, the iron-thiocyanate-amidine complex is easily extractable in organic
solvents. In case of the iron-thiocyanate-surfactant complex, the presence of '
an adduct viz. the amides or the Tx-100 enhances the extractability by the
formation of the following:
[Fe(SCN)n 3+-n. x CP+J + yAo ++ [Fe(SCN)n 3+-n. x CP+J.yAo
Where 'SCN' denotes the thiocyanate, 'CP+' denotes the cetyl pyridinium cation,
'A' denotes the adduct (amide or Tx-100) and 'o' denotes the organic phase.
The value of n can be 4-6, x can be 1-3 and the y is indeterminate.
The above reaction mechanism is theoretically sound and is supported by the
practical evidences and thus beautifully explains the chemistry of the iron(III)
determinations by thiocyanate method involving the surfactants or other organic
reagents.
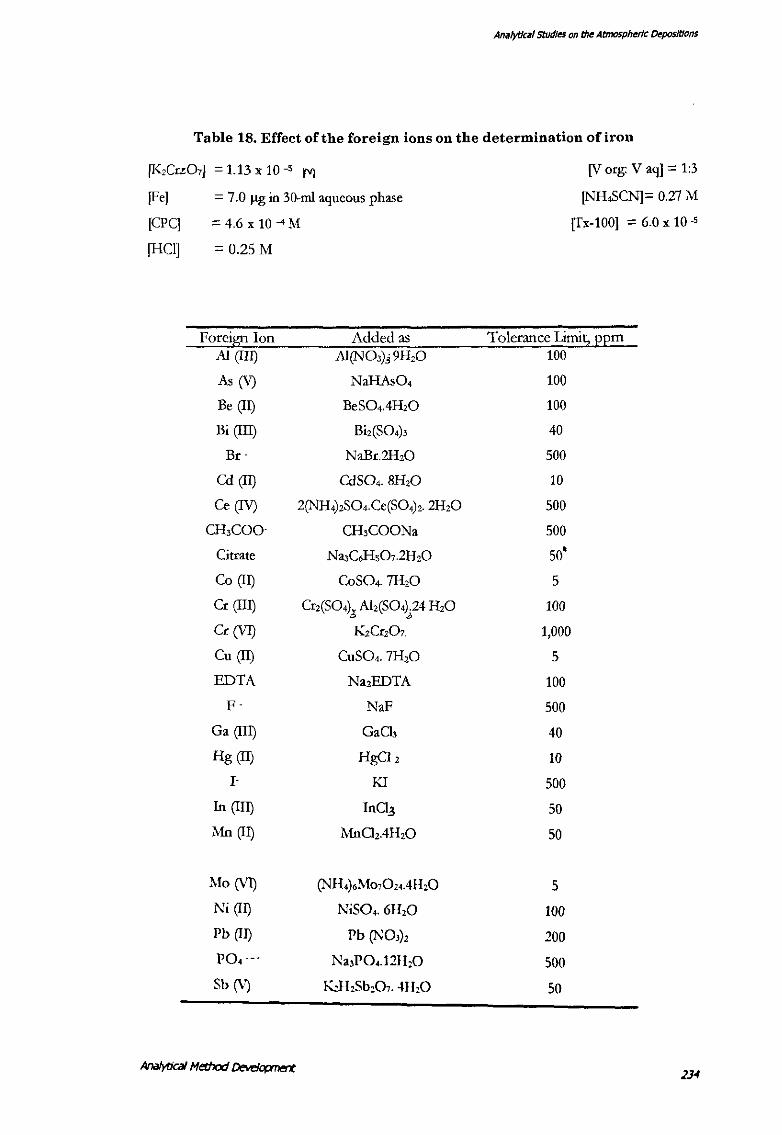
Effect of the foreign ions.
Fe(III) was extracted by the procedure as described earlier, in the presence of a large
number of foreign ions and their tolerance by the method was determined (fable
18). The tolerance limit was set until which an error of less than 3% was observed.
Ions commonly associated with iron in the natural waters were tolerable in the
method. Presence of the reducing agents viz. tin chloride, ascorbic acid oxalic acid
etc. obviously interfered with the iron determination by com·erting the Fe(Ill) into
the Fe(ll). However, that can be overcome adding a few drops of concentrated nitric
acid.
m
Analytical studies on the Atmospheric Depositions
Table 18. Effect of the foreign ions on the determination of iron
[I<zCuO,J = 1.13 x 10⁻⁵ M
[Fe] = 7.0 J.Lg in 30-ml aqueous phase
[CPC]
[HCI]
= 4.6 X 10⁻⁴M
= 0.25M
Foreign Ion Added as AI (Ill) Al(N0,)3 9H,o
As(V) NaHAsO,
Be (II) BeS0,.4HzO
Bi (Ill) Biz(SO,),
Br- NaBr.2HzO
Cd (II) CdSO,. BH,O
Ce(IV) 2(NH,)zSO,.Ce(SO,)z. 2Hz0
CH,COO- CH,COONa
Citrate Na,C,H50,.2H,O
Co (II) CoSO,. 7H,O
Cr (Ill) Cr,(SO,)<; AJ,(S0,)_.24 H20
Cr (VI) KzCrz07.
Cu (Il) CuSO,. 7H20
EDTA NazEDTA
p- NaF
Ga(IIJ) GaO,
Hg (Il) HgClz
I- KI
In (Ill) In Cia
Mn (II) MnOz.4fi,O
.Mo (VI) (NH,)oMo,0,..4!I,O
Ni (II) NiSO,. 6H,O
Pb (II) Pb (NO,),
PO,--- Na,P0d2H,O
Sb (V) Kd!,Sb,O,. 41 [,0
(V org: V aq] = 1:3
[NH,SCN]= 0.27 M
[fx-100] = 6.0 x 10 -5
Tolerance Limit, EEm 100
100
100
40
500
10
500
500
so' 5
100
1,000
5
100
500
40
10
500
so 50
5
100
200
500
50
Af71/ytJC~I studle~ on t/1(! Atrnosph~rlc f)(!posltlons
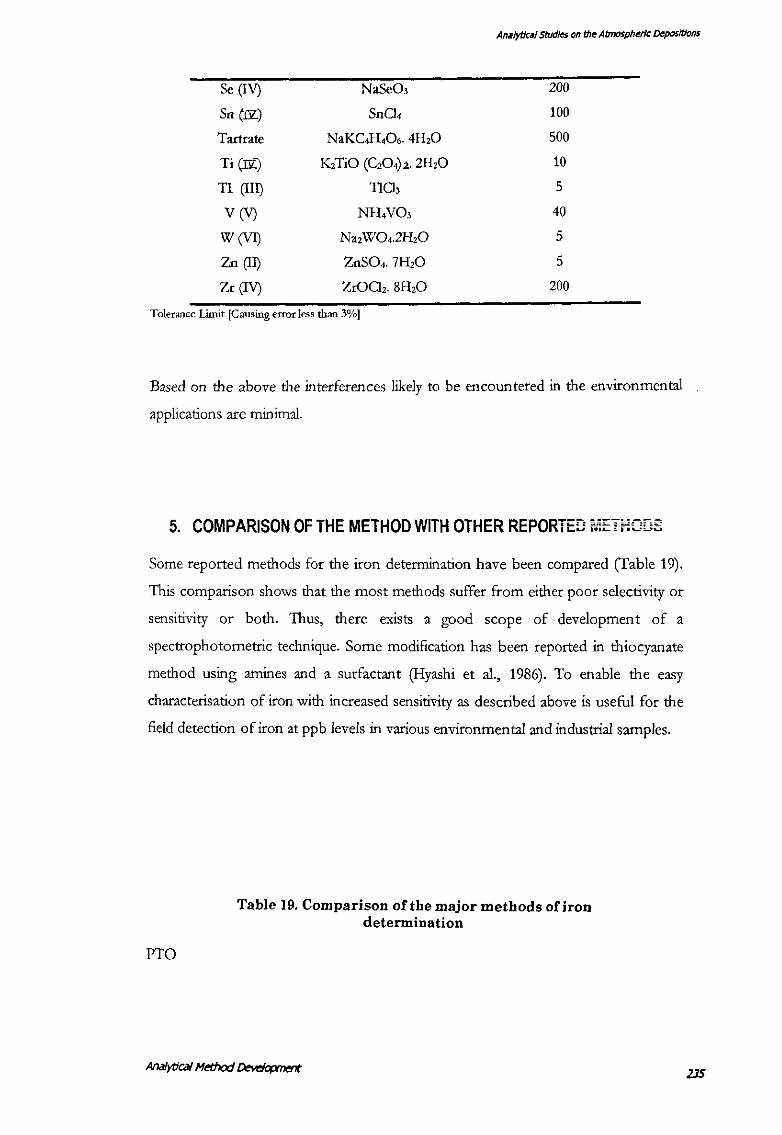
Sc (IV) NaScO, 200
So (N.) SnCJ, 100
Tartrate NaKC,JI,O,. 4H,O 500
Ti (li) K,TiO (C,0,).2. 2H,O 10
Tl (III) TICh 5
V(V) NH.VO, 40
W(VI) Na,wo,.2H,O 5
Zn (II) ZoSO,. 7H,O 5
Zr (IV) ZrOCJ,. 8H,O 200
T olenmce Limit [Causing erro:r less than 3%]
Based on the above the interferences likely to be encountered in the environmental
applications are minimal.
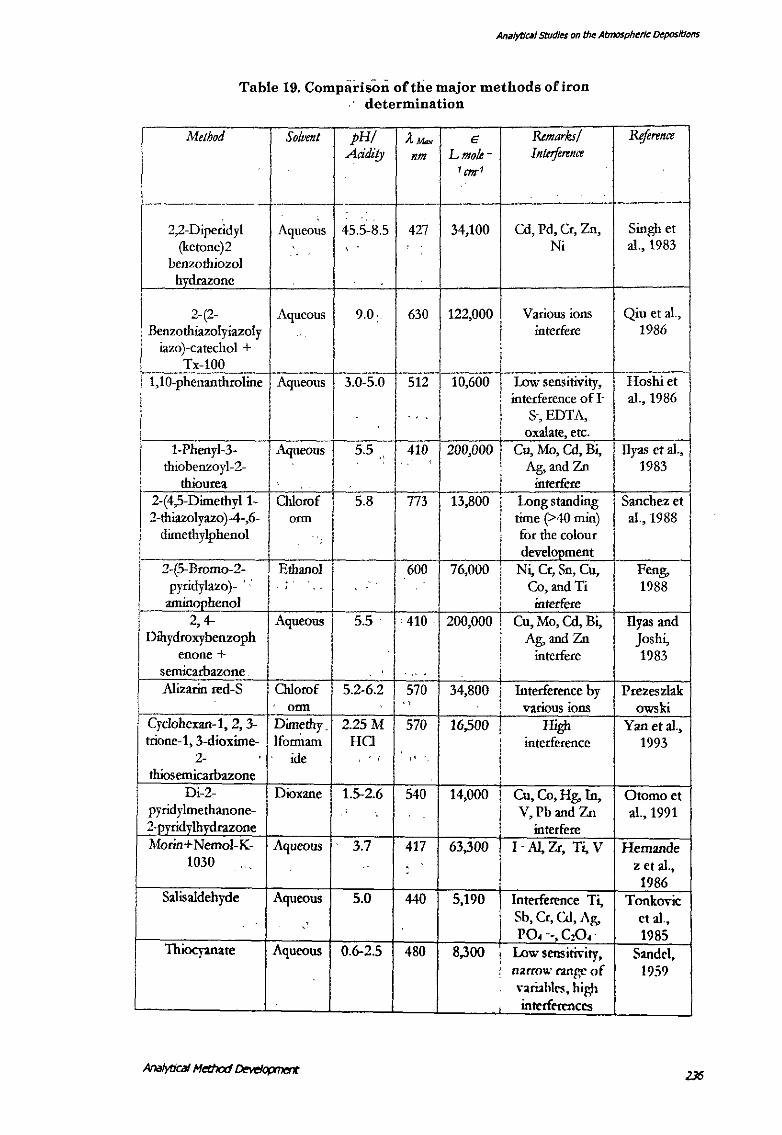
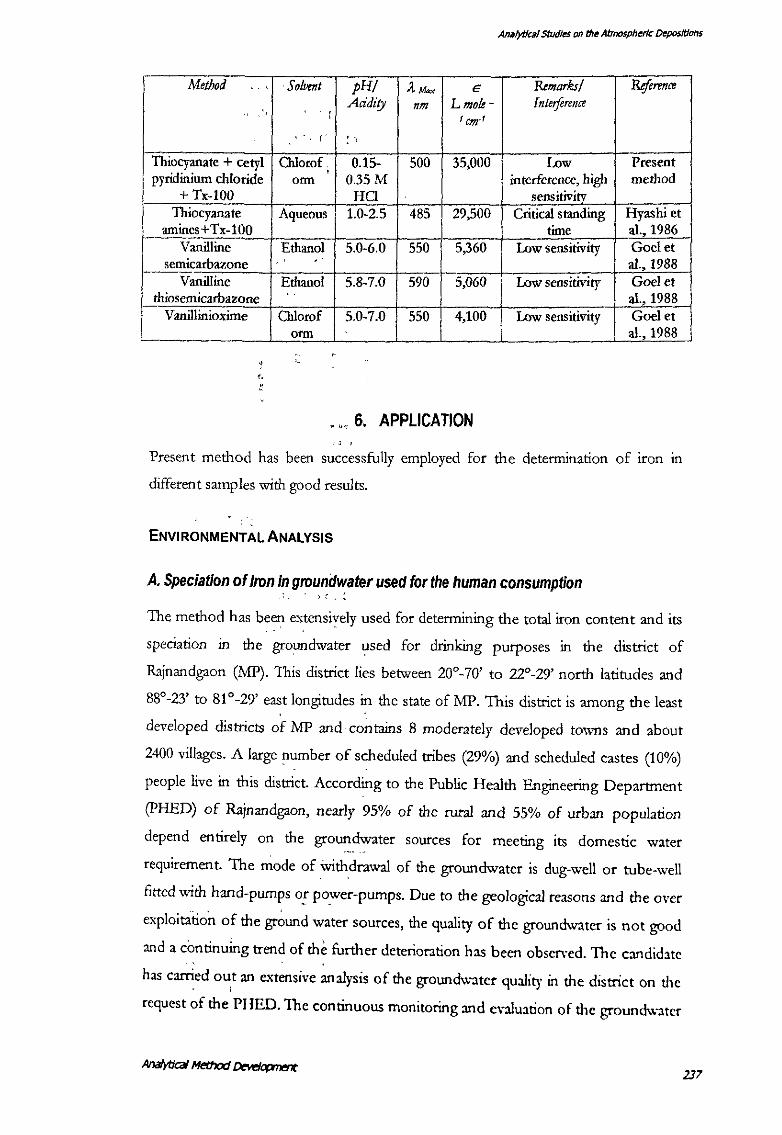
5. COMPARISON OF THE METHOD WITH OTHER REPORTED METHODS
Some reported methods for the iron determination have been compared (Table 19).
This comparison shows that the most methods suffer from either poor selectivity or
sensitivity or both. Thus, there exists a good scope of development of a
spectrophotometric technique. Some modification has been reported in thiocyanate
method using amines and a surfactant (Hyashi et al., 1986). To enable the easy
characterisation of iron with increased sensitivity as described above is useful for the
field detection of iron at ppb levels in various environmental and industrial samples.
PTO
Table 19. Comparison of the major methods of iron determination
Analytlal5t1ldles on the Atmospheric Depositions
Method
Table 19. Comparison oftlie major methods of iron . · determination
Solvent pH/ Addity
A,....., €!
nm Lmo!e-' em-'
Remarks/ lnterfennce
Reference
----·- -----------· ·- ------- ------- ------- f-----~----:- -----
2,2-Diperidyl (ketone)2
benzothiozol hvdrazone
Aqueous '
.. 45.5-8.5 ' ..
427 34,100 Cd, Pd, Cr, Zn, Ni
2-(2- Aqueous 9.0. 630 122,000 j Various ions Benzothiazolyiazoly I interfere
Siogh et a!., 1983
Qiu eta!., 1986
1
: iazo)-catechol + / I
'T10-p~~~~~rol~"f/, -Aq~~ou5;-3.0-5.0TSi2"1o,600 l -~ sensiti~iti,-+-H:oshi et 'I I j mterference ofi- j aL, 1986
I, .
1
_ . . .. : s-, EDT A, 1 : 1 · i oxalate, etc.
I 1-Phenyl-3- I Aqueous ! 5.5 " 410 ./200,000 1 Cu, Mo, Cd, Bi, ,1• Dyas eta!.,
thiobenzoyl-2- I · j · - ' ' Ag, and Zn , 1983 I thiourea I · i 1 interfere i
I' 2-(4,5-Dimethyl1- Chlorof 1 5.8 773 13,800 ! Long standing II Sanchez et
2-thiazolyazo)-4-,6- orm 'I ~- j time (>40 min) a!., 1988
I' dimethylphenol
1 for the colour j
I .. i development
r 2, 4- Aqueous I 5.5 ' 410 . 200,000 ! Cu, Mo, Cd, Bi, 1 Dihydroxybenwph I I I Ag, and Zn 1 enone + , · interfere [ semicarbazone . i I · , . .. i
Alizarin red-S I ?;::r / 5.2-6.2 . ~70 34,800 1 various ions
Interference by
1 Cyclohexan-1, 2, 3-l' Dimethy.. 2.25 M 570 16,500 T tcione-1, 3-dioxime- . !formam HO ' interference
-2- ide '( ,, I thiosemicarbazone
Di-2-pyridylmethanone-2-pvridvlhvdrazone Mocin+Nemol-K-
1030
Salis aldehyde
Thiocyanate
Dioxane 1.5-2.6
Aqueous 3.7
Aqueous 5.0
Aqueous 0.6-2.5
540
417
440
480
i '
14,000 !
I Cu, Co, Hg, In, V,Pband Zn
interfere 63,300 I I -AI, Zc, Ti, V
! 5,190 Interference Ti,
Sb, Cr, C..d, Ag, PO, ---, C,O,-
8,300 l Low sensi!Wity, ' narrow r:u•gc of
nriabt,.,., high , interferences
llyas and Joshi, 1983
Prezeszlak owski
Yan et al, 1993
Otomoet al., 1991
Hemande Z Ct aJ., 1986
Tonkovic et a!., 1985
Sandel, 1959
-
'
AM/ytiCHI stvdJes 011 th~ Atmosph~rlc Depositions
Metbod .. ' Solvent pH/ llu.x t Rtmarks/ Reference Acidity nm Lmole- Interference
' '' 1 cnr1 ' '- ,- : )
Thiocyanate + cetyl Chlorof. 0.15- 500 35,000 Low Present ' interference, high method pyridinium chloride orm 0.35M
+ Tx-100 HO sensitiv_ity_ Thiocyanate Aqueous 1.0-2.5 485 29,500 Critical standing Hyashi et
amincs+Tx-100 time a!., 1986 Vanilline Ethanol 5.0-6.0 550 5,360 I Low sensitivity Goelet
semicarbazone .. al., 1988 -Vanilline Ethanol 5.8-7.0 590 5,060
I Low seasitivity I Goel et
thiosemicarbazone a!., 1988 V anillinioxime Chlorof 5.0-7.0 550 4,100 ! Low sensitivity Goel et
orm j al., 1988
'·
",, 6. APPLICATION ,,: '
Present method has been successfully employed for the determination of iron in
different samples with good results.
ENVIRONMENTAL ANALYSIS
A. Speciation of Iron in groundwater used for the human consumption . ) ( . :
The method has bee~ extensively used for determining the total iron content and its . -
speciation in the groundwater used for drinking purposes in the district of
Rajnandgaon (MP). This district lies between 20°-70' to 22°-29' north latitudes and
88° -23' to 81° -29' east longitudes in the state of MP. This district is among the least
developed districts of MP and contains 8 moderately developed towns and about
2400 villages. A large number of scheduled tribes (29%) and scheduled castes (10%)
people live in this clistrict. According to the Public Health Engineering Department
(PHED) of Rajnandgaon, nearly 95% of the rural and 55% of urban population
depend entirely on the groundwater sources for meeting its domestic water
requirement. The mode of withdrawal of the groundwater is dug-well or tube-well
fitted with hand-pumps or power-pumps. Due to the geological reasons and the over
exploitition of the gr~und water sources, the quality of the groundwater is not good
and a continuing trend of the further deterioration has been observed. The candidate - . .
has carried out an extensive analysis of the groundwater quality in the district on the - '
request of the PHED. 1be continuous monitoring and evaluation of the groumhvater
2]7
Ana/ytJcJ! studies on the Atmospheric fkpos/tJons
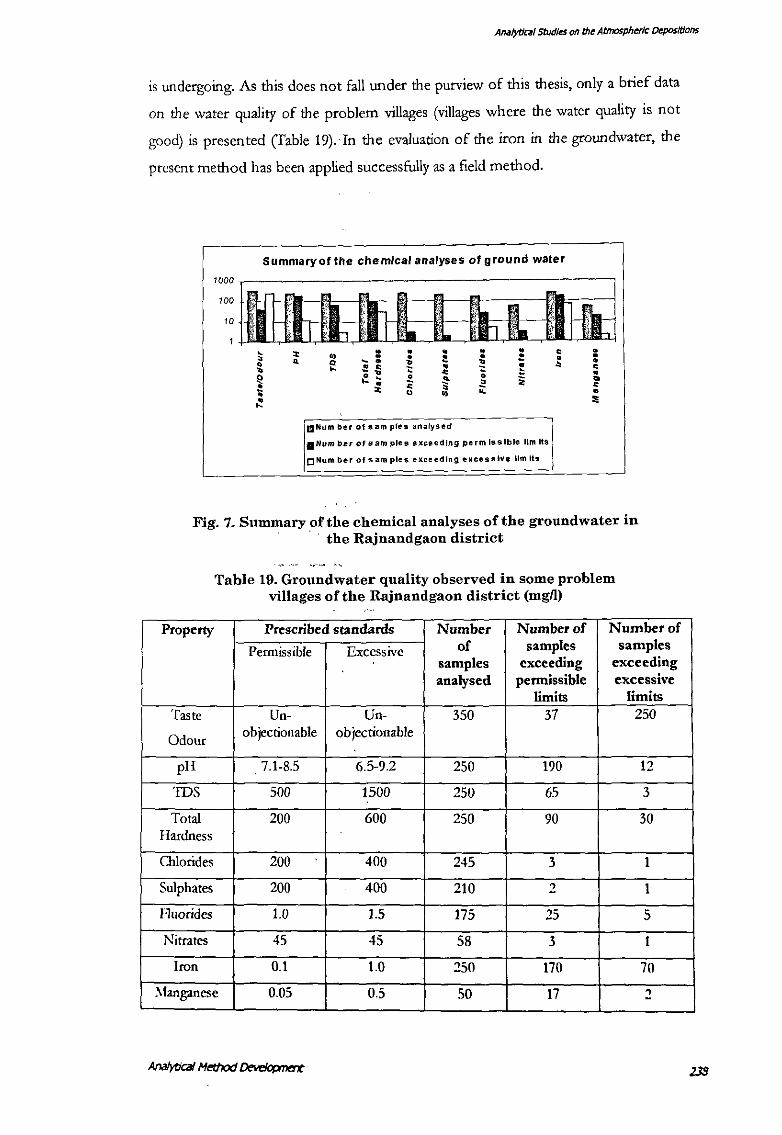
is undergoing. As this does not fall under the purview of this thesis, only a brief data
on the water quality of the problem villages (villages where the water quality is not
good) is presented (fable 19).·In the evaluation of the iron in the groundwater, the
present method has been applied successfully as a field method.
Summary of the chemical analyses of ground water
1000
100 i•- ' ' '" .. ~liDJ 1 };: ! ;~ }; :~ t, r : < ',·
' ~ • • ~
" ll • 1; <!
" : • • • • • ~ • :: Q ~ • " " ... :! {i ~ • ~ •
• • .. • ::: ... - ~ ;;; • :;; • ~ u "
;;:
mNum ber of sam pies analysed
•Num ber of sam pies exceeding perm Iss lble lim Its
0 Number of sam pies exce edlng excess lve lim Its
• • • • • ~ • • .. • • :!!
Fig. 7. Summary of the chemical analyses of the groundwater in · the Rajnandgaon district
Table 19. Groundwater quality observed in some problem villages of the Rajnandgaon district (mgn)
Property Prescribed standards Number Number of Number of
Permissible Excessive of samples samples samples exceeding exceeding analysed permissible excessive
limits limits Taste Un- Un- 350 37 250
Odour objectionable objectionable
pH 7.1-8.5 6.5-9.2 250 190 12
IDS 500 1500 250 65 3
Total 200 600 250 90 30 Hardness
Chlorides zoo 400 245 3 1
Sulphates 200 400 210 2 1
f·luorides 1.0 1.5 175 25 5
Nitrates 45 45 58 3 I
Iron 0.1 1.0 250 170 70
:\!anganese 0.05 0.5 50 17 ~
Analytical studies on the Atmosph~rlc Depositions
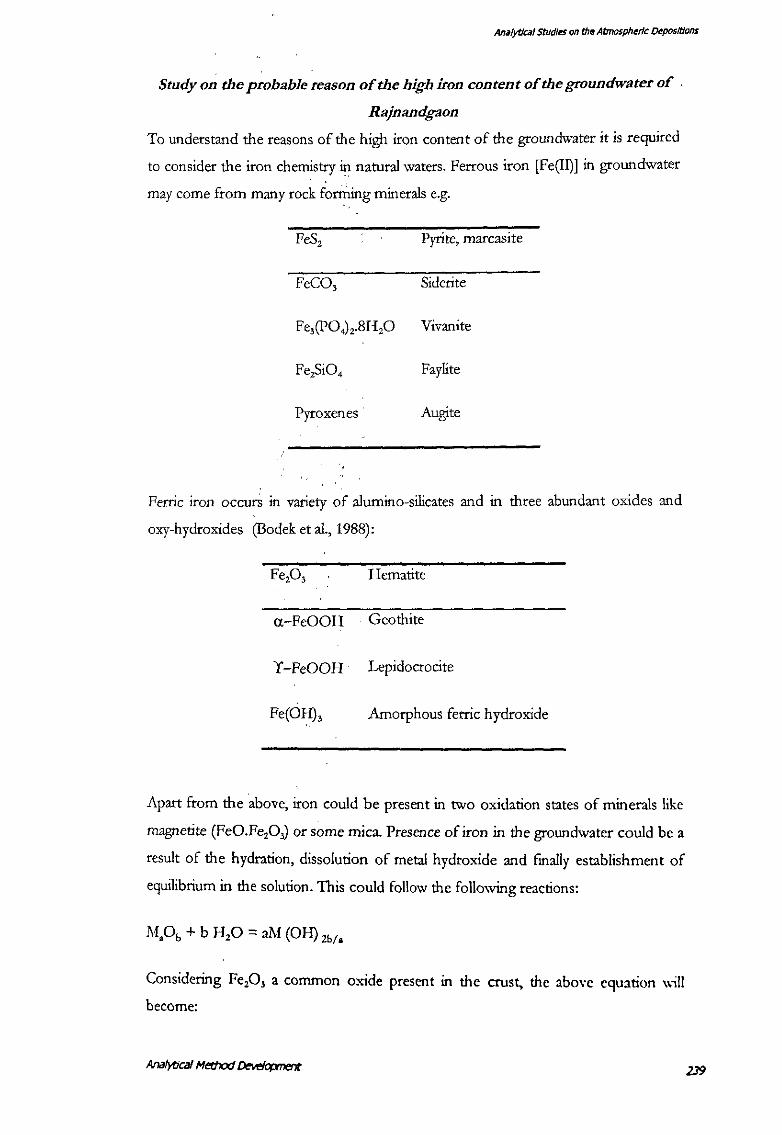
Study on the probable reason of the high iron content of the groundwater of ·
Rajnandgaon
To understand the reasons of the high iron content of the groundwater it is required
to consider the iron chemistry in natural waters. Ferrous iron [Fe(II)] in groundwater
may come from many rock forming minerals e.g.
l'yrite, marcasite
FeCO, Siderite
Vivanite
Faylite
Pyroxenes· Augite
Ferric iron occurs in variety of alumino-silicates and in three abundant oxides and
oxy-hydroxides (Bodek et al., 1988):
Fe,O, Hematite
a-FeOOH · Geothite
Y -FeOOH Lepidocrocite
Fe(OH), Amorphous ferric hydroxide
Apart from the above, iron could be present in two oxidation states of minerals like
magnetite (FeO.Fe20,) or some mica. Presence of iron in the groundwater could be a
result of the hydration, dissolution of metal hydroxide and fmally establishment of
eguilibrium in the solution. This could follow the following reactions:
M.Ob + b H20 = aM (OH) Zbta
Considering Fe20 3 a common oxide present in the crust, the aboYe equation \\ill
become:
Analytical studies on th~ Atmospheric ~posltlons
Fe20, + 3 H,O = 2Fe(OH),
Fe(OH), +3H+ = Fe'++ 3H20
Fe(OH), + 2H+ = Fe(OH)+' +2H20
Fe(OH), + H+ = Fe(OH)/ + H,O
Fe(OH), + OR = Fe(OH)4-
The above equations make it clear that the dissolution and the speciation of iron in
the water are dependent on the presen~e of the hydrogen or hydroxyl ion. Thus, the
pH of the water can be expected to play a very important role in the speciation.
Stumm et al. (1981) have shown that the concentration of dissolved metal as a
function of the pH is high in acidic medium, goes through a minimum in slightly
acidic to slightly alkaline medium and increases again in the acidic medium. In acidic
medium positively charged ferric iron Fe3+ is the dominant species and in alkaline
medium the negatively charged Fe(OH) 4- is the dominant species.
The water samples collected from Rajnandgaon were slightly alkaline to alkaline in
nature. At such pH the most abundant species to consider will be as follows:
Fe(II): Fe'+, FeOH+, Fe(OH)2°
Fe(III): Fe'+, FeOH+, Fe(OH)/, Fe(OH)4-
However, on contact with the atmospheric oxygen the Fe(II) tends to oxidise,
resulting ultimately in the formation of colloidal Fe20 3 in the water.
Method of the speciation of iron in the groundwater
DETERMINATION OF THE PARTICULATE (INSOLUBLE) IRON
Freshly pumped water was filtered through Whatman filter paper-42 (pore size 0.45
Jlm). The filter paper was digested with aqua regia and then heated to dryness. The
residue was dissolved in 0.1-M HCl and diluted to 25-ml. Rest was done as in the
determination procedure.
DETERMINATION OF IRON(III)
Thirty ml of filtered water sample was taken in a 125-ml separatory funnel and the
estimation of tot:Jl iron was done using the HCl, thiocyanate, and surfactants mix of
Am/ytlc.rl stvdles on th~ Atmospheric Depositions
CPC & Tx-100 as gtven 1n the procedure without the addition of potassium
dichromate. Thus, no oxidant was used for converting the Fe(!!) to Fe(III) oxidation
state.
DETERMINATION OF TOTAL IRON,
Total iron was determined in the similar procedure along with the addition of 1 ml of
potassium dichromate for the oxidation of Fe(II) to Fe(III) state. Difference in the
two values gave the concentration of Fe(II). The efficacy of the method was
determined by carrying out the AAS determination as described in the procedure,
with one modification that the filtered sample was treated with 5-ml of 0.1% (w/v)
ascorbic acid before the aspiration to find out the total soluble iron. Insoluble iron
was determined in the dissolved particulate phase. Result of one such determination
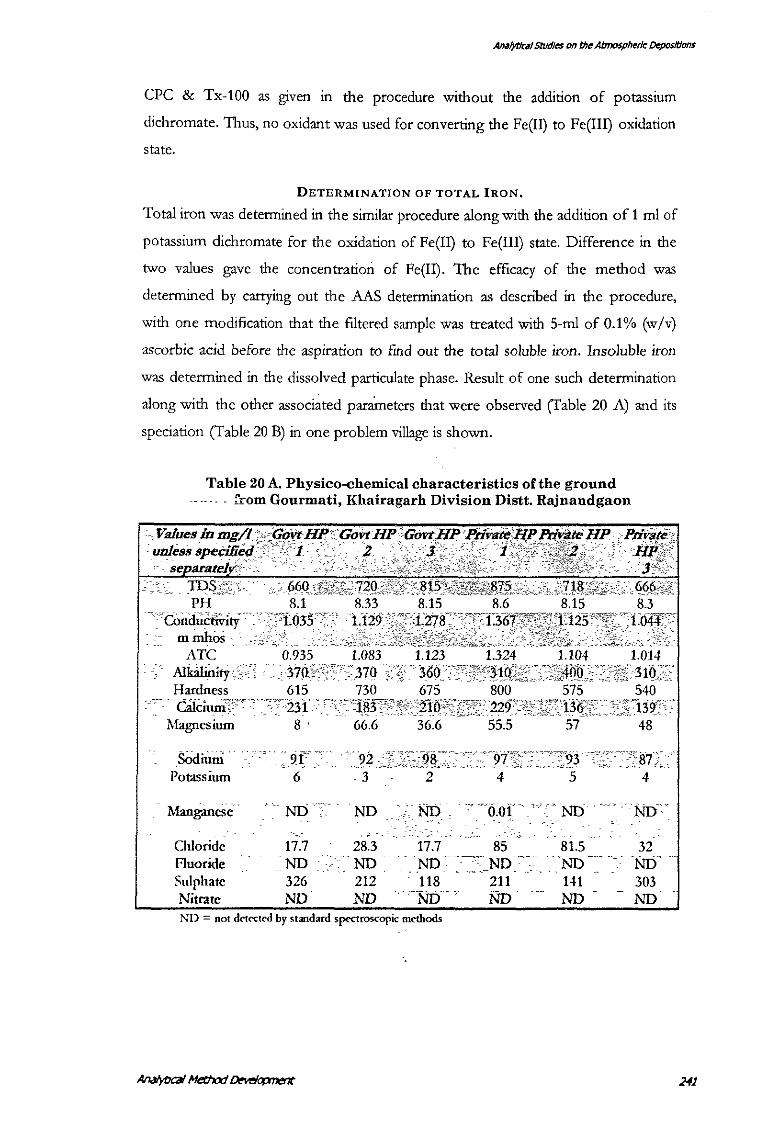
along with the other associated parameters that were observed (Table 20 A) and its
speciation (Table 20 B) in one problem village is shown.
Table 20 A. Physico-chemical characteristics of the ground -- --:- - f.-om Gourmati, Khairagarh Division Distt. Rajnandgaon
PH - "tofii:IUCfiV1ti
mmhos- • ::•~?-ATC
Allciliniij; ~-·; Hardness 615 730 675 800 575
-- - ca!Ciurii'-"' c ~'7231 : r -, ::--c~~31f:'~"''171'Q'i?f~I~: 2z~Y~W'il~T:':~13~~\'. Magnesium 8 · 66.6 36.6 555 57
SO<Iillffi -Potassium
9F- ~_?ZJ !i';;~~E- _·"- --:97'"~:-: --- ·,''93 = ,: - :·)7 : 6 3 2 4 5 4
-- Manganese -
Chloride Fluoride Sulphate Nitrate
17.7 ND 326 ND
28.3 ND-212 ND
17.7 85 -Nb ---~:~_No~: ll8 21l
--ND ND-!'-:D = not d<'t<'Ct("d by standard spectroscopic methods
81.5 'ND --141 ND
32 ND 303 ND
241
Analytical studies on th~ Atmosph~rlc lkposltlons
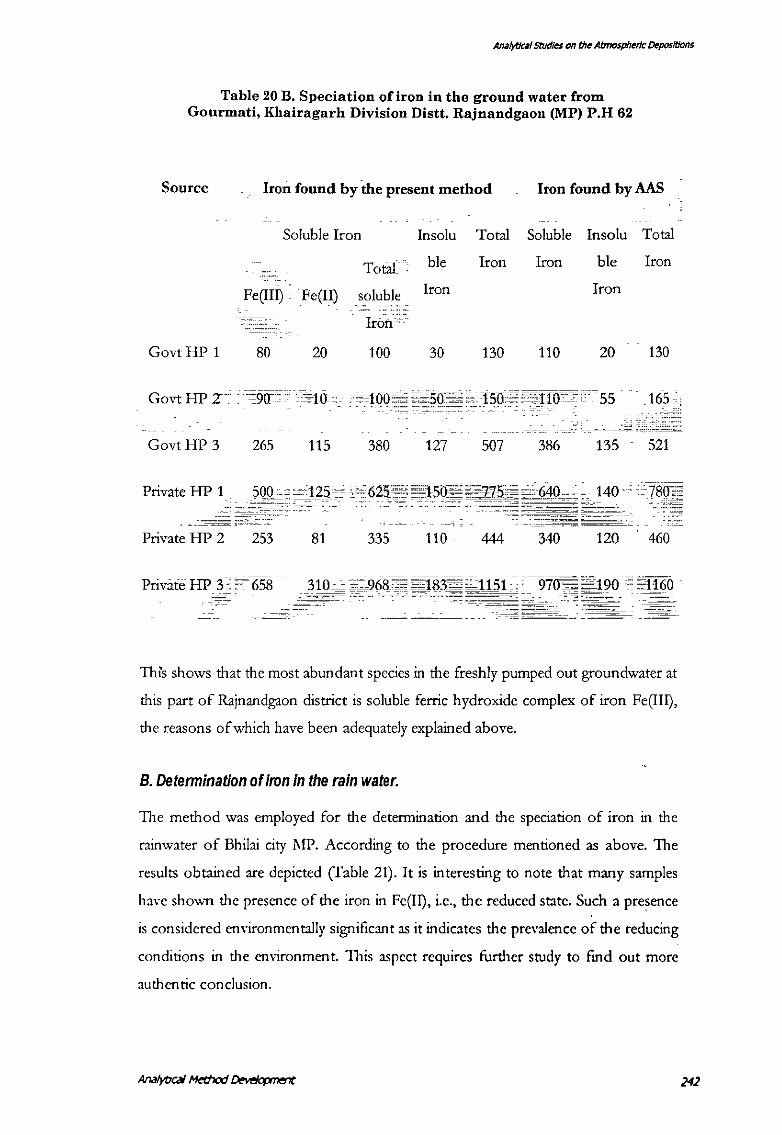
Table 20 B. Speciation of iron in the ground water from Gourmati, Khairagarh Division Distt. Rajnandgaon (MP) P.H 62
Source Iron found by the present method Iron found by AAS
Soluble Iron . Insolu Total Soluble Insolu Total
Total· ble Iron Iron ble Iron
Fe(III) ·. Fe{Il) soluble Iron Iron - -'"-' -" '-""-
Iron .,
GovtHP 1 80 20 100 30 130 110 20 130
GovtHP 3 265 115 380 127 507 386 135 521
Private HP 1 .
---------- --
Private HP 2 253 81 335 110 444 340 120 460
Private HP 3 · ~~· 658
--- -~ ~--~------
Th1s shows that the most abundant species in the freshly pumped out groundwater at
this part of Rajnandgaon district is soluble ferric hydroxide complex of iron Fe(III),
the reasons of which have been adequately explained above.
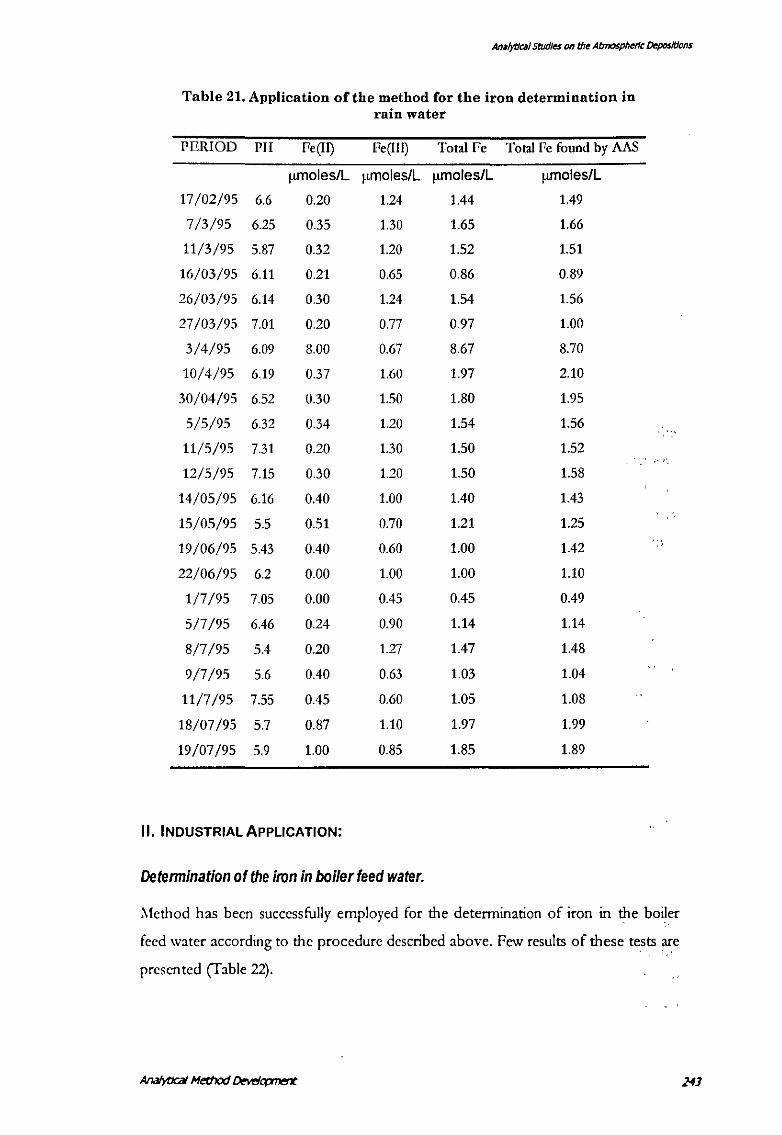
B. Determination of iron in the rain water.
The method was employed for the determination and the speciation of iron in the
rainwater of Bhilai city l\fP. According to the procedure mentioned as above. The
results obtained are depicted (Table 21). It is interesting to note that many samples
have shO\vn the presence of the iron in Fe(II), i.e., the reduced state. Such a presence
is considered environmentally significant as it indicates the prevalence of the reducing
conditions in the cm;ronment. This aspect requires further study to find out more
au then tic conclusion.
242
Ana/ytlal studies on th~ Atmosph~rlc ~posJtlons
Table 21. Application of the method for the iron determination in rain water
PERIOD PH Pe(ll) Fe (Ill) Total Pe Total Fe found by AAS
f!moles/L f!moles/L f!moles/L f!moles/L
17/02/95 6.6 0.20 1.24 1.44 1.49
7/3/95 6.25 0.35 1.30 1.65 1.66
11/3/95 5.87 0.32 1.20 1.52 1.51
16/03/95 6.11 0.21 0.65 0.86 0.89
26/03/95 6.14 0.30 1.24 1.54 1.56
27/03/95 7.01 0.20 0.77 0.97 1.00
3/4/95 6.09 8.00 0.67 8.67 8.70
10/4/95 6.19 0.37 1.60 1.97 2.10
30/04/95 6.52 0.30 1.50 1.80 1.95
5/5/95 6.32 0.34 1.20 1.54 1.56
11/5/95 7.31 0.20 1.30 1.50 1.52 - _, ,, ··.
12/5/95 7.15 0.30 1.20 1.50 1.58
14/05/95 6.16 0.40 1.00 1.40 1.43
15/05/95 5.5 0.51 0.70 1.21 1.25
19/06/95 5.43 0.40 0.60 1.00 1.42 ·'
22/06/95 6.2 0.00 1.00 1.00 1.10
1/7/95 7.05 0.00 0.45 0.45 0.49
5/7/95 6.46 0.24 0.90 1.14 1.14
8/7/95 5.4 0.20 1.27 1.47 1.48
9/7/95 5.6 0.40 0.63 1.03 1.04
11/7/95 7.55 0.45 0.60 1.05 1.08
18/07/95 5.7 0.87 1.10 1.97 1.99
19/07/95 5.9 1.00 0.85 1.85 1.89
II. INDUSTRIALAPPLICATION:
Determination of the iron in boiler feed water.
~lethod has been successfully employed for the determination of iron in the boiler
feed water according to the procedure described above. Few results of these tests are • I '
presented (fable 22).
A/13/ytkl/ studies on th~ Atmosph~ ~positions
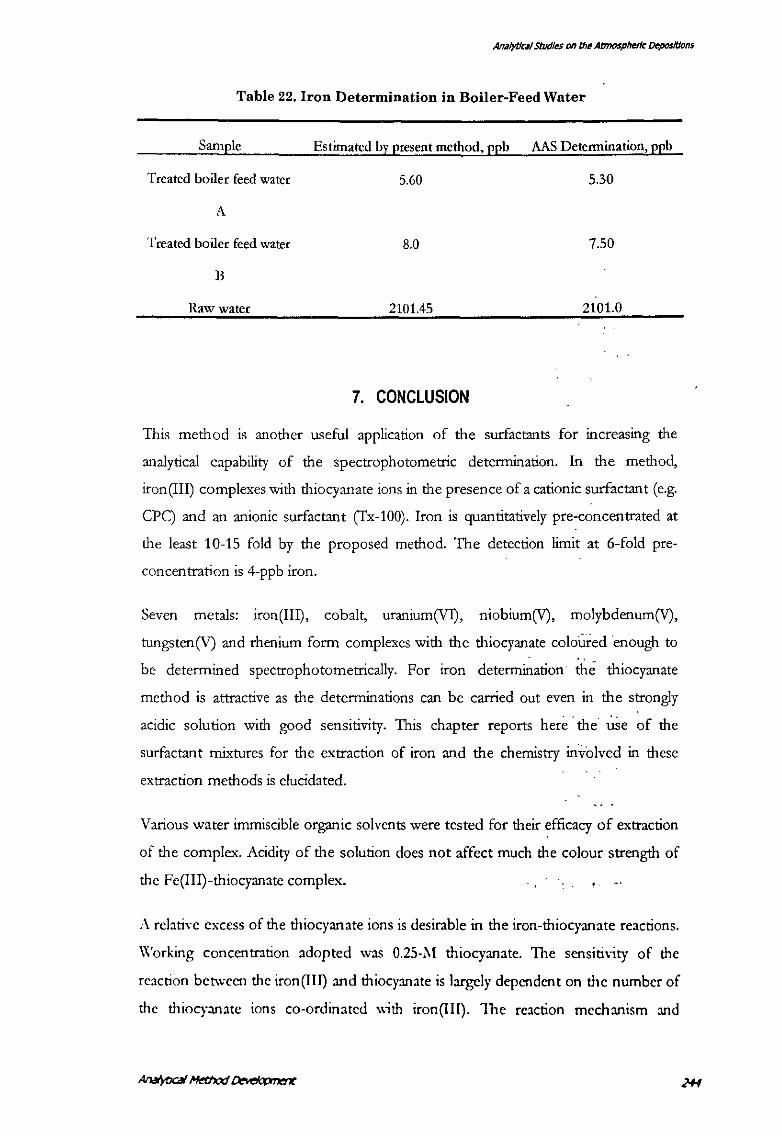
Table 22. Iron Determination in Boiler-Feed Water
Sample Estimated by present method, ppb AAS Determination, ppb
Treated boiler feed water 5.60 5.30
A
Treated boiler feed water 8.0 7.50
B
Raw water 2101.45 2101.0
7. CONCLUSION
This method is another useful application of the surfactants for increasing the
analytical capability of the spectrophotometric determination. In the method,
iron(III) complexes with thiocyanate ions in the presence of a cationic surfactant (e.g.
CPC) and an anionic surfactant (Tx-100). Iron is quantitatively pre-concentrated at
the least 10-15 fold by the proposed method. The detection limit at 6-fold pre
concentration is 4-ppb iron.
Seven metals: iron(III), cobalt, uranium(VI), niobium(V), molybdenum(V),
tungsten(V) and rhenium form complexes with the thiocyanate coloured enough to
be determined spectrophotometrically. For iron determination the thiocyanate
method is attractive as the determinations can be carried out even in the strongly
acidic solution with good sensitivity. This chapter reports here· the ~se of the
surfactant mixtures for the extraction of iron and the chemistry in:Volved in these
extraction methods is elucidated.
Various water immiscible organic solvents were tested for their efficacy of extraction
of the complex. Acidity of the solution does not affect much the colour strength of
the Fe(III)-thiocyanate complex.
A rebtive excess of the thiocyanate ions is desirable in the iron-thiocyanate reactions.
\\'orking concentration adopted was 0.25-i\1 thiocyanate. The sensiti\ity of the
reaction between the iron(III) and thiocyanate is largely dependent on the numbcr of
the thiocyanate ions co-ordinated "ith iron(III). The reaction mechanism and
composition of the iron(III)-thiocyanate complex in the presence of the surfactant
mixture is elucidated. This composition is compared with other reported complexes
to describe the chemistry of the iron complexation.
Iron(III) can form a variety of complexes depending on the number of the
thiocyanate ions co-ordinated with the Fe(III). At low thiocyanate ion concentrations
iron(III) forms [Fe (SCN)] 2+ predominantly. At 0.1 M concentration of thiocyanate
the resulting complex is mainly [Fe (CNS),f. In the present investigation, the
thiocyanate concentration was 0.27 M, which should favour the formation of
negatively charged iron(III)-thiocyanate complex, stabilised by the cationic surfactant.
The anionic surfactant or amides help in the quantitative extraction of the complex
leading to higher extraction efficiency and the molar absorptivity. This reaction
mechanism is theoretically sound, is supported by the practical evidences, and thus
beautifully explains the chemistry of the iron(III) determinations by thiocyanate
method involving the surfactants or other organic reagents.
Ions commonly associated with iron in the natural waters were tolerable in the
method under the optimised conditions established. Presence of the reducing agents
viz. tin chloride, ascorbic acid oxalic acid etc. obviously interfered with the iron
determination by converting the Fe(III) into the Fe(II).
Some reported methods for the iron determination have been compared. The
present method is simple, sensitive and adaptable for the field use. The method has
been successfully employed for the determination of iron in different samples with
good results for the speciation of the iron in the groundwater used for human
consumption. The method is also used for the determination of iron in rainwater and
its speciation. The determination of total iron in the boiler feed water is also carried
out with satisfactory results. Method could be applied directly to the determination of
iron in environmental samples and boiler feed water where very low concentrations
are required to be determined. There is a scope to study the effects of other reagents
in conjunction with the thiocyanate. However, the chemistry of thos~ reactions may
be similar to the one established here.
AMiytk•l stud/ .. on lh• Atmosphorlc O.pos/t/ons
8. REFERENCES
Anderson, M.A. and Morel, M.M.: 1982,
Umnof. Oceanogr., 27, 789.
Babko, A.K.: 1946, ]. Gen. Chm. (Russian),
16, 1549: 1947, Chem. Abstr., 41,
4732,
Battiston, G.A., Gerbasi, R., Degetto, S.
and Sbrignadello, G.: 1993, Spectrv
Chim. Acta, 48B, 217.
Beyer, M.E., Bond, A.M. and McLaughlin,
R.J. M.: 1915,AnaL Chem., 47,479.
Bodek 1., Lyman W.J., Reehl W.F. and
Rosenblatt D.H.: 1988, Environmental
Inorganic Chemistry, Pergamon Press,
New York.
Burguera, J.L. and Burguera , M.: 1984,
AnaL Chim. Acta, 161, 375.
Carrion, N ., Itriago, A., Murillo, M.,
Eljuri, E., and Fernandez, A.: 1994,].
Anal. At. Spectrom., 9, 205.
Chandrawanshi, S.: 1997, SpectropholtJmetnc
determination and Speciation of Iron, In
Ph. D. Thesis, Pt. R. S. Shukla
University, Raipur.
Cox, J.A and Al-Shakshir, S.: 1988, AnaL
l..ttt., 21, 1757.
Cmuthamrl, C.E. and Johnson, C.E.:
1952, AnaL Cl>em., 24, 1780.
Crouthamel, C.E. and Johnson, C.E.:
1954,Anal. Chem., 26, 1284.
Dixon, P.R., Perrin, R.E., Rokop, D.J.,
Maeck, R, Jenecky, D.R., and Banar,
J.P.: 1993,Anaf. Chem., 65,2125.
Drever J.I.: 1982, Geochemistry of Natural
Watm, Prentice-Hall Englewood
CliffS, New Jersey.
Elejalde, C., Romero, F., Ruiz, E. and
Gomez, G.: 1992, Toxicof. Environ.
Chem., 37, 49.
Feng,J.L.Y.: 1988, Huaxue Xuebao, 9, 407,
In Anal. Abstt.: 1988, 12, B181.
Goel, D.P., Gupta, S.S. and Banerjee,
R.N.: 1988,]. Ind. Chem. Soc., 65, 607.
Gorm, H., Catherine, C., Alain, B.C.M.
and Thomas, C.H.: 1994, Environ. Sci.
Techno!., 28, 1698.
Hernandez, H.F., E Medina,. J. and
Martin, S.R.: 1986, Ana!Jst, 111,
1045.
Home R.A.; 1978: The Chemistry of Our
Emironment, John Wiley and Sons,
New York.
Hoshi, S., Yamada, .\f., Inoue, S. and
.\!alsubara, M.: 1989, Ta!dnta, 36,
606.
Hyashi, K., Sasaki, Y., Taqashira, S.,
Soma, Ichinose, Y.T. and Akiyama,
II.: 1986, AnaL Sci., 2, 457.
Ilyas, S.Q.R. and Joshi, A.P.: 1983, Mikro
Chim. Acta, III, 271.
Ilyas, S.Q.R. and Joshi, A.P.: 1983, Mikro.
Chim. Acta., III, 271.
Kahata-Pendias A. and Pendias H.: 1984,
Trace Elements in Soils and plants, CRC
Press, Boca Raton, London.
Kennedy, CD.: 1990,Anabst, 115, 1067.
Khalid R.A., Gambrell R.P., Verloo M.G.,
Patrie W.H. Jr., 1977: Transformations
of Heary Metals and Plant Nutn'ents in
Dredged Sediments as A/focted f?y
Oxidation Reduction Potential and pH,
U. S. Army Contract No. DACW39-
74-0076.
Lewin S.Z. and Seider, R.: 1955, f. Chem.
Educ. 30, 445.
Liu, R.M., Liu, D.J., Sun, A.L.: 1992,
Anabst, 117, 1767.
Oehme, F.W. (Ed.): 1973, Toxicity of Heaty
Metals in the Environment, Part 2,
Marcel Dekker, J..:ew York.
Otomo, .\!., Taya, T., Doi, K. and Umeda,
C: 1991,AnaL Sa., 7, 383.
An.Jiytic61 stvdl .. on the Atmosphetlc Deposition$
Pandey, P.K., Chandrawanshi, S. and
Patel, K.S.:1997, Mikro. Chim. Acta,
under consideration
Parry, E.P. and Anderson, D.P.: 1973,
AnaL Chem., 45, 458.
Patel, K.S.: 1979, Studies on Ffydro>ry
Amidine and their Application in
Inorganic Anabsis, Ph.D. Thesis,
Ravishankar Shukla University
Raipur.
Patel, K.S., Deb, K.K. and Mishra, R.K.:
1979,]. ChineseChem. Soc., 26, 79.
Prezeszlakowski, S.: 1988, Chem. AnaL,
617, 33.
Qiu, X. and Zhu, Y.: 1986, AnaL Chem.,
26, 19.
Sanchez M.J., Somtana, B., Pena, J.L. and
Montelongo F.J.G.: 1988, Anal. Lett.,
21,2345.
Sandel, E.B.: 1959, Colorimetn'c
Determination of Traces of Metals,
Interscience, New York, 3rd Ed.
Senior, A.T. and J. D. Glennon: 1987,
AnaL Chim. Acta, 196, 333.
Sillen, L.G.: 1956, Act.z. Chem. Scan., 10,
185.
Singh, R. B., Odashima, T., Ishii, H.:
1983, Anafyst, 108, 1120.
Stumm W. and Morgan J.J.: 1981, Aquatic
chemistry, 2nd ed. Wiley-Interscience,
New York.
Tadros Th.F. (Ed.): 1989, Surfactants,
Academic Press London.
Tonkovic, M. and Hadzija, 0.: 1985,
Mikrochim. Acta., III, 133.
Viras L. G., Siskos P. A., and Stephanou
E.: 1987, Intern. ]. Environ. Anal.
Chem., 28, 71.
Vogel, A.I.: 1948, A Text Book of Practical
Organic Chemistry, Longmans, Green
and Co. London.
WHO (World Health Organisation): 1997,
The World Health Report, WHO,
Geneva.
\VHO-Euro, World Health Organisation
Regional Office for Europe: 1987,
Air Quality Guidelines for Europe,
European Series No. 23,
Copenhagen, Denmark.
Yan, Y., Ji, Z., and Huang, J.: 1993, Fenxi
Huaxue, 21, 49. 1993, Chem. Abstr.,
118, 60062.
Ana/ytJcdl Method Developmel7t
AnJ/ytlcJI studies on th~ Atmospheric ~positions
Zach, F.X., Bourrel, E.D., Bliss, D.,
Weber, E.R. and Haller, E.E.: 1994,
J. AnaL At. Spectrom., 9, 153.
Zhu, S.F., Wang, H. and Keliher, P.N.:
1988, Microchem. J., 38, 204.
Zhu, X., Prospera, J.M., Millero, F.J.,
Savoie, D.L., · Brass, G.W.: 1992,
Mar. Chem., 38, 91.
LIST OF PAPERS PUBLISHED/COMMUNICATED BY THE
CANDIDATE
1. "POLY AROMATIC HYDROCARBONS IN PROGRAM TEPUCE AREA". Published in
"Toxicology and Environmental Chemistry", the Netherlands, 1997, Volume 58,
Page 25. Copy enclosed.
2. "TRACE ELEMENTAL COMPOSITION OF ATMOSPHERIC PARTICULATE AT BH!LAI
IN CENTRAL-EAST INDIA". Accepted for publication in "TI1e Science of the Total
Environment", the United Kingdom, Volume and Page number awaited. Copy of the
first page of the galley proof enclosed.
3. "POLYCYCliC AROMATIC HYDROCARBONS: NEED FOR ASSESSMENT OF
HEALTH RISKS IN INDIA? STUDY OF AN URBAN INDUSTRIAL LOCATION".
Accepted for publication in "Environment Monitoring and Assessment'' The
Netherlands, MS number- EMAS 500. Letter of acceptance pending modifications,
enclosed.
_( .. )
4. "CONCENTRATION OF MERCURY AND OTHER HEAVY METALS IN CENTRAL
INDIA". Accepted for publication in the book "Mercury Contaminated Sites:
Characterization, Risk Assessment and Remediation" Ebingha;_k· R., Turner, R.
R., Lacerda, D., Vasiliev, 0., Salomons, W. (Eds.), Springer Environmental Science,
Springer Verlag Heidelberg, in press. Letter of acceptance enclosed.
5. "A SENSITIVE METHOD FOR QUICK DETEIThUNATION OF. IRON IN
ENVIRONMENTAL AND INDUSTRIAL SAMPLES". Communicated to the ":-.likro
Chemica c\cta" :\ustriJ, .\IS no. 97270.
6. "CHEMISTRY OF ATliiOSPHERIC PREOPITATION AT TWIN OTY OF BHILAI-0URG
IN CEr-..'TRAL-EAST INDIA". Communicated to the ".\tmospheric Fm·irnnmmt", the
Lntted f..:ingdnm.
OTHER PUBLICATIONS/PRESENTATIONS
1. "Pre-concentration and Determination of Certain Metal Content in Suspended
Particulates". Accepted for presentation in the 1997 Pittsburgh Conference, AtlJnta,
USA. Letter of acceptJncc enclosed.
2. ''Polycyclic Aromatic Hydrocarbons: Need for Assessment of Health Risks in
India? Study of an Urban Industrial Location." Accepted for oral presentation in
the 'International Conference on Industrial Pollution Jnd Control Technologies',
Hyderabad, 1997
3. "Field Detection and Determination of Iron in Atmospheric Particulate
Matter." Published in Proceedings of the Thirty-third Annual Convention of
Chemists, Coimbatore, 1996, ANAL(PP)-4.7, Page D-7.
4. "Polycyclic Aromatic Hydrocarbons in Czech Environment." Published in EPA
Peer Review Proceedings, Trest, tl1e Czech Republic.
:J. "Atmospheric Concentrations of Trace Elements in Urban Air of Central
India". Accepted for presentation in the "World Congress on Air Pollution m
Developing Countries" Costa Rica, South America.
6. "Polycyclic Aromatic Hydrocarbons in Central Indian Urban Air". Accepted
for presentation in the "World Congress on Air Pollution in Developing Countries"
Costa Rica, South America.
7. "Vegetation-Atmosphere Distribution of the PAH's" Presented in the National
Seminar on Persistent Organics in Food -Chain at Milovy, the Czech Republic (Sept
19-21 1994.)
8. "PAH's in Northern Bohemia Region"
Presented in tl1e National Seminar on Persistent Organics in l'ood -Chain at :\!ilo,-y,
tl1e Czech Republtc (Sept 19-21 1994.)
9. "Acidification of the Environment: An Analytical Review" Presented Jnd
publtshcd in the Proceedings of :\atioml Seminar on Ecology and Em·ironmcnt
Rl11b!, India, 1993.
I 0. "Sulphate Resistance of Cements" prcsm ted in the Slminar on the s:unc topiC
nrg:u1iscd by the lmtitutlnn of F.ngu1l-crs Bhibi, lndta, 19').).
ELSEVIER The Science of I he To! a I Emuonmcnl 00 (1998) 00-00
the Science of the Total Environment .. , .. ___ ... __ _
............ --... - ... -
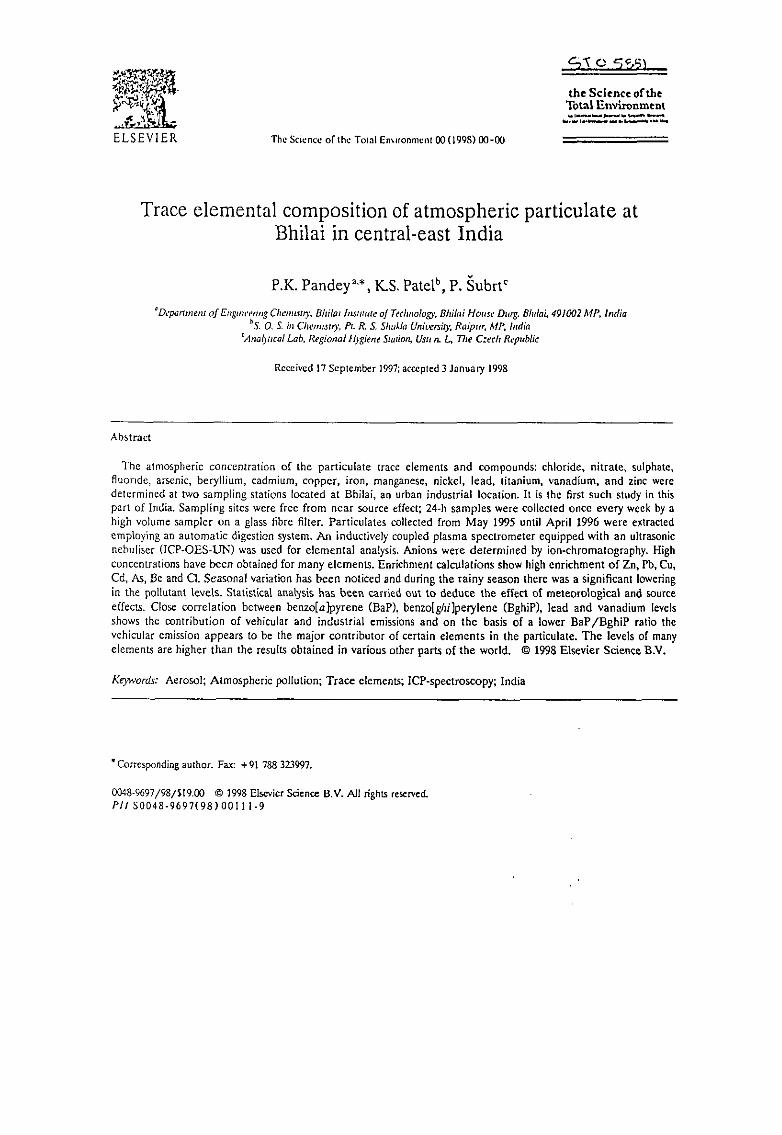
Trace elemental composition of atmospheric particulate at Bhilai in central-east India
Ab!.tract
P .K. Pandey'·*, K.S. Patel b, P. Subrt'
• Dt•parrment of Ensmt•enng Cht!ml511)', Bflilm /nsl/lute of TecJuwfo~·· Bhi/ai House Dwg. Blulai, 491002 MP, India ~S. 0. S. in Chem/S/t)', Pt. R. S. SlwJJa University, Raipur, MP, f11dia
cAnal)IICal Lab, Regional H_1giwe Station, Us11 n. L, TI1e C:ech Republic
Received 17 September 1997; accepted 3 J;muary 1998
The atmospheric concentration of the particulate trace elements and compounds: chloride~ nitrate, sulphate, fluonde, arsenic, beryllium, cadmium, copper, iron, manganese, nickel, lead, titanium, vanadium, and zinc were determined at two sampling stations located at Bhilai, an urban industrial location. It is the first such study in this part of India. Sampling sites were free from near source effect; 24·h samples were collected once every week by a high volume sampler on a glass fibre filter. Particulates collected from May 1995 until April 1996 were extracted employing an automatic digestion system. An inductively coupled plasma spectrometer equipped with an ultrasonic nebuliser (ICP·OES·UN) was used for elemental analysis. Anions were determined by ion·chromatography. High concentrations have been obtained for many elements. Enrichment calculations show high enrichment of Zn, Pb, Cu, Cd, As, Be and Cl. Seasonal variation has been noticed and during the rainy season there was a significant lowering in the pollutant \evets. Statistical analysis has been carried out to deduce the effect of meteorological and source effects. Close correlation between benzo[a]pyrene (BaP), benzo[glii]perylene (BghiP), lead and vanadium levels shows the contribution of vehicular and industrial emissions and on the basis of a lower BaP /BghiP ratio the vehicular emission appears to be the major contributor of certain elements in the particulate. The levels of many elements are higher than the results obtained in various other parts of the world. © 1998 Elsevier Science B.V.
Keywords: Aerosol; Atmospheric pollution; Trace elements; ICP·spectroscopy; India
• Corresponding author. Fax: + 91 788 323997.
0048-9697j98/S19.00 © 1998 Elsevier Science B. V. AU rights re~rved. PI/ 50048·9697(98) 00111·9
Tt!XIco/ogicu/ und F.nvimnmtntal Chtml:stry, Vol. 58, pp. 25-32 Reprint\ ~vadJhlc directly from the publl~her l'hotocopywg permuted by license only
0 1997 OPA (Overseas Puhli~hers A~qociation) Am,tcrdam R.V. Puhli\hcd in 111e Ncthcrluntb
under ]icen~ by Gordon ond Breach Science Publi~hcrs Printed in Malaysia
POLYCYCLIC AROMATIC HYDROCARBONS AT 'PROGRAM TEPLICE' SITES IN THE
·CZECH REPUBLIC
JAN LENICEK'··, MILAN SEKYRA1, PIYUSH PANDEY', MARIE
CITKOVA.', IVAN BENES', JITKA NOVOTNA', SIGRID KOCIA.NOV A', JEVGENUA HELASKOV A' and ANNA SIMONOV A'
1 Refional Hygiene Station, Moskevskd I 5, 400 78 Ust( n.L., Czech Republic Bhilai Institute of Technology, Bhilai House Durg 49/00IMP, India
1 Regional Hygiene Station, Wolkerova 4, 4I665 Teplice, Czech Republic
(Received I6 May I996)
Determination of polynuclear aromatic hydrocarbons in air was carried out in two monitoring sites of 'Program Teplice' throughout the year 1993. The town of Teplice is located in an industrialized reg10n of the Northern Bohemia, Prachatice, a small town in Southern Bohemia, was chosen as reference. Measurement for PAHs was done in air at both locations and in bulk deposition at Teplice. Analysis of PAHs was done in air by HPLC with fluorescence monitor and in bulk deposition by CGC-MS. Difference in the mean PAHs levels in air is not significant; particularly when taking benzo(a)pyrene as an indicator compound. Higher concentrations of PAHs were observed during the winter heating period at both locations.
Keywords: PAH~ HPLC; benzo-(a]-pyrene
INTRODUCTION
Czech environment is still passing through a period of crisis on the account of the adverse effects arising from an extensive industrialization under a centrally planned economic system. Safe environmental and industrial practices have not received adequate attention. The result is a deterioration of environmental quality, ·extensive loss of forests and lowering of the standards of human health. The north-west part of Czech Republic, which
• Corresponding Author.
25
26 1. LEN(CEK et al.
comprises four districts, and are collectively referred to as Northern Bohemia, is probably the most affected area of Europe'''· Extensive strip-mining of brown coal and numerous coal based industries [power plants, 'heavy engineering and chemical plants, wood processing and paper mills] is the main feature of this region.
The problem of pollution in this region which borders the coal mining districts of two other countries-Germany and Poland, is so serious that even in scientific community it is called- 'The Black-Triangle'.
Previously, circumstanses prevented collection and dissemination of scientifically valid data on environmental quality; thus, there exists only fragmented and often sketchy information on the real extent of pollution.
A long term program on monitoring and research entitled on "Impact of Environmental Pollution on the Health of Population at the District of Teplice, Czech Republic" was conceived in 1991 by the Czech Ministry of Environment. In 1992 it was incorporated in the PHARE program and has also been supported by the Environmental Protection Agency [EPA], USA, Norwegian Institute of Air Research [NILU] and it is now referred to as 'Program Teplice'. The name Program Teplice derives from the town of Teplice which is situated in the north-west region of the Czech Republic [formerly, Northern Bohemia) and both its environmental and rneterological 'conditions are representative of the whole region. Prachatice, situated in the south-west [formerly, Southern Bohemia) was chosen as ref~rence site for the comparison of environmental conditions. It is one of the cleanest parts of the Czech Republic and most of the district is "Protected Landscape Area". About 52% of the area is under thick spruce forest cover.
Data for the levels of PAHs in Czech environment is fragmented or almost non-existent'''· To our knowledge, this study under the Program Teplice is the first comprehensive study in Czech Republic on monitoring and evaluntion of the various aspects of the PAHs in the selected sites, mentioned above. Results of this study will help towards creating a real data base on U1e levels of PAHs in European atmosphere; particularly that of Central Europe.
MATERIALS AND METHODS
Sampling and Extraction
Air Samples
The sampling site in Teplice was located in the centre of the town not subjected to a near source or intense vehicular traffic. The sampling site in
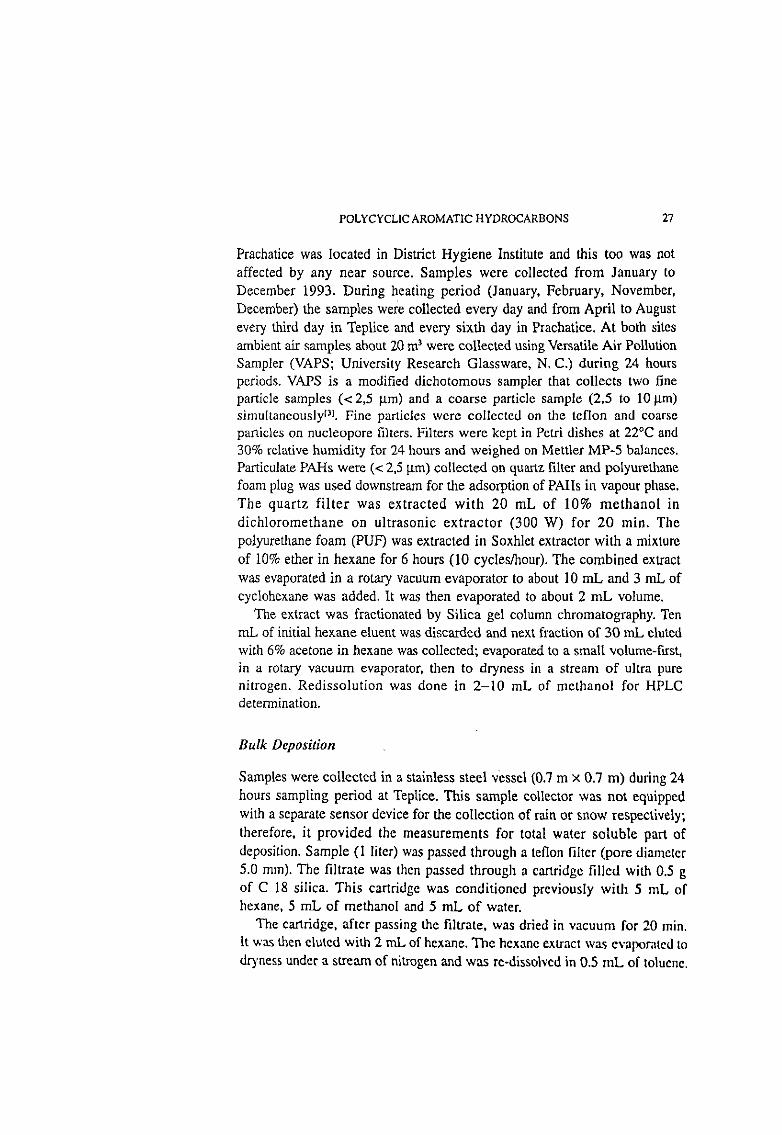
POLYCYCLIC AROMATIC HYDROCARBONS 27
Prachatice was located in District Hygiene Institute and this too was not affected by any near source. Samples were collected from January to December 1993. During heating period (January, February, November, December) the samples were collected every day and from April to August every third day in Teplice and every sixth day in Prachatice. At both sites ambient air samples about 20 m' were collected using Versatile Air Pollution Sampler (VAPS; University Research Glassware, N.C.) during 24 hours periods. VAPS is a modified dichotomous sampler that collects two fine particle samples (< 2,5 !J.m) and a coarse particle sample (2,5 to 10 IJ.m) simultaneousJyr". Fine particles were collected on the teflon and coarse particles on nucleopore filters. Filters were kept in Petri dishes at 22°C and 30% relative humidity for 24 hours and weighed on Mettler MP-5 balances. Particulate PAHs were(< 2,51J.m) collected on quartz filter and polyurethane foam plug was used downstream for the adsorption of PAHs in vapour phase. The quartz filter was extracted with 20 mL of 10% methanol in dichloromethane on ultrasonic extractor (300 W) for 20 min. The polyurethane foam (PUF) was extracted in Soxhlet extractor with a mixture of 10% ether in hexane for 6 hours (10 cycles/hour). The combined extract was evaporated in a rotary vacuum evaporator to about I 0 mL and 3 mL of cyclohexane was added. It was then evaporated to about 2 mL volume.
The extract was fractionated by Silica gel column chromatography. Ten mL of initial hexane eluent was discarded and next fraction of 30 mL eluted with 6% acetone in hexane was collected; evaporated to a small volume-first, in a rotary vacuum evaporator, then to dryness in a stream of ultra pure nitrogen. Redissolution was done in 2-10 mL of methanol for HPLC detennination.
Bulk Deposition
Samples were collected in a stainless steel vessel (0.7 m x 0.7 m) during 24 hours sampling period at Teplice. This sample collector was not equipped with a separate sensor device for the collection of rain or snow respectively; therefore, it provided the measurements for total water soluble part of deposition. Sample (I liter) was passed through a teflon filter (pore diameter 5.0 mm). The filtrate was then passed through a cartridge filled with 0.5 g of C 18 silica. This cartridge was conditioned previously with 5 mL of hexane, 5 mL of methanol and 5 mL of water.
The cartridge, after passing the filtrate, was dried in vacuum for 20 min. It was then eluted with 2 mL of hexane. The hexane extract was evaporated to dryness under a stream of nitrcgen and was re-dissolved in 0.5 mL of toluene.
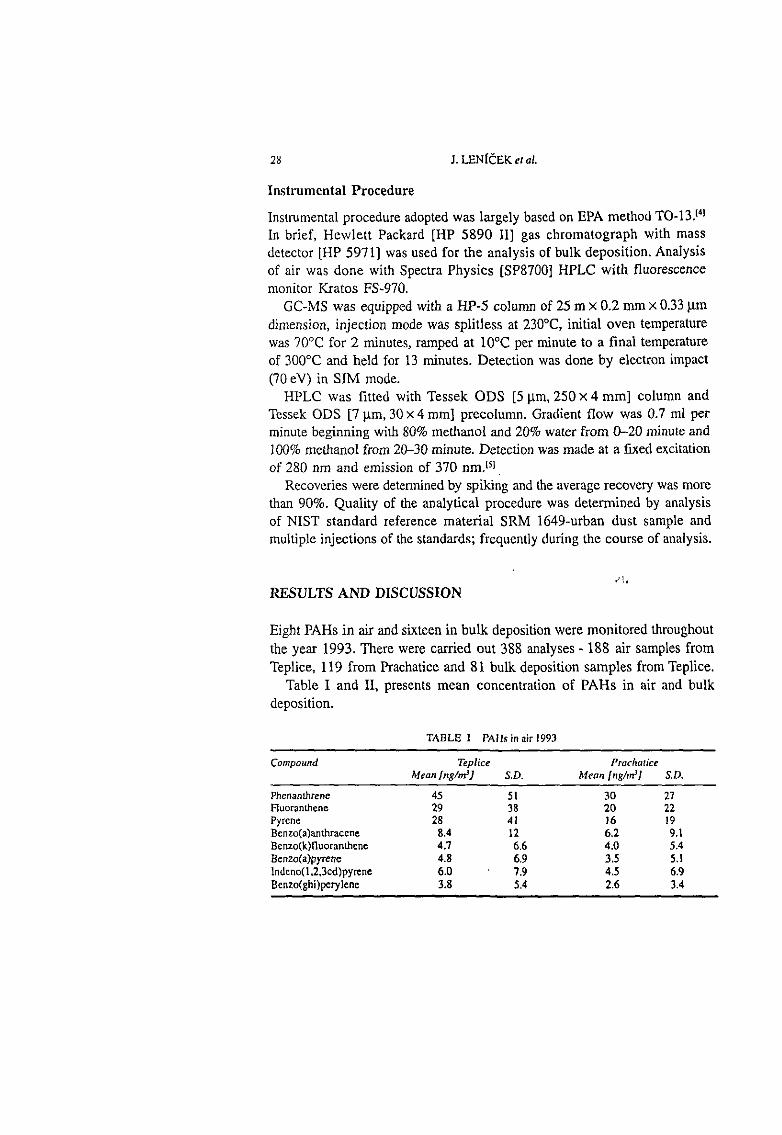
28 J. LEN(CEK et al.
Instrumental Procedure
Instrumental procedure adopted was largely based on EPA method T0-13.141
In brief, Hewlett Packard [HP 5890 II] gas chromatograph with mass detector [HP 5971] was used for the analysis of bulk deposition. Analysis of air was done with Spectra Physics [SP8700] HPLC with fluorescence monitor Kratos FS-970.
GC-MS was equipped with a HP-5 column of 25 m x 0.2 mm x 0.33 )lm dimension, injection mode was splitless at 230°C, initial oven temperature was 70°C for 2 minutes, ramped at l0°C per minute to a final temperature of 300°C and held for 13 minutes. Detection was done by electron impact (70 eV) in SIM mode.
HPLC was fitted with Tessek ODS [5 J.lm, 250 x 4 mm] column and Tcssek ODS [7 J.lm, 30 x 4 mm] precolumn. Gradient flow was 0.7 ml per minute beginning with 80% methanol and 20% water from 0-20 minute and 100% methanol from 20-30 minute. Detection was made at a fixed excitation of 280 nm and emission of 370 nm.''l.
Recoveries were determined by spiking and the average recovery was more than 90%. Quality of the analytical procedure was determined by analysis of NIST standard reference material SRM 1649-urban dust sample and multiple injections of the standards; frequently during the course of analysis.
RESULTS AND DISCUSSION
Eight PAHs in air and sixteen in bulk deposition were monitored throughout the year 1993. There were carried out 388 analyses- 188 air samples from Teplice, 119 from Prachatice and 81 bulk deposition samples from Teplice.
Table I and II, presents mean concentration of PAHs in air and bulk deposition.
TABLE I PAJ Is in air 1993
Compound Teplice Pracflatice Mean[nglm'} S.D. Meanfnglm1] S.D.
Phenanthrene 45 51 30 27 Fluoranthene 29 38 20 22 Pyrene 28 4! 16 19 Benzo(a)anthracene 8.4 12 6.2 9.1 Benzo(k)fluoranthene 4.7 6.6 4.0 5.4 Benzo(a)pyrene 4.8 6.9 3.5 5.1 1ndeno( 1 ,2,3cd)pyrene 6.0 7.9 4.5 6.9 Bcnzo(ghi)pcrylene 3.8 5.4 2.6 3.4
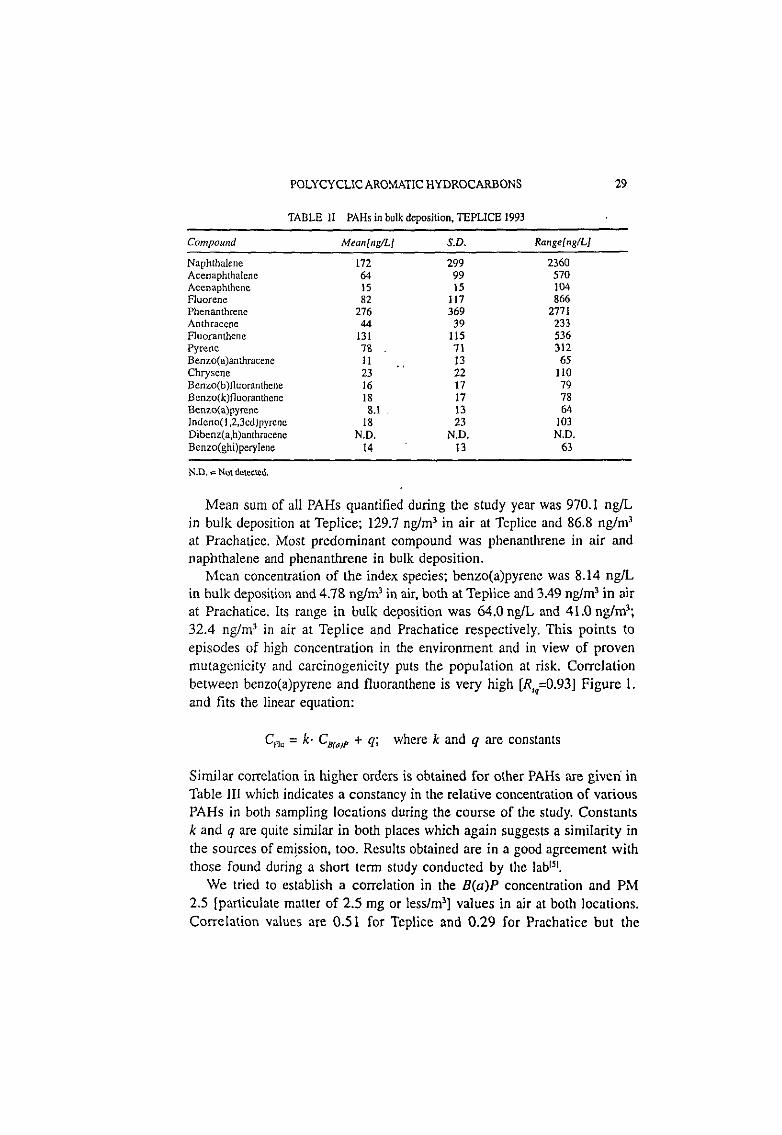
POLYCYCLIC AROMATIC HYDROCARBONS 29
TABLE II PAHs in bulk deposition, TEPLICE 1993
Compound Mean[ng!L] S.D. Range[ngfL]
Naphthalene 172 299 2360 Acenaphthalcne 64 99 570 Acenaphthcne IS IS 104 Fluorene 82 117 866 Phenanthrene 276 369 2771 Anthracene 44 39 233 Fluoranthene 131 115 536 Pyrene 78 71 312 Benzo(a)anthracene 11 13 65 Chrysene 23 22 110 Benzo(b )Jluoranthene 16 17 79 Bcnzo(k)fluoranthene 18 17 78 Benz.o(a)pyrene 8.1 . 13 64 Indcno(l ,2,3cd)pyrcnc 18 23 103 Dibenz(a,h)anthracene N.D. N.D. N.D. Benzo(ghi)perylene 14 13 63
N.D."" Not detected.
Mean sum of all PAHs quantified during the study year was 970.1 ng/L in bulk deposition at Teplice; 129.7 ng/m' in air at Tcplicc and 86.8 ng/m3
at Prachatice. Most predominant compound was phenanthrene in air and naphthalene and phenanthrene in bulk deposition.
Mean concentration of the index species; benzo(a)pyrene was 8.14 ng!L in bulk deposition and 4.78 ng/m3 in air, both at Teplice and 3.49 ng/m3 in air at Prachatice. Its range in bulk deposition was 64.0 ng/L and 41.0 ng/m'; 32.4 ng/m' in air at Teplice and Prachatice respectively. This points to episodes of high concentration in the environment and in view of proven mutagenicity and carcinogenicity puts the population at risk. Correlation between benzo(a)pyrene and fluoranthene is very high [R,,=0.93] Figure l. and fits the linear equation:
CA, = k· CsraJP + q; where k and q are constants
Similar correlation in higher orders is obtained for other PAHs are giveri in Table III which indicates a constancy in the relative concentration of various PAHs in both sampling locations during the course of the study. Constants k and q are quite similar in both places which again suggests a similarity in the sources of emission, too. Results obtained are in a good agreement with those found during a short tenn study conducted by the labl'r.
We tried to establish a correlation in the B(a)P concentration and PM 2.5 [particulate matter of 2.5 mg or lesslm'] values in air at both locations. Correlation values are 0.51 for Tcplice and 0.29 for Prachatice but the
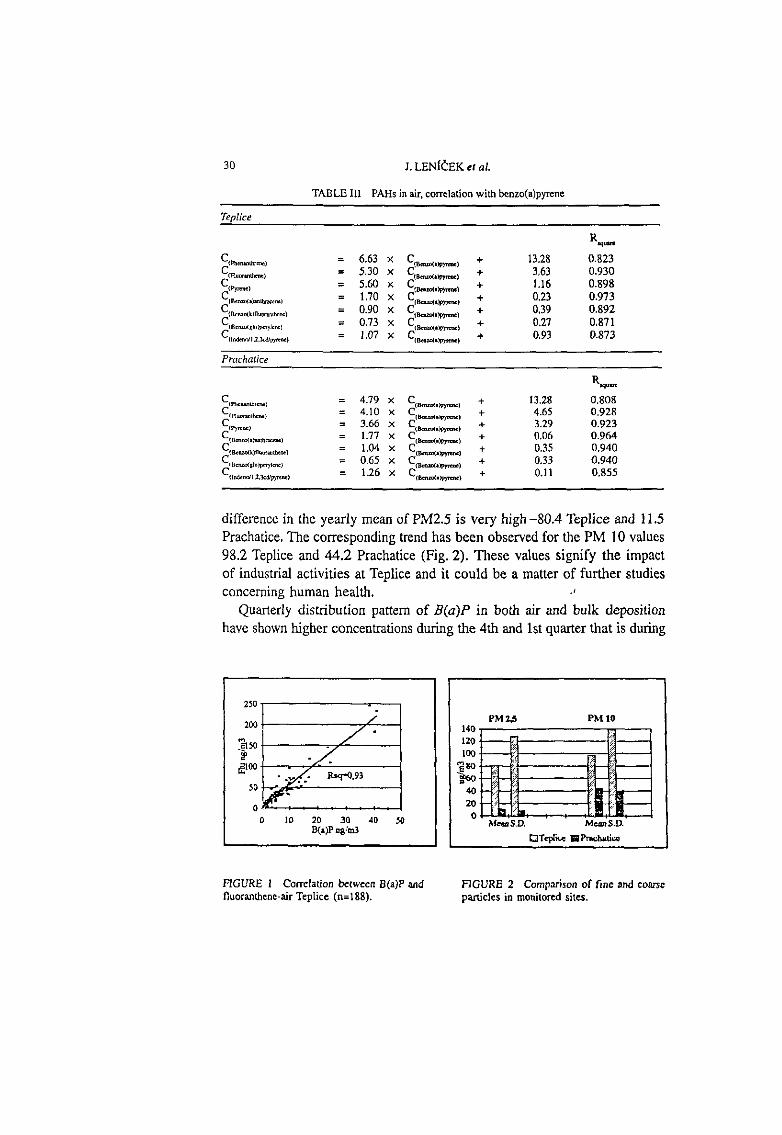
30 J. LEN(CEK eta/.
TABLE liJ PAHs in air, correlation with benzo(a)pyrene
Teplice
R ~·-
~:::::: 6.63 X g(Baw>(a)pymlo:) + 13.28 0.823
5.30 X + 3.63 0.930 c(l'yrl:ne) = 5.60 X
dll<nz.o(a)pyralo) + 1.16 0.898
(ll<nz.o(o)p)>rme)
c(B•nn>~•)an~) 1.70 X ~(Benw(alpyJmt) + 0.23 0.973
C\Brnzo(klnutn~~m.ne) = 0.90 X + 0.39 0.892 (Bmzo(l)pyrme)
~tBenUilgh,)pefylene) = 0.73 X C (lknltl(a)pym>e) + 0.27 0.871
Unden<~l.2,lc.dl~renc) 1.07 X c(ll<nz.o(a)pym>e) + 0.93 0.873
Prachatice
Rl<jU&n:
c,,~o ..... u,.,.> 4.79 X c(lklv.o!o)p)'Tal<) + 13.28 0.808 c(Pl.,..,,....,..} 4.10 X c(ll<nz.o(alpym>c) + 4.65 0.928 c(Pyre<>e) 3.66 X c(~o)pyru><) + 3.29 0.923 c(B<Dl.O(a)alltltn=e) 1.77 X c(Baw>(o)pyreoc) + 0.06 0.964
~:::::;::' 1.04 X ctBcnrD(•lpy=<l + 0.35 0.940 0.65 X c(Bcnzo(•)py<mt> + 0.33 0.940
(Jndetlall,l,'kdll')"rene) 1.26 X c(Bcnwl'o)pyrene) + 0.11 0.855
difference in the yearly mean of PM2.5 is very high -80.4 Teplice and 11.5 Prachatice. The corresponding trend has been observed for the PM I 0 values 98.2 Teplice and 44.2 Prachatice (Fig. 2). These values signify the impact of industrial activities at Teplice and it could be a matter of further studies concerning human health. ·'
Quarterly distribution pattern of B(a)P in both air and bulk deposition have shown higher concentrations during the 4th and 1st quarter that is during
2l0
200
50
0
./ / .
-/. ·'7{-. . . !Uq-(),93 , ...
0 10 20 30 40 ll(•)P ng:mJ
FIGURE l Correlation between B(a)P and fluoranthene-air Teplice (n=l88).
PM%,3 PM tO 140,----------------,~---,
"" t--f:l-------m---1 100 t---li.l------..--\11---1
'E 80 h::r-ft---------lfl--"li'J----i ~~~r------f,~r---1
: ti{t_:t,J;-_::-_--_--_ -1--t' I F ·~~~~-+~~~~~
M~S.D. MamS.D.
t:JTc-plM IIPTllehali&:G
FlGURE 2 Comparison of fine and come particles in monitored sites.
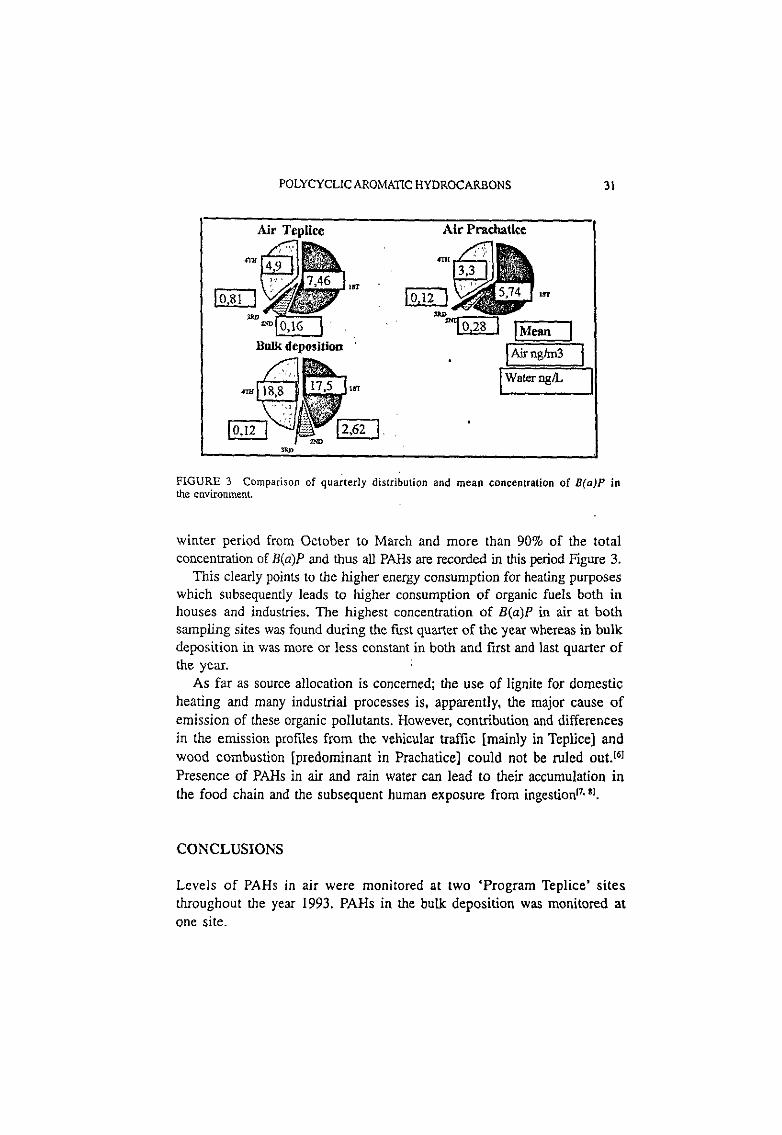
POLYCYCLIC AROMATIC HYDROCARBONS 31
Air Teplice Air Prachatlte
.----.~ rffi1~1l~. '" lo,sii~ "" ""' ..
I o,12 ""
FIGURE 3 Comparison of quarterly distribution and mean concentration of B(a)P in the environment.
winter period from October to March and more than 90% of the total concentration of B(a)P and thus all PAHs are recorded in this period Figure 3.
This clearly points to the higher energy consumption for heating purposes which subsequently leads to higher consumption of organic fuels both in houses and industries. The highest concentration of B(a)P in air at both sampling sites was found during the first quarter of the year whereas in bulk deposition in was more or less constant in both and first and last quarter of the year.
As far as source allocation is concerned; the use of lignite for domestic heating and many industrial processes is, apparently, the major cause of emission of these organic pollutants. However, contribution and differences in the emission profiles from the vehicular traffic [mainly in Teplice) and wood combustion [predominant in Prachatice) could not be ruled out.l6l
Presence of PARs in air and rain water can lead to their accumulation in the food chain and the subsequent human exposure from ingestion''· 81 •
CONCLUSIONS
Levels of PARs in air were monitored at two 'Program Teplice' sites throughout the year 1993. PARs in the bulk deposition was monitored at one site.
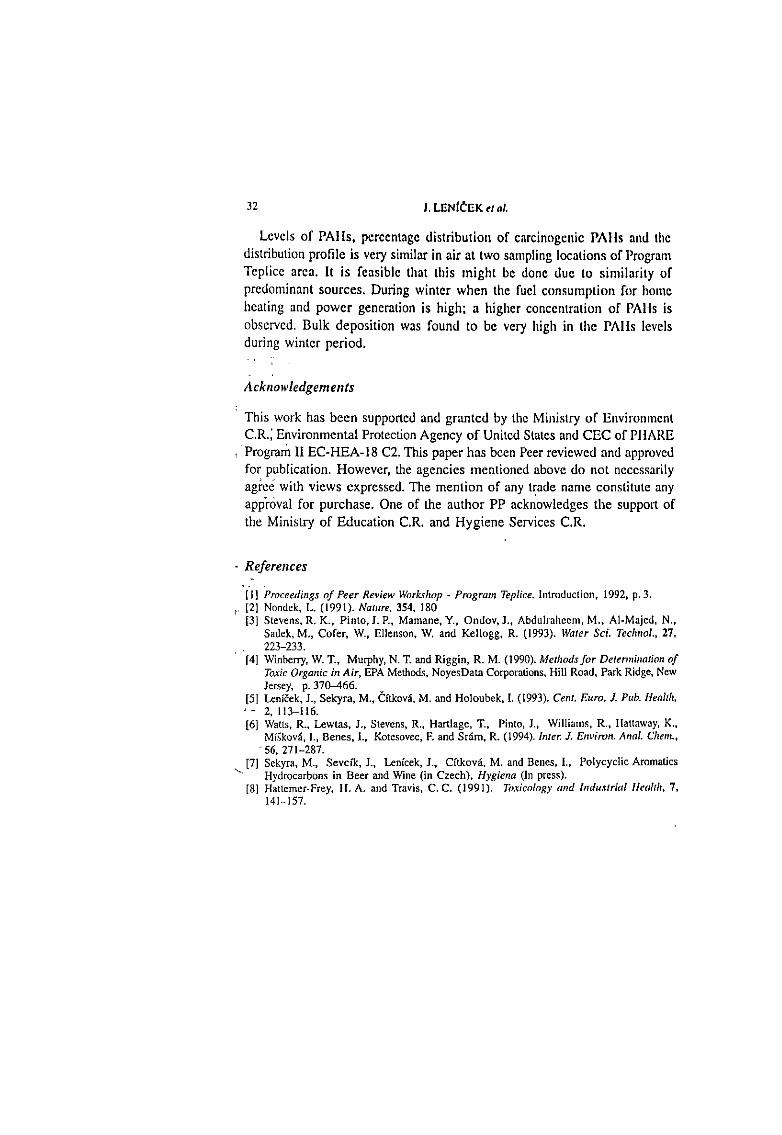
32 J. LENfCEK <t a/.
Levels of PAlls, percentage distribution of carcinogenic PAlls and the distribution profile is very similar in air at two sampling locations of Program Teplice area. It is feasible that this might be done due to similarity of predominant sources. During winter when the fuel consumption for home heating and power generation is high; a higher concentration of PAlls is observed. Bulk deposition was found to be very high in the PAlls levels during winter period.
Acknowledgements
This work has been supported and granted by the Ministry of Environment C.R.; Environmental Protection Agency of United States and CEC of PIIARE
:Program II EC-HEA-18 C2. This paper has been Peer reviewed and approved for publication. However, the agencies mentioned above do not necessarily agree with views expressed. The mention of any t~ade name constitute any app-roval for purchase. One of the author PP acknowledges the support of the Ministry of Education C.R. and Hygiene Services C.R.
- References
(I] Proceedings of Peer Review Workshop - Program Teplice. Introduction, 1992, p. 3. ,. [21 Nondek, L. (1991 ). Nature, 354, 180
[3] Stevens, R. K., Pinto, I. P., Mamane, Y., Ondov, J., Abdulrahccm, M., Al-Majcd, N., Sadek, M., Cofer, W., Ellenson, W. and Kellogg, R. (1993). Water Sci. Tee/mol., 27, 223-233.
[4] Winberry, W. T., Murphy, N. T. and Riggin, R. M. (1990). Methods for Determination of Toxic Organic in Air, EPA Methods, NoyesData Corporations, Hill Road, Park Ridge, New Jersey, p. 370-466.
[51 Lenicek, J., Sekyra, M., Cftkova, M. and Holoubek, !. (1993). Cent. Euro. J. Pub. Health, ' - 2, 113-1!6. [6] Watts, R., Lewtas, J., Stevens, R., Hartlage, T., Pinto, J., Williams, R., Hattaway, K.,
Ml;kov3, I., Benes, I., Kotcsovec, F. and Sr:im, R. (1994). Inter. J. Envimn. Anal. Chem., . 56, 271-287.
[7] Sekyra, M., Sevcfk, J., Lenicek, J., Cftkova, M. and Benes, I., Polycyclic Aromatics ~~- Hydrocarbons in Beer and Wine (in Czech), Hygiena (In press).
[8] Hattcmcr-Frey, H. A. and Travis, C. C. (1991). Toxicology and /11(/i.utrial Ilealth, 7, 141-157.
Kluwer academic publishers Achterom 119 P.O. Box 990
Journals Editorial Office
Date: 20 January 1998
Tel.no. (direct): (0)78 6392568
3300 AZ Dordrecht, The Netherlands Tel.: +31 (0)76 6392392. Fax.: +31 (0)76 6392555
Dr P.K. Pandey Bhilai Institute Of Technology Department Of E. Chemistry Bhilai House Durg Durg (MP) 491002 India
Our ref.: EMAS500 J6AUT1 604716 Polycyclic aromatic hydrocarbons: need for assessment of health risks in India? Study of an urban industrial location PANDEY/PATEL/LENICEK
Dear Dr Pandey,
I have received the report(s) from our advisor(s) on your manuscript, submitted to the journal Environmental Monitoring & Assessment
Based on the advice received, the Editor feels that although your paper needs thorough revision, a revised version incorporating all corrections as suggested by the referee(s) will be reconsidered for publication.
I am enclosing herewith a copy of the relevant remarks for your perusal together with a copy of the manuscript, which should be returned with the revised version. You are requested to submit your revised paper in triplicate, together with a listed response to the reviewers' comments in duplicate.
I would be grateful if you could let me know whether you are prepared to make the suggested amendments and, if so, when I may expect to receive the revised version.
Please remember to quote the manuscript number El1AS500 at all times. Thank you.
Sincerely yours, Kluwer Academic Publishers
Edward de Reus Editorial Office EHAS
Kluwl'r :.~.:!-:"~,: t' .. ~.' ~ .. ,..\ e v ·~ ti"> ,mpnrt o! Kluwer Ac.1d<:>'THC Pubi,Shers B v ll'l(:Ofporat<ng
:-~ ;o~ ~,.. P .: ·.• ,-,. C0~~,:t-f. t.'.v: .... ~J'I n,..,c'l Pub! ~.h("rs, Of W Junk Pvblrs.tw!rs
:• ~- ,,... r/ Cr,--..-.·c." :,y-_,-~·,.0">1 C R ~>I ;?J:510':i7. VAT oumbM' fROO Jl 19 9J2 848
C~>SS · PostfJch 1150 · 0·21494 Geestl1acht
Principal Investigator Dr. K.S. Patel School of Studies in Chemistry Pt. Ravishankar Shukla University
RAIPUR- 492 010 (M.P.) lt'IDIA .
lhr 7Ptcl1en/ill:e Nachocht
Dear Dr. Patel,
Ebi/ra 0415]/1:1/2354 04152/B7·2366
I U r• '; q Ill riGS Z I tl I llUI\1
lnslilul fUr Physiltalische und Chemische Analytil1
Prof. Dr.-lng. B. Neidhart
Mu~·P\anck-~lral\e 11-21502 Gee~thacht lr•l-7rntr.11~: rl-11'i7/fl7 0 l.1~ /••11lt.rlr•: 0111'•)/li/141H lnte1nt:t: hnp·//vwwgh~ de
Uol\um
22 September l997
I am pleased to inform you that your manuscript "Concentration of Mercury and other Heavy
Metal in Central India" is accepted for publication and has now been handed over to the Sprin·
ger publishing office.
Please find enclosed a list of contributions that will appear in the book, most likely in the first
quarter of 1998.
If you want to refer to your article please use:
Ebinghaus, R., Turner, R.R., Lacerda, D., Vasiliev, 0., Salomons, W. (eds.): Mercury Con
taminated Sites: Characterization, Risk Assessment and Remediation, Springer Environmental
Science, Springer Verlag Heidelberg, in press.
Thanking you again for your kind co-operation I remain
with best regards, (
II : (;_...- -
Dr. Ralj Ebinglraus
J'.S. The publi,her needs your manuscript on 3,5'' discctlc for processing the printing. Please
,end an electronic version of your manuscript on 3,5" discelle to me at your earliest con
venience.
- •• , .•: r>- • !·,...•' , 1 ,;·,... 1\•11'1-r, •,,,_. '" r........,1h.>1H o\u.'·~"nthl Gf-Mihtd>l IWA )ll'l U·.t l·!l~t Pr I\'> I \I (,f,'l
'· ,• 1 . ,_,,.,,.,, ,, ,J,t, 1 ,~·· ••II'• { (,.,.,h_.n l'!l"'"'' '"" {,•·.'hl'i-.loll"'"' 111 (,untrT "'"' \• "rb•t•o ''· ',ff'l,l', lt•·m·•~ , ,, • .. · •,. 1~- 'I·~·;,.,,,...,..,,~., ... ~,.hr·r'""'~"''"hl ,• •..,, •t<··l ,., .. ,.,.. •h<4'''",J"'""' ,J,~. (,t',•, I•" .:.,,"l''·'"honfl\
-: .• ,.·,;/"1·:·~11") f<o~tvl,.l''"'·-;'••·i:ll·'i ••1/i~IIA'I lkt..,.l»'ll'-lnk11.''"11•1t1".-.'•'lllllloJ} ..
PIITSBURGH CONFERENCE 300 I'Cnn CCNIUl ULVO, SUIIE 332 1~12)825·3220 fi\X 1~12)1325·322~ PIDSBURGH. PA 15235·5503 {BOO} 825·3221 http://wwwpoltcon.org
Piyush K. Pandey Bhailai Institute of Tecl1nology Bhilai House Durg MP, India 491001
Dear Piyush K. Pandey:
IQtMlifleEf 21, 1'99G
The 1997 Pittsburgh Conference is pleased to accept your contributed presentation entitled:
Pre-Concentration and Determination of Certain Metal Content in Suspended Particulates
Your paper is scheduled as follows:
Paper Number: 1042
Session Title: Sample Preparation and Automated Sample Introduction for Atomic Spectroscopy
Date and Time: Thursday, March 20, 1997 at 10:25
Place: Georgia World Congress Center, Atlanta, Georgia. Room number and starting time for your session will be printed in the Preliminary Program that you will receive in December.
All contributed papers are scheduled for 20 minutes.
This acceptance letter is sent only to the author designated to present the paper. Please forward this information to your coauthors.
Payment of conferee registration fees and application for housing for PITICON®'97 will be the responsibility of contributed paper authorslcoauthors. The Pittsburgh Conference provides no financial support to authors of contributed papers. Preregistration and housing forms are included in the Pittsburgh Conference UPDATE which will be mailed to you. it is recommended that you complete and return these forms as directed as soon as possible.
Please submit your extended abstract at this time. Directions for preparing your abstract are enclosed. Please follow these directions.
-Continued on other side-
1<1< PITICON!'97 -t71< P.tt!:,burgh Confercnc~ an tonn'·,~c<JI O'lt:!mtStry ,un::j f·rr:' !!d sre~J"C'~ccry. n nnn PI Ollt Pr>rm:.ylvnnln r.nrpornt.mn Co !':pnn~r,rcr1 fly Tltro ~p~"r:!rn-:r:np 1 Sn'='~t·l c! r.t:.:-!"1' <;'' nr:l Tl•l! Scc•~t ( fnr J\nn1 11tcnl Cttrnu .... l.<; of Ptll!ibur1Jh
q 0 Ul!f~<{i~ ~~~ f~f<mT~l:f. ( *T 15294* 1 . l. . T 15294 r
• t~ i!iT~
T 15'29lt f~.:·--