Embed Size (px)
Citation preview

Joana Rita Mendes Gaspar
ANALYTICAL QUALITY BY DESIGN TO
CHARACTERIZE INHALATION PRODUCTS
Master's Dissertation in Pharmaceutical Biotechnology, conducted under the scientific guidance of Prof. Doctor Luís
Fernando Morgado Pereira Almeida, professor at Faculdade de Farmácia da Universidade de Coimbra and Master
Maria Carlos Lopes, stability group leader at Hovione FarmaCiencia SA, presented to the Faculdade de Farmácia da
Universidade de Coimbra.
September 2018
UNIVER
SIDADE DE COIM
BRA
ANALY
TICAL QUALITY BY D
ESIGN TO
CHARACTER
IZE IN
HALA
TIO
N PRODUCTS
Joana Rita M
endes Gaspar

Acknowledgment
Firstly, I would like to express my thanks to my supervisor at Hovione, Maria
Carlos for the opportunity and for all the motivation and support. Also, I would like to
thank Sofia Silva for all the knowledge she gave me in the area of inhalation and for the
guidance given through my work.
I would like to acknowledge Hovione for providing the opportunity to perform
and develop all the research work in its facilities.
Special thanks go to colleagues at Research and Development laboratories for all
kind of help. All of those were essential to the development of the project.
It is also essential to thank Professor Doctor Luís Almeida for being my internal
advisal and for all the guidance and corrections that were important for the conclusion
of the present work.
Lastly, I would like to thank my friends and my family for encouragement and
unconditional support.

Analytical Quality by Design to characterize inhalation products - Chapter I
3
Index
Acknowledgment ............................................................................................................................. 2
Resumo .............................................................................................................................................. 5
Abstract ............................................................................................................................................. 6
List of abbreviations ........................................................................................................................ 7
List of figures ..................................................................................................................................... 9
List of tables .................................................................................................................................... 10
List of graphics ................................................................................................................................ 11
Chapter I – General Introduction .............................................................................................. 12
Pulmonary drug delivery .......................................................................................................... 13
Physiology of the airways ..................................................................................................... 13
Mechanism of particle deposition in respiratory tract .................................................. 14
Inhalation Drug Products ......................................................................................................... 15
Nebulizers ............................................................................................................................... 16
Pressurized metered-dose inhalers ................................................................................... 16
Dry Powder Inhalers............................................................................................................. 16
Critical Quality Attributes of Orally-Inhaled Drug Products ...................................... 19
Cascade Impactors ................................................................................................................ 20
Next Generator Pharmaceutical Impactor ...................................................................... 22
Flow rate ................................................................................................................................. 25
API quantification by HPLC ................................................................................................. 26
Variability of Cascade Impaction Measurements ............................................................ 28
Analytical Quality by Design ................................................................................................... 28
Analytical target profile ........................................................................................................ 28
Method Design ....................................................................................................................... 29
Risk Assessment .................................................................................................................... 29

Analytical Quality by Design to characterize inhalation products - Chapter I
4
Control Strategy .................................................................................................................... 30
Advantages of AQbD ........................................................................................................... 31
Objective ..................................................................................................................................... 32
Chapter II – Materials and Methods .......................................................................................... 33
Materials ...................................................................................................................................... 34
Methods ....................................................................................................................................... 34
Risk Assessment .................................................................................................................... 34
Method I for API quantification .......................................................................................... 35
Method II for API quantification ......................................................................................... 37
Recovery Techniques ........................................................................................................... 38
Coating agent ......................................................................................................................... 39
Setup of NGI .......................................................................................................................... 39
Cascade impaction testing and sample recovery ............................................................ 39
Stability of standards and sample solutions ..................................................................... 40
Chapter III - Results and Discussion ......................................................................................... 41
Risk Assessment .................................................................................................................... 42
FMEA ........................................................................................................................................ 43
Method I .................................................................................................................................. 44
Method II ................................................................................................................................. 51
Final considerations ............................................................................................................... 61
Chapter IV - Conclusion .............................................................................................................. 63
Chapter V – Bibliography ............................................................................................................. 66

Analytical Quality by Design to characterize inhalation products - Chapter I
5
Resumo
O presente trabalho foi baseado no desenvolvimento de um método analítico
utilizando a abordagem de Analytical Quality by Design (AQbD). Esta abordagem é utilizada
quando existe a necessidade de se obter um conhecimento completo do método e, ao
mesmo tempo, controlar os possíveis fatores que podem influenciar os resultados no
trabalho de rotina. O método analítico escolhido foi o Next Generation Impactor (NGI)
que tem a capacidade de avaliar a distribuição aerodinâmica do tamanho de partícula de
um aerossol. Este método foi escolhido com o objetivo de melhorar a sua robustez e,
ao mesmo tempo, criar um fluxo de trabalho representativo das etapas essenciais no
seu desenvolvimento.
A parte experimental começou após a realização de uma análise de risco do
método geral de NGI usando uma ferramenta chamada “Failure Mode and Effect Analysis”.
Com todas as possíveis variáveis críticas identificadas, foi desenvolvido um método de
NGI e foram definidas as condições ótimas para cada variável.
As variáveis testadas foram: o número de cápsulas utilizadas em cada teste, tempo
e tipo de agitação de cada componente, influência do revestimento e presença de perdas
através do interstage. Ao longo de todos os testes, verificou-se que o balanço de massa
esteve sempre dentro dos critérios definidos pela Food and Drug Administration exceto
no teste realizado sem revestimento. As variáveis que tiveram influência considerável
nos resultados obtidos estão relacionadas com a aplicação da solução de revestimento
e com o tempo de agitação durante a recuperação. Testes adicionais foram realizados
para avaliar a estabilidade de padrões e amostras.
No final do trabalho, concluiu-se que a abordagem AQbD no desenvolvimento do
NGI foi muito útil, uma vez que permitiu avaliar quais as variáveis críticas do método
com maior impacto nos resultados obtidos.
Palavras-chave: Next Generation Impactor, Analytical Quality by Design, distribuição
aerodinâmica do tamanho de partícula, inalador de pó seco

Analytical Quality by Design to characterize inhalation products - Chapter I
6
Abstract
The present work was based on the development of an analytical method using
the approach of Analytical Quality by Design (AQbD). This approach is used when there
is a need to reach a full knowledge of the method and, at the same time, to control the
possible factors that can influence the results during routine work. The analytical method
chosen was the Next Generation Impactor (NGI) that has the capacity of evaluating the
aerodynamic particle size distribution (aPSD) of an inhalation product. This method was
chosen in order to improve its robustness and, at the same time, to create a workflow
representative of the essential steps on its development.
The experimental part began after the accomplishment of a risk analysis of the
general NGI method using a tool called “Failure Mode and Effect Analysis”. With all the
possible critical variables identified, an NGI method was developed and the optimal
settings for each variable were defined.
The variables tested were: number of capsules discharged per test, time and type
of agitation of each component, influence of coating and presence of interstage losses.
Among all the tests, it was verified that the mass balance was always within the range
recommended by Food and Drug Administration except on the test performed without
coating. The variables that had a considerable influence on the results obtained were
related with the application of the coating solution and with the time of agitation used
during recovery step. Additional tests were performed to evaluate the stability of
standards and sample solutions.
At the end of the work, it was concluded that the AQbD approach was very useful
on the NGI development since it allowed to evaluate which are the method variables
with higher impact on the results obtained.
Keywords: Next Generation Impactor, Analytical Quality by Design, Aerodynamic
Particle Size Distribution, Dry-Powder Inhaler
Analytical Quality by Design to characterize inhalation products - Chapter I
7
List of abbreviations
ATP - Analytical Target Profile
AQbD - Analytical Quality by Design
API – Active Pharmaceutical Ingredient
APSD – Aerodynamic Particle Size Distribution
CI – Cascade Impactor
CITDAS – Copley Inhaler Testing Data Analysis Software
COPD – Chronic Obstructive Pulmonary Disease
CQA - Critical Quality Attribute
DPI – Dry Powder Inhaler
DoE - Design of Experiments
DUSA – Dosage Unit Sampling Apparatus
FDA – Food and Drug Administration
FPD – Fine Particle Dose
FPF – Fine Particle Fraction
FMEA – Failure and Mode Effect Analysis
GSD – Geometric Standard Deviation
HPLC – High Performance Liquid Chromatography
ICH - International Conference on Harmonization
IP – Induction Port
LC – Label Claim
LOQ – Limit of Quantification
MMAD – Mass Median Aerodynamic Diameter
MOC – Micro-Orifice Collector
MPA – Mouthpiece adaptor
NGI – Next Generation Impactor
OIDP – Orally-Inhaled Drug Product
pMDI – pressurized Metered Dose Inhalers

Analytical Quality by Design to characterize inhalation products - Chapter I
8
PS – Pre-Separator
Q – Flow rate
QbD - Quality by Design
QC – Quality control
RPN – Risk Priority Number
RSD – Related Standard Deviation
RT – Retention Time
SDS – Sodium Dodecyl Sulfate
SSSA – Stock Standard Solution A
SSSB - Stock Standard Solution A
USP – United States Pharmacopoeia
WSA – Working Standard A
WSB – Working Standard B
µm – Micrometer
∆P – Pressure Drop

Analytical Quality by Design to characterize inhalation products - Chapter I
9
List of figures
Figure 1: Parameters that may affect lung deposition (3)(4). ............................................... 13
Figure 2: Respiratory tract divided by structural and functional organization (5). ......... 14
Figure 3: Factors that determine the deposition of inhaled particles (7). ......................... 15
Figure 4: Example of nebulizer (10). .......................................................................................... 15
Figure 5: Example of pMDI (11). ................................................................................................ 15
Figure 6: Example of DPI (12). .................................................................................................... 15
Figure 7: Characteristic of the ideal device for drug delivery. ............................................. 17
Figure 8: Schematic diagram of carrier-based formulation and dispensing powder
mechanisms (14). ........................................................................................................................... 18
Figure 9: NGI with three main parts. (17) ............................................................................... 22
Figure 10: Layout of NGI showing size of nozzles on each stage (30). ............................. 23
Figure 11: NGI with IP and PS (17). ........................................................................................... 24
Figure 12: Vacuum pump (17). .................................................................................................... 24
Figure 13: Examples of mouthpiece adapters for different inhalers (17). ......................... 24
Figure 14: Critical Flow Controller (33). ................................................................................. 24
Figure 15: Flowmeter (17). .......................................................................................................... 24
Figure 16: Adaptation of scheme that represents NGI test-setup for DPI testing (34). 26
Figure 17: Workflow of an HPLC isocratic system. (37) ...................................................... 26
Figure 18: Example of chromatographic separation of two samples (39). ........................ 27
Figure 19: Recovery procedure for API extraction. .............................................................. 40
Figure 20: Risk assessment analysis. .......................................................................................... 42
Figure 21: Overlay of the chromatograms obtained by injecting device with API (dark
line), device without API sonicated 10 minutes (pink line) and device without API and
without sonication (blue line). .................................................................................................... 49
Figure 22: Overlay of chromatogram obtained by injection of device with API (NGI with
10 capsules) and without API (Method II). ............................................................................... 52
Figure 23: Chromatograms obtained by injection of WSA 5 with method I and method
II. ........................................................................................................................................................ 52
Figure 24: Summary of the fundamental steps necessary to develop a NGI method. ... 61

Analytical Quality by Design to characterize inhalation products - Chapter I
10
List of tables
Table 1: Cut-off diameters of NGI stages at different flow rates (17). ............................. 23
Table 2: Operating conditions of HPLC. .................................................................................. 36
Table 3: Operating conditions of HPLC. .................................................................................. 37
Table 4: Range of volumes possible to be tested at recovery procedure. ....................... 38
Table 5: Time and type of agitation at the recovery procedure. ........................................ 38
Table 6: Critical attributes identified by FMEA that require study or a corrective
action. ............................................................................................................................................... 43
Table 7: WSB five injections - peak areas, RT and %RSD (Method I). .............................. 45
Table 8: Dilution volumes used to recover API at sample solutions. ................................ 46
Table 9: Results of NGI with one capsule - Gentle Rocker/ Sonication 5 and 10
minutes (Method I). ....................................................................................................................... 47
Table 10: Results of the NGIs performed with 2 and 3 capsules (Method I). ................. 48
Table 11: Results of the NGIs performed with 5 and 10 capsules (Method I). ............... 50
Table 12: Results of the re-injection of standards and samples correspondent to NGI
performed with 10 capsules. (Method II) ................................................................................. 51
Table 13: Results of the NGI performed with 2 and 5 capsules (Method II). .................. 53
Table 14: Results of the NGIs performed with different type and time of shaking
(Method II). ..................................................................................................................................... 54
Table 15: Results of the % of mass present at PS and IP depending on the type and time
of agitation. ...................................................................................................................................... 55
Table 16: Results of the three runs performed at the same conditions. .......................... 56
Table 17: %RSD of APSD parameters obtained by CITDAS software. ............................. 56
Table 18: Results of the tests performed without coating and with different coating
evaporation times (5 and 30 minutes). ..................................................................................... 57
Table 19: Results of interstage wall losses without coating solution and with different
evaporation times when the solution was present. ............................................................... 59
Table 20: Stability results of standard solutions. .................................................................... 60
Table 21: Stability results of sample solutions. ........................................................................ 60
Table 22: Instructions for each process step of NGI method development. ................... 62

Analytical Quality by Design to characterize inhalation products - Chapter I
11
List of graphics
Graphic 1: Calibration curve of WSA with equation chart and coefficient of
determination (r2). ......................................................................................................................... 45
Graphic 2: Deposition profile comparison between API recovered after 5 and 10
minutes. ............................................................................................................................................ 47
Graphic 3: Comparison between the deposition profile of NGI performed with 2 and 3
capsules. ........................................................................................................................................... 49
Graphic 4: Comparison of the NGIs performed without coating and with different times
of coating solution evaporation. ................................................................................................. 58

Chapter I – General Introduction

Analytical Quality by Design to characterize inhalation products - Chapter I
13
Pulmonary drug delivery
Obstructive airway diseases, such as Bronchial Asthma and Chronic Obstructive
Pulmonary Disease (COPD), are commonly treated with drugs which are delivered by
inhalation. These drugs can target the lungs directly and because of the low doses
combined with a quick onset of action they have a better therapeutic index and less side
effects (1)(2).
In the last two decades, a remarkable increase of the scientific interest in the
technology for pulmonary delivery was observed due to the acknowledgement that the
lungs can be used as a portal for systemic drug delivery. Pulmonary delivery is attractive
as a route for systemic administration due to fast absorption by the massive surface area
of the alveolar region, the abundant vasculature and thin air–blood barrier, and the
avoidance of first pass metabolism (2). However, the effectiveness of this kind of therapy
is largely dependent on the amount of drug that will reach the intended site of
deposition.
The deposition pattern is determined mostly by the formulation and the delivery
device, but the patients have also a decisive role. Figure 1 summarizes the various
parameters that can affect lung deposition (3)(4).
Physiology of the airways
Anatomically, the respiratory tract can be divided in two sections, as shown in
figure 2 (5), the upper respiratory system, which includes the nose, pharynx and
associated structures; and the lower respiratory system, which includes the larynx,
trachea, bronchi and lungs. Functionally, the respiratory tract can also be divided into
two parts (6):
Aerosol particle
properties •Size
•Density•Shape•Charge•Hygroscopicity
Patient • Inhalation air flow rate
•Throat geometry/lunganatomy•Co-ordination/technique•Disease state
Device •Aerosolisation
principle (resistancethrough airflow)
Figure 1: Parameters that may affect lung deposition (3)(4).

Analytical Quality by Design to characterize inhalation products - Chapter I
14
• Conducting zone - series of interconnected cavities and passageways which
serve to prepare ambient air for respiration by warming and humidifying the incoming
air, as well as filtering the air of foreign particles and pathogens;
• Respiratory zone - represents the tissues within the lungs where gas exchange
between air and blood occurs (6).
Figure 2: Respiratory tract divided by structural and functional organization (5).
The basic structure of the respiratory tract can be considered as a series of
dichotomous branches. Each time the bronchial tree divides, it is referred to as a new
generation. There are 23 generations of airways (see figure 3) and gas exchange occurs
in the last 8.
Airway branching causes a reduction in the airflow velocity, so in the alveoli the
air velocity is near zero to facilitate respiration by passive diffusion of dissolved gases.
Also with the increasing number of bifurcations, the total cross-sectional area increases,
so that the overall surface area of the alveolar region is very large to facilitate the
absorption of systemic drugs (6).
Mechanism of particle deposition in respiratory tract
Particles deposit in the airways by three major modes of deposition mechanisms
(see figure 3 (7)):
• Inertial impaction: mainly influences the deposition of larger particles that tend
to collide with the airway walls in the upper airway regions. This occurs due to particle

Analytical Quality by Design to characterize inhalation products - Chapter I
15
inertia because particles continue on their original course and are unable to follow the
airstream when it changes direction. Particles with larger diameters, higher densities and
higher velocities will result in greater impaction (6)(8)(9).
• Sedimentation: mainly with particles in the size range of 0.5–5 μm that deposit in
the terminal bronchioles and alveolar regions. This is a process proportional to the
period during which the particles remain in the region. If the time between the end of
inspiration and the start of exhalation is extended, there is more time for sedimentation
to occur. Therefore, since the airstream velocity is relatively low, particles tend to settle
due to influence of gravity (6)(8)(9).
• Brownian motion: may occur with particles smaller than 0.5 µm because of the
random bombardment of gas molecules that result in particle collision with the airway
walls. This type of deposition is associated with the alveolar spaces where air velocity is
near zero (6)(8)(9).
Inhalation Drug Products
Devices used to deliver therapeutic agents as aerosols are divided in three major
classes: nebulizers (figure 4, (10)), pressurized metered-dose inhaler (pMDI, figure 5
(11)) and dry powder inhalers (DPIs, figure 6 (12)) (2).
Figure 3: Factors that determine the deposition of inhaled particles (7).
Figure 4: Example of nebulizer (10).
Figure 5: Example of pMDI (11).
Figure 6: Example of DPI (12).

Analytical Quality by Design to characterize inhalation products - Chapter I
16
Nebulizers
The nebulizers produce respirable droplets of the drug through the conversion of
a liquid (solution or suspension) into aerosol droplets. There are three different
technologies to perform the conversion of the liquid into inhalable droplets: jet,
ultrasonic and mesh nebulizers. In the jet nebulizers, compressed air or oxygen are used
to atomize the liquid drug into a mist. The ultrasonic nebulizers convert electrical energy
to high-frequency vibrations using a transducer. These vibrations are transferred to the
surface of the solution, creating a standing wave that generates aerosol. The mesh
nebulizers use the ultrasonic basis to generate the droplets that then pass through a
static or vibrating mesh, forming a cloud or mist of the drug (13).
These products are very user friendly, easy to use and can administer more than
one product. However, they rely on very large and non-portable equipment, they need
a power source and they are very expensive. It is also recognized that the drug
deposition in the lungs is much lower than when compared to the other inhalation drug
products (there is a high deposition on the drug in the eyes and face of the users, leading
also to an increase of probable contaminations) (13).
Pressurized metered-dose inhalers
A pMDI is comprised of a solution or suspension containing the drug substance
and a propellant inside a pressurized canister. When pressing the canister, the metered
dose inside the canister is released in an aerosol plume by a metering valve (13).
These drug products are portable, robust, easy to handle and inexpensive and the
fact that the canister is under pressure prevents possible contaminations. Nevertheless,
these products have a few disadvantages as there is the need to use propellants, it is not
easy to coordinate the actuation-inhalation step and they also show low deposition in
the lungs (13).
Dry Powder Inhalers
DPIs are portable devices that require minimum patient coordination between
breathing and actuation of the device to deliver the drug (2). Beyond that advantage,
these devices (used for the current work) have the majority of the requirements

Analytical Quality by Design to characterize inhalation products - Chapter I
17
presented in the Figure 7 which contributes to the high adhesion to the treatment by
the patients (1).
Before inhalation, the formulation of all DPIs has no potential for lung deposition.
It is the patient’s inhalation that transforms the powder in a DPI into an emitted dose of
particles with the appropriate characteristics for deposition in the lungs. When a patient
inhales through a DPI, turbulent energy inside the device is created by the pressure drop
(∆P) that results from the interaction between the patient’s inhalation flow (Q) and the
internal design of the DPI which translates into a resistance to airflow.
For each inhaler there is a minimum inhalation flow required to provide efficient
disaggregation of the formulation. The minimum inhalation flow, while not clearly defined
for each device, is important because there is the potential for a patient to receive no
dose. When a patient inhales through a DPI, disaggregation of the powder occurs almost
immediately as the dose leaves the device. If the inhalation is too fast, which is possible
for a DPI with a low resistance, the powder may not disaggregate before it leaves the
inhaler. This situation leads to the emission of particles that are too big to be deposited
in the lungs and so the dose is deposited in the oropharynx and subsequently
swallowed (3).
Despite the advantages of these devices, their performance depends on the
powder formulation, the design of the inhaler device and on the patient (2).
Formulation for DPIs
Traditional powder blends consist of micronized drug particles (median size 1–5
µm) blended with an inactive excipient of larger size (2). The main problem with particles
of this small micron size is their high surface free energy that makes them stick to each
other (via cohesive forces) or to any surface they encounter (via adhesive forces). As a
result, they exhibit poor flowability and aerosolization performance and have a
propensity to remain within the inhaler (14).
Drug carrier excipients added in appropriate sizes can reduce such cohesive
forces, as shown in figure 8. In general, excipients improve flowability of drug particles
Ideal Device
Effective Reproducible Precise Stable Comfortable VersatileEnvironmental
friendlyAffordable
Figure 7: Characteristic of the ideal device for drug delivery.

Analytical Quality by Design to characterize inhalation products - Chapter I
18
to facilitate filling the DPI, increase dispersion of drug particles during emission and dilute
the drug to improve accurate dose delivery (achieving a good uniformity of doses)
(2)(14). However, since the amount of active pharmaceutical ingredient (API) in a DPI is
relatively low (0.05%–10%), a slight change in the physical properties of the carrier has
a considerable effect on DPI performance (14).
Carriers used are commonly coarse particles with a size range of 50–200 mm
which are designed to be swallowed after impact with the upper respiratory tract so
that only fine drug particles are deposited deep in the lung. Due to the lack of
toxicological data concerning the potential hazard of carriers to lung tissue, the number
of carrier materials currently approved or certified safe by the Food and Drug
Administration (FDA) remains limited so that most commercially available DPI
formulations rely on lactose as the carrier (14).
A specific reference should be made to drug-lactose blend which is currently the
most common type of DPI formulation. A small amount of lactose fine particles (≤5-10
µm) is often incorporated to promote deaggregation in the turbulence created by
inhalation. Increasing the amount of fine carrier particles in ternary interactive mixtures,
up to a certain weight proportion, can improve the aerosol performance of DPI
formulations. The presence of fine lactose particles can also facilitate physical disruption
of the strong cohesive interaction between drug particles by decreasing the number of
drug-drug contacts and increasing the separation distance between the neighboring drug
particles (15).
Figure 8: Schematic diagram of carrier-based formulation and dispensing powder mechanisms (14).
Analytical Quality by Design to characterize inhalation products - Chapter I
19
In the present work, the formulation used consists on API X and two types of
lactose. API X is used intranasally to reduce airflow obstruction related to asthma and
to manage symptoms of allergic and non-allergic rhinitis.
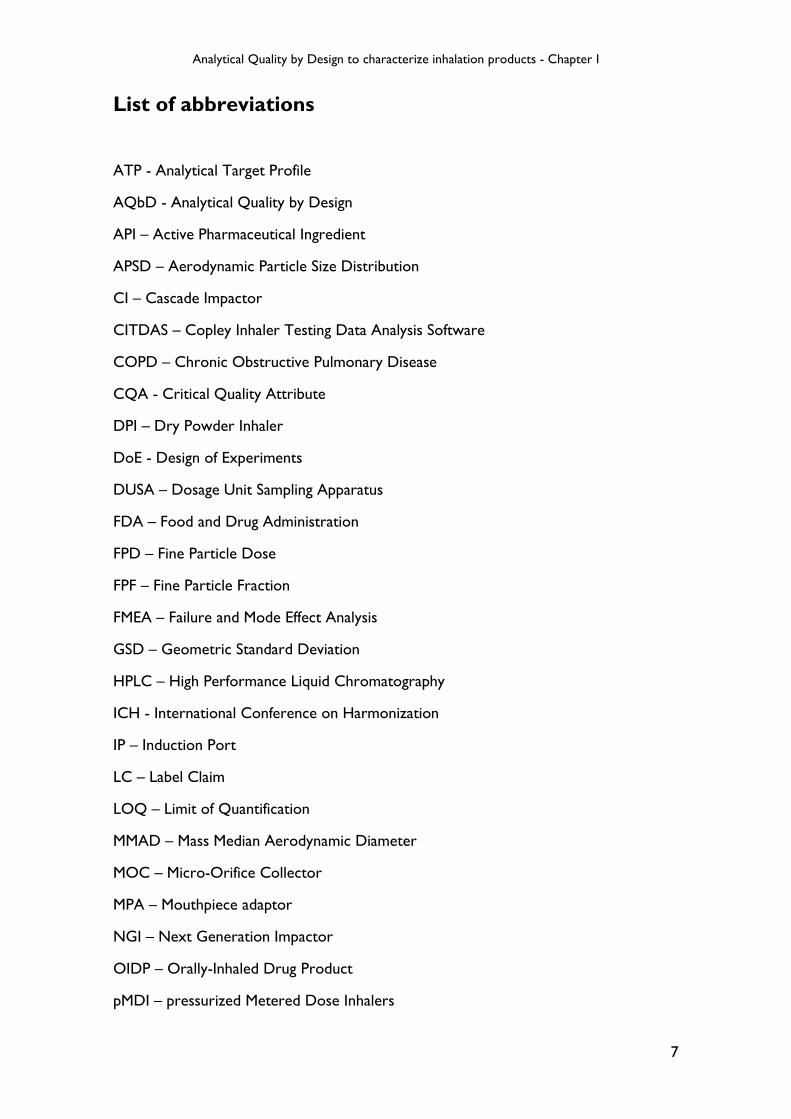
DPI design
It is the physical design of the DPI that establishes its specific resistance to airflow.
To produce a fine powder aerosol with increased delivery to the lung, a DPI
characterized as having a low resistance requires an inspiratory flow of >90 L/min, a
medium-resistance DPI requires 50-60 L/min, and a high-resistance DPI requires
<50 L/min (16).
Critical Quality Attributes of Orally-Inhaled Drug Products
Orally-Inhaled Drug Products (OIDPs) have some Critical Quality Attributes
(CQAs) that need to be controlled over the pharmaceutical development and batch
release to ensure safety, quality and efficacy, namely:
• Delivered Dose (Emitted Dose) - total amount of drug emitted from the drug
device and later available to the user (17)(18);
•Aerodynamic particle size distribution (aPSD) - determines the percentage of the
total emitted dose that reaches the lungs or nasal mucosa during inhalation and is thus,
therapeutically effective (17)(18).
The delivered dose is measured by the actuation of the test device into a sampling
apparatus containing a filter (Dosage Unit Sampling Apparatus, DUSA). The dose is
captured, the active drug is dissolved in solvent and an aliquot is then analysed, normally
using High Pressure Liquid Chromatography (HPLC). During testing, air is drawn
through the sampling apparatus to broadly simulate inhalation. The manner in which the
air is drawn through the apparatus is dependent on the device under test. For DPIs, this
apparatus should operate at a ∆P of 4 kPa for the duration of time to allow 4 L of air, as
specified in United States Pharmacopeia (USP) <601> (17).
The aerodynamic size distribution of an aerosol cloud defines where the particles
in that cloud may deposit after inhalation. In order to be effective and to deposit in the
lungs, particles should be in the range of 1 to 5 µm (17)(19). Particles below 1 µm may
remain entrained in the air stream being exhaled and above 5 µm particles usually impact
in the oropharynx being swallowed (17)(20).

Analytical Quality by Design to characterize inhalation products - Chapter I
20
To measure particle size of inhalation products, regulators and pharmacopoeias
recommend the use of cascade impactors (CIs) (17)(20).
Cascade Impactors
CIs are instruments with high precision that can separate a sample based on
particle inertia without the knowledge of particle density and shape. Their widely
recommendation by pharmaceutical entities is caused by three features that no other
instrument have:
1. Measure aerodynamic particle size which helps to explain how particles behave
in a moving air stream;
2. Measure API present in the aerosol cloud;
3. Measure the entire dose allowing complete characterization of the product in
question (17).
Despite their advantages, it is important to recognize that the CI is not a lung
simulator because of many features, including the geometry at the point of impact,
collection surface hardness and coating, and operation at constant flow rate. In
particular, collection stages in the impactor do not correspond to any specific deposition
sites in the lung (21). CIs mode of operation is based on the passage of aerosolized
particles through decreasing nozzle apertures onto subsequent deposition stages (15).
The impaction of a particle on that stage is dependent on its aerodynamic diameter.
Particles having sufficient inertia will impact on that specific stage collection plate, whilst
smaller particles with insufficient inertia will remain entrained in the air stream and pass
to the next stage where the process is repeated. As the nozzles get smaller, the air
velocity increases, and finer particles are collected (17)(22)(23).
As long as the nozzle diameters remain within defined tolerances and there are no
inherent leaks in the system, it can be seen that the cut-off diameter (the aerodynamic
diameter of particles that accumulate on any given collection surface) of any stage is
directly related to the volumetric flow rate of the inlet air passing through it (17).
Sometimes particles may bounce when they contact with the collection cups
allowing the re-entrance in the air stream and consequently the collection on the wrong
stage. Another issue that can occur is the particle deposition on another parts of the
impactor instead of the collection plates (17). These occurrences may be minimized by

Analytical Quality by Design to characterize inhalation products - Chapter I
21
coating the collection cups with a suitable surface coating (e.g. glycerol or silicone oil)
(17)(18)(15).
When the test is concluded, the particle mass present at each stage collection
plate is recovered using a suitable solvent and then it is analyzed by HPLC to quantify
the API present in the product/stage. By the quantification of the drug deposited on the
various stages it is possible to calculate the Fine Particle Dose (FPD), Fine Particle
Fraction (FPF), Mass Median Aerodynamic Distribution (MMAD) and Geometric
Standard Deviation (GSD) (17).
The FPD is the amount of drug present in a prescribed dose that has a size capable
of penetrating the lung during inhalation (e.g. ≤5 µm). The FPF is the FPD that is available
to the patient, so it is expressed as a percentage of the delivered dose (17) (24).
The MMAD and GSD are what determine the site of deposition in the respiratory
tract (2). The MMAD signifies the aerodynamic diameter at which half of the aerosolized
drug mass lies below the stated diameter and is read from the cumulative distribution
curve at the 50% point (25)(26). Taking into account the effects of aerodynamic particle
size on regional lung deposition patterns, it can be seen that a MMAD ≤ 5µm of the
aerosol is desirable, to facilitate predominant deposition targeted to the smaller airways.
Aerosols with larger MMADs will deposit higher in the respiratory tract (6).
GSD is a measure of the variability of the particle diameters within the aerosol and
is calculated from the ratio of the particle diameter at the 84.1% point on the cumulative
distribution curve to the MMAD (26). The larger the GSD, the more sites that the
aerosol will be deposited in the respiratory tract (15)(25). In general, aerosols with GSD
<2 are desirable and ideal, since are a reflex of aerosol particles as close as possible to
monodispersity, which will increase deposition at the desired site of action and
consequently increase the efficacy of the treatment (2).
In pulmonary delivery of pharmaceuticals, aerodynamic size distribution is the
most important parameter affecting aerosol performance. However, it should be noted
that in the FDA guidance document, acceptance criteria expressed in terms of MMAD
and GSD alone (representing the measures of the central tendency and spread,
respectively) are not considered adequate to characterize the particle size distribution
of the whole dose (15).
FDA recommends that the total mass of drug collected on all stages and
accessories (mass balance) should be between 85% and 115% of label claim (LC) on a

Analytical Quality by Design to characterize inhalation products - Chapter I
22
per actuation basis (27). The Pharmacopoeias recommend some commercially available
impactors for the routine testing of OINDPs, including the Next Generation Impactor
(NGI) (17) (19).
Next Generator Pharmaceutical Impactor
The NGI was designed and calibrated by an industry consortium to meet the
specific requirements of the industry for inhaler testing (28)(29)(21). It is a widely used
equipment at inhaler research laboratories because of its flexibility, high performance,
productivity and precision (22).
This CI is calibrated at a flow rate range of 30-100 L/min (with an additional
calibration at 15 L/min for nebulizer applications). It is constituted by seven stages and a
Micro-Orifice Collector (MOC), which allow stage efficiency, accuracy and
reproducibility (19) (22).
The impactor itself comprises just three main parts (Figure 9): a removable cup
tray containing the eight collection cups used to collect the samples prior to analysis;
the bottom frame used to support the cup tray and the lid containing the inter-stage
passageways and the seal body which holds the nozzles in place. The three parts are held
together using the handle clamping mechanism (22)(30).
This design allows minimal particle carryover and low inter-stage wall losses (<5%
on any stage and 5% overall) which ensure good drug recovery (mass balance)
(22)(29)(21).
There are eight nozzle pieces in the NGI, corresponding to seven size-
fractionation stages and a MOC, as can be seen on figure 10 (30).
Figure 9: NGI with three main parts. (17)

Analytical Quality by Design to characterize inhalation products - Chapter I
23
At either end, the NGI has two larger cups, one at the beginning that minimizes
large particle impaction on the stage walls (Stage 1 Cup) and another one, at the end,
that avoids the need for a final filter since it allows capture and analysis of the finest
particles (MOC) (22)(28)(29).
The cut-off diameters for the relevant stages at volumetric flow rates of 15, 30, 60
and 100 L/min are given below on table 1.
The impactor is usually preceded by an entry or induction port (IP, figure 11) to
ensure that the inhaler mouthpiece, which provides an airtight seal between the IP and
the device, is oriented with respect to the NGI station in a fixed horizontal plane, and
to ensure that the aerosol produced is sampled in a consistent manner. The IP also
serves the purpose of mimicking the human oropharyngeal region (17)(22).
A preseparator (PS, figure 11) located immediately after the IP is often needed to
remove particles from the aerosol exiting the IP and to avoid overloading the first stage
(Stage I) (28)(31)(32).
Table 1: Cut-off diameters of NGI stages at different flow rates (17).
Figure 10: Layout of NGI showing size of nozzles on each stage (30).

Analytical Quality by Design to characterize inhalation products - Chapter I
24
To use the NGI station there are some additional equipment necessary, such as:
• Vacuum pumps (figure 12) - draw air at the designated
volumetric flow rate through the system and generates sonic
flow;
• Mouthpiece Adapters (MPA) (figure 13), tubing and quick
release connectors - link the various components of the
system together;
• Critical Flow Controller (figure 14)(33) - generates a
standardized breath profile suitable for the routine testing of
DPIs;
• Flowmeter (figure 15) – measures flow rate (17).
NGI Leak Tester
The seals on CIs can deteriorate with repeated use and exposure to solvent. Since
the system operates under vacuum, a leak allows entrance of air into the system causing
erroneous results due to incorrect flow rates and poor aerodynamic performance.
For this reason, all CIs should be tested on a regular basis to check the integrity
of the sealing system. The most common method used for leak testing is to block the
Figure 11: NGI with IP and PS (17).
Figure 12: Vacuum pump (17).
Figure 13: Examples of mouthpiece adapters for different inhalers (17).
Figure 14: Critical Flow Controller (33).
Figure 15: Flowmeter (17).

Analytical Quality by Design to characterize inhalation products - Chapter I
25
entry to the impactor inlet, generate a vacuum within the impactor using a vacuum
source and then monitor any alteration in pressure using a pressure meter located within
the enclosed system (17) (28).
This method is sensitive, accurate, straightforward and fast. It is ideal for
verification checks during the life of the impactor or as a fast system suitability test
before an impactor is used (17) (28).
Flow rate
Despite the impactors being calibrated at certain air flow rates, the measurements
can be performed at any arbitrary flow rate, defined by the pressure differential over
the inhaler device. For DPI performance evaluation, the pharmacopoeias (United States
and European) recommendations are to set the flow rate through the impactor to
generate a 4 kPa ΔP over the inhaler and a duration consistent with the withdrawal of 4
liters of air from the mouthpiece of the inhaler (19)(15)(29). This generally represents
the approximate ΔP created at the inhaler entry by an adult asthmatic or COPD patient
inhaling deeply (29).
To measure the ΔP created by the air drawn through an inhaler it is necessary to
measure the absolute pressure downstream of the inhaler mouthpiece (see figure 14)
and then this value is compared with atmospheric pressure. The flow rate from the
vacuum pump is afterwards adjusted to produce the required ΔP of 4 kPa and the flow
rate, Q, required to produce this ΔP is measured (17)(22).
Finally, since a stable flow is critical for good impactor measurement practice, it
needs to be controlled. The importance of the flow stability resides in the dependence
between the aerodynamic sizing ability of inertial impactors and the velocity of the air
flow passing through each stage. That velocity is directly related to the volumetric air
flow rate (17).
To validate flow rate stability, it is necessary to check if the critical flow occurs in
the flow control valve. This can be confirmed by measuring the absolute pressure at a
point on either side of the flow control valve (see figure 16) (17)(34). If the pressure
downstream of the valve is less than half of the upstream pressure (P3/P2 ≤ 0.5), critical
flow is assured, and the flow rate can be assumed to be stable (17) (32).
If this criterion cannot be achieved, it is likely that the vacuum pump is worn or is
of insufficient capacity and should be repaired or replaced (17).

Analytical Quality by Design to characterize inhalation products - Chapter I
26
Figure 16: Adaptation of scheme that represents NGI test-setup for DPI testing (34).
API quantification by HPLC
In order to attain the final objectives of NGI method it is necessary to use a HPLC
method able to quantify the API present on the different stages/components.
Liquid Chromatography is the science of separating the chemical compounds
(dissolved in a solvent) that are in the sample. HPLC separation of each chemical entity
from the sample mixture is based on its distinct affinity towards the adsorbent material
in the column (packed with small diameter porous particles) or the mobile phase, causing
various constituents to travel at different velocities and separate (35)(36).
During the run, a pump can deliver a constant mobile phase composition (isocratic)
or a mixed mobile phase composition (gradient). After being injected, the analytes are
pushed through the column by the mobile phase and are detected by a suitable detector
that pass them as a signal to the HPLC software in the computer leading to a
chromatogram (figure 17). The chromatogram allows the identification and
quantification of the different analytes (shown as peaks) (37)(38)(39).
Figure 17: Workflow of an HPLC isocratic system. (37)
Analytical Quality by Design to characterize inhalation products - Chapter I
27
Among the existent separation modes used in chromatography, the most common
is the reversed-phase chromatography because of its versatility. On this separation mode
the column packing is non-polar and the mobile phase is polar which leads to the
retainment of non-polar compounds (38).
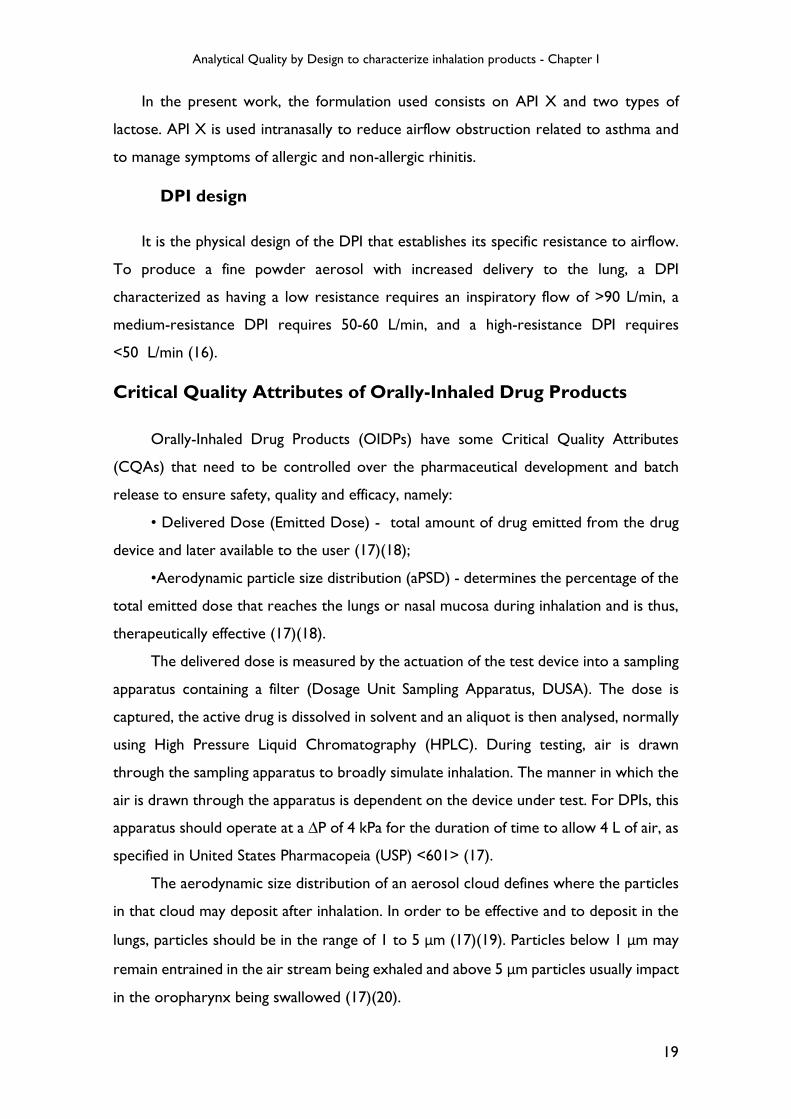
Figure 18 represents a typical chromatographic separation of two substances, 1
and 2. tR1 and tR2 are the respective retention times (RT); h is the height, h/2 is the half-
height, and Wh/2 is the width at half-height, for peak 1. W1 and W2 are the respective
widths of peaks 1 and 2 at the baseline.
In order to make a quantitative assessment of the compound, a sample with a
known amount of the compound of interest is injected and its peak height or peak area
is measured (38).
RT is defined as the time elapsed between the injection of the sample and the
appearance of the maximum peak response of the eluted sample zone. This parameter
may be used for identification since it is a characteristic of each compound. The
coincidence of retention times of a sample and a reference substance can be used as a
partial criterion in construction of an identity profile (39).
System suitability tests are used to verify that the chromatographic system is
adequate for the intended analysis. The tests are based on the concept that the
equipment, electronics, analytical operations, and samples analyzed constitute an integral
system that can be evaluated as such. Factors that may affect chromatographic behavior
include mobile phase, flow rate, column and pressure (39).
Replicate injections of a standard preparation or other standard solutions are
compared to determine precision of the method. Unless otherwise specified in the
individual monograph, data from five replicate injections of the analyte are used to
calculate the relative standard deviation (RSD) (39).
Figure 18: Example of chromatographic separation of two samples (39).

Analytical Quality by Design to characterize inhalation products - Chapter I
28
Variability of Cascade Impaction Measurements
Despite cascade impaction can provide information not always available from other
particle-sizing methods, it can be time consuming and, because it is complex and
expensive to automate remains a largely manual technique, increasing the possibility of
analytical error (40) (41). Since many factors not related to product quality may influence
the CI measurement outcome, this method has long been recognized in the scientific
community as not being very robust (41).
To assure robustness and the desired performance of NGI method, one of the
strategies is the development of the method following the Analytical Quality by Design
(AQbD) approach.
Analytical Quality by Design
The quality by design (QbD) drug development concept has been used by the
pharmaceutical and biopharmaceutical industry over the past decades following the
guidance from International Conference on Harmonization (ICH) (42). According to
ICH Q8 guidelines QbD is “a systematic approach to development that begins with
predefined objectives and emphasizes product and process understanding and process
control, based on sound science and quality risk management” (35). It is widely used by
the pharmaceutical industry to understand the manufacturing process control and drug
product quality (42).
Since analytical methods are used in process development and product quality
control, their level of importance is so high that if they are poor the results can be
inaccurate, resulting in misleading information that may influence the drug development
program (42).
ICH guidelines and the USP highlight the need to manage risk during the complete
method lifecycle. Applying the QbD approach to analytical methods ensures a controlled
risk-based development of a method where quality will be guaranteed (43)(44).
Analytical target profile
In AQbD, the starting point is to define the objectives of the method and analytical
target profile (ATP). Each analytical method should have its objective, for example, to
be used to support research, process and formulation development, or release and

Analytical Quality by Design to characterize inhalation products - Chapter I
29
stability testing for clinical or marketed drugs, quantitative, qualitative, or limit test. ATP
describes the method requirements which are expected to be measured (42).
Since ATP is not linked to any particular method, more than one technique can
satisfy a single ATP (45). Through various tests, the most suitable analytical technique is
chosen and the method can meet the requirements of the intended purpose (42).
Method Design
Method design is a step that allows availability of material (e.g. reagents), sets
various experimental conditions and checks feasibility of instruments. Method
development strategy includes design of experiments (DoE). It is helpful in risk
assessment by acquiring knowledge about existing method and allows for effective
control strategies for critical parameters (46).
Risk Assessment
Risk based approach is based on the ICH guideline Q8 and Q9 (46). When each
analytical step is examined, risk assessment can be performed based on the step’s
criticality and impact, providing the analysts a good understanding of the significance of
each step and effort required for potential laboratory investigations (42).
There are some tools, such as Fishbone diagrams, failure mode and effect analysis
(FMEA), and the prioritization matrix that can help to identify and minimize or avoid
potential risks to the method (47).
FMEA
FMEA is a step-by-step approach for identifying all possible failures in a design,
manufacturing or assembly process, or a product or service.
Actions are prioritized according to how serious the failure consequences are,
how frequently they occur and how easily they can be detected. The purpose of the
FMEA is to take actions to eliminate or reduce failures, starting with the highest-priority
ones.
To perform this type of analysis it is necessary to determine how serious each
effect is - severity rating (S). Severity is usually rated on a scale from 1 to 10, where 1 is
insignificant and 10 is catastrophic.
For each failure mode, the potential root causes must be identified and for each
cause, the probability rating (P) must be determined. This rating estimates the probability
Analytical Quality by Design to characterize inhalation products - Chapter I
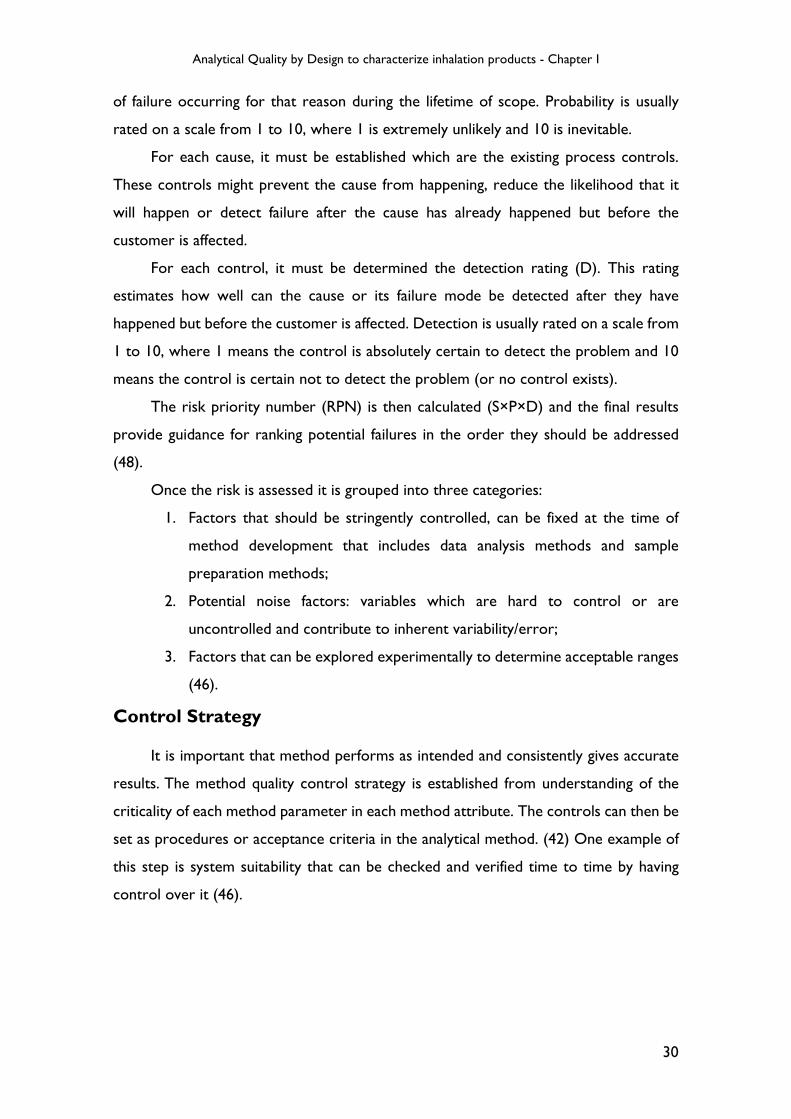
30
of failure occurring for that reason during the lifetime of scope. Probability is usually
rated on a scale from 1 to 10, where 1 is extremely unlikely and 10 is inevitable.
For each cause, it must be established which are the existing process controls.
These controls might prevent the cause from happening, reduce the likelihood that it
will happen or detect failure after the cause has already happened but before the
customer is affected.
For each control, it must be determined the detection rating (D). This rating
estimates how well can the cause or its failure mode be detected after they have
happened but before the customer is affected. Detection is usually rated on a scale from
1 to 10, where 1 means the control is absolutely certain to detect the problem and 10
means the control is certain not to detect the problem (or no control exists).
The risk priority number (RPN) is then calculated (S×P×D) and the final results
provide guidance for ranking potential failures in the order they should be addressed
(48).
Once the risk is assessed it is grouped into three categories:
1. Factors that should be stringently controlled, can be fixed at the time of
method development that includes data analysis methods and sample
preparation methods;
2. Potential noise factors: variables which are hard to control or are
uncontrolled and contribute to inherent variability/error;
3. Factors that can be explored experimentally to determine acceptable ranges
(46).
Control Strategy
It is important that method performs as intended and consistently gives accurate
results. The method quality control strategy is established from understanding of the
criticality of each method parameter in each method attribute. The controls can then be
set as procedures or acceptance criteria in the analytical method. (42) One example of
this step is system suitability that can be checked and verified time to time by having
control over it (46).

Analytical Quality by Design to characterize inhalation products - Chapter I
31
Advantages of AQbD
Implementation of QbD principles allows finding optimal separation conditions for
development of robust analytical methods with fewer method transfer or failures issues
(35).
AQbD is thought as a tool for regulatory flexibility and robust analytics as it
explores scientific understanding in method implementation sequences. It ensures a
controlled risk-based development of the methods where quality assurance will be
guaranteed because working within the Design Space of a specific method can be seen
as an adjustment and not a (post approval) change (44)(49).
Benefits of adopting QbD for analytical method:
• This approach gives greater transfer success when method is transferred from
research level to quality control department;
• It provides a space for invention of new techniques by continuous improvement
throughout life cycle;
• It helps for enhanced understanding of the method;
• Design space concept avoids the post-approval changes which may cause high
costs;
• It provides greater compliance with regulatory authorities (46).

Analytical Quality by Design to characterize inhalation products - Chapter I
32
Objective
The main objective of this work was to develop a NGI method to characterize an
inhalation product using the AQbD approach.
In order to achieve the objective, a group of analysts and laboratory managers that
have experience on NGI methods was reunited. Prior to beginning the development,
the first aim was to perform a risk assessment in order to evaluate the critical steps of
a general NGI method, followed by a FMEA exercise.
Once the FMEA exercise was completed, a workflow was created to summarize the
steps of an NGI method development. Firstly, the parameters of an HPLC method to
quantify the API were assessed. After that, the formulation components as well as the
solvent to recover the API were evaluated. The following step was to define the optimal
number of capsules in order to obtain the proper mass balance and to allow the
quantification of all the NGI components at an amount superior to the method limit of
quantification (LOQ). After the definition of the number of capsules a set of tests was
performed to evaluate the influence of equipment components shaking time and shaking
type during recovery step, on the results obtained.
While performing the development, the API recovery technique, coating agent,
inter-stage losses, mass balance and stability of the solutions were also evaluated.

Chapter II – Materials and Methods

Analytical Quality by Design to characterize inhalation products - Chapter I
34
Materials
Solvents: Milli-Q purified water (H2O), acetonitrile (CH3CN), methanol (MeOH),
ethanol, glacial acetic acid (CH3COOH), phosphoric acid (H3PO4), glycerol 85%;
Reagents: ammonium acetate, sodium dodecyl sulfate (SDS), monobasic
ammonium phosphate;
Standard: API X working standard;
Samples: Hypromellose (HPMC) empty capsules, API X capsules (20mg total mass:
1% API, 89% coarse grade lactose and 10% fine grade lactose);
Software: Copley Inhaler Testing Data Analysis Software (CITDAS) was used for
data calculation;
Equipment: Critical Flow Controller Model TPK 2000 (Copley Scientific), Vacuum
pumps Model HCP5 (Copley Scientific), NGI equipped with IP and PS (Copley Scientific),
Flowmeter Model DFM2000 (Copley Scientific), Gentle Rocker MSP4515 (Copley
Scientific), DUSA shaker (Copley Scientific), collection tubes, Sonic Branson 8510, Leak
test Model 171 (Copley Scientific), Analytical Balance Mettler Toledo, 913 pH meter
(Metrohm), DUSA, DUSA filter (Whatman Glass Microfiber filter 47 mm diameter),
parafilm, MPA, silicone rubber stoppers, DPI’s devices (Plastiape 0111648 – 100 L/min,
0110938 – 60 L/min), HPLC Waters 2487 Dual Wavelength Absorvance Detector.
Methods
Risk Assessment
A team built by analysts and project managers from the development department
with experience on the general NGI method identified six process steps, that were well
defined in the literature (50), relevant to be considered for further studies:
� Method;
� Measurement;
� Machine;
� Material;
� Man;
� Environment.

Analytical Quality by Design to characterize inhalation products - Chapter I
35
After identification of the general parameters, the team elaborated a list of
variables (for each step) that could go wrong and affect the outcomes of the method
(modes of failures).
Once the variables were identified, by use of FMEA, each one was studied in detail
to answer three questions:
� "What are the potential effects on the customer/patient?”;
� “What are the potential causes for the failure?";
� "What are the existing controls that prevent either the failure itself or its causes?".
The answer to these questions joined with the team experience, allowed to rank
the failures based on their severity, probability of occurrence and detection frequency.
At the end of FMEA, it was possible to classify the risk of each failure and to select the
method parameters with higher risks.
In order to understand if FMEA results were capable of improve analytical method
development, it was selected an old method for API quantification that was no longer
used on the routine and it was developed an NGI method. During development, the
higher risk variables identified by FMEA were studied to obtain the ideal conditions for
the method.
Method I for API quantification
Mobile Phase and dissolution mixture
• Mobile Phase: Buffer solution pH 2.7:CH3CN (48:52 v/v)
• Dissolution Mixture – 0.05% H3PO4 in CH3CN:H2O (50:50 v/v)
Standard solution preparation
Standard stock solution A/B (SSSA/SSSB) - weight 40.0 mg of API X standard to a
100 mL volumetric flask. Dilute to volume with dissolution mixture.
� Working Standard A 1 (WSA 1) - 40.0 µg/mL;
� Working Standard A 2 (WSA 2) - 8.0 µg/mL;
� Working Standard A 3 (WSA 3) - 4.0 µg/mL;
� Working Standard A 4 (WSA 4) - 3.0 µg/mL;
� Working Standard A 5 (WSA 5/LOQ) - 1.2 µg/mL;
� Working Standard B (WSB) - 8.0 µg/mL.

Analytical Quality by Design to characterize inhalation products - Chapter I
36
System Suitability
In order to assess HPLC parameters, the operating conditions of Table 2 were
set on the equipment.
Table 2: Operating conditions of HPLC.
Detector Temperature Column Others
278 nm Column Temperature:
25ºC
Symmetry C18
250 mm x 4.6 mm 5 µm
Flow: 2.0 mL/min
Injection Volume: 100 µL
Run Time: 12 min
Program: Isocratic
After setting the operating conditions, the system suitability was evaluated by a
calibration curve and standard repeatability. The main objective of this step was to
understand if the HPLC method was suitable to main peak quantification. At the same
time, linearity and precision of the method were evaluated.
Definition of optimum number of capsules
At this stage, a calculation was performed to define the number of capsules to be
actuated into the NGI equipment to initiate method development.
In order to perform the referred calculation, some factors were considered:
� Number of formulations/dosage strengths that will be tested – 1;
� LOQ concentration of the HPLC – the same as WSA 5 (CWSA5=1.20 µg/mL);
� Lowest recovery volume initially tested – 5 mL;
� Number of components on NGI setup (according to API recovery) – 13
(combination of 7 stages, MOC, PS, IP, MPA, device and capsule).
The formulation that was tested was composed by 1% API and had a 20 mg fill
weight, which means that each capsule had 200 micrograms (µg) of API (LC equals to
200 µg/capsule).
If only one capsule would be actuated and if the dose was fractioned equally among
all the NGI components, then the 200 µg of API would be divided in 13 components,
e.g. approximately 15.4 µg of API per component. Given that these would be diluted in
5 mL (lowest volume initially tested on API recovery), the final concentration of the API
recovered from the component would be approximately 3 µg/mL.

Analytical Quality by Design to characterize inhalation products - Chapter I
37
Considering that LOQ concentration is 1.20 µg/mL, the API concentration would
be higher so the number of capsules to be actuated should be one. Despite the
calculations performed, it is generally known that dose is not equally fractioned among
all the NGI components, so probably some components would have a concentration of
API recovered lower than LOQ. Because of this, on the initial analysis it was tested the
actuation of only one capsule and then the actuation of two capsules.
Method II for API quantification
An alternative method to Method I, taking into account a USP monograph, was
also used to quantify the API.
Mobile phase preparation
Mobile Phase: MeOH:0.01M Monobasic ammonium phosphate buffer pH
3.5:CH3CN (50:35:15 v/v)
Dissolution mixture: equal to method I because API is soluble in it.
Standard solution preparation
The same stock standard solutions presented at method I were used because
dissolution mixture is the same. However, the dilutions performed (presented on the
Results and Discussion chapter) were a result of the areas obtained with the new
operating conditions.
System Suitability
In order to assess HPLC parameters, the operating conditions of Table 3 were set
on the equipment.
Table 3: Operating conditions of HPLC.
Detector Temperature Column Others
239 nm Column Temperature:
40ºC Symmetry C18
250 mm x 4.6 mm 5µm
Flow: 1.5 mL/min Injection Volume: 20 µL
Run Time: 15 min Program: Isocratic

Analytical Quality by Design to characterize inhalation products - Chapter I
38
Recovery Techniques
One of the most important parameters that have to be assessed during the
development is the API recovery technique from the NGI.
The solvent needed to recover all product and therefore API from the NGI stages
and components should be defined and should also take into account the recovery
procedure (e.g. type and time of agitation), the component capacity, the quantitation
method and LOQ.
The same dissolution mixture was used for both reference standards and recovery
of API of NGI components.
To evaluate the volume of recovery solvent needed, a table (Table 4) was
elaborated with a range of volumes that may be added to each component.
Table 4: Range of volumes possible to be tested at recovery procedure.
In the present work the type and time of agitation will be studied according with
Table 5 procedure.
Table 5: Time and type of agitation at the recovery procedure.
Component Shaking
manually Inverting Gentle Rocker Sonication
1 minute
5 minutes
1 minute
5 minutes
5 minutes
10 minutes
5 minutes
10 minutes
IP Yes Yes Yes Yes No No Yes Yes PS Yes Yes Yes Yes No No Yes Yes
Stages No No No No Yes Yes Yes Yes
NGI (stages and components) Volume (mL)
Capsules 10-50 mL Device 10-30 mL MPA 10-20 mL IP 15-50 mL PS 35-200 mL
Stage 1 5-25 mL Stage 2 5-20 mL Stage 3 5-20 mL Stage 4 5-20 mL Stage 5 5-20 mL Stage 6 5-20 mL Stage 7 5-20 mL MOC 5-10 mL

Analytical Quality by Design to characterize inhalation products - Chapter I
39
Coating agent
In order to prevent collection of the particles on the wrong downstream stage a
coating agent was selected.
Since there were a big amount of coating agents that could be used, it was decided
to use the most commonly used in the company, a solution of 1% glycerol in ethanol.
The influence of the coating agent was studied by changing the evaporation time
(5 and 30 minutes) and also by performing an NGI without coating.
Setup of NGI
Prior to initiating NGI test, all the equipment were dried and well cleaned. Then,
a set of cups was coated (all the surface must be covered) with a thin and uniform film.
After ethanol evaporation a leak test was performed before each test. In the leak
test, the initial pressure was 4kPa and the final pressure was recorded after 20 seconds.
The NGI test was only performed when the pressure variation was less than 100 Pa/s.
In order to perform the flow rate setup, PS and IP were assembled on the
impactor. Flow rate setup was conducted with Qtest=100 L/min or Qtest=60 L/min
(depending on the device used). The desired flow rate (±5%) was achieved after
connecting a calibrated flow meter to the IP and adjusting the critical flow controller.
After recording Qtest, P2 and P3, it was evaluated if P3/P2 is ≤ 0.5. If this criterion
passed, the timer in the flow controller was adjusted (t ± 5%) so that the two-way
solenoid valve opened for the necessary duration to draw 4 L of air through the inhaler
for the established flow rate, where:
���� = 4��� × 60���
� �� ��/����
Cascade impaction testing and sample recovery
The NGI test began with the addition of 15 mL of dissolution mixture to the PS.
Then, the flow controller was adjusted to run the test, selecting x shots (correspondent
to x capsules), with t seconds actuation. After inserting the capsule on the device, it was
punctured to allow powder distribution. The device was attached to the inlet of the
mouthpiece adapter and connected to the IP. Only after those steps the vacuum pump
was switched on to draw air for t seconds. The following procedure, used for samples
preparation, was based on the recovery of the API at the 13 components (figure 19).

Analytical Quality by Design to characterize inhalation products - Chapter I
40
Figure 19: Recovery procedure for API extraction.
Stability of standards and sample solutions
Additionally, it was decided to study the solutions’ stability. The solutions
(standards and samples in recovery matrix on coated stages) were injected 24 (T24 h)
and 48 hours (T48 h) after the first injection on HPLC (T0 h). Thermal stability was also
studied since the solutions were stored at T2-8ºC and at the autosampler (at room
temperature).
Since volume of sample solutions was not enough, stability at room temperature
after 48h was not studied.
To evaluate the results obtained, the following equation was used to evaluate the
% of difference between T0, T24 h and T48 h:
% ���������� =|����inicial � ����T24h/48h |
����inicial
× 100

Analytical Quality by Design to characterize inhalation products - Chapter I
41
Chapter III - Results and Discussion
Analytical Quality by Design to characterize inhalation products - Chapter I
42
Risk Assessment
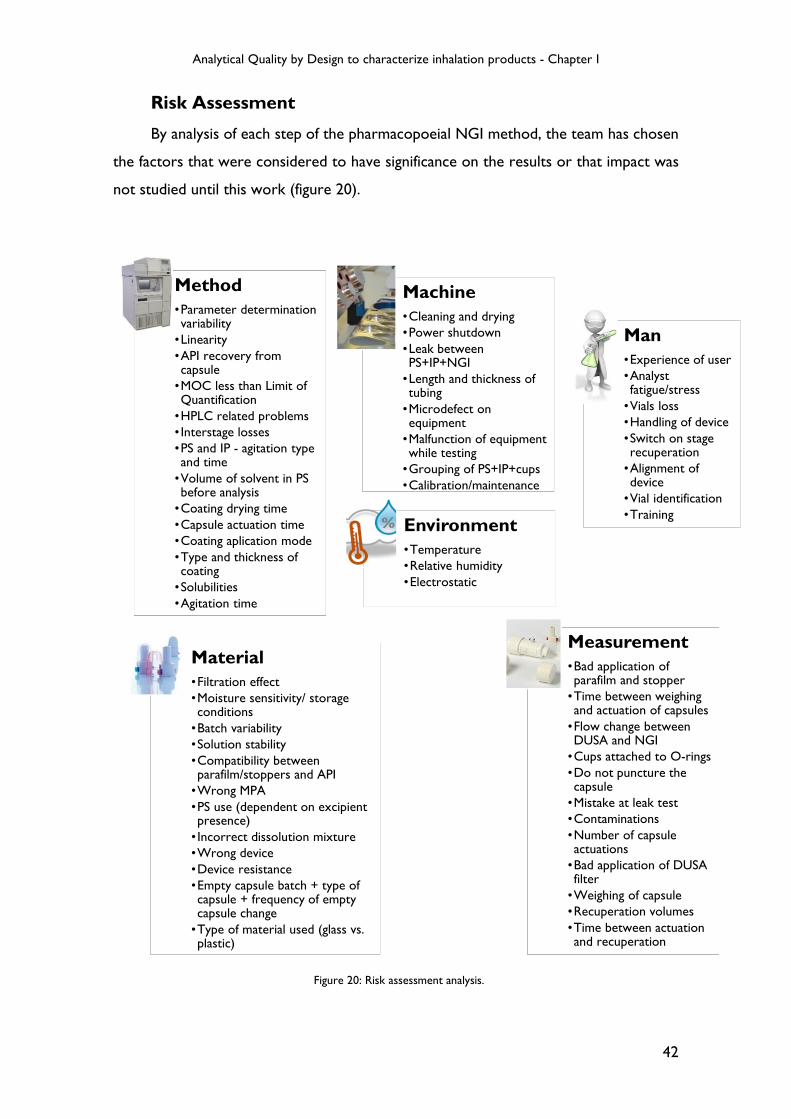
By analysis of each step of the pharmacopoeial NGI method, the team has chosen
the factors that were considered to have significance on the results or that impact was
not studied until this work (figure 20).
Figure 20: Risk assessment analysis.
Method•Parameter determination variability•Linearity•API recovery from capsule•MOC less than Limit of Quantification•HPLC related problems• Interstage losses•PS and IP - agitation type and time•Volume of solvent in PS before analysis•Coating drying time•Capsule actuation time•Coating aplication mode•Type and thickness of coating•Solubilities•Agitation time
Measurement•Bad application of parafilm and stopper•Time between weighing and actuation of capsules•Flow change between DUSA and NGI•Cups attached to O-rings•Do not puncture the capsule•Mistake at leak test•Contaminations•Number of capsule actuations•Bad application of DUSA filter•Weighing of capsule•Recuperation volumes•Time between actuation and recuperation
Machine•Cleaning and drying•Power shutdown•Leak between PS+IP+NGI•Length and thickness of tubing•Microdefect on equipment•Malfunction of equipment while testing•Grouping of PS+IP+cups•Calibration/maintenance
Material•Filtration effect•Moisture sensitivity/ storage conditions•Batch variability•Solution stability•Compatibility between parafilm/stoppers and API•Wrong MPA•PS use (dependent on excipient presence)• Incorrect dissolution mixture•Wrong device•Device resistance•Empty capsule batch + type of capsule + frequency of empty capsule change•Type of material used (glass vs. plastic)
Man•Experience of user•Analyst fatigue/stress•Vials loss•Handling of device•Switch on stage recuperation•Alignment of device•Vial identification•Training
Environment•Temperature•Relative humidity•Electrostatic

Analytical Quality by Design to characterize inhalation products - Chapter I
43
FMEA
After performing the risk assessment analysis (figure 20), each potential failure was classified based on severity, probability and detection
rate. Table 6 presents the critical attributes with RPN higher than 100, which require study or a corrective action.
Table 6: Critical attributes identified by FMEA that require study or a corrective action.
Process Failures Classification (before corrections)
Process Steps Mode
"What could go wrong?"
S
Severity (1-10)
If ≥ 9 Act!
P Probability (1-10)
If ≥ 7 and S ≥7 Act!
D Detection (1-10)
Risk Priority Number (RPN) RPN = P x S x D If ≥ 100 Act!
Method
Interstage losses 7 4 6 168
Type and time of agitation for PS and IP 6 4 8 192
Coating drying time 6 7 5 210
Type and thickness of coating 7 7 6 294
Agitation time 7 7 7 343
Measurement Contaminations 8 8 3 192
Time between capsule actuation and API recovery 7 7 7 343
Environment
Temperature 7 8 7 392
Relative humidity 7 8 7 392
Electrostatic 6 7 7 294
Machine Leak between PS, IP and NGI 6 3 6 108
Length/ thickness of tubing 3 8 5 120
Material Moisture sensitivity/ storage conditions 7 8 5 280

Analytical Quality by Design to characterize inhalation products - Chapter I
44
By analysis of table 6, the majority of the factors identified should be stringently
controlled and can be fixed at the time of method development. However, there are
some noise factors, like contamination and the time between capsule actuation and API
recovery that are hard to control and contribute to inherent variability of the
measurement.
The potential failures related to environment can be explored experimentally to
determine acceptable ranges, but in the present work they were not studied, as these
should be studied along with the formulation development work.
The critical attributes related to the machine can be controlled by performing a
leak test before each analysis and by homogenizing the tubing for all NGI stations. At
last there are the factors related to the moisture used, which can be controlled by
studying the formulation and its ideal storage conditions.
At the end of the FMEA, it was decided that only the critical attributes related to
the method were going to be studied. To understand the impact of each attribute, the
method development was divided in several sequential and individual steps leading to a
final method.
All the present work was based on the study of the critical attributes, such as
agitation time (of all the NGI components), type and thickness of coating and its drying
time. Additionally, at the end of this work it is expected to optimize steps in order to
have full knowledge of the method and to make its development easier.
Method I
System suitability
In order to begin the experiment, a system suitability was performed to evaluate
the precision and linearity of the HPLC method already existent. After preparation of
SSSA, SSSB and respective dilutions, a linear regression was performed. As it can be seen
on graphic 1, concentration of solutions was set as the independent variable and peak
areas as the dependent ones.

Analytical Quality by Design to characterize inhalation products - Chapter I
45
By analysis of graphic 1, it can be verified that the method has a good linearity.
System precision was evaluated by analyzing %RSD of WSB five injections (present on
table 7).
Table 7: WSB five injections - peak areas, RT and %RSD (Method I).
At table 7 can be verified that the method has a good precision, since the % of
RSD obtained through the five injections of WSB was 1.0% on peak area and 0.03% on
retention time of main peak.
The final criteria to evaluate if system was able to realize a proper quantification
of API is the D-Check between standards (WSA 2 and WSB average). This parameter is
obtained by the following equation:
� � ℎ��" =#$�%&'� &%�& ()*
()# + ,�&- &%�&×
(�.'/ )))#
(�.'/ )))*× 100
Peak Area RT (min)
1st injection 10245 5.758
2nd injection 10071 5.757
3th injection 10173 5.756
4th injection 10361 5.759
5th injection 10217 5.760
Average 10213 5.758
%RSD 1.0 0.03
y = 1 280,64x - 127,84
R² = 1,00
0
10000
20000
30000
40000
50000
60000
0,00 5,00 10,00 15,00 20,00 25,00 30,00 35,00 40,00 45,00
Pe
ak
are
a
Concentration (µg/mL)
Calibration Curve - WSA
Graphic 1: Calibration curve of WSA with equation chart and coefficient of determination (r2).
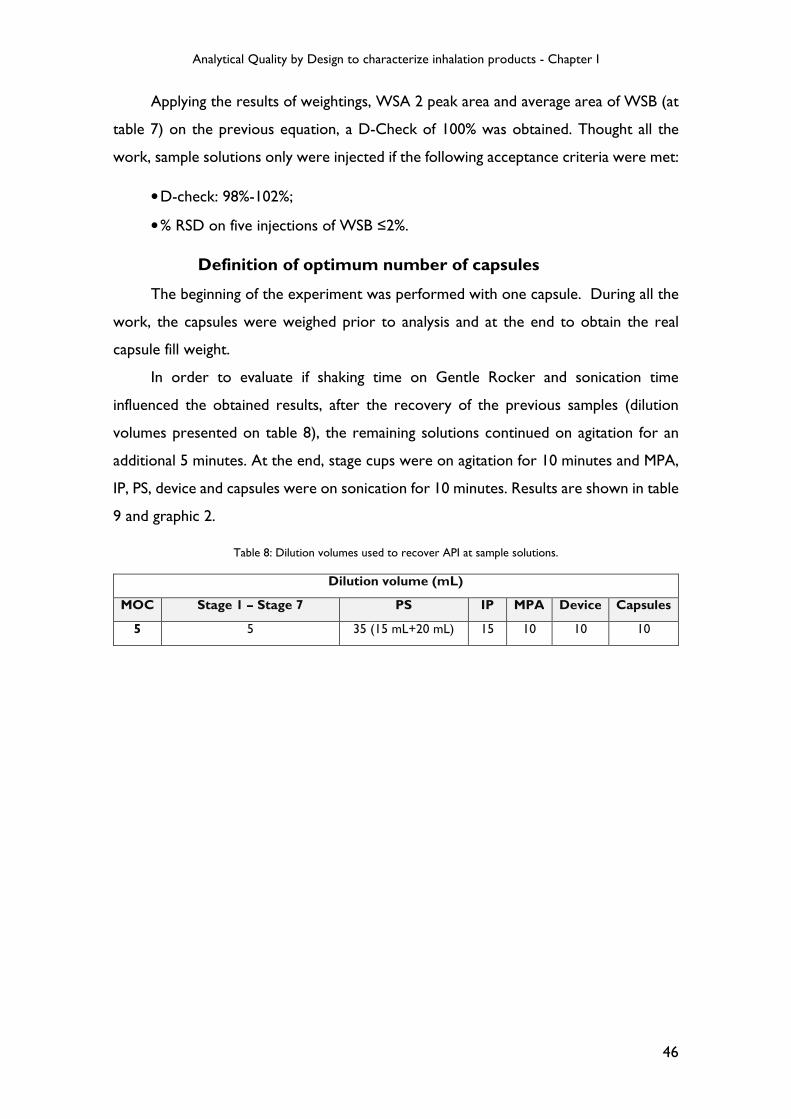
Analytical Quality by Design to characterize inhalation products - Chapter I
46
Applying the results of weightings, WSA 2 peak area and average area of WSB (at
table 7) on the previous equation, a D-Check of 100% was obtained. Thought all the
work, sample solutions only were injected if the following acceptance criteria were met:
• D-check: 98%-102%;
• % RSD on five injections of WSB ≤2%.
Definition of optimum number of capsules
The beginning of the experiment was performed with one capsule. During all the
work, the capsules were weighed prior to analysis and at the end to obtain the real
capsule fill weight.
In order to evaluate if shaking time on Gentle Rocker and sonication time
influenced the obtained results, after the recovery of the previous samples (dilution
volumes presented on table 8), the remaining solutions continued on agitation for an
additional 5 minutes. At the end, stage cups were on agitation for 10 minutes and MPA,
IP, PS, device and capsules were on sonication for 10 minutes. Results are shown in table
9 and graphic 2.
Table 8: Dilution volumes used to recover API at sample solutions.
Dilution volume (mL)
MOC Stage 1 – Stage 7 PS IP MPA Device Capsules
5 5 35 (15 mL+20 mL) 15 10 10 10

Analytical Quality by Design to characterize inhalation products - Chapter I
47
Table 9: Results of NGI with one capsule - Gentle Rocker/ Sonication 5 and 10 minutes (Method I).
Concentration (µg/mL) Mass (µg/capsule)
Agitation time 5’ 10’ 5’ 10’
MOC < LOQ < LOQ 0.000 0.000
Stage 7 < LOQ < LOQ 0.000 0.000
Stage 6 < LOQ < LOQ 0.000 0.000
Stage 5 1.950 2.187 9.752 10.935
Stage 4 3.250 3.846 16.249 19.228
Stage 3 3.156 3.600 15.781 17.998
Stage 2 2.962 3.526 14.812 17.631
Stage 1 1.336 2.039 6.680 10.193
PS 2.113 2.086 73.951 72.994
IP 1.326 1.274 19.887 19.114
MPA < LOQ < LOQ 0.000 0.000
Device 1.997 1.962 19.965 19.622
Capsules < LOQ < LOQ 0.000 0.000
Mass balance (%LC) 88.538 93.858
Aerodynamic properties
ED (µg) 157.112 168.093
FPD (µg) 52.251 60.349
FPF (%) 33.257 35.902
MMAD (µm) 2.597 2.692
GSD 2.011 2.128
Graphic 2: Deposition profile comparison between API recovered after 5 and 10 minutes.
By analysis of table 9 and graphic 2, it can be seen that the mass obtained on the
stages increased from 5 minutes of agitation on Gentle Rocker to 10 minutes. The
0,0
10,0
20,0
30,0
40,0
50,0
60,0
70,0
80,0
Mass (µg/caps)
NGI Component
Deposition profile
Recovery at 5 minutes
Recovery at 10 minutes

Analytical Quality by Design to characterize inhalation products - Chapter I
48
aerodynamic properties presented in table 9 showed a difference in terms of FPD and
FPF which means that the particles with a cut-off lower than 5µm had a higher mass
when the stages were on agitation 10 minutes instead of 5.
These results showed that 5 minutes of agitation on Gentle Rocker were not
enough to fully dissolution of the particles on the recovery solvent. So, from this point
forward all the samples were recovered after 10 minutes of agitation/sonication.
Despite the mass balance was in accordance with the recommendation of FDA,
some stages (stage 6, 7 and MOC) did not have a concentration higher than LOQ
suggesting that the number of capsules actuated was not enough.
Since the dilution volume used was already low (and could not be lower), two
experiments with 2 and 3 capsules were performed (results are shown on table 10 and
graphic 3).
Table 10: Results of the NGIs performed with 2 and 3 capsules (Method I).
Concentration (1) (µg/mL) Mass (µg/capsule)
Number of capsules 2 capsules 3 capsules 2 capsules 3 capsules
MOC < LOQ < LOQ 0.000 0.000
Stage 7 < LOQ < LOQ 0.000 0.000
Stage 6 < LOQ 2.591 0.000 4.319
Stage 5 2.667 5.192 6.667 8.653
Stage 4 7.086 12.467 17.714 20.779
Stage 3 6.387 12.565 15.967 20.942
Stage 2 6.362 10.875 15.902 18.126
Stage 1 3.171 7.113 7.926 11.856
PS 3.418 6.045 59.820 70.521
IP 2.718 4.123 20.383 20.615
MPA < LOQ < LOQ 0.000 0.000
Device 41.776 47.975 208.878 159.916
Capsules 2.047 2.427 10.237 8.091
Mass balance (%LC) 181.749 171.909
Aerodynamic properties
ED (µg) 144.382 175.811
FPD (µg) 51.741 67.547
FPF (%) 35.836 38.420
MMAD (µm) 2.722 2.626
GSD 2.020 2.184
y=1194.82x+247.75 (r2=1)

Analytical Quality by Design to characterize inhalation products - Chapter I
49
Graphic 3: Comparison between the deposition profile of NGI performed with 2 and 3 capsules.
Evaluating the previous results of table 10 and graphic 3, it can be seen that the
peak of device had a concentration much higher than what was expected (when
compared to table 9 and graphic 2). The cause of this unexpected result can be the
interference of the plastic material of the device.
Despite the abnormal mass balance result, the aerodynamic properties obtained
are not dependent of the device mass result. So, by comparison of the FPD and FPF, it
can be verified that the NGI performed with 3 capsules had, as expected, higher values
than the NGI performed with 2 capsules. Despite the higher mass on the main stages of
the NGI, stages like MOC, stage 7 and stage 6 (with lower cut-off diameters) still not
presented a peak with concentration higher than LOQ.
To investigate the root cause of the abnormal area obtained at the device peak
(see table 10) a new device without the capsule was placed into a beaker and 10 mL of
dissolution mixture were added. The beaker was agitated and an aliquot was transferred
to a HPLC vial. This procedure was repeated with the only difference being the
sonication of the device during 10 minutes.
0,0
50,0
100,0
150,0
200,0
250,0
Mass (µg/caps)
NGI Component
Deposition profile
NGI with 2 capsules
NGI with 3 capsules
Figure 21: Overlay of the chromatograms obtained by injecting device with API (dark line), device without API sonicated 10 minutes (pink line) and device without API and without sonication (blue line).
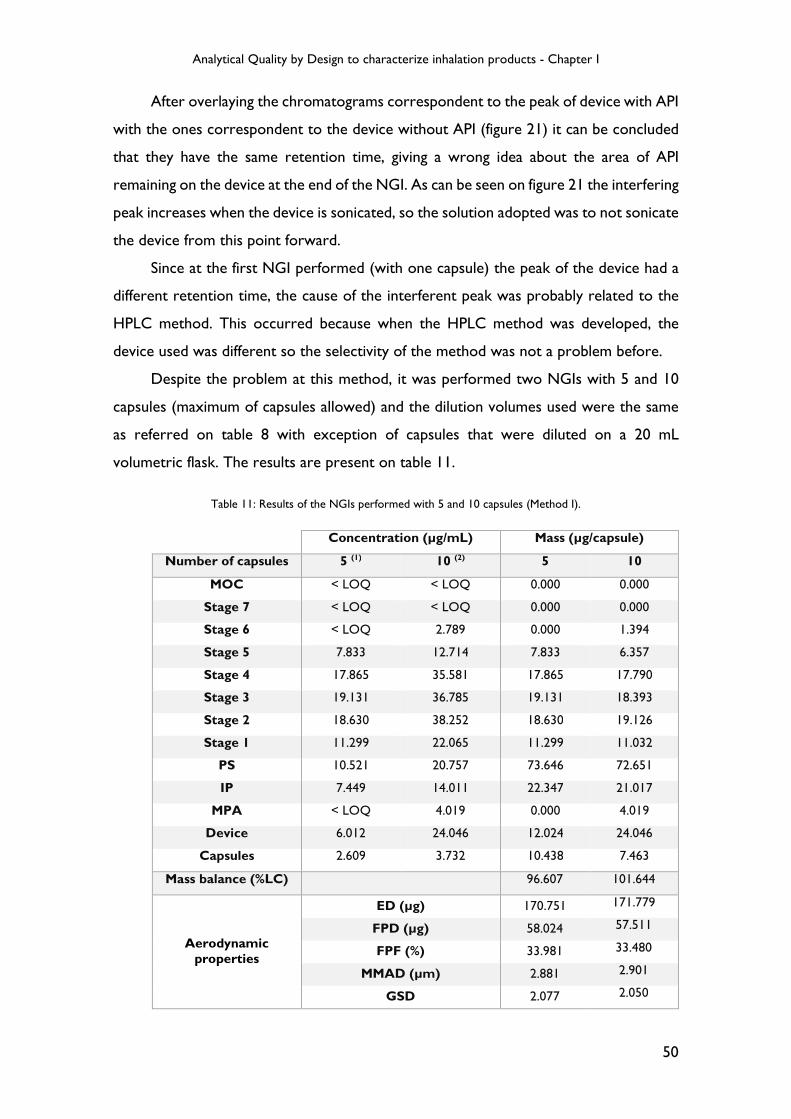
Analytical Quality by Design to characterize inhalation products - Chapter I
50
After overlaying the chromatograms correspondent to the peak of device with API
with the ones correspondent to the device without API (figure 21) it can be concluded
that they have the same retention time, giving a wrong idea about the area of API
remaining on the device at the end of the NGI. As can be seen on figure 21 the interfering
peak increases when the device is sonicated, so the solution adopted was to not sonicate
the device from this point forward.
Since at the first NGI performed (with one capsule) the peak of the device had a
different retention time, the cause of the interferent peak was probably related to the
HPLC method. This occurred because when the HPLC method was developed, the
device used was different so the selectivity of the method was not a problem before.
Despite the problem at this method, it was performed two NGIs with 5 and 10
capsules (maximum of capsules allowed) and the dilution volumes used were the same
as referred on table 8 with exception of capsules that were diluted on a 20 mL
volumetric flask. The results are present on table 11.
Table 11: Results of the NGIs performed with 5 and 10 capsules (Method I).
Concentration (µg/mL) Mass (µg/capsule)
Number of capsules 5 (1) 10 (2) 5 10
MOC < LOQ < LOQ 0.000 0.000
Stage 7 < LOQ < LOQ 0.000 0.000
Stage 6 < LOQ 2.789 0.000 1.394
Stage 5 7.833 12.714 7.833 6.357
Stage 4 17.865 35.581 17.865 17.790
Stage 3 19.131 36.785 19.131 18.393
Stage 2 18.630 38.252 18.630 19.126
Stage 1 11.299 22.065 11.299 11.032
PS 10.521 20.757 73.646 72.651
IP 7.449 14.011 22.347 21.017
MPA < LOQ 4.019 0.000 4.019
Device 6.012 24.046 12.024 24.046
Capsules 2.609 3.732 10.438 7.463
Mass balance (%LC) 96.607 101.644
Aerodynamic properties
ED (µg) 170.751 171.779
FPD (µg) 58.024 57.511
FPF (%) 33.981 33.480
MMAD (µm) 2.881 2.901
GSD 2.077 2.050

Analytical Quality by Design to characterize inhalation products - Chapter I
51
As it can be seen on table 11, even with the maximum number of capsules a
concentration higher than LOQ was not obtained in some components. Since method I
was not suitable for routine analysis due to its lack of selectivity and specificity, method
II was selected to evaluate if the problems presented at the device injections continued
to occur.
Method II
The same vials of standards and samples (correspondent to the NGI performed
with 10 capsules which results were presented on table 11) were re-injected on the
HPLC with the operating conditions of method II and its correspondent mobile phase.
Results are present at table 12.
Table 12: Results of the re-injection of standards and samples correspondent to NGI performed with 10 capsules. (Method II)
At table 12, it can be seen that the correlation coefficient obtained was 1, which
means that this method also has a good linearity. By injection of five WSB, a %RSD of
(1) y=1267.66x+274.05 R2=1
(2) y=1276.61x+31.24 R2=1
Concentration (1) (µg/mL) Mass (µg/capsule)
MOC < LOQ 0.000
Stage 7 < LOQ 0.000
Stage 6 3.9405 1.970
Stage 5 18.0747 9.037
Stage 4 14.1534 7.077
Stage 3 5.0346 2.517
Stage 2 < LOQ 0.000
Stage 1 2.3289 1.164
PS 30.1896 105.664
IP 20.4980 30.747
MPA 5.5468 5.547
Device 11.9800 11.980
Capsules 5.4623 10.925
Mass balance (%LC) 93.314
(1) y=23453.15x+3859.38 (r2=1)

Analytical Quality by Design to characterize inhalation products - Chapter I
52
0.7% on peak area and 0.2% on retention time was obtained, indicating a good precision
of the method.
Since the retention time of API X changed in the new method used, the problems
at the device injection (due to the interference peak) disappeared, as it can be seen on
figure 22, which means that Method II has a good selectivity.
Also, with the new method it can be observed big differences on the
chromatograms obtained. The differences consist essentially on a better baseline (with
less noise) and a better resolution of the API X peak on solutions with a smaller
concentration (see figure 23).
Figure 22: Overlay of chromatogram obtained by injection of device with API (NGI with 10 capsules) and without API (Method II).
Figure 23: Chromatograms obtained by injection of WSA 5 with method I and method II.
Method I
Method II
API X
API X
API X

Analytical Quality by Design to characterize inhalation products - Chapter I
53
System Suitability
At evaluation of the results obtained with method II a change on LOQ
concentration was considered in order to decrease the area obtained and the number
of capsules used at the NGI. The following new dilutions of the stock standard solutions
were performed:
� Working Standard A 1 (WSA 1) - 20.0 µg/mL;
� Working Standard A 2 (WSA 2) – 4.0 µg/mL;
� Working Standard A 3 (WSA 3) - 2.0 µg/mL;
� Working Standard A 4 (WSA 4) - 0.6 µg/mL;
� Working Standard A 5 (WSA 5) - 0.16 µg/mL;
� Working Standard A 6 (WSA 6/LOQ) - 0.08 µg/mL;
� Working Standard B (WSB) - 4.0 µg/mL.
Definition of optimum number of capsules
At table 12 it can be seen that with 10 capsules discharged, the API X
concentration on the various components of the NGI is too high for the new calibration
curve. Two experiments with 2 and 5 capsules were performed in order to evaluate the
difference between them. The recovery procedure was made after 10 minutes of
agitation and sonication and the dilution volumes used were the same as referred on
table 8. The results are shown on table 13.
Table 13: Results of the NGI performed with 2 and 5 capsules (Method II).
Concentration (1) (µg/mL) Mass (µg/capsule)
Number of capsules 2 caps 5 caps 2 caps 5 caps
MOC < LOQ < LOQ 0.000 0.000
Stage 7 0.107 0.890 0.267 0.890
Stage 6 0.838 1.946 2.094 1.946
Stage 5 2.214 6.046 5.536 6.046
Stage 4 6.641 15.977 16.602 15.977
Stage 3 6.728 19.327 16.821 19.327
Stage 2 7.292 18.233 18.229 18.233
Stage 1 3.786 11.151 9.465 11.151
PS 4.451 11.714 77.889 81.996
IP 2.893 7.017 21.698 21.052
MPA 0.751 1.336 3.755 2.671

Analytical Quality by Design to characterize inhalation products - Chapter I
54
By evaluating table 13 it can be seen that for both experiments, MOC has a
concentration bellow LOQ while all other components have a similar mass per capsule.
With the results obtained, was observed that the number of capsules did not have a
major influence in the concentration of API X on MOC. Also, by comparison of
aerodynamic properties, all the parameters have very similar results which led to the
decision that from this point forward, the number of capsules to be tested with method
II is 2.
Influence of shaking time and type
Until this step of the work the recovery procedure of IP and PS was made by
shaking them manually during 1 minute. To evaluate if shaking time and type have
influence on the result obtained three additional experiments were performed (shaking
manually 5 minutes, inverting 1 minute and inverting 5 minutes). The results can be seen
on table 14.
Table 14: Results of the NGIs performed with different type and time of shaking (Method II).
Device 2.405 5.657 12.025 11.315
Capsules 1.303 3.834 6.515 7.667
Total mass (µg/capsule) 189.881 197.986
Mass balance (%LC) 95.448 99.136
Aerodynamic properties
ED (µg) 171.534 179.068
FPD (µg) 54.121 56.937
FPF (%) 31.551 31.797
MMAD (µm) 2.865 2.901
GSD 2.006 2.072
y=23486.20x+2638.11 (r2=1)
Concentration (1)
(µg/mL) Mass (µg/capsule)
Type and time of shaking Shake
5min
Invert
1min
Invert
5min Shake 5min
Invert
1min
Invert
5min
MOC <LOQ <LOQ <LOQ 0.000 0.000 0.000
Stage 7 0.372 0.308 0.225 0.931 0.769 0.563
Stage 6 1.111 0.764 0.971 2.779 1.911 2.426
Stage 5 2.134 2.382 2.183 5.336 5.956 5.458
Stage 4 6.202 5.968 5.700 15.506 14.920 14.250
Stage 3 6.571 6.420 6.133 16.427 16.049 15.333
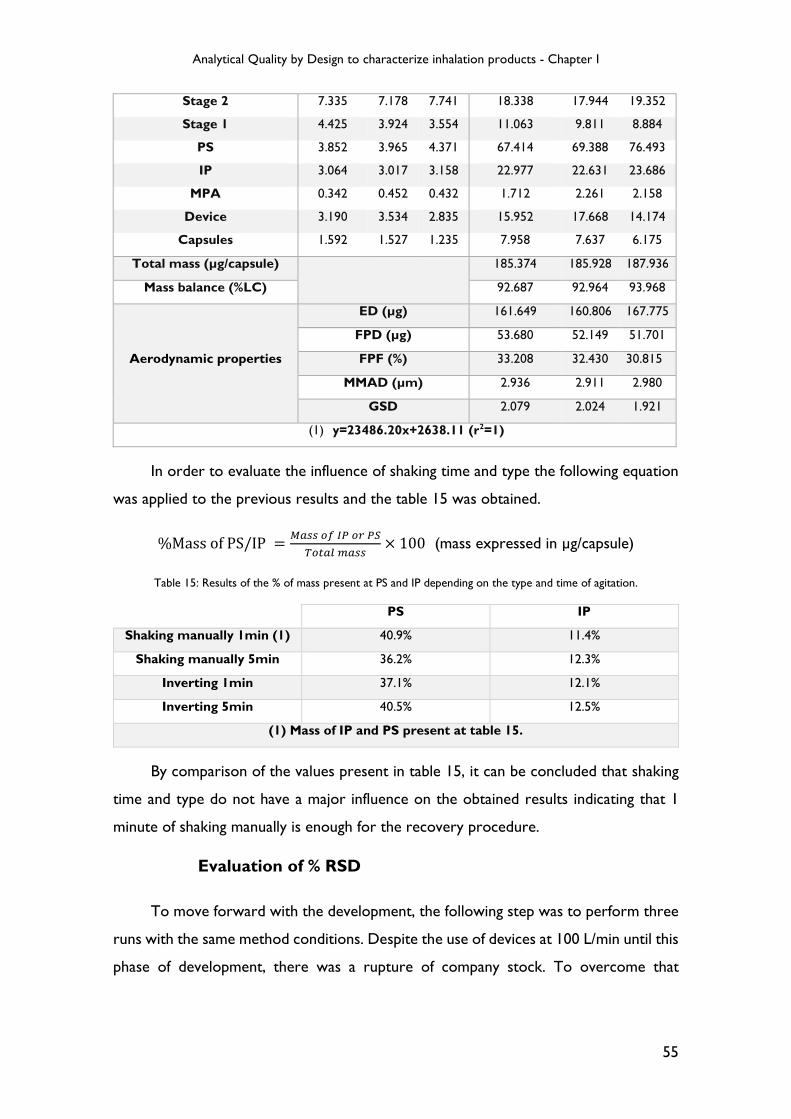
Analytical Quality by Design to characterize inhalation products - Chapter I
55
In order to evaluate the influence of shaking time and type the following equation
was applied to the previous results and the table 15 was obtained.
%Mass of PS/IP =8&�� 9: ;< 9% <)
=9 &> ?&��× 100 (mass expressed in µg/capsule)
Table 15: Results of the % of mass present at PS and IP depending on the type and time of agitation.
PS IP
Shaking manually 1min (1) 40.9% 11.4%
Shaking manually 5min 36.2% 12.3%
Inverting 1min 37.1% 12.1%
Inverting 5min 40.5% 12.5%
(1) Mass of IP and PS present at table 15.
By comparison of the values present in table 15, it can be concluded that shaking
time and type do not have a major influence on the obtained results indicating that 1
minute of shaking manually is enough for the recovery procedure.
Evaluation of % RSD
To move forward with the development, the following step was to perform three
runs with the same method conditions. Despite the use of devices at 100 L/min until this
phase of development, there was a rupture of company stock. To overcome that
Stage 2 7.335 7.178 7.741 18.338 17.944 19.352
Stage 1 4.425 3.924 3.554 11.063 9.811 8.884
PS 3.852 3.965 4.371 67.414 69.388 76.493
IP 3.064 3.017 3.158 22.977 22.631 23.686
MPA 0.342 0.452 0.432 1.712 2.261 2.158
Device 3.190 3.534 2.835 15.952 17.668 14.174
Capsules 1.592 1.527 1.235 7.958 7.637 6.175
Total mass (µg/capsule)
185.374 185.928 187.936
Mass balance (%LC) 92.687 92.964 93.968
Aerodynamic properties
ED (µg) 161.649 160.806 167.775
FPD (µg) 53.680 52.149 51.701
FPF (%) 33.208 32.430 30.815
MMAD (µm) 2.936 2.911 2.980
GSD 2.079 2.024 1.921
(1) y=23486.20x+2638.11 (r2=1)

Analytical Quality by Design to characterize inhalation products - Chapter I
56
problem, devices of the same brand (Plastiape) at 60 L/min were tested and the results
are present on table 16.
Table 16: Results of the three runs performed at the same conditions.
As it can be seen in table 16, despite the use of a different device, mass balance
continues to be in accordance with acceptance criteria defined on the USP and the
aerodynamic properties are quite similar to those verified with 100 L/min devices.
Table 17: %RSD of APSD parameters obtained by CITDAS software.
%RSD
ED (µg) FPD (µg) FPF (%) MMAD (µm) GSD
0.98 1.65 0.94 0.80 1.47
Concentration (1) (µg/mL) Mass (µg/capsule)
Run #1 Run #2 Run #3 Run #1 Run #2 Run #3
MOC <LOQ <LOQ <LOQ 0.000 0.000 0.000
Stage 7 0.136 0.196 0.363 0.339 0.490 0.908
Stage 6 0.884 0.918 0.703 2.209 2.294 1.756
Stage 5 3.533 3.127 3.931 8.832 7.817 9.827
Stage 4 8.275 8.481 7.760 20.687 21.202 19.401
Stage 3 7.348 6.862 6.592 18.371 17.154 16.481
Stage 2 4.837 4.647 4.954 12.094 11.618 12.386
Stage 1 2.159 2.051 2.186 5.398 5.127 5.465
PS 3.975 3.962 3.867 69.558 69.335 67.668
IP 2.356 2.471 2.261 17.668 18.535 16.957
MPA 0.493 0.587 0.623 2.465 2.936 3.113
Device 3.772 3.212 3.178 18.860 16.059 15.888
Capsules 1.255 1.368 1.188 6.276 6.841 5.941
Mass balance
(%LC) 91.379 89.703 87.895
Aerodynamic
properties
ED (µg) 157.230 156.113 153.568
FPD (µg) 53.363 51.789 51.360
FPF (%) 33.939 33.174 33.445
MMAD (µm) 2.952 2.896 2.915
GSD 1.985 2.008 2.056
(1) y=30329.37x+1914.27 (r2=1)

Analytical Quality by Design to characterize inhalation products - Chapter I
57
In table 17 are presented the results of RSD % between the three runs. All the
results are inferior to 20% (the initial acceptance criteria defined) which means that the
method has a good repeatability.
Evaluation of coating influence
The following step was the evaluation of coating influence on particle size
distribution. Until this point the coating used was always the same (1% glycerol in
ethanol) and since its thickness was a difficult parameter to control, the evaluation was
performed by changing the time necessary for ethanol evaporation. Three NGIs were
performed: without coating, 5 minutes after coating application and 30 minutes after
coating application.
Results are presented in table 18 and the deposition profile of the NGI stages are
present in graphic 4.
Table 18: Results of the tests performed without coating and with different coating evaporation times (5 and 30 minutes).
Concentration (µg/mL) Mass (µg/capsule)
Without
Coating (1)
Coating
5 min (1)
Coating
30 min (2)
Without
Coating
Coating
5 min
Coating
30 min
MOC 0.149 <LOQ <LOQ 0.373 0.000 0.000
Stage 7 0.275 0.252 0.197 0.688 0.630 0.492
Stage 6 0.950 0.847 1.050 2.374 2.118 2.625
Stage 5 3.531 3.410 3.095 8.827 8.526 7.738
Stage 4 7.090 7.143 8.139 17.725 17.858 20.348
Stage 3 5.256 6.045 7.534 13.141 15.113 18.834
Stage 2 4.026 4.155 5.512 10.065 10.389 13.781
Stage 1 2.269 2.305 2.301 5.672 5.762 5.752
PS 3.952 4.067 4.344 69.167 71.178 76.025
IP 2.945 3.192 2.507 22.090 23.942 18.803
MPA 0.972 0.429 0.581 4.859 2.145 2.903
Device 1.569 3.864 2.927 7.846 19.321 14.634
Capsules 1.139 1.271 1.414 5.696 6.355 7.069
Mass balance
(%LC) 84.261 91.669 94.502
Aerodynamic
properties
ED (µg) 154.981 157.838 167.103
FPD (µg) 45.533 46.837 53.593
FPF (%) 29.380 29.674 32.072
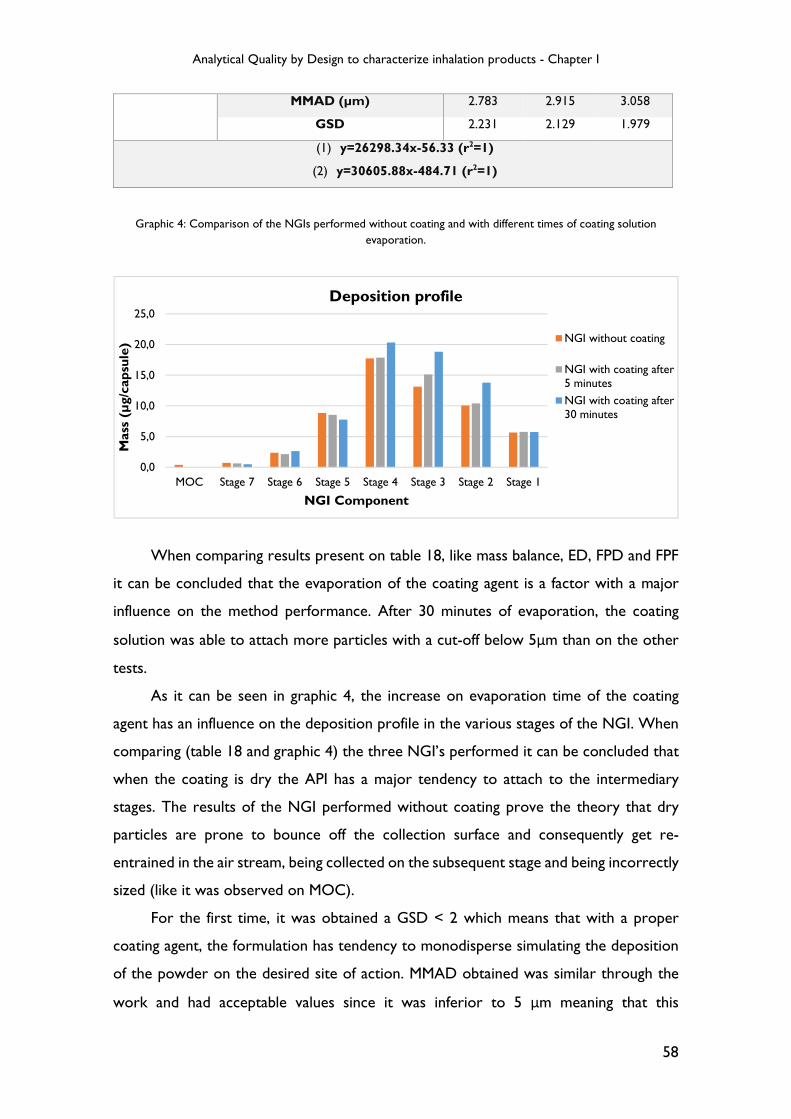
Analytical Quality by Design to characterize inhalation products - Chapter I
58
Graphic 4: Comparison of the NGIs performed without coating and with different times of coating solution evaporation.
When comparing results present on table 18, like mass balance, ED, FPD and FPF
it can be concluded that the evaporation of the coating agent is a factor with a major
influence on the method performance. After 30 minutes of evaporation, the coating
solution was able to attach more particles with a cut-off below 5µm than on the other
tests.
As it can be seen in graphic 4, the increase on evaporation time of the coating
agent has an influence on the deposition profile in the various stages of the NGI. When
comparing (table 18 and graphic 4) the three NGI’s performed it can be concluded that
when the coating is dry the API has a major tendency to attach to the intermediary
stages. The results of the NGI performed without coating prove the theory that dry
particles are prone to bounce off the collection surface and consequently get re-
entrained in the air stream, being collected on the subsequent stage and being incorrectly
sized (like it was observed on MOC).
For the first time, it was obtained a GSD < 2 which means that with a proper
coating agent, the formulation has tendency to monodisperse simulating the deposition
of the powder on the desired site of action. MMAD obtained was similar through the
work and had acceptable values since it was inferior to 5 µm meaning that this
MMAD (µm) 2.783 2.915 3.058
GSD 2.231 2.129 1.979
(1) y=26298.34x-56.33 (r2=1)
(2) y=30605.88x-484.71 (r2=1)
0,0
5,0
10,0
15,0
20,0
25,0
MOC Stage 7 Stage 6 Stage 5 Stage 4 Stage 3 Stage 2 Stage 1
Mass (µg/capsule)
NGI Component
Deposition profile
NGI without coating
NGI with coating after5 minutes
NGI with coating after30 minutes

Analytical Quality by Design to characterize inhalation products - Chapter I
59
formulation with the device in study has a predominant deposition on the smaller
airways.
In order to evaluate the presence of wall losses, an additional test was added at
the end of the NGI. That test consists of recovering the remaining API present in the
interstage. To perform the recovery of interstage nozzles, a new set of cups without
coating was introduced and the interstage used on the NGI test was detached. Then, 15
mL of dissolution mixture were added over stage 1 of interstage to remove any API
present in the nozzles and the solution collected in the cup was used to wash the
remaining stages of the interstage. The final solution present in the MOC was injected
in the HPLC and compared with the other NGIs with different coating evaporation
times.
On table 19, we can evaluate the interstage wall losses on each of the NGI
performed.
Table 19: Results of interstage wall losses without coating solution and with different evaporation times when the solution was present.
By analyzing table 19, it can be concluded that all the NGIs had interstage wall
losses inferior to 5% (when compared with the total mass per capsule), that is in line
with USP requirements and ensure a proper mass balance. Since this parameter had an
acceptable result, the coating agent used is suitable for the API in use.
Stability of standards and sample solutions
To obtain additional information about the standards and samples solutions, a
thermal-stability was performed and the results are presented in tables 20 and 21,
respectively.
Interstage Wall Losses
Without coating Coating 5min Coating 30min
3.597 µg/capsule (2.13%) 1.760 µg/capsule (0.96%) 3.194 µg/capsule (1.69%)

Analytical Quality by Design to characterize inhalation products - Chapter I
60
Table 20: Stability results of standard solutions.
By analysis of table 20, it can be concluded that according with the company
acceptance criteria (% difference between T0 and Tx less or equal than 2% with
exception of LOQ which criteria is 30% instead of 2%), standard solutions are stable for
24 hours at room temperature conditions and 48 hours when stored at T2-8ºC.
Table 21: Stability results of sample solutions.
T0 h T24 h (T2-8ºC) T48 h (T2-8ºC)
T24 h (room
temperature)
Area Area % Difference Area % Difference Area % Difference
WSA 6 2820 2725 3.4% 2493 11.6% 2514 10.9%
WSA 5 5040 5145 2.1% 4942 1.9% 5001 0.8%
WSA 4 18310 18386 0.4% 18178 0.7% 18334 0.1%
WSA 3 58909 59071 0.3% 57583 2.3% 58448 0.8%
WSA 2 121923 123159 1.0% 120361 1.3% 121986 0.1%
WSA 1 612681 615876 0.5% 601155 1.9% 606273 1.0%
T0 h T24 h (T2-8ºC) T48 h (T2-8ºC)
T24 h (room
temperature)
Area Area % Difference Area % Difference Area % Difference
MOC 838 857 2,3% 892 6,4% 800 4,5%
Stage 7 5533 5512 0,4% 5371 2,9% 5422 2,0%
Stage 6 31648 32268 2,0% 31703 0,2% 31670 0,1%
Stage 5 94246 93312 1,0% 93410 0,9% 93963 0,3%
Stage 4 248624 248151 0,2% 246427 0,9% 247875 0,3%
Stage 3 230088 227536 1,1% 226192 1,7% 227942 0,9%
Stage 2 168225 166601 1,0% 165245 1,8% 166236 1,2%
Stage 1 69933 70457 0,7% 70602 1,0% 70200 0,4%

Analytical Quality by Design to characterize inhalation products - Chapter I
61
By analyzing table 21, it can be concluded that sample solutions have a validity of
24 hours when stored at room temperature or at T2-8ºC.
Final considerations
During method development, using AQbD approach, it is important to understand
which are the critical process steps that need to be controlled and monitored.
Using AQbD approach on this work, it was possible to optimize the initial
development steps, preventing the study of one factor at a time in the future, saving time
and material resources.
At figure 24, it can be seen the fundamental steps that are essential on a NGI
method development. As an additional step, it was established that content uniformity
of capsules should also be studied during NGI method development, helping in
understanding the product/formulation variability.
Table 22 is a result of the AQbD approach and summarizes the optimized
instructions to perform each step of the process.
Figure 24: Summary of the fundamental steps necessary to develop a NGI method.
HPLC method selectivity
Content uniformity
Define number
of capsules
Test NGI
Test shaking time and type
Evaluate
% RSD
Test coating parameters and wall losses
Final NGI
method
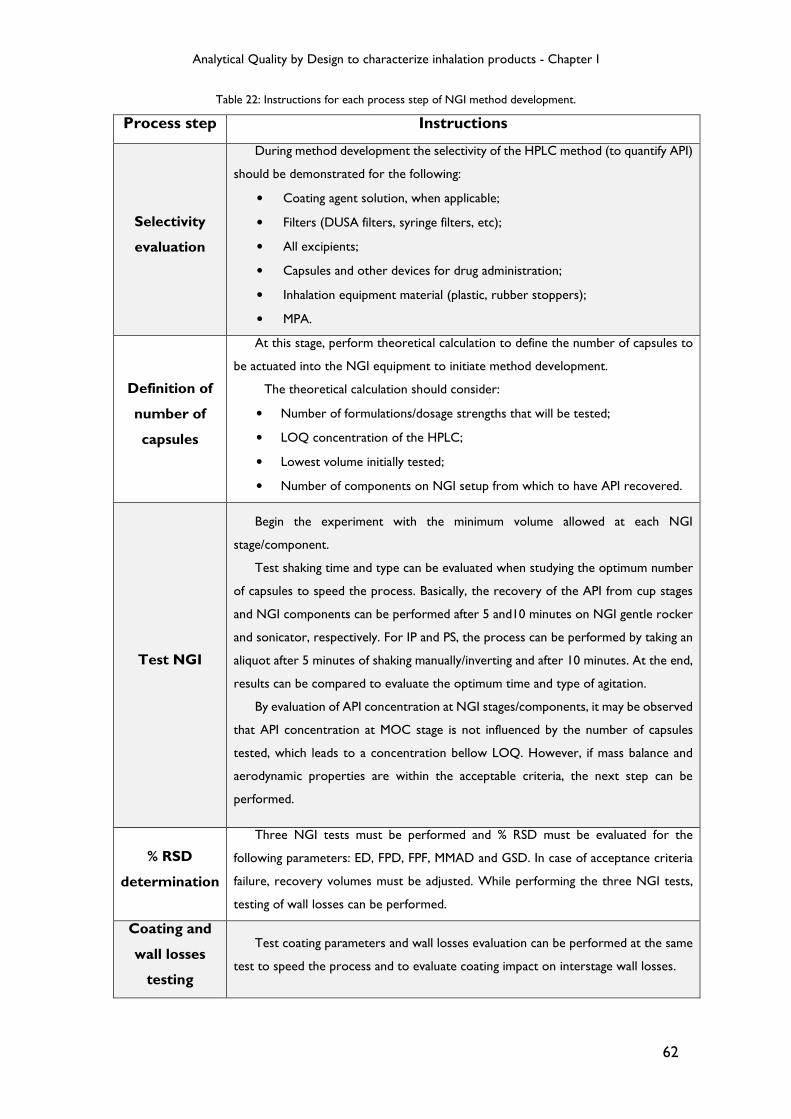
Analytical Quality by Design to characterize inhalation products - Chapter I
62
Table 22: Instructions for each process step of NGI method development.
Process step Instructions
Selectivity
evaluation
During method development the selectivity of the HPLC method (to quantify API)
should be demonstrated for the following:
• Coating agent solution, when applicable;
• Filters (DUSA filters, syringe filters, etc);
• All excipients;
• Capsules and other devices for drug administration;
• Inhalation equipment material (plastic, rubber stoppers);
• MPA.
Definition of
number of
capsules
At this stage, perform theoretical calculation to define the number of capsules to
be actuated into the NGI equipment to initiate method development.
The theoretical calculation should consider:
• Number of formulations/dosage strengths that will be tested;
• LOQ concentration of the HPLC;
• Lowest volume initially tested;
• Number of components on NGI setup from which to have API recovered.
Test NGI
Begin the experiment with the minimum volume allowed at each NGI
stage/component.
Test shaking time and type can be evaluated when studying the optimum number
of capsules to speed the process. Basically, the recovery of the API from cup stages
and NGI components can be performed after 5 and10 minutes on NGI gentle rocker
and sonicator, respectively. For IP and PS, the process can be performed by taking an
aliquot after 5 minutes of shaking manually/inverting and after 10 minutes. At the end,
results can be compared to evaluate the optimum time and type of agitation.
By evaluation of API concentration at NGI stages/components, it may be observed
that API concentration at MOC stage is not influenced by the number of capsules
tested, which leads to a concentration bellow LOQ. However, if mass balance and
aerodynamic properties are within the acceptable criteria, the next step can be
performed.
% RSD
determination
Three NGI tests must be performed and % RSD must be evaluated for the
following parameters: ED, FPD, FPF, MMAD and GSD. In case of acceptance criteria
failure, recovery volumes must be adjusted. While performing the three NGI tests,
testing of wall losses can be performed.
Coating and
wall losses
testing
Test coating parameters and wall losses evaluation can be performed at the same
test to speed the process and to evaluate coating impact on interstage wall losses.
Analytical Quality by Design to characterize inhalation products - Chapter I
63
Chapter IV - Conclusion

Analytical Quality by Design to characterize inhalation products - Chapter I
64
The present study was based on the development of an NGI method to characterize
one inhalation product using the AQbD approach.
At the beginning of the work, was performed a risk assessment to evaluate the
critical steps of the method, followed by a FMEA. The results obtained allowed to select
a group of variables with higher risk associated to the method, like: agitation time,
presence of interstage losses, type and thickness of coating as well as its drying time.
When HPLC parameters were assessed it was found that, despite being linear and
precise, the first selected method for quantification of the API was not selective due to
the presence of interfering peaks on the device. A backup method was then used and
the results showed a good linearity, precision, selectivity and repeatability.
During the definition of the optimum number of capsules, it was verified that all the
stages and other components had a concentration able to be quantified (with
concentration higher than LOQ) with exception of MOC. Since MOC is the stage with
a lower cut-off diameter, is easy to understand that the particles have more difficulty to
reach it.
By performing a series of tests to evaluate the influence of shaking time and type it
can be concluded that the agitation of cup stages on Gentle Rocker and the time of
sonication had a major influence on the results. However, the tests performed with
different agitation times and types of PS and IP had results quite similar, meaning that
the impact of agitation on these components was insignificant.
To evaluate the influence of coating agent, three tests were performed and it can
be concluded that in its absence the particles tend do deposit on the wrong stage due
to rebounce effect. It was also concluded that a longer evaporation time of the coating
agent had advantages on the aerodynamic properties obtained, like higher ED and FPD
values. Also, at study of inter-stage losses, the NGI performed without coating was the
one that presented higher losses. This can be easily explained since without coating,
particles have higher difficulty to attach to the cup stages, being accumulated on the
interstage nozzles. However, it can be concluded that the coating agent chosen was
appropriate to the API in study since the acceptance criteria defined by the USP (inter-
stage losses inferior to 5%) was fulfilled.
Mass balance is also an important factor for the regulatory authorities and by
performing an analysis of all the results, it can be concluded that the results fulfill the

Analytical Quality by Design to characterize inhalation products - Chapter I
65
acceptance criteria with exception of the test performed without coating agent
(%LC<85%).
At the end, stability of the solutions and uniformity of delivered dose were assured.
Despite it was proven that the capsules used through all the work had a uniform content,
delivered dose was lower than what was expected indicating that the adhesion
properties of the powder influence the results obtained.
The method development steps were simplified and optimized. An example of this
optimization was on the evaluation of agitation time by performing a single test but
recovering the samples at different times of agitation.
It can be concluded that, development of a method with AQbD has many advantages
since it increases the robustness and the understanding of the method. However, it may
be of interest to study the impact of environmental conditions on the results obtained.
Although the objective was achieved, NGI methods continue to have many
procedural steps that are dependent on the analyst, which may contribute to variability.
A way to reduce this is the semi-automation of the process by acquiring, for example, a
NGI coater (standardizes amount, uniformity and method of application of coating agent)
and a NGI assistant (places a known quantity of solvent in each cup, gently agitates the
contents in order to dissolve the active drug in solvent and then places a representative
sample of solution from each of the cups into HPLC vials).

Analytical Quality by Design to characterize inhalation products - Chapter I
66
Chapter V – Bibliography

Analytical Quality by Design to characterize inhalation products - Chapter I
67
1. NEGRO, R. - Dry powder inhalers and the right things to remember: a concept
review. Multidiscip Respir Med [Internet]. 10 (2015). Available at 12/09/2018
from: http://www.mrmjournal.com/content/10/1/13
2. IBRAHIM, M.; VERA, R.; CONTRERAS, L. - Inhalation drug delivery devices:
technology update. Med Devices (Auckl) [Internet]. 8 (2015) 131–9. Available at
12/09/2018 from:
http://www.ncbi.nlm.nih.gov/pubmed/25709510%5Cnhttp://www.pubmedcentral.
nih.gov/articlerender.fcgi?artid=PMC4334339
3. HAUGHNEY, J. [et.al] - Choosing inhaler devices for people with asthma:
Current knowledge and outstanding research needs. Respiratory Medicine CME
[Internet]. 3 (2010) 125–31. Available at 12/09/2018 from:
http://dx.doi.org/10.1016/j.rmed.2010.04.012
4. CHRYSTYN, H.; PRICE, D. - Not all asthma inhalers are the same: Factors to
consider when prescribing an inhaler. Primary Care Respiratoy Journal [Internet].
18 (2009) 243–9. Available at 12/09/2018 from:
http://dx.doi.org/10.4104/pcrj.2009.00029
5. Respiratory Tract [Internet]. Available at 12/09/2018 from:
http://textflow.mheducation.com/figures/1259116115/mck54615_2301_lg.jpg
6. HILLERY, A.; PARK, K. - Drug Delivery: Fundamentals and Applications.
2nd edition. (2017).
7. PATTON, J.; BYRON, P. - Inhaling medicines: Delivering drugs to the body
through the lungs. Nature Reviews Drug Discovery. 6 (2007) 67–74.
8. DUJOVNY, G. - Capsule-Based Dry Powder Inhalers, an Optimal Solution for
Different Inhalation Rates. Qualicaps. (2016).
9. HEYDER, J. Deposition of Inhaled Particles in the Human Respiratory Tract and
Consequences for Regional Targeting in Respiratory Drug Delivery. Proceeding
of the American Thoracic Society [Internet]. 1 (2004) 315–20. Available at
12/09/2018 from: http://pats.atsjournals.org/cgi/doi/10.1513/pats.200409-046TA
10. Nebulizer [Internet]. Available at 12/09/2018 from:
https://www.google.pt/url?sa=i&rct=j&q=&esrc=s&source=images&cd=&cad=rja

Analytical Quality by Design to characterize inhalation products - Chapter I
68
&uact=8&ved=2ahUKEwidi9iIwrbdAhUBdxoKHRTpA_YQjRx6BAgBEAU&url=h
ttps%3A%2F%2Fwww.qoo10.sg%2Fitem%2FPORTABLE-ULTRASONIC-
NEBULIZER-HANDHELD-NEBULISER-
RESPIRATOR%2F408699724&psig=AOvVaw0xjetPxXcOBcPBrpgU8ioc&ust=15
36877787615704
11. Pressurized Metered Dose Inhaler [Internet]. Available at 12/09/2018 from:
https://www.google.pt/url?sa=i&rct=j&q=&esrc=s&source=images&cd=&cad=rja
&uact=8&ved=2ahUKEwivjqWZwrbdAhWxzYUKHe4BCGEQjRx6BAgBEAU&u
rl=http%3A%2F%2Fwww.pharmtech.com%2Fqbd-method-development-
approach-generic-pmdi&psig=AOvVaw1Dxo6f-
lyqObl8RysNESWC&ust=1536877823504580
12. Dry powder inhaler [Internet]. Available at 12/09/2018 from:
https://www.google.pt/url?sa=i&rct=j&q=&esrc=s&source=images&cd=&cad=rja
&uact=8&ved=2ahUKEwjcsfHFwbbdAhWnzYUKHSUcDdsQjRx6BAgBEAU&url
=https%3A%2F%2Fwww.webpackaging.com%2Fen%2Fportals%2Frpcplastiape%2
Fassets%2F11023860%2Fthe-rs01-monodose-dry-powder-inhaler-from-
plastiape%2F&psig=AOvVaw3ROmebT_vDSqcWM8SeQBpt&ust=15368776320
85300
13. GARDENHIRE, D. [et.al] - A guide to aerosol delivery devices for
respiratory therapy. American Association for Respiratory Care [Internet]. 3rd
edition. (2013) 10-27. Available at 12/09/2018 from:
http://www.irccouncil.org/newsite/members/aerosol_guide_rt.pdf
14. PENG, T. [et.al] - Influence of physical properties of carrier on the performance
of dry powder inhalers. Acta Pharmaceutica Sinica B. 6 (2016) 308–18.
15. SHEKUNOV, B. [et.al] - Particle size analysis in pharmaceutics: Principles,
methods and applications. Pharmaceutical Research. 24 (2007) 203–27.
16. LAVORINI, F.; PISTOLESI, M.; USMANI, O. - Recent advances in capsule-based
dry powder inhaler technology. Multidiscipiplinary Respiratory Medicine. 12
(2017) 1–7.
17. Copley Scientific. Quality Solutions for Inhaler Testing. (2015). 1-132.
Available at 12/09/2018 from:

Analytical Quality by Design to characterize inhalation products - Chapter I
69
http://www.copleyscientific.com/files/ww/brochures/Inhaler%20Testing%20Broch
ure%202015_Rev4_Low%20Res.pdf
18. RISSLER, J.; ASKING, L.; DREYER, J. - A Methodology to Study Impactor Particle
Reentrainment and a Proposed Stage Coating for the NGI. Journal of Aerosol
Medicine and Pulmonary Drug Delivery [Internet]. 22 (2009) 309–16. Available at
12/09/2018 from: http://www.liebertonline.com/doi/abs/10.1089/jamp.2008.0735
19. YOSHIDA, H. [et.al] - Comparison of Aerodynamic Particle Size Distribution
Between a Next Generation Impactor and a Cascade Impactor at a Range of Flow
Rates. AAPS PharmSciTech [Internet]. 18 (2017) 646–53. Available at 12/09/2018
from: http://link.springer.com/10.1208/s12249-016-0544-9
20. BOER, A. [et.al] - Characterization of inhalation aerosols: A critical evaluation of
cascade impactor analysis and laser diffraction technique. International Journal of
Pharmaceutics. 249 (2002) 219–31.
21. MARPLE, V. [et.al] - Next generation pharmaceutical impactor (a new impactor
for pharmaceutical inhaler testing). Part I: Design. Journal of Aerosol Medicine. 16
(2003) 283–99.
22. Convention USP - Inhalation and nasal drug products: aerosols, sprays, and
powders - performance quality test [Internet]. U.S. Pharmacopoeia-National
Formulary. USP 38 NF 33. (2015) 388. Available at 12/09/2018 from:
http://www.drugfuture.com/Pharmacopoeia/usp38/data/v38332/usp38nf33s2_c60
1.html#usp38nf33s2_c601
23. COPLEY, M. - Improving Inhaled Product Testing: Methods for Obtaining Better
In vitro-In vivo Relationships [Internet]. Pharmaceutical Technology. 2013.
Available at 12/09/2018 from: http://www.pharmtech.com/improving-inhaled-
product-testing-methods-obtaining-better-vitro-vivo-relationships
24. TAKI, M. [et.al] - Aerodynamic deposition of combination dry powder inhaler
formulations in vitro: A comparison of three impactors. International Journal of
Pharmaceutics. 388 (2010) 40–51.
25. SHETH, P.; STEIN, S.; MYRDAL, P. - Factors Influencing Aerodynamic Particle Size
Distribution of Suspension Pressurized Metered Dose Inhalers. AAPS

Analytical Quality by Design to characterize inhalation products - Chapter I
70
PharmSciTech [Internet]. 16 (2015) 192–201. Available at 12/09/2018 from:
http://link.springer.com/10.1208/s12249-014-0210-z
26. COLOMBO, P.; TRAINI, D.; BUTTINI, F. - Inhalation drug delivery:
Techniques and Products. John Wiley & Sons. (2012) 1-216.
27. FDA - Guidance for Industry - Nasal Spray and Inhalation Solution, Suspension,
and Spray Drug Products. (2002). [Internet]. Available at 12/09/2018 from:
https://www.fda.gov/downloads/drugs/guidancecomplianceregulatoryinformation/
guidances/ucm070575.pdf
28. NICHOLS, S. [et.al] - Good Cascade Impactor Practice (GCIP) and
Considerations for “In-Use” Specifications. AAPS PharmSciTech [Internet]. 14
(2013) 375–90. Available at 12/09/2018 from:
http://link.springer.com/10.1208/s12249-012-9905-1
29. COPLEY, M. - Cascade impactors enter a new decade. Manufacturing Chemist.
78 (2007) 45–7.
30. MSP Corporation - Next Generation Impactor (NGI) User Guide. NGI-
0170-6001 Revision C (2008) 1-75.
31. MITCHELL, J.; NEWMAN, S.; CHAN, H. - In vitro and in vivo aspects of cascade
impactor tests and inhaler performance: a review. AAPS PharmSciTech [Internet].
8 (2007) 110. Available at 12/09/2018 from:
http://www.pubmedcentral.nih.gov/articlerender.fcgi?artid=2750696&tool=pmce
ntrez&rendertype=abstract
32. MOHAMMED, H. [et.al] - Effect of Sampling Volume on Dry Powder Inhaler
(DPI)-Emitted Aerosol Aerodynamic Particle Size Distributions (APSDs)
Measured by the Next-Generation Pharmaceutical Impactor (NGI) and the
Andersen Eight-Stage Cascade Impactor (ACI). AAPS PharmSciTech [Internet].
13 (2012) 875–82. Available at 12/09/2018 from:
http://www.springerlink.com/index/10.1208/s12249-012-9797-0
33. Critical Flow Controller [Internet]. Available at 12/09/2018 from:
https://www.wotol.com/images/thumbs/800x800/1548320_b8c4657c60727b294
86ea539312f012a.jpg
Analytical Quality by Design to characterize inhalation products - Chapter I
71
34. Test set-up for DPI [Internet]. Available at 12/09/2018 from: http://alfresco.ubm-
us.net/alfresco_images/pharma/2014/08/20/2a4ca75d-d6a5-4c99-ad90-
9d3d2f8fc7c3/i1.gif
35. SAHU, P. [et.al] - An overview of experimental designs in HPLC method
development and validation [Internet]. Journal of Pharmaceutical and Biomedical
Analysis. Elsevier (2017) 1-62. Available at 12/09/2018 from:
http://dx.doi.org/10.1016/j.jpba.2017.05.006
36. PERAMAN, R. [et.al] - Analytical Quality by Design Approach in RP-HPLC
Method Development for the Assay of Etofenamate in Dosage Forms. Indian
Journal of Pharmaceutical Sciences [Internet]. 77 (2015) 751–7. Available at
12/09/2018 from: http://www.ncbi.nlm.nih.gov/pmc/articles/PMC4778236/
37. SIRARD, T. - Fundamentals of HPLC. Waters (2012). Available at 12/09/2018
from:
http://www.waters.com/webassets/cms/events/docs/FundamentalsofHPLCWebin
ar_TRS_102012.pdf
38. Agilent Technologies Incorporated - Basics Fundamentals of Liquid Fundamentals
of High Performance Liquid Chromatography. HPLC Basics. (2012) 1–37.
39. United States Pharmacopeia Convention - Chromatography. USP. 40-NF 35
(2017) 1–12.
40. Copley Scientific - Refining inhaled product testing: A review. (2005) 1–8.
[Internet]. Available at 12/09/2018 from: http://www.oindpnews.com/wp-
content/uploads/2011/03/Refining-inhaled-product-testing-A-Review.pdf
41. BONAM, M. [et.al] - Minimizing Variability of Cascade Impaction Measurements
in Inhalers and Nebulizers. AAPS PharmSciTech [Internet]. 9 (2008) 404–13.
Available at 12/09/2018 from: http://link.springer.com/10.1208/s12249-008-9045-
9
42. KOCHLING, J. [et.al] - A platform analytical quality by design (AQbD) approach
for multiple UHPLC-UV and UHPLC-MS methods development for protein
analysis. Journal of Pharmaceutical and Biomedical Analysis [Internet]. 125 (2016)
130–9. Available at 12/09/2018 from: http://dx.doi.org/10.1016/j.jpba.2016.03.031
Analytical Quality by Design to characterize inhalation products - Chapter I
72
43. HUBERT, C. [et.al] - Towards a full integration of optimization and validation
phases: An analytical-quality-by-design approach. Journal of Chromatography A
[Internet]. 139 (2015) 88–98. Available at 12/09/2018 from:
http://dx.doi.org/10.1016/j.chroma.2015.03.059
44. ZHANG, X.; CHANGQIN, H. - Application of quality by design concept to
develop a dual gradient elution stability-indicating method for cloxacillin forced
degradation studies using combined mixture-process variable models. Journal of
Chromatography A [Internet]. 1514 (2017) 44–53. Available at 12/09/2018 from:
http://linkinghub.elsevier.com/retrieve/pii/S0021967317310634
45. CHATTERJEE, S. - QbD Considerations for Analytical Methods: FDA Perspective.
IFPAC Annual Meeting. (2013). Available at 12/09/2018 from:
http://qbdworks.com/wp-content/uploads/2014/06/AnalyticalQbDIFPAC.pdf
46. SANGSHETTI, J. [et.al] - Quality by design approach: Regulatory need. Arabian
Journal of Chemistry [Internet]. 10 (2017) S3412–25. Available at 12/09/2018
from: http://linkinghub.elsevier.com/retrieve/pii/S1878535214000288
47. VOGT, F.; KORD, A. - Development of Quality-By-Design Analytical Methods.
Journal of Pharmaceutical Sciences. 100 (2011) 797-812.
48. TAGUE, N. - Failure mode and effects analysis [Internet]. The Quality Toolbox.
ASQ Quality Press. 2nd Edition. 2004. 236–40. Available at 12/09/2018 from:
http://asq.org/learn-about-quality/process-analysis-tools/overview/fmea.html
49. SCHMIDT, A.; MOLNÁR, I. - Using an innovative Quality-by-Design approach for
development of a stability indicating UHPLC method for ebastine in the API and
pharmaceutical formulations. Journal of Pharmaceutical and Biomedical Analysis
[Internet]. 78 (2013) 65–74. Available at 12/09/2018 from:
http://dx.doi.org/10.1016/j.jpba.2013.01.032
50. DAS, P.; MAITY, A. - Analytical Quality by Design (AQbD): A New Horizon For
Robust Analytics in Pharmaceutical Process and Automation. 5 (2017) 324–37.