Embed Size (px)
Citation preview

IT & DATA MANAGEMENT RESEARCH,INDUSTRY ANALYSIS & CONSULTING
Analytics in the CloudBy John Myers An ENTERPRISE MANAGEMENT ASSOCIATES® (EMA™) End-User Research Report
January 2015
This research has been sponsored by:

Table of Contents
©2015 Enterprise Management Associates, Inc. All Rights Reserved. | www.enterprisemanagement.com
Analytics in the Cloud
1. Executive Summary ...................................................................................................................... 11.1. Key Findings ........................................................................................................................ 2
2. Business Intelligence and Analytics in the Cloud .......................................................................... 32.1. Cloud-based Strategy and Maturity...................................................................................... 42.2. Mature Features and Functions ............................................................................................ 62.3. Importance of Security ......................................................................................................... 72.4. Capital Budgets and Operational Expense ........................................................................... 9
3. Survey Demographics ................................................................................................................. 123.1. Role and Department ......................................................................................................... 123.2. Company Size .................................................................................................................... 143.3. Primary Industry ................................................................................................................ 143.4. Corporate Headquarters Location ...................................................................................... 163.5. Annual Information Technology Budget ............................................................................ 16
3.5.1. Line of Business Funding for Analytics ................................................................... 183.6. Drivers for Cloud Analytics Implementation ..................................................................... 20
3.6.1. Business Drivers ...................................................................................................... 203.6.2. Technical Drivers .................................................................................................... 21
4. Cloud-based Analytical Projects .................................................................................................. 234.1. Number of projects ............................................................................................................ 234.2. Business Goals .................................................................................................................... 244.3. Project Sponsors ................................................................................................................. 254.4. Data Consumers ................................................................................................................ 274.5. Analytical Workload ........................................................................................................... 284.6. Presentation Interface ......................................................................................................... 294.7. Consumption Avenue ........................................................................................................ 314.8. Main Cloud Component ................................................................................................... 32
5. Implementation Infrastructure.................................................................................................... 345.1. Analytical Elements ............................................................................................................ 345.2. Data Integration ................................................................................................................. 355.3. Obstacles for Cloud Infrastructure Choices........................................................................ 36
5.3.1. Infrastructure as a Service Obstacles ........................................................................ 375.3.2. Platform as a Service Obstacles ............................................................................... 375.3.3. (Hosted) Managed Services Obstacles ..................................................................... 38
6. Methodology and Demographics ............................................................................................... 396.1. Research Methodology ....................................................................................................... 39
7. Author ........................................................................................................................................ 39
©2015 Enterprise Management Associates, Inc. All Rights Reserved. | www.enterprisemanagement.comPage 1
Analytics in the Cloud
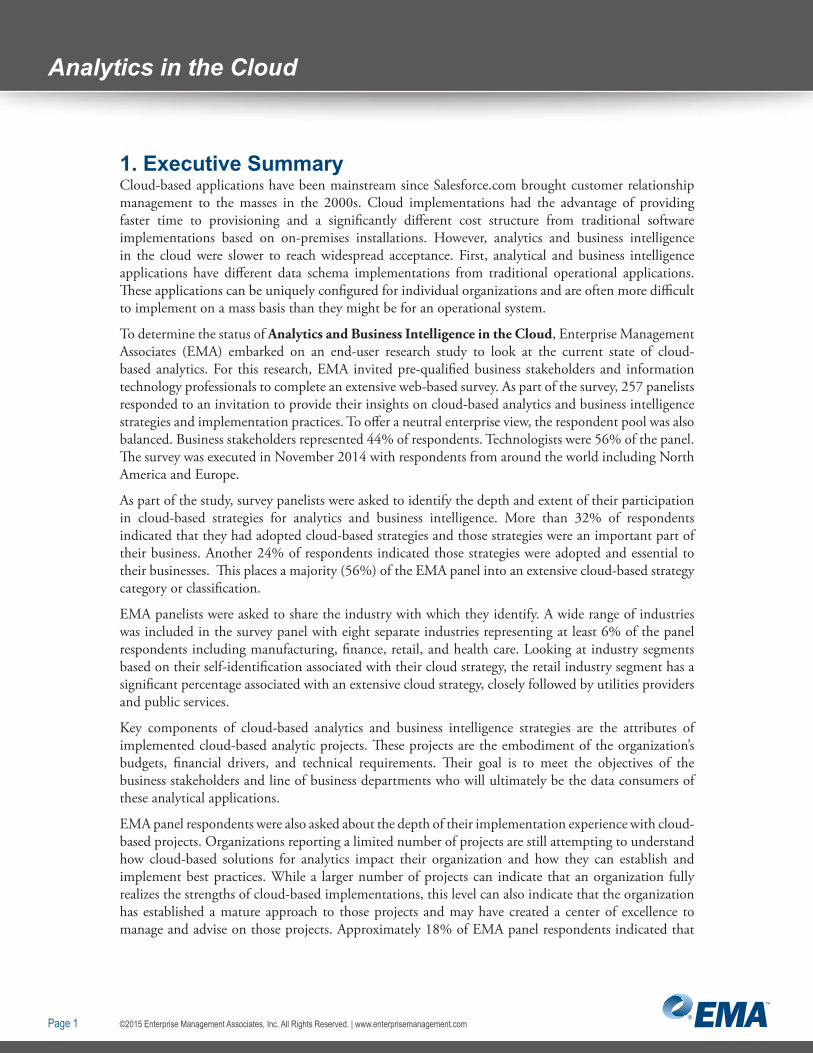
1. Executive SummaryCloud-based applications have been mainstream since Salesforce.com brought customer relationship management to the masses in the 2000s. Cloud implementations had the advantage of providing faster time to provisioning and a significantly different cost structure from traditional software implementations based on on-premises installations. However, analytics and business intelligence in the cloud were slower to reach widespread acceptance. First, analytical and business intelligence applications have different data schema implementations from traditional operational applications. These applications can be uniquely configured for individual organizations and are often more difficult to implement on a mass basis than they might be for an operational system.
To determine the status of Analytics and Business Intelligence in the Cloud, Enterprise Management Associates (EMA) embarked on an end-user research study to look at the current state of cloud-based analytics. For this research, EMA invited pre-qualified business stakeholders and information technology professionals to complete an extensive web-based survey. As part of the survey, 257 panelists responded to an invitation to provide their insights on cloud-based analytics and business intelligence strategies and implementation practices. To offer a neutral enterprise view, the respondent pool was also balanced. Business stakeholders represented 44% of respondents. Technologists were 56% of the panel. The survey was executed in November 2014 with respondents from around the world including North America and Europe.
As part of the study, survey panelists were asked to identify the depth and extent of their participation in cloud-based strategies for analytics and business intelligence. More than 32% of respondents indicated that they had adopted cloud-based strategies and those strategies were an important part of their business. Another 24% of respondents indicated those strategies were adopted and essential to their businesses. This places a majority (56%) of the EMA panel into an extensive cloud-based strategy category or classification.
EMA panelists were asked to share the industry with which they identify. A wide range of industries was included in the survey panel with eight separate industries representing at least 6% of the panel respondents including manufacturing, finance, retail, and health care. Looking at industry segments based on their self-identification associated with their cloud strategy, the retail industry segment has a significant percentage associated with an extensive cloud strategy, closely followed by utilities providers and public services.
Key components of cloud-based analytics and business intelligence strategies are the attributes of implemented cloud-based analytic projects. These projects are the embodiment of the organization’s budgets, financial drivers, and technical requirements. Their goal is to meet the objectives of the business stakeholders and line of business departments who will ultimately be the data consumers of these analytical applications.
EMA panel respondents were also asked about the depth of their implementation experience with cloud-based projects. Organizations reporting a limited number of projects are still attempting to understand how cloud-based solutions for analytics impact their organization and how they can establish and implement best practices. While a larger number of projects can indicate that an organization fully realizes the strengths of cloud-based implementations, this level can also indicate that the organization has established a mature approach to those projects and may have created a center of excellence to manage and advise on those projects. Approximately 18% of EMA panel respondents indicated that
©2015 Enterprise Management Associates, Inc. All Rights Reserved. | www.enterprisemanagement.comPage 2
Analytics in the Cloud
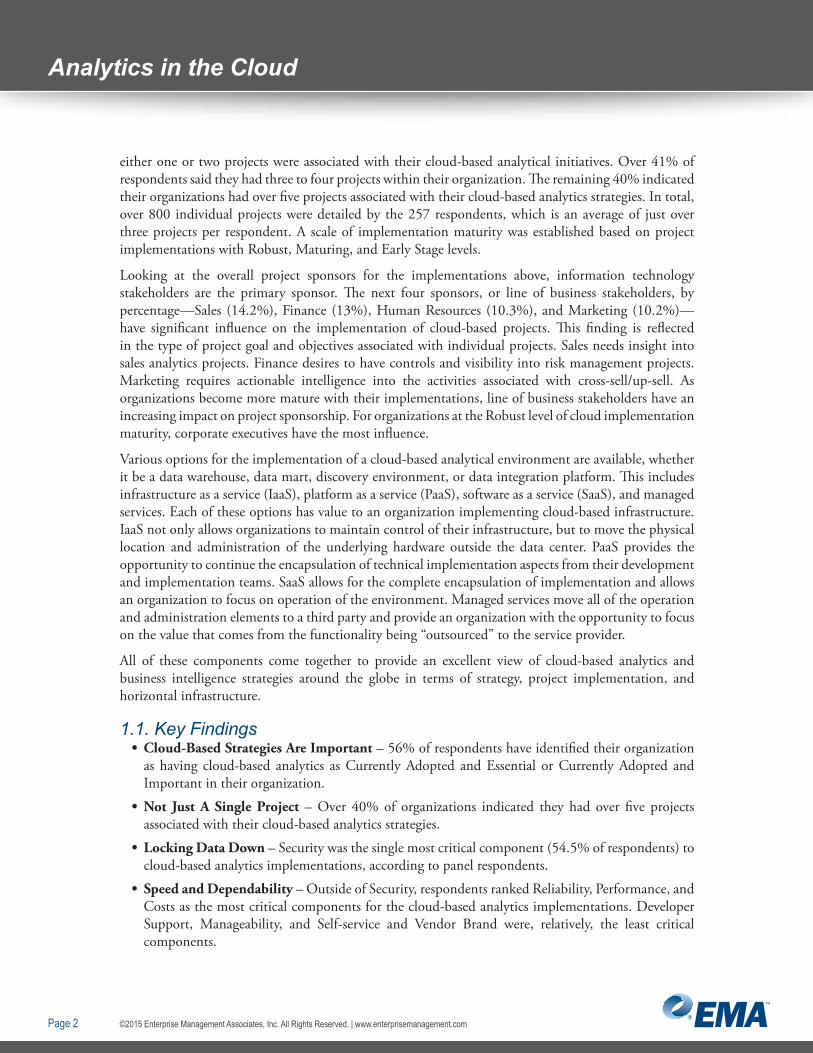
either one or two projects were associated with their cloud-based analytical initiatives. Over 41% of respondents said they had three to four projects within their organization. The remaining 40% indicated their organizations had over five projects associated with their cloud-based analytics strategies. In total, over 800 individual projects were detailed by the 257 respondents, which is an average of just over three projects per respondent. A scale of implementation maturity was established based on project implementations with Robust, Maturing, and Early Stage levels.
Looking at the overall project sponsors for the implementations above, information technology stakeholders are the primary sponsor. The next four sponsors, or line of business stakeholders, by percentage—Sales (14.2%), Finance (13%), Human Resources (10.3%), and Marketing (10.2%)—have significant influence on the implementation of cloud-based projects. This finding is reflected in the type of project goal and objectives associated with individual projects. Sales needs insight into sales analytics projects. Finance desires to have controls and visibility into risk management projects. Marketing requires actionable intelligence into the activities associated with cross-sell/up-sell. As organizations become more mature with their implementations, line of business stakeholders have an increasing impact on project sponsorship. For organizations at the Robust level of cloud implementation maturity, corporate executives have the most influence.
Various options for the implementation of a cloud-based analytical environment are available, whether it be a data warehouse, data mart, discovery environment, or data integration platform. This includes infrastructure as a service (IaaS), platform as a service (PaaS), software as a service (SaaS), and managed services. Each of these options has value to an organization implementing cloud-based infrastructure. IaaS not only allows organizations to maintain control of their infrastructure, but to move the physical location and administration of the underlying hardware outside the data center. PaaS provides the opportunity to continue the encapsulation of technical implementation aspects from their development and implementation teams. SaaS allows for the complete encapsulation of implementation and allows an organization to focus on operation of the environment. Managed services move all of the operation and administration elements to a third party and provide an organization with the opportunity to focus on the value that comes from the functionality being “outsourced” to the service provider.
All of these components come together to provide an excellent view of cloud-based analytics and business intelligence strategies around the globe in terms of strategy, project implementation, and horizontal infrastructure.
1.1. Key Findings• Cloud-Based Strategies Are Important – 56% of respondents have identified their organization
as having cloud-based analytics as Currently Adopted and Essential or Currently Adopted and Important in their organization.
• Not Just A Single Project – Over 40% of organizations indicated they had over five projects associated with their cloud-based analytics strategies.
• Locking Data Down – Security was the single most critical component (54.5% of respondents) to cloud-based analytics implementations, according to panel respondents.
• Speed and Dependability – Outside of Security, respondents ranked Reliability, Performance, and Costs as the most critical components for the cloud-based analytics implementations. Developer Support, Manageability, and Self-service and Vendor Brand were, relatively, the least critical components.
©2015 Enterprise Management Associates, Inc. All Rights Reserved. | www.enterprisemanagement.comPage 3
Analytics in the Cloud
• Cost Certainty and Length of Engagement – Organizations prefer to utilize annual or multi-year subscription agreements with their cloud service providers. Most often vice presidents will approve this type of expense, but approval is moving “downstream” to lower levels of the organization.
• Budgets are Expanding – Over 56% of the respondents indicated that their budgets fell within a band of $1 million to $25 million on an annual basis for 2014. Over a quarter of respondents indicated that this was an increase of 10-25% over 2013.
• Line Of Business Is Bringing The Checkbook – Over half of organizations indicated that they were receiving funding from sources outside of the IT department budget. These line of business contributors were most likely to contribute 21-25% of the cloud-based analytics and business intelligence budget.
• Businesses Want Speed to Value, Not Time to Heartbeat – The primary business driver is to decrease the time to delivery of analytical and business intelligence. Most important is Improved Speed to Implementation on Analytical Projects (16.5%). The second is Adaptable/Flexible Implementations (15.7%) associated with cloud-based analytical initiatives.
• Technical Agility Drives Requirements – Aside from Data Security, the most important Technical Drivers are time-to-value for cloud-based analytical initiatives. Improved Technical Agility (15.2%) and Improved Software Availability (13.4%).
• Leading Project Objectives – Sales Analytics (19.3%) was the leading Project Goal for organizations implementing cloud-based analytics and business intelligence. Risk Management (15.1%) and Marketing Analysis (13.1%) are ranked second and third.
• Who Is Sponsoring Projects – Line of business departments, Sales (14.2%), Finance (13.0%), Human Resources (10.3%), and Marketing (10.2%), all have significant influence on the cloud-based analytics projects implemented by the survey panel.
2. Business Intelligence and Analytics in the CloudCloud-based applications have been mainstream since Salesforce.com brought customer relationship management (CRM) and sales operations to the masses in the early 2000s. Cloud implementations had the advantage of providing faster time to implementation and a significantly different cost structure from traditional software implementations based on on-premises data center installations.
However, analytical and business intelligence installations in the cloud were slower to reach widespread implementation and acceptance due to several factors. First, analytical and business intelligence applications have vastly different data model implementations from traditional operational applications such as CRM or enterprise resource planning (ERP). These applications can be uniquely configured for individual organizations and are often difficult to implement on a mass basis than they might be for an operational platform.
Next, the configuration of the “front end” of business intelligence platforms such as reports, dashboards, and self-service data discovery components often do not follow a standard process. Each organization and department within the organization may have individual configurations based on their business model and/or individual analytical requirements. Again, this type of individualized configuration does not lend itself easily to implementation on a mass customization basis favored in cloud-based infrastructures.
©2015 Enterprise Management Associates, Inc. All Rights Reserved. | www.enterprisemanagement.comPage 4
Analytics in the Cloud
Finally, the amount of information passing between source systems and analytical platforms makes security of information in transit to a cloud-based infrastructure and within that cloud-based infrastructure a much larger issue than those of strictly operationally-based applications. The high volume of data comes from the fact that analytical applications generally have much larger datasets than those associated with operational platforms. The increase in overall data usage increases the likelihood that a security issue may occur.
2.1. Cloud-based Strategy and MaturityHow organizations look at cloud-based strategies is important. For organizations that embrace cloud-based approaches, there are a number of opportunities to expand their processing, storage, and distribution options beyond their on-premises data center. For those that do not adopt cloud-based strategies, there are fewer options.
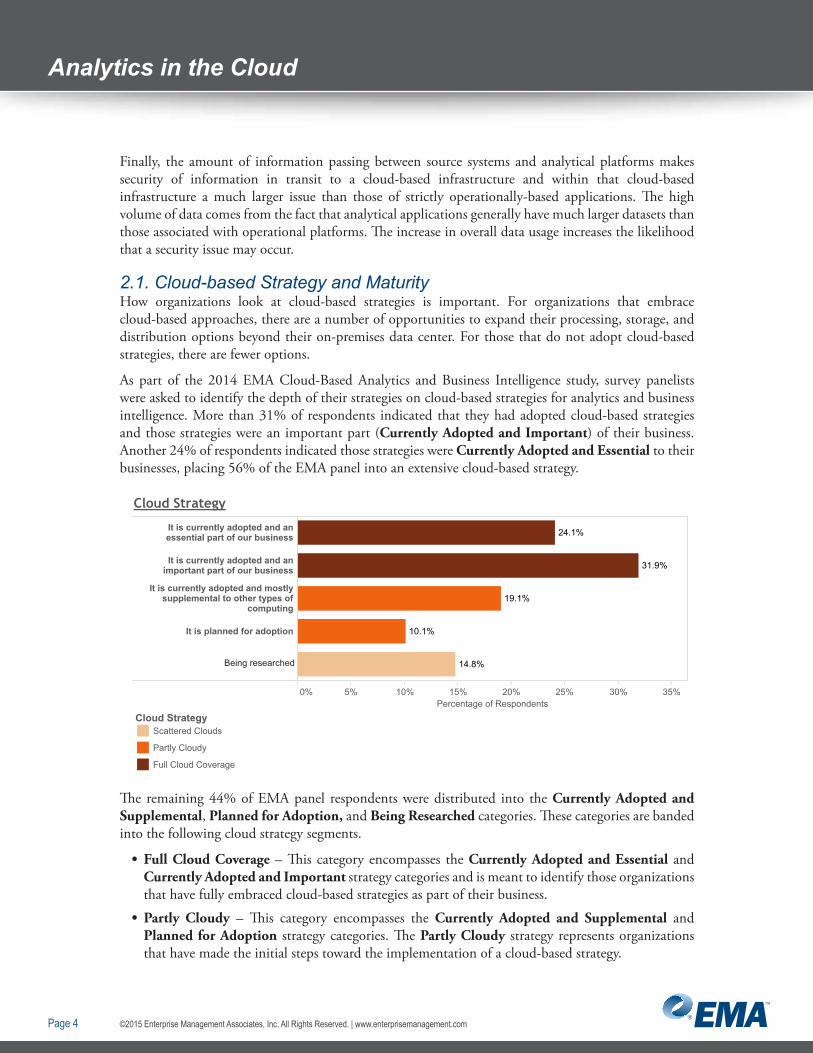
As part of the 2014 EMA Cloud-Based Analytics and Business Intelligence study, survey panelists were asked to identify the depth of their strategies on cloud-based strategies for analytics and business intelligence. More than 31% of respondents indicated that they had adopted cloud-based strategies and those strategies were an important part (Currently Adopted and Important) of their business. Another 24% of respondents indicated those strategies were Currently Adopted and Essential to their businesses, placing 56% of the EMA panel into an extensive cloud-based strategy.
Diagram 1
0% 5% 10% 15% 20% 25% 30% 35%Percentage of Respondents
It is currently adopted and anessential part of our business
It is currently adopted and animportant part of our business
It is currently adopted and mostlysupplemental to other types of
computing
It is planned for adoption
14.8%
19.1%
10.1%
24.1%
31.9%
Cloud StrategyScattered Clouds
Partly Cloudy
Full Cloud Coverage
Cloud Strategy
Being researched
The remaining 44% of EMA panel respondents were distributed into the Currently Adopted and Supplemental, Planned for Adoption, and Being Researched categories. These categories are banded into the following cloud strategy segments.
• Full Cloud Coverage – This category encompasses the Currently Adopted and Essential and Currently Adopted and Important strategy categories and is meant to identify those organizations that have fully embraced cloud-based strategies as part of their business.
• Partly Cloudy – This category encompasses the Currently Adopted and Supplemental and Planned for Adoption strategy categories. The Partly Cloudy strategy represents organizations that have made the initial steps toward the implementation of a cloud-based strategy.
©2015 Enterprise Management Associates, Inc. All Rights Reserved. | www.enterprisemanagement.comPage 5
Analytics in the Cloud
• Scattered Clouds – This category encompasses the Being Researched and Not Planned for Adoption1 strategy categories. Scattered Clouds denotes organizations that are still in the midst of making a decision on their implementation of cloud strategies.
Associated with the vision associated with cloud-based analytical and business intelligence strategies is the actual implementation of those strategies. EMA panelists were asked about their individual cloud-based projects for analytics and business intelligence. Through these projects, you can see the maturity of cloud-based implementations as an extension of the panelists’ cloud-based strategies.
Organizations reporting a limited number of cloud-based analytical or business intelligence projects show that they are still attempting to understand how cloud-based solutions for analytics impact their organization and how they can establish and implement best practices. A large number of projects can indicate that an organization fully realizes the strengths of cloud-based implementations. This level can also indicate that the organization has established a mature approach to those projects and may have created a center of excellence to manage and advise on those projects.
Diagram 2
0% 2% 4% 6% 8% 10% 12% 14% 16% 18% 20% 22%
1
2
3
4
5 - 7
8 - 10
11+ projects
17.8%
12.5%
10.1%
15.5%
21.0%
20.5%
2.6%
Number of Projects
Cloud MaturityRobust
Early Stage
Maturing
Percentage of Respondents
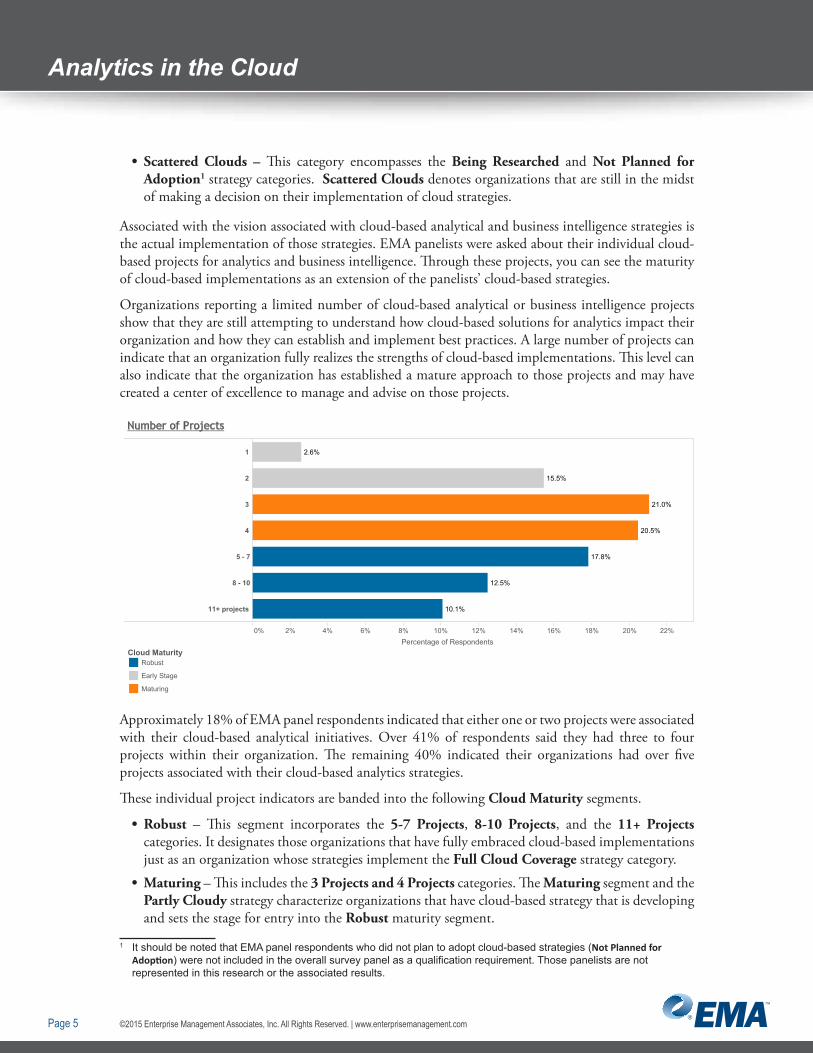
Approximately 18% of EMA panel respondents indicated that either one or two projects were associated with their cloud-based analytical initiatives. Over 41% of respondents said they had three to four projects within their organization. The remaining 40% indicated their organizations had over five projects associated with their cloud-based analytics strategies.
These individual project indicators are banded into the following Cloud Maturity segments.
• Robust – This segment incorporates the 5-7 Projects, 8-10 Projects, and the 11+ Projects categories. It designates those organizations that have fully embraced cloud-based implementations just as an organization whose strategies implement the Full Cloud Coverage strategy category.
• Maturing – This includes the 3 Projects and 4 Projects categories. The Maturing segment and the Partly Cloudy strategy characterize organizations that have cloud-based strategy that is developing and sets the stage for entry into the Robust maturity segment.
1 It should be noted that EMA panel respondents who did not plan to adopt cloud-based strategies (Not Planned for Adoption) were not included in the overall survey panel as a qualification requirement. Those panelists are not represented in this research or the associated results.
©2015 Enterprise Management Associates, Inc. All Rights Reserved. | www.enterprisemanagement.comPage 6
Analytics in the Cloud
• Early Stage – This segment contains the 1 Project and 2 Projects categories. Scattered Clouds and Early Stage indicate an organization that is working through the initial components of cloud-based strategy and implementation.
2.2. Mature Features and FunctionsThere was a time when utilizing a cloud-based platform meant that compromises relating to functionality and features were required. However, that time is behind us. Cloud-based implementations of analytical and business intelligence platforms have matured to the point where both in terms of feature/function lists and end-user sentiment they are on a par with their on-premises licensed counterparts.
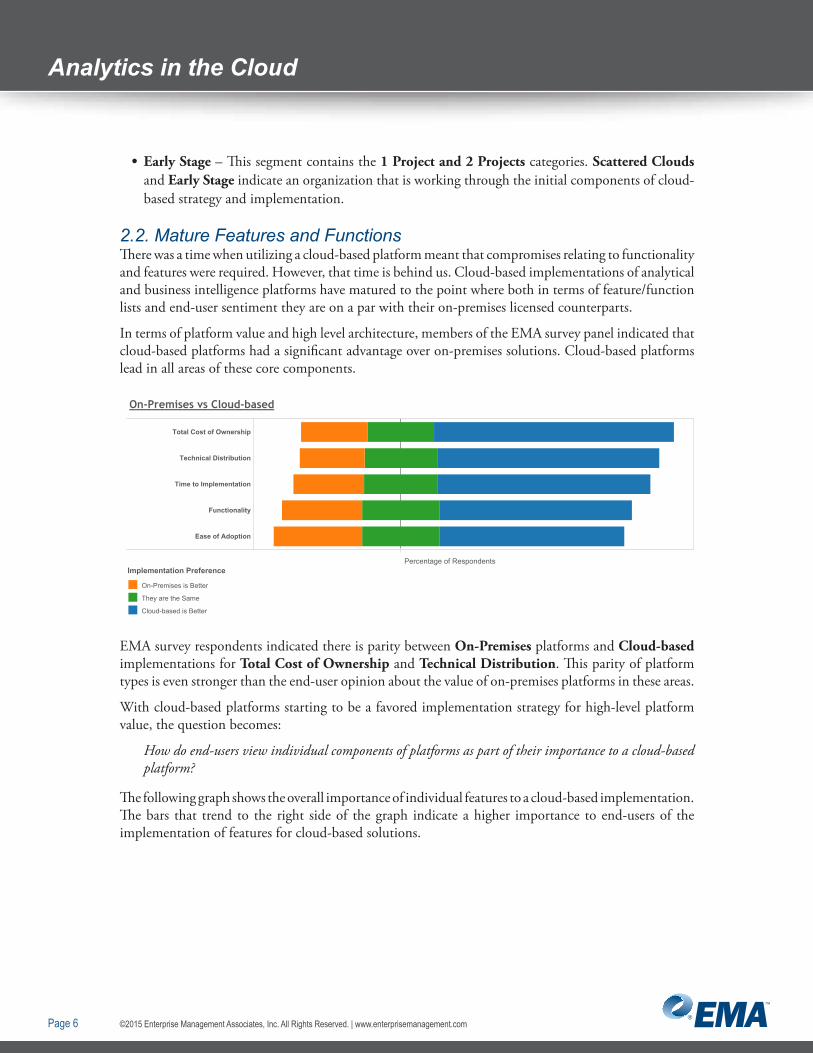
In terms of platform value and high level architecture, members of the EMA survey panel indicated that cloud-based platforms had a significant advantage over on-premises solutions. Cloud-based platforms lead in all areas of these core components.
Diagram 3
Total Cost of Ownership
Technical Distribution
Time to Implementation
Functionality
Ease of Adoption
On-Premises vs Cloud-based
Percentage of Respondents
On-Premises is Better
They are the Same
Cloud-based is Better
Implementation Preference
EMA survey respondents indicated there is parity between On-Premises platforms and Cloud-based implementations for Total Cost of Ownership and Technical Distribution. This parity of platform types is even stronger than the end-user opinion about the value of on-premises platforms in these areas.
With cloud-based platforms starting to be a favored implementation strategy for high-level platform value, the question becomes:
How do end-users view individual components of platforms as part of their importance to a cloud-based platform?
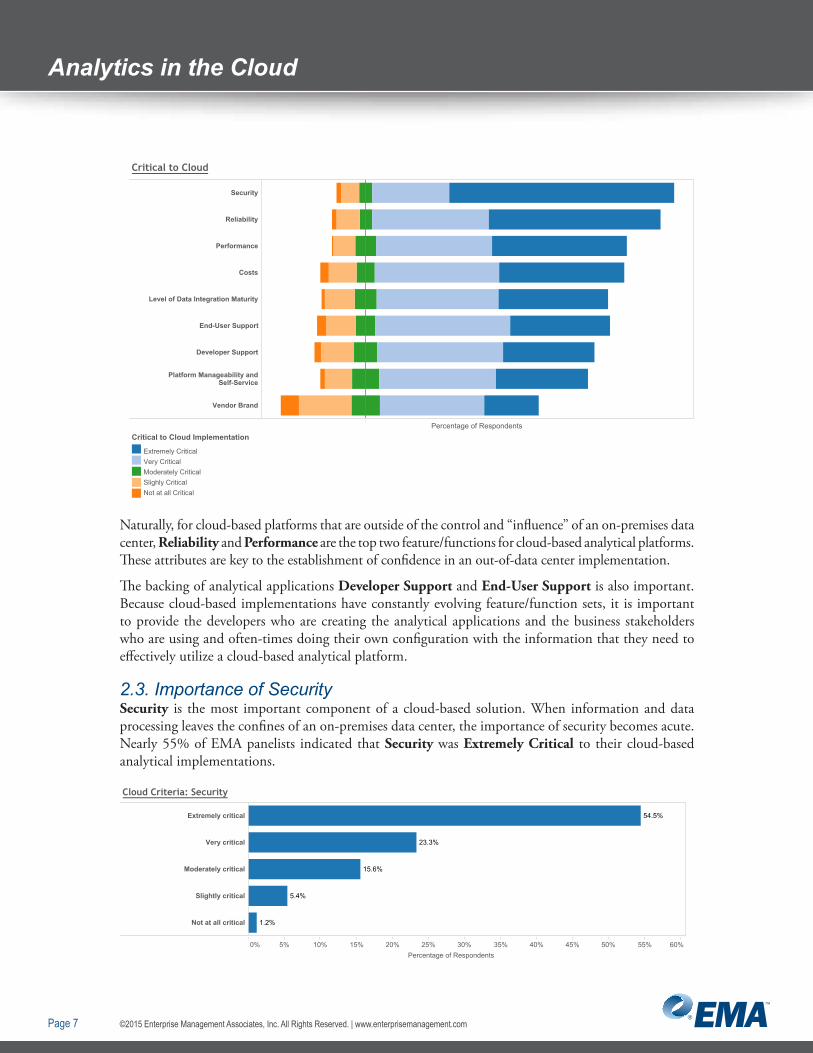
The following graph shows the overall importance of individual features to a cloud-based implementation. The bars that trend to the right side of the graph indicate a higher importance to end-users of the implementation of features for cloud-based solutions.
©2015 Enterprise Management Associates, Inc. All Rights Reserved. | www.enterprisemanagement.comPage 7
Analytics in the Cloud
Security
Reliability
Performance
Costs
Level of Data Integration Maturity
End-User Support
Developer Support
Platform Manageability andSelf-Service
Vendor Brand
Diagram 4
Percentage of Respondents
Critical to Cloud
Extremely CriticalVery CriticalModerately CriticalSlighly CriticalNot at all Critical
Critical to Cloud Implementation
Naturally, for cloud-based platforms that are outside of the control and “influence” of an on-premises data center, Reliability and Performance are the top two feature/functions for cloud-based analytical platforms. These attributes are key to the establishment of confidence in an out-of-data center implementation.
The backing of analytical applications Developer Support and End-User Support is also important. Because cloud-based implementations have constantly evolving feature/function sets, it is important to provide the developers who are creating the analytical applications and the business stakeholders who are using and often-times doing their own configuration with the information that they need to effectively utilize a cloud-based analytical platform.
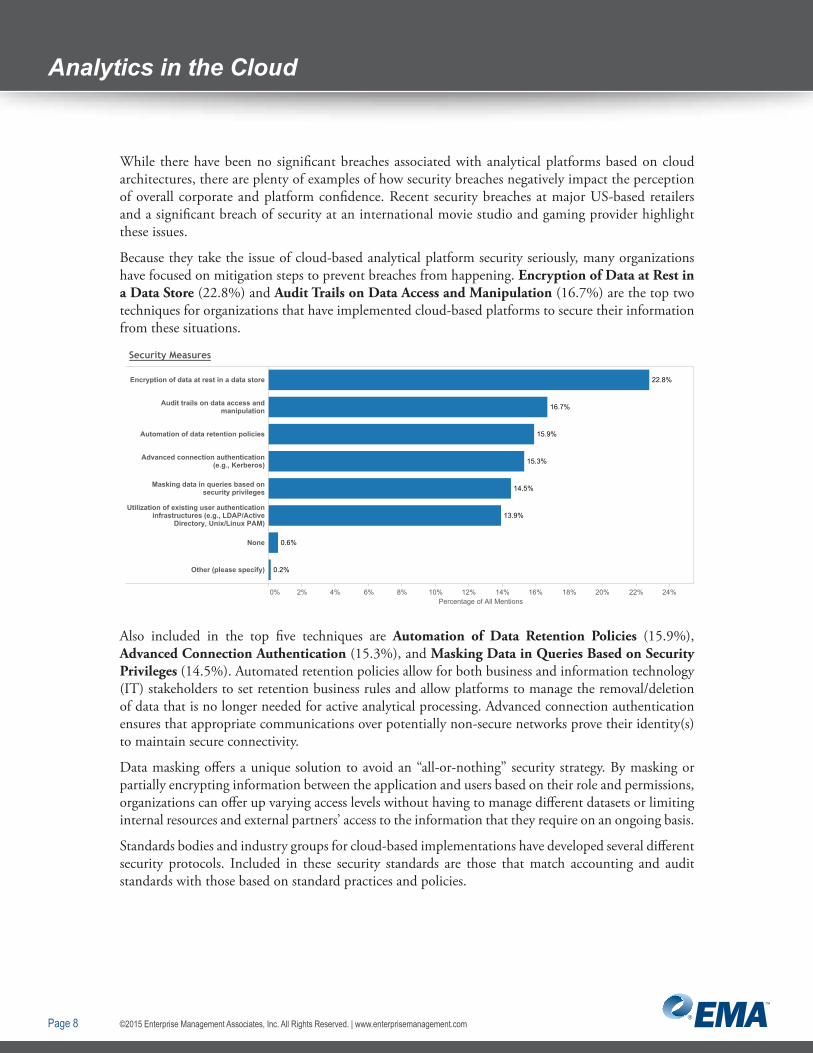
2.3. Importance of SecuritySecurity is the most important component of a cloud-based solution. When information and data processing leaves the confines of an on-premises data center, the importance of security becomes acute. Nearly 55% of EMA panelists indicated that Security was Extremely Critical to their cloud-based analytical implementations.
Diagram 5
0% 5% 10% 15% 20% 25% 30% 35% 40% 45% 50% 55% 60%
Extremely critical
Very critical
Moderately critical
Slightly critical
Not at all critical
54.5%
23.3%
15.6%
5.4%
1.2%
Percentage of Respondents
Cloud Criteria: Security
©2015 Enterprise Management Associates, Inc. All Rights Reserved. | www.enterprisemanagement.comPage 8
Analytics in the Cloud
While there have been no significant breaches associated with analytical platforms based on cloud architectures, there are plenty of examples of how security breaches negatively impact the perception of overall corporate and platform confidence. Recent security breaches at major US-based retailers and a significant breach of security at an international movie studio and gaming provider highlight these issues.
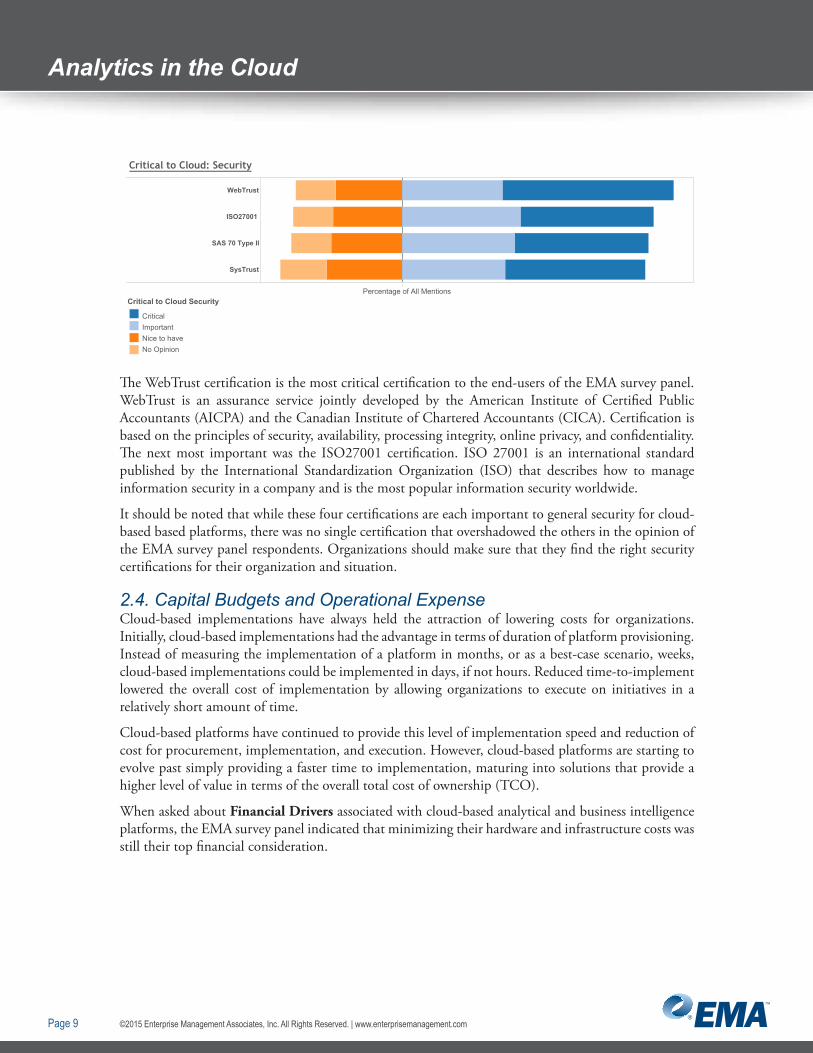
Because they take the issue of cloud-based analytical platform security seriously, many organizations have focused on mitigation steps to prevent breaches from happening. Encryption of Data at Rest in a Data Store (22.8%) and Audit Trails on Data Access and Manipulation (16.7%) are the top two techniques for organizations that have implemented cloud-based platforms to secure their information from these situations.
Diagram 6
0% 2% 4% 6% 8% 10% 12% 14% 16% 18% 20% 22% 24%Percentage of All Mentions
Encryption of data at rest in a data store
Audit trails on data access andmanipulation
Automation of data retention policies
Advanced connection authentication(e.g., Kerberos)
Masking data in queries based onsecurity privileges
Utilization of existing user authenticationinfrastructures (e.g., LDAP/Active
Directory, Unix/Linux PAM)
None
Other (please specify)
22.8%
16.7%
15.9%
15.3%
14.5%
13.9%
0.6%
0.2%
Security Measures
Also included in the top five techniques are Automation of Data Retention Policies (15.9%), Advanced Connection Authentication (15.3%), and Masking Data in Queries Based on Security Privileges (14.5%). Automated retention policies allow for both business and information technology (IT) stakeholders to set retention business rules and allow platforms to manage the removal/deletion of data that is no longer needed for active analytical processing. Advanced connection authentication ensures that appropriate communications over potentially non-secure networks prove their identity(s) to maintain secure connectivity.
Data masking offers a unique solution to avoid an “all-or-nothing” security strategy. By masking or partially encrypting information between the application and users based on their role and permissions, organizations can offer up varying access levels without having to manage different datasets or limiting internal resources and external partners’ access to the information that they require on an ongoing basis.
Standards bodies and industry groups for cloud-based implementations have developed several different security protocols. Included in these security standards are those that match accounting and audit standards with those based on standard practices and policies.
©2015 Enterprise Management Associates, Inc. All Rights Reserved. | www.enterprisemanagement.comPage 9
Analytics in the CloudDiagram 7
Critical to Cloud: Security
CriticalImportantNice to haveNo Opinion
Critical to Cloud Security
WebTrust
ISO27001
SAS 70 Type II
SysTrust
Percentage of All Mentions
The WebTrust certification is the most critical certification to the end-users of the EMA survey panel. WebTrust is an assurance service jointly developed by the American Institute of Certified Public Accountants (AICPA) and the Canadian Institute of Chartered Accountants (CICA). Certification is based on the principles of security, availability, processing integrity, online privacy, and confidentiality. The next most important was the ISO27001 certification. ISO 27001 is an international standard published by the International Standardization Organization (ISO) that describes how to manage information security in a company and is the most popular information security worldwide.
It should be noted that while these four certifications are each important to general security for cloud-based based platforms, there was no single certification that overshadowed the others in the opinion of the EMA survey panel respondents. Organizations should make sure that they find the right security certifications for their organization and situation.
2.4. Capital Budgets and Operational ExpenseCloud-based implementations have always held the attraction of lowering costs for organizations. Initially, cloud-based implementations had the advantage in terms of duration of platform provisioning. Instead of measuring the implementation of a platform in months, or as a best-case scenario, weeks, cloud-based implementations could be implemented in days, if not hours. Reduced time-to-implement lowered the overall cost of implementation by allowing organizations to execute on initiatives in a relatively short amount of time.
Cloud-based platforms have continued to provide this level of implementation speed and reduction of cost for procurement, implementation, and execution. However, cloud-based platforms are starting to evolve past simply providing a faster time to implementation, maturing into solutions that provide a higher level of value in terms of the overall total cost of ownership (TCO).
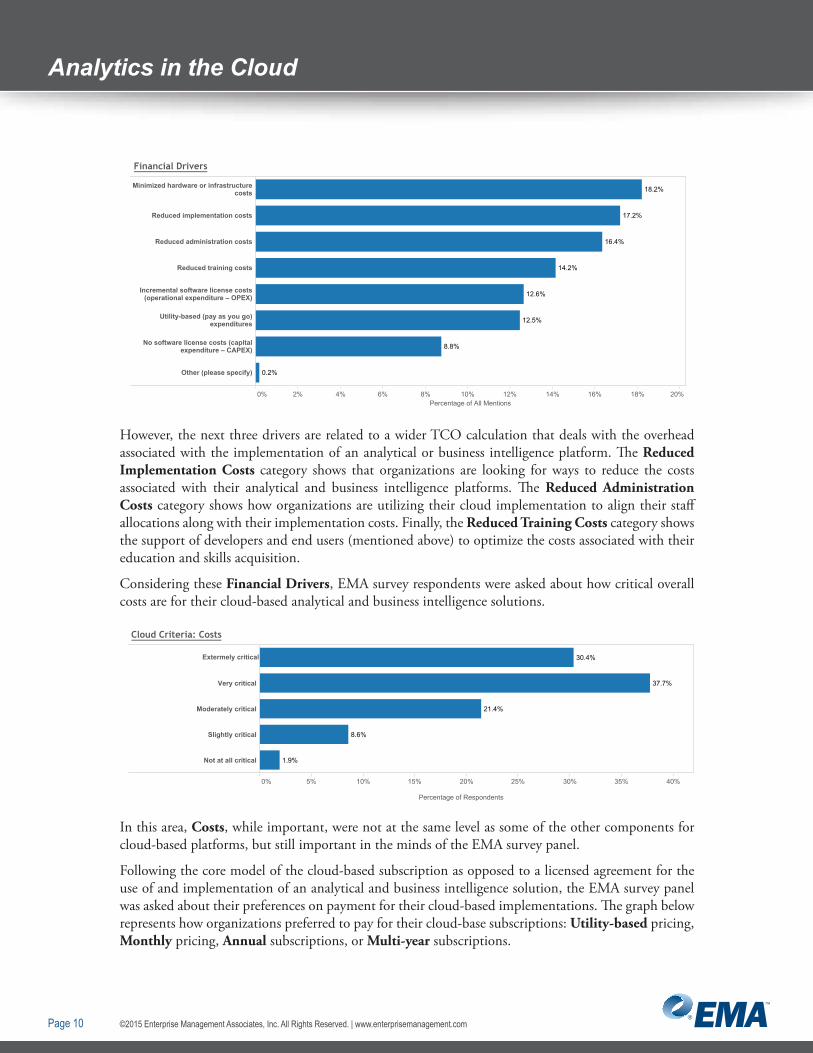
When asked about Financial Drivers associated with cloud-based analytical and business intelligence platforms, the EMA survey panel indicated that minimizing their hardware and infrastructure costs was still their top financial consideration.
©2015 Enterprise Management Associates, Inc. All Rights Reserved. | www.enterprisemanagement.comPage 10
Analytics in the Cloud
Diagram 8
0% 2% 4% 6% 8% 10% 12% 14% 16% 18% 20%Percentage of All Mentions
Minimized hardware or infrastructurecosts
Reduced implementation costs
Reduced administration costs
Reduced training costs
Incremental software license costs(operational expenditure – OPEX)
Utility-based (pay as you go)expenditures
No software license costs (capitalexpenditure – CAPEX)
Other (please specify)
18.2%
17.2%
16.4%
14.2%
12.6%
12.5%
8.8%
0.2%
Financial Drivers
However, the next three drivers are related to a wider TCO calculation that deals with the overhead associated with the implementation of an analytical or business intelligence platform. The Reduced Implementation Costs category shows that organizations are looking for ways to reduce the costs associated with their analytical and business intelligence platforms. The Reduced Administration Costs category shows how organizations are utilizing their cloud implementation to align their staff allocations along with their implementation costs. Finally, the Reduced Training Costs category shows the support of developers and end users (mentioned above) to optimize the costs associated with their education and skills acquisition.
Considering these Financial Drivers, EMA survey respondents were asked about how critical overall costs are for their cloud-based analytical and business intelligence solutions.
Diagram 9
0% 5% 10% 15% 20% 25% 30% 35% 40%
Very critical
Moderately critical
Slightly critical
Not at all critical
30.4%
37.7%
21.4%
8.6%
1.9%
Percentage of Respondents
Cloud Criteria: Costs
Extermely critical
In this area, Costs, while important, were not at the same level as some of the other components for cloud-based platforms, but still important in the minds of the EMA survey panel.
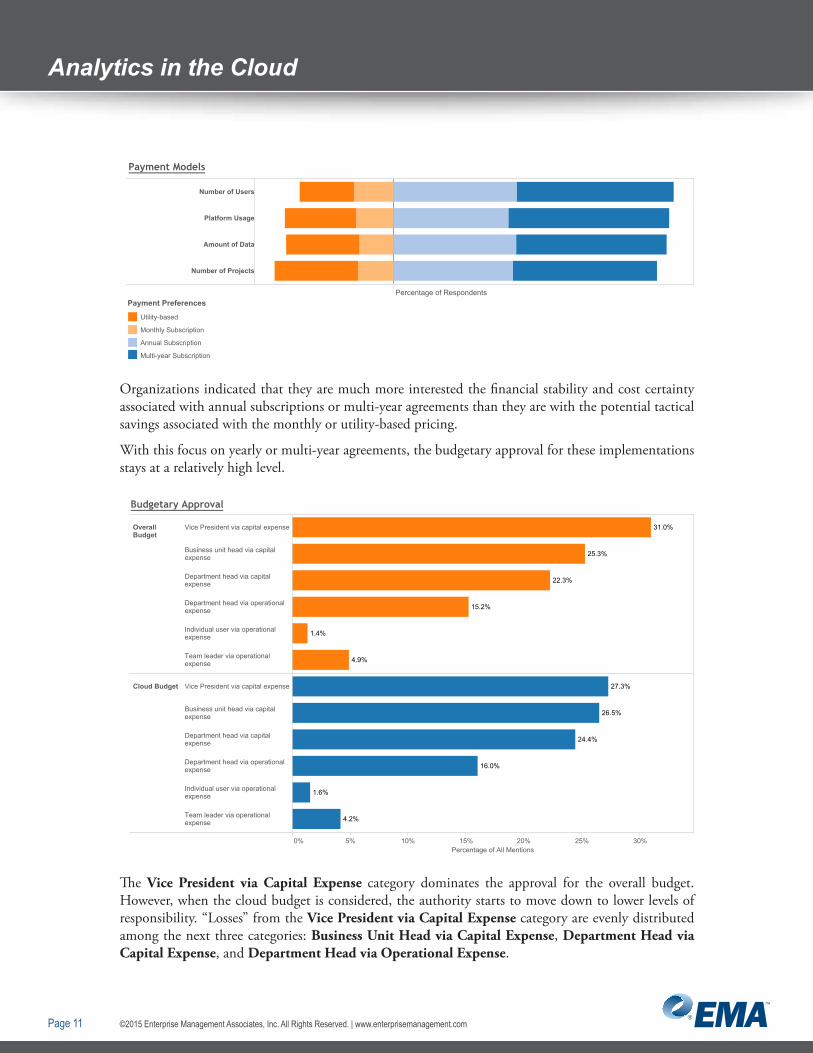
Following the core model of the cloud-based subscription as opposed to a licensed agreement for the use of and implementation of an analytical and business intelligence solution, the EMA survey panel was asked about their preferences on payment for their cloud-based implementations. The graph below represents how organizations preferred to pay for their cloud-base subscriptions: Utility-based pricing, Monthly pricing, Annual subscriptions, or Multi-year subscriptions.
©2015 Enterprise Management Associates, Inc. All Rights Reserved. | www.enterprisemanagement.comPage 11
Analytics in the CloudDiagram 10
Number of Users
Platform Usage
Amount of Data
Number of Projects
Percentage of Respondents
Payment Models
Utility-based
Monthly Subscription
Annual Subscription
Multi-year Subscription
Payment Preferences
Organizations indicated that they are much more interested the financial stability and cost certainty associated with annual subscriptions or multi-year agreements than they are with the potential tactical savings associated with the monthly or utility-based pricing.
With this focus on yearly or multi-year agreements, the budgetary approval for these implementations stays at a relatively high level. Diagram 11
0% 5% 10% 15% 20% 25% 30%Percentage of All Mentions
OverallBudget
Vice President via capital expense
Business unit head via capitalexpense
Department head via capitalexpense
Department head via operationalexpense
Individual user via operationalexpense
Team leader via operationalexpense
Cloud Budget Vice President via capital expense
Business unit head via capitalexpense
Department head via capitalexpense
Department head via operationalexpense
Individual user via operationalexpense
Team leader via operationalexpense
31.0%
25.3%
22.3%
15.2%
1.4%
4.9%
27.3%
26.5%
24.4%
16.0%
1.6%
4.2%
Budgetary Approval
The Vice President via Capital Expense category dominates the approval for the overall budget. However, when the cloud budget is considered, the authority starts to move down to lower levels of responsibility. “Losses” from the Vice President via Capital Expense category are evenly distributed among the next three categories: Business Unit Head via Capital Expense, Department Head via Capital Expense, and Department Head via Operational Expense.
©2015 Enterprise Management Associates, Inc. All Rights Reserved. | www.enterprisemanagement.comPage 12
Analytics in the Cloud
3. Survey DemographicsThe 2014 EMA survey respondents were selected from a wide range of industries, company sizes, and geographic distribution. This diversity provided a well-balanced look at the makeup of data management technologists and business stakeholders utilizing cloud-based approaches to analytics and business intelligence around the world.
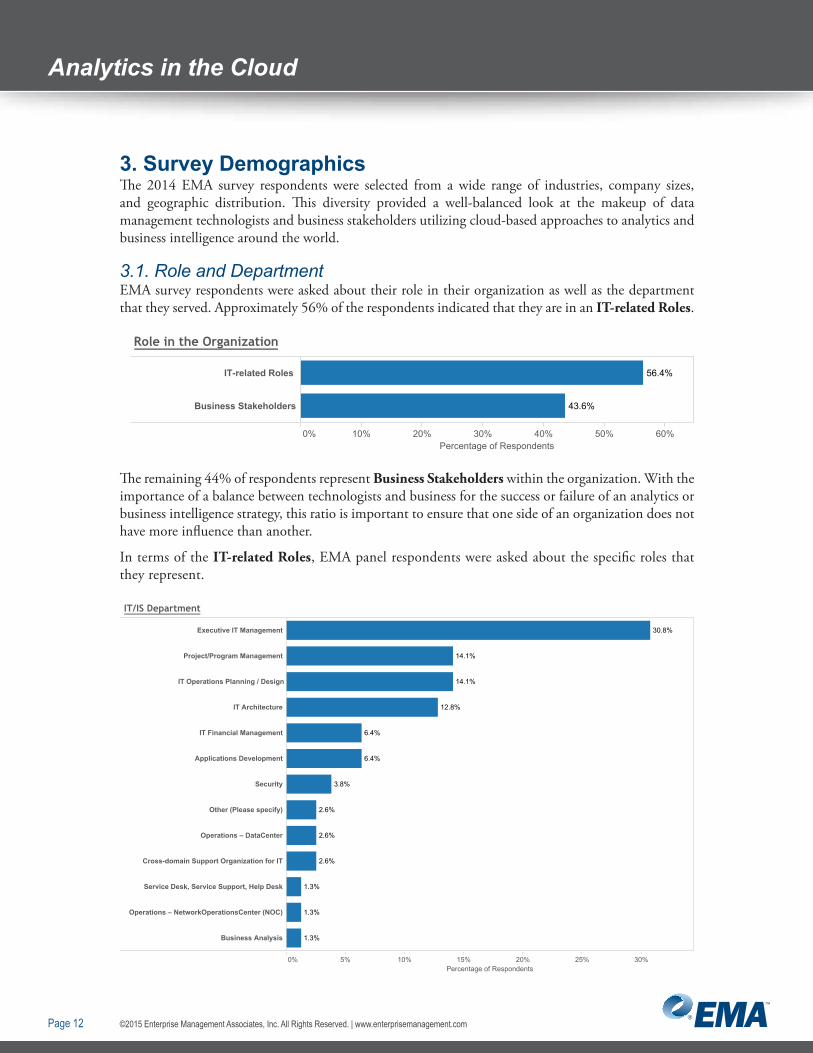
3.1. Role and DepartmentEMA survey respondents were asked about their role in their organization as well as the department that they served. Approximately 56% of the respondents indicated that they are in an IT-related Roles.
Diagram 12
0% 10% 20% 30% 40% 50% 60%Percentage of Respondents
IT-related Roles
Business Stakeholders
56.4%
43.6%
Role in the Organization
The remaining 44% of respondents represent Business Stakeholders within the organization. With the importance of a balance between technologists and business for the success or failure of an analytics or business intelligence strategy, this ratio is important to ensure that one side of an organization does not have more influence than another.
In terms of the IT-related Roles, EMA panel respondents were asked about the specific roles that they represent.Diagram 13
0% 5% 10% 15% 20% 25% 30%Percentage of Respondents
Executive IT Management
Project/Program Management
IT Operations Planning / Design
IT Architecture
IT Financial Management
Applications Development
Security
Other (Please specify)
Operations – DataCenter
Cross-domain Support Organization for IT
Service Desk, Service Support, Help Desk
Operations – NetworkOperationsCenter (NOC)
Business Analysis
30.8%
14.1%
14.1%
12.8%
6.4%
6.4%
3.8%
2.6%
2.6%
2.6%
1.3%
1.3%
1.3%
IT/IS Department
©2015 Enterprise Management Associates, Inc. All Rights Reserved. | www.enterprisemanagement.comPage 13
Analytics in the Cloud
Members of the Executive IT Management team are overwhelmingly represented (30.8%) within the EMA respondent panel. Project/Program Management (14.1%), IT Operations Planning/Design (14.1%), and IT Architecture (12.8%) teams are also well represented. Executive Management provides the overall strategic vision and IT Architecture offers the technical strategy for initiatives such as analytical and business intelligence engagements. Project/Program Management delivers the tactical planning and execution. IT operations planning/design gives insight from a day-to-day management perspective.
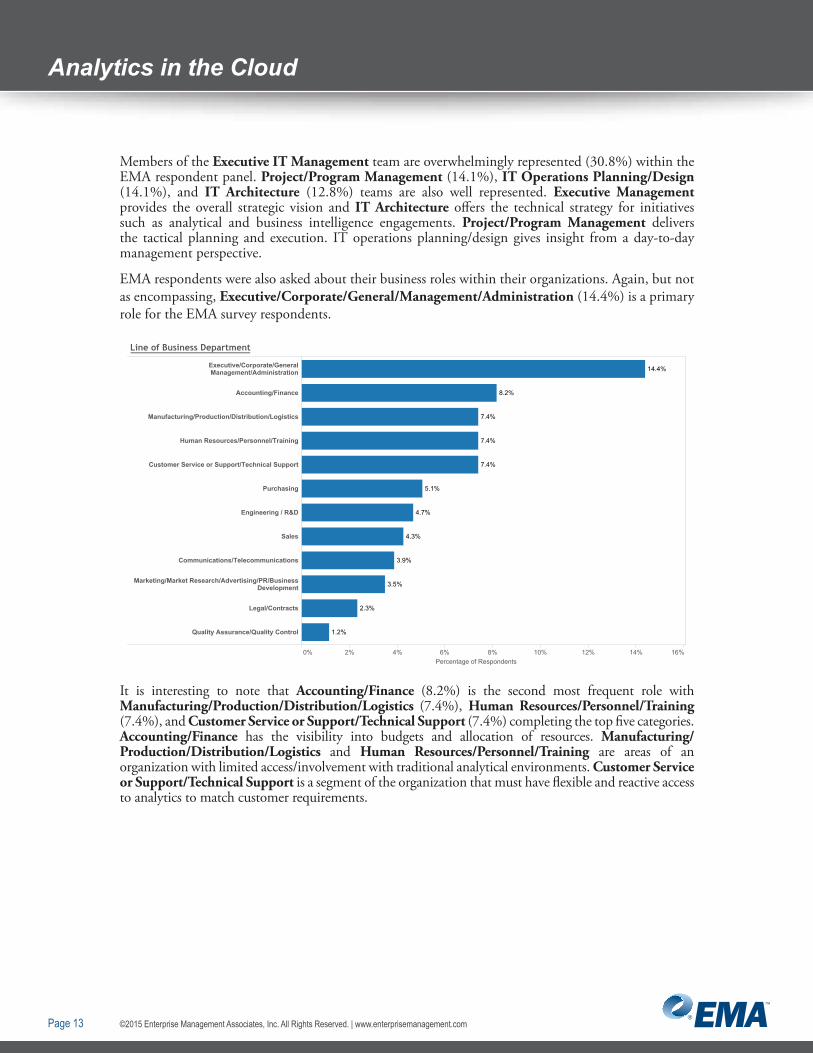
EMA respondents were also asked about their business roles within their organizations. Again, but not as encompassing, Executive/Corporate/General/Management/Administration (14.4%) is a primary role for the EMA survey respondents.
Diagram 14
0% 2% 4% 6% 8% 10% 12% 14% 16%
Executive/Corporate/GeneralManagement/Administration
Accounting/Finance
Manufacturing/Production/Distribution/Logistics
Human Resources/Personnel/Training
Customer Service or Support/Technical Support
Purchasing
Engineering / R&D
Sales
Communications/Telecommunications
Marketing/Market Research/Advertising/PR/BusinessDevelopment
Legal/Contracts
Quality Assurance/Quality Control
14.4%
8.2%
7.4%
7.4%
7.4%
5.1%
4.7%
4.3%
3.9%
3.5%
2.3%
1.2%
Percentage of Respondents
Line of Business Department
It is interesting to note that Accounting/Finance (8.2%) is the second most frequent role with Manufacturing/Production/Distribution/Logistics (7.4%), Human Resources/Personnel/Training (7.4%), and Customer Service or Support/Technical Support (7.4%) completing the top five categories. Accounting/Finance has the visibility into budgets and allocation of resources. Manufacturing/Production/Distribution/Logistics and Human Resources/Personnel/Training are areas of an organization with limited access/involvement with traditional analytical environments. Customer Service or Support/Technical Support is a segment of the organization that must have flexible and reactive access to analytics to match customer requirements.

©2015 Enterprise Management Associates, Inc. All Rights Reserved. | www.enterprisemanagement.comPage 14
Analytics in the Cloud
3.2. Company SizeThe EMA survey examined companies across a continuum of size. Corporate headcount is distributed in the following manner.
Diagram 15
0% 10% 20% 30% 40% 50% 60%Percentage of Respondents
Large (500-5000)
Enterprise (5000+)
Mid-size (under 500)
53.7%
36.2%
10.1%
Company SizeLarge (500-5000)
Enterprise (5000+)
Mid-size (under 500)
Company Size (banded)
Large companies, with headcounts of 500 to 5000 employees, represent a significant number of the organizations around the globe and nearly 54% of the EMA panel; they may benefit from the ability to provision technology at the speed of cloud-based solutions without distracting resources from business objectives. With over 5000 employees, Enterprises (36.2%) have the resources to implement private clouds within their own data centers or utilize a range of technology solutions. Mid-sized organizations (10.1%), with less than 500 in corporate headcount, are generally focused much more on business objectives and utilize a generalist staff for IT support. This type of employee distribution leads to organizations that benefit from the lower support requirements of a cloud-based solution.
3.3. Primary IndustryResearch into cloud-based initiatives should take into consideration the various industries and industry segments of the respondents. Some industries are on the cutting edge of developments while others are still gaining traction. In this study, industries were grouped into the following designations.
• Public Services – Government, education, non-profit/not for profit, and legal
• Manufacturing – All non-computer or networking-related manufacturing industries
• Utilities – Telecommunications service providers; application, internet, and managed-network service providers; and energy production and distribution utilities
• Finance – Finance, banking, and insurance
• Retail – End consumer retail and wholesale and distribution
• Industrial – Aerospace and defense manufacturing, oil and gas production and refining, chemical manufacturing, and transportation and logistics organizations like airlines, trucking, and rail
• Health Care – Medical device and supply and pharmaceutical production
©2015 Enterprise Management Associates, Inc. All Rights Reserved. | www.enterprisemanagement.comPage 15
Analytics in the Cloud
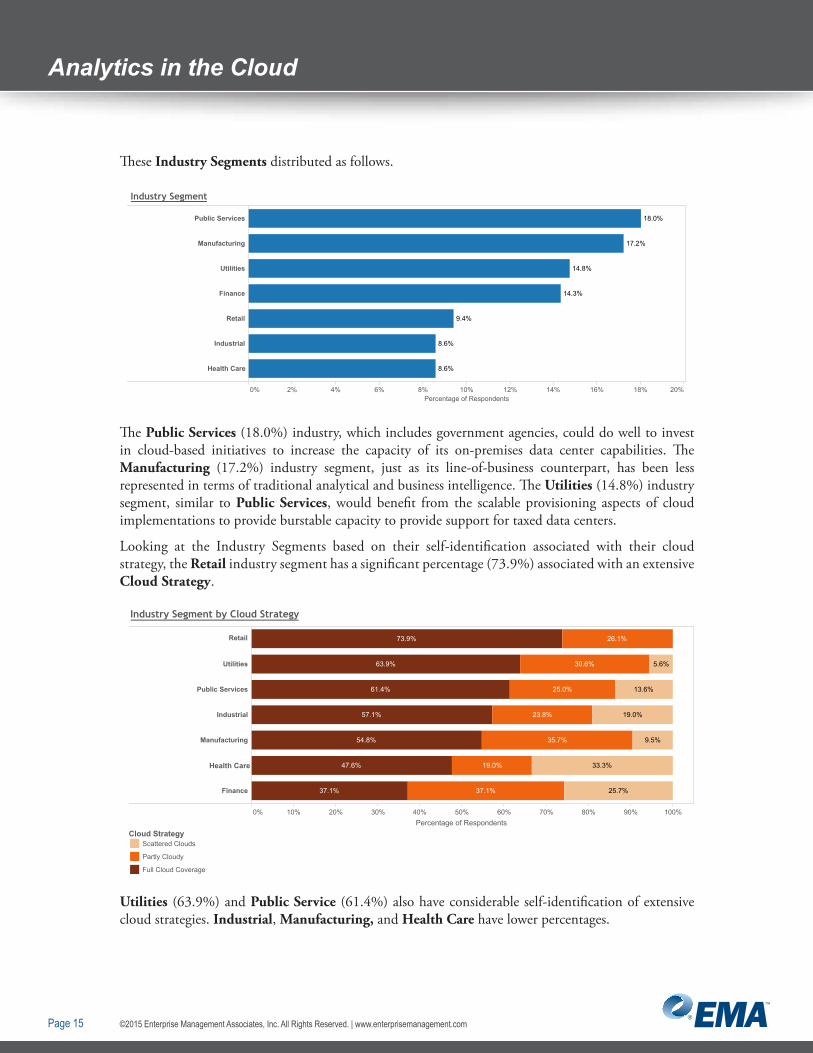
These Industry Segments distributed as follows.Diagram 16
0% 2% 4% 6% 8% 10% 12% 14% 16% 18% 20%Percentage of Respondents
Public Services
Manufacturing
Utilities
Finance
Retail
Industrial
Health Care
18.0%
17.2%
14.8%
14.3%
9.4%
8.6%
8.6%
Industry Segment
The Public Services (18.0%) industry, which includes government agencies, could do well to invest in cloud-based initiatives to increase the capacity of its on-premises data center capabilities. The Manufacturing (17.2%) industry segment, just as its line-of-business counterpart, has been less represented in terms of traditional analytical and business intelligence. The Utilities (14.8%) industry segment, similar to Public Services, would benefit from the scalable provisioning aspects of cloud implementations to provide burstable capacity to provide support for taxed data centers.
Looking at the Industry Segments based on their self-identification associated with their cloud strategy, the Retail industry segment has a significant percentage (73.9%) associated with an extensive Cloud Strategy.
Diagram 17
0% 10% 20% 30% 40% 50% 60% 70% 80% 90% 100%
Utilities
Public Services
Industrial
Manufacturing
Finance
13.6%
19.0%
33.3%
25.7%
26.1%
30.6%
25.0%
23.8%
35.7%
19.0%
37.1%
73.9%
63.9%
61.4%
57.1%
54.8%
47.6%
37.1%
5.6%
9.5%
Cloud StrategyScattered Clouds
Partly Cloudy
Full Cloud Coverage
Percentage of Respondents
Industry Segment by Cloud Strategy
Retail
Health Care
Utilities (63.9%) and Public Service (61.4%) also have considerable self-identification of extensive cloud strategies. Industrial, Manufacturing, and Health Care have lower percentages.

©2015 Enterprise Management Associates, Inc. All Rights Reserved. | www.enterprisemanagement.comPage 16
Analytics in the Cloud
3.4. Corporate Headquarters LocationThe location of the EMA panel respondents around the globe is represented by the following distribution.
Diagram 18
0% 10% 20% 30% 40% 50% 60%Percentage of Respondents
North America
Europe-Middle East-Africa (EMEA)
Central and South America (LatinAmerica)
Asia-Pacific (APAC)
58.4%
38.5%
1.9%
1.2%
Geographic Location
The North America and EMEA geographies have significant representation with over 58% and 38%, respectively. The Central and South American and APAC regions have significantly lower representation in this survey panel.
3.5. Annual Information Technology BudgetTo highlight the importance of the impact of budget on cloud-based analytical and business intelligence platforms, the EMA panel provided information about their 2014 Information Technology Budget.
Diagram 19
0% 2% 4% 6% 8% 10% 12% 14% 16% 18% 20% 22%
Less than $1 million
$1 million to less than $5 million
$5 million to less than $10 million
$10 million to less than $25 million
$25 million to less than $50 million
$50 million to less than $100 million
$100 million or more
Don't know
10.5%
19.5%
16.3%
21.0%
11.3%
4.7%
8.2%
8.6%
Percentage of Respondents
2014 IT Budget
Over 56% of the respondents indicated that their budgets fell within a band of $1 million to $25 million on an annual basis.
In addition, EMA panel respondents offered information on how their budgets changed from 2013 to 2014. In this distribution, nearly 53% of the EMA survey panelists indicated that budgets had increased between 1% and 25% over their 2013 budgets.

©2015 Enterprise Management Associates, Inc. All Rights Reserved. | www.enterprisemanagement.comPage 17
Analytics in the Cloud
Diagram 20
0% 2% 4% 6% 8% 10% 12% 14% 16% 18% 20% 22% 24% 26% 28% 30%Percentage of Respondents
Increased more than 75%
Increased between 50% and 75%
Increased between 25% and 50%
Increased between 10% and 25%
Increased less than 10%
Stayed the same
Decreased less than 10%
Decreased between 10% and 25%
Decreased between 25% and 50%
13.2%
27.3%
25.6%
20.7%
0.9%
5.7%
4.0%
2.2%
0.4%
Increase in IT Budget from 2013 to 2014
Finally, the EMA panel was asked what percentage of their IT budgets was allocated for analytical and business intelligence initiatives. Diagram 21
0% 2% 4% 6% 8% 10% 12% 14% 16% 18% 20% 22%Percentage of Respondents
1% - 10%
11% - 15%
16% - 20%
21% - 25%
26% - 30%
31% - 40%
41% - 50%
51% - 100%
12.3%
20.7%
19.8%
20.7%
13.2%
6.2%
6.2%
0.9%
IT Budget Assigned to Cloud-base Analytics by Cloud Strategy
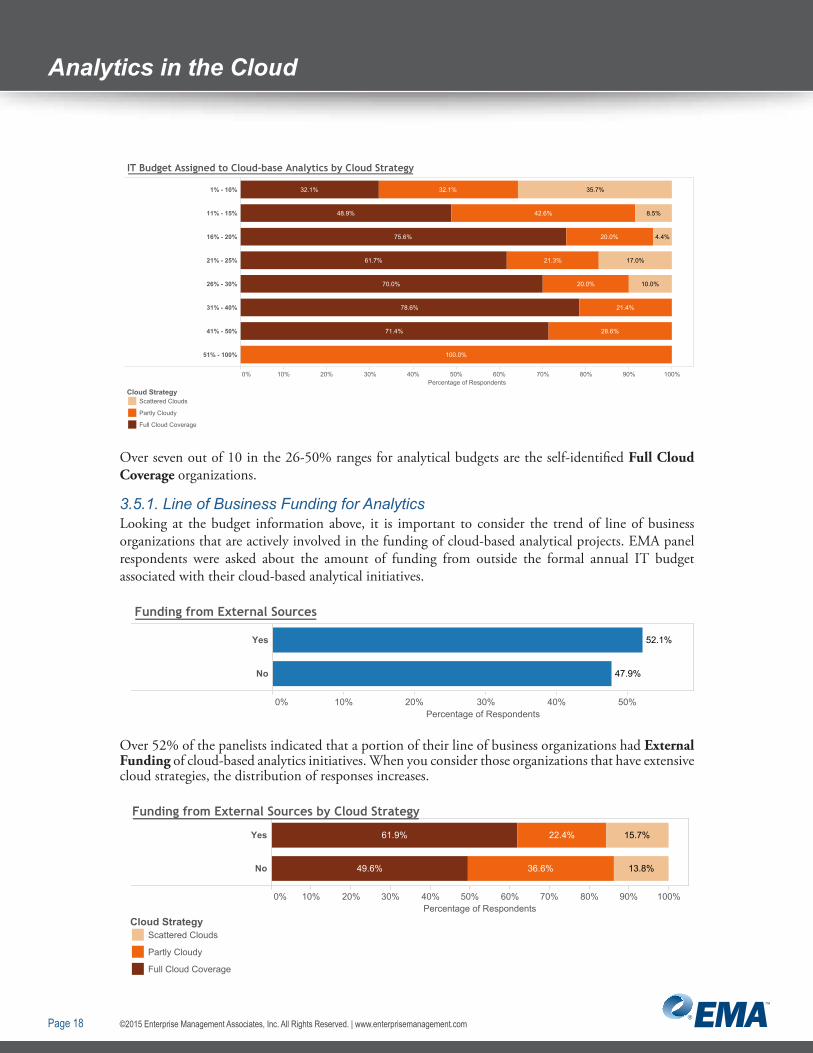
Over 60% of the EMA panel indicated that 11-25% of their IT budget was allocated to analytical and business intelligence initiatives. When the extent of their cloud-based strategies is included in the distribution, you can see a significantly higher representation in the higher analytical budget categories.
©2015 Enterprise Management Associates, Inc. All Rights Reserved. | www.enterprisemanagement.comPage 18
Analytics in the CloudDiagram 22
0% 10% 20% 30% 40% 50% 60% 70% 80% 90% 100%Percentage of Respondents
1% - 10%
11% - 15%
16% - 20%
21% - 25%
26% - 30%
31% - 40%
41% - 50%
51% - 100% 100.0%
35.7%
17.0%
10.0%
32.1%
42.6%
20.0%
21.3%
20.0%
21.4%
28.6%
32.1%
48.9%
75.6%
61.7%
70.0%
78.6%
71.4%
8.5%
4.4%
Cloud StrategyScattered Clouds
Partly Cloudy
Full Cloud Coverage
IT Budget Assigned to Cloud-base Analytics by Cloud Strategy
Over seven out of 10 in the 26-50% ranges for analytical budgets are the self-identified Full Cloud Coverage organizations.
3.5.1. Line of Business Funding for AnalyticsLooking at the budget information above, it is important to consider the trend of line of business organizations that are actively involved in the funding of cloud-based analytical projects. EMA panel respondents were asked about the amount of funding from outside the formal annual IT budget associated with their cloud-based analytical initiatives.
Diagram 23
0% 10% 20% 40% 50%30%Percentage of Respondents
Yes
No
52.1%
47.9%
Funding from External Sources
Over 52% of the panelists indicated that a portion of their line of business organizations had External Funding of cloud-based analytics initiatives. When you consider those organizations that have extensive cloud strategies, the distribution of responses increases.
Diagram 24
0% 10% 20% 30% 40% 50% 60% 70% 80% 90% 100%Percentage of Respondents
Yes
No
15.7%
13.8%
22.4%
36.6%
61.9%
49.6%
Cloud StrategyScattered Clouds
Partly Cloudy
Full Cloud Coverage
Funding from External Sources by Cloud Strategy
©2015 Enterprise Management Associates, Inc. All Rights Reserved. | www.enterprisemanagement.comPage 19
Analytics in the Cloud
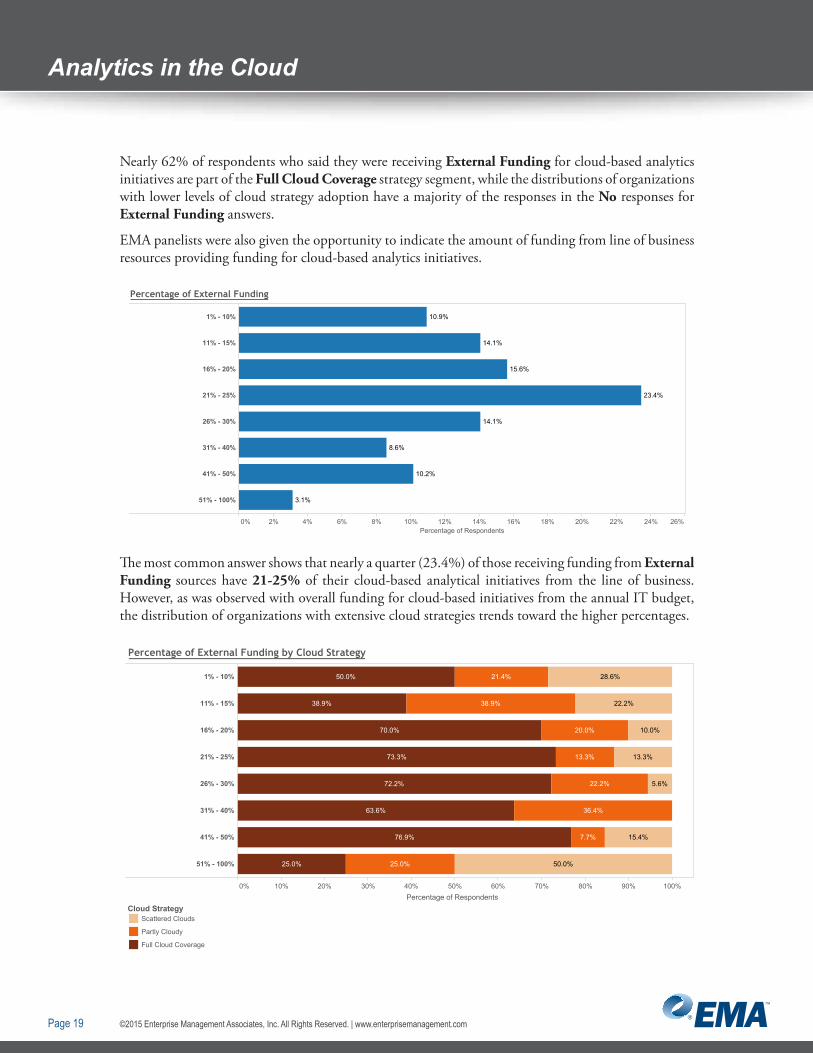
Nearly 62% of respondents who said they were receiving External Funding for cloud-based analytics initiatives are part of the Full Cloud Coverage strategy segment, while the distributions of organizations with lower levels of cloud strategy adoption have a majority of the responses in the No responses for External Funding answers.
EMA panelists were also given the opportunity to indicate the amount of funding from line of business resources providing funding for cloud-based analytics initiatives.Diagram 25
0% 2% 4% 6% 8% 10% 12% 14% 16% 18% 20% 22% 24% 26%Percentage of Respondents
1% - 10%
11% - 15%
16% - 20%
21% - 25%
26% - 30%
31% - 40%
41% - 50%
51% - 100%
10.9%
14.1%
15.6%
23.4%
14.1%
10.2%
8.6%
3.1%
Percentage of External Funding
The most common answer shows that nearly a quarter (23.4%) of those receiving funding from External Funding sources have 21-25% of their cloud-based analytical initiatives from the line of business. However, as was observed with overall funding for cloud-based initiatives from the annual IT budget, the distribution of organizations with extensive cloud strategies trends toward the higher percentages.
Diagram 26
0% 10% 20% 30% 40% 50% 60% 70% 80% 90% 100%
1% - 10%
11% - 15%
16% - 20%
21% - 25%
26% - 30%
31% - 40%
41% - 50%
51% - 100%
28.6%
22.2%
10.0%
13.3%
15.4%
50.0%
21.4%
38.9%
20.0%
13.3%
22.2%
36.4%
25.0%
50.0%
38.9%
70.0%
73.3%
72.2%
63.6%
76.9%
25.0%
5.6%
7.7%
Cloud StrategyScattered Clouds
Partly Cloudy
Full Cloud Coverage
Percentage of Respondents
Percentage of External Funding by Cloud Strategy
©2015 Enterprise Management Associates, Inc. All Rights Reserved. | www.enterprisemanagement.comPage 20
Analytics in the Cloud
Organizations with a Full Cloud Coverage strategy represent at least 63% of the organizations indicating 26 to 50% of their funding from line of business sources. This shows that organizations with a stronger cloud strategy have a corresponding stronger involvement with their business stakeholders and non-IT based lines of business.
3.6. Drivers for Cloud Analytics ImplementationAs part of the horizontal strategy associated with any organization’s implementation of a cloud-based strategy are the drivers associated with business outcomes and technical concerns. These drivers are the basis for how an organization aligns its budgetary and headcount resources associated with its cloud-based strategy.
3.6.1. Business DriversDrivers that impact competitive advantage and business outcomes are key pressure points for the business stakeholders and the line of business departments that contribute to the overall budgets associated with cloud-based analytical initiatives.
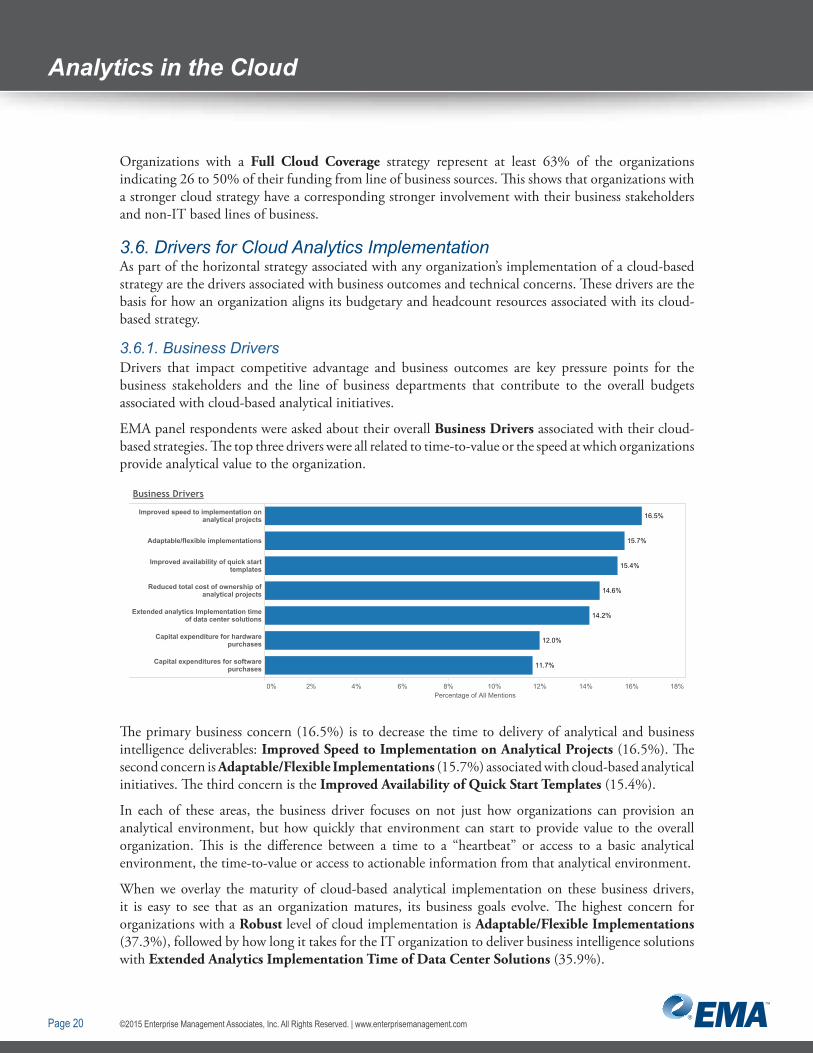
EMA panel respondents were asked about their overall Business Drivers associated with their cloud-based strategies. The top three drivers were all related to time-to-value or the speed at which organizations provide analytical value to the organization.
Diagram 27
0% 2% 4% 6% 8% 10% 12% 14% 16% 18%Percentage of All Mentions
Improved speed to implementation onanalytical projects
Adaptable/flexible implementations
Improved availability of quick starttemplates
Reduced total cost of ownership ofanalytical projects
Extended analytics Implementation timeof data center solutions
Capital expenditure for hardwarepurchases
Capital expenditures for softwarepurchases
16.5%
15.7%
15.4%
14.6%
14.2%
12.0%
11.7%
Business Drivers
The primary business concern (16.5%) is to decrease the time to delivery of analytical and business intelligence deliverables: Improved Speed to Implementation on Analytical Projects (16.5%). The second concern is Adaptable/Flexible Implementations (15.7%) associated with cloud-based analytical initiatives. The third concern is the Improved Availability of Quick Start Templates (15.4%).
In each of these areas, the business driver focuses on not just how organizations can provision an analytical environment, but how quickly that environment can start to provide value to the overall organization. This is the difference between a time to a “heartbeat” or access to a basic analytical environment, the time-to-value or access to actionable information from that analytical environment.
When we overlay the maturity of cloud-based analytical implementation on these business drivers, it is easy to see that as an organization matures, its business goals evolve. The highest concern for organizations with a Robust level of cloud implementation is Adaptable/Flexible Implementations (37.3%), followed by how long it takes for the IT organization to deliver business intelligence solutions with Extended Analytics Implementation Time of Data Center Solutions (35.9%).
©2015 Enterprise Management Associates, Inc. All Rights Reserved. | www.enterprisemanagement.comPage 21
Analytics in the Cloud
Diagram 28
0% 10% 20% 30% 40% 50% 60% 70% 80% 90% 100%Percentage of All Mentions
Capital expenditure for hardwarepurchases
Capital expenditures for softwarepurchases
Extended analytics Implementation timeof data center solutions
Adaptable/flexible implementations
Improved speed to implementation onanalytical projects
Improved availability of quick starttemplates
Reduced total cost of ownership ofanalytical projects
10.5%
13.0%
11.8%
12.1%
14.0%
12.6%
23.1%
19.7%
22.8%
24.5%
27.1%
27.0%
29.5%
73.1%
69.7%
64.1%
63.7%
60.7%
59.0%
57.9%
3.8%
Business Drivers by Cloud Strategy
Cloud StrategyScattered Clouds
Partly Cloudy
Full Cloud Coverage
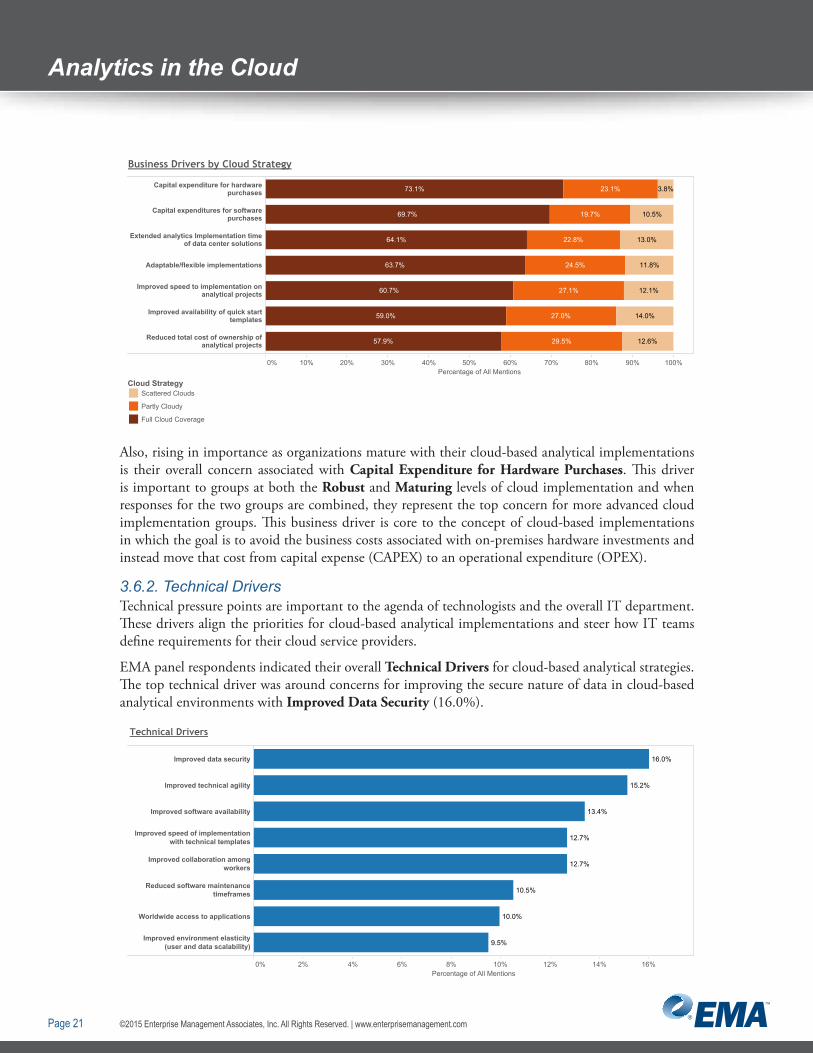
Also, rising in importance as organizations mature with their cloud-based analytical implementations is their overall concern associated with Capital Expenditure for Hardware Purchases. This driver is important to groups at both the Robust and Maturing levels of cloud implementation and when responses for the two groups are combined, they represent the top concern for more advanced cloud implementation groups. This business driver is core to the concept of cloud-based implementations in which the goal is to avoid the business costs associated with on-premises hardware investments and instead move that cost from capital expense (CAPEX) to an operational expenditure (OPEX).
3.6.2. Technical DriversTechnical pressure points are important to the agenda of technologists and the overall IT department. These drivers align the priorities for cloud-based analytical implementations and steer how IT teams define requirements for their cloud service providers.
EMA panel respondents indicated their overall Technical Drivers for cloud-based analytical strategies. The top technical driver was around concerns for improving the secure nature of data in cloud-based analytical environments with Improved Data Security (16.0%).
Diagram 29
0% 2% 4% 6% 8% 10% 12% 14% 16%Percentage of All Mentions
Improved data security
Improved technical agility
Improved software availability
Improved speed of implementationwith technical templates
Improved collaboration amongworkers
Reduced software maintenancetimeframes
Worldwide access to applications
Improved environment elasticity(user and data scalability)
16.0%
15.2%
13.4%
12.7%
12.7%
10.5%
10.0%
9.5%
Technical Drivers
©2015 Enterprise Management Associates, Inc. All Rights Reserved. | www.enterprisemanagement.comPage 22
Analytics in the Cloud
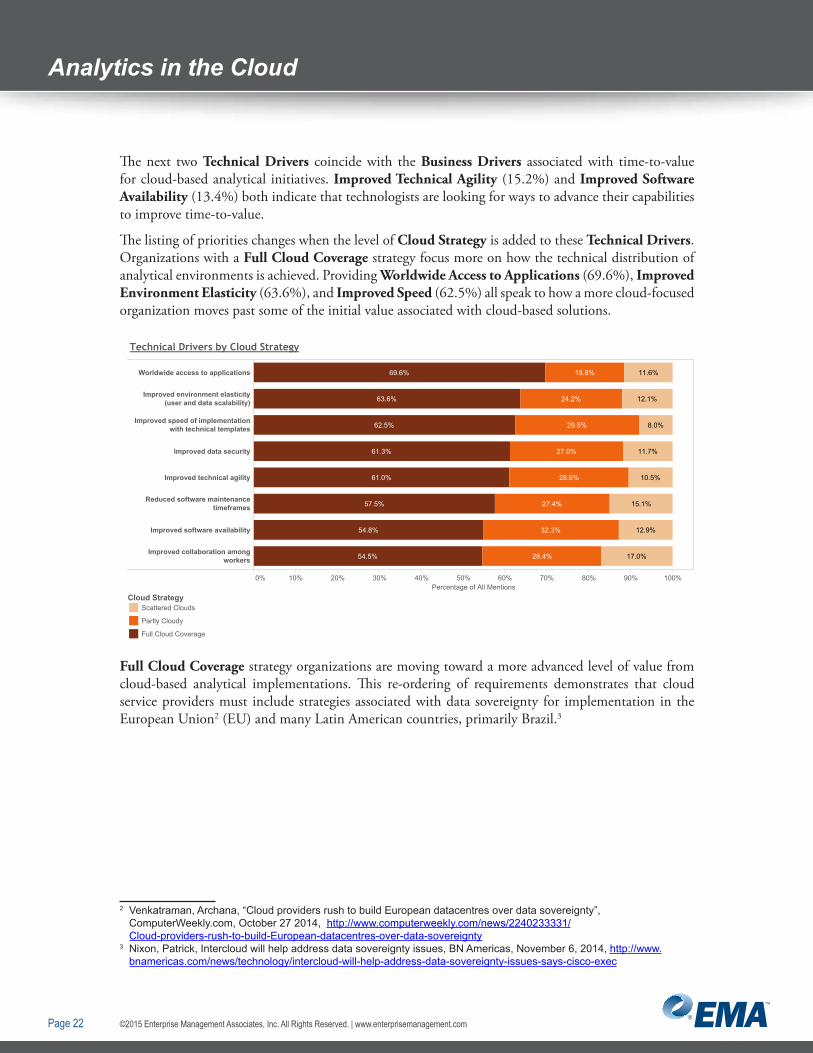
The next two Technical Drivers coincide with the Business Drivers associated with time-to-value for cloud-based analytical initiatives. Improved Technical Agility (15.2%) and Improved Software Availability (13.4%) both indicate that technologists are looking for ways to advance their capabilities to improve time-to-value.
The listing of priorities changes when the level of Cloud Strategy is added to these Technical Drivers. Organizations with a Full Cloud Coverage strategy focus more on how the technical distribution of analytical environments is achieved. Providing Worldwide Access to Applications (69.6%), Improved Environment Elasticity (63.6%), and Improved Speed (62.5%) all speak to how a more cloud-focused organization moves past some of the initial value associated with cloud-based solutions. Diagram 30
0% 10% 20% 30% 40% 50% 60% 70% 80% 90% 100%Percentage of All Mentions
Worldwide access to applications
Improved environment elasticity(user and data scalability)
Improved speed of implementationwith technical templates
Improved data security
Improved technical agility
Reduced software maintenancetimeframes
Improved software availability
Improved collaboration amongworkers
11.6%
12.1%
11.7%
10.5%
15.1%
12.9%
17.0%
18.8%
24.2%
29.5%
27.0%
28.6%
27.4%
32.3%
28.4%
69.6%
63.6%
62.5%
61.3%
61.0%
57.5%
54.8%
54.5%
8.0%
Technical Drivers by Cloud Strategy
Cloud StrategyScattered Clouds
Partly Cloudy
Full Cloud Coverage
Full Cloud Coverage strategy organizations are moving toward a more advanced level of value from cloud-based analytical implementations. This re-ordering of requirements demonstrates that cloud service providers must include strategies associated with data sovereignty for implementation in the European Union2 (EU) and many Latin American countries, primarily Brazil.3
2 Venkatraman, Archana, “Cloud providers rush to build European datacentres over data sovereignty”, ComputerWeekly.com, October 27 2014, http://www.computerweekly.com/news/2240233331/Cloud-providers-rush-to-build-European-datacentres-over-data-sovereignty
3 Nixon, Patrick, Intercloud will help address data sovereignty issues, BN Americas, November 6, 2014, http://www.bnamericas.com/news/technology/intercloud-will-help-address-data-sovereignty-issues-says-cisco-exec
©2015 Enterprise Management Associates, Inc. All Rights Reserved. | www.enterprisemanagement.comPage 23
Analytics in the Cloud
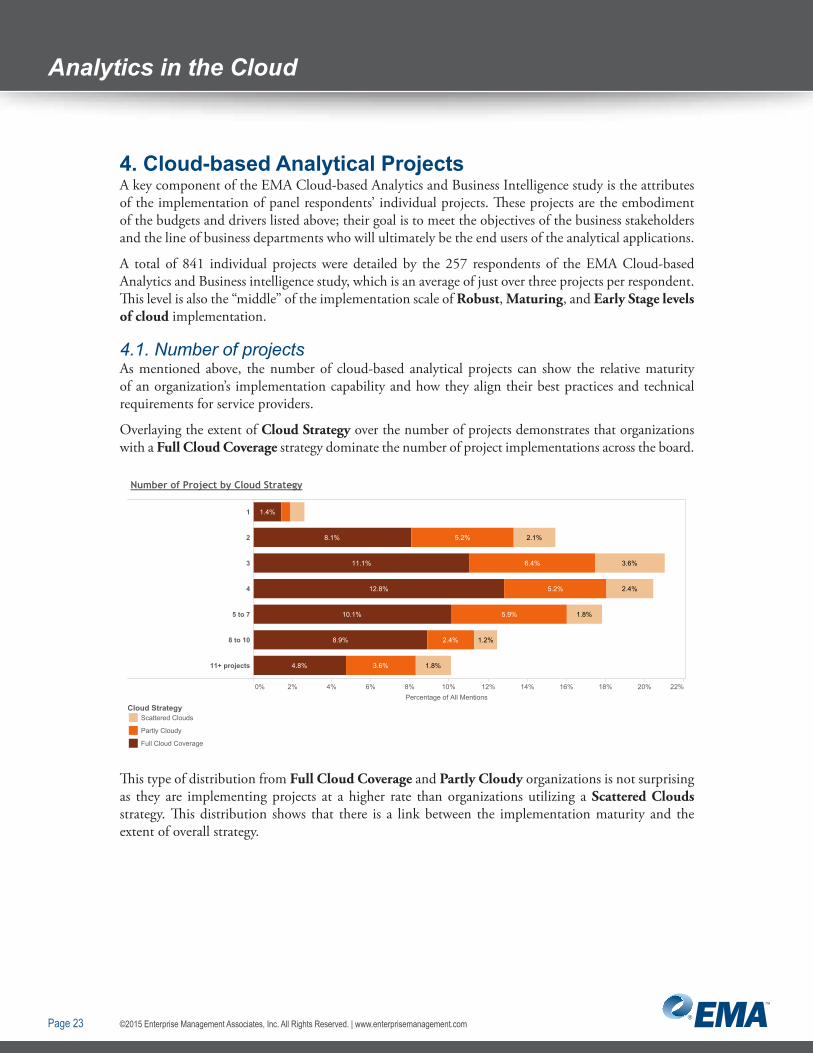
4. Cloud-based Analytical ProjectsA key component of the EMA Cloud-based Analytics and Business Intelligence study is the attributes of the implementation of panel respondents’ individual projects. These projects are the embodiment of the budgets and drivers listed above; their goal is to meet the objectives of the business stakeholders and the line of business departments who will ultimately be the end users of the analytical applications.
A total of 841 individual projects were detailed by the 257 respondents of the EMA Cloud-based Analytics and Business intelligence study, which is an average of just over three projects per respondent. This level is also the “middle” of the implementation scale of Robust, Maturing, and Early Stage levels of cloud implementation.
4.1. Number of projectsAs mentioned above, the number of cloud-based analytical projects can show the relative maturity of an organization’s implementation capability and how they align their best practices and technical requirements for service providers.
Overlaying the extent of Cloud Strategy over the number of projects demonstrates that organizations with a Full Cloud Coverage strategy dominate the number of project implementations across the board.Diagram 31
0% 2% 4% 6% 8% 10% 12% 14% 16% 18% 20% 22%
1
2
3
4
5 to 7
8 to 10
11+ projects
11.1%
12.8%
10.1%
2.1%
3.6%
2.4%
1.8%
1.2%
1.8%
5.2%
6.4%
5.2%
5.9%
2.4%
3.6%
1.4%
8.1%
8.9%
4.8%
Number of Project by Cloud Strategy
Cloud StrategyScattered Clouds
Partly Cloudy
Full Cloud Coverage
Percentage of All Mentions
This type of distribution from Full Cloud Coverage and Partly Cloudy organizations is not surprising as they are implementing projects at a higher rate than organizations utilizing a Scattered Clouds strategy. This distribution shows that there is a link between the implementation maturity and the extent of overall strategy.
©2015 Enterprise Management Associates, Inc. All Rights Reserved. | www.enterprisemanagement.comPage 24
Analytics in the Cloud
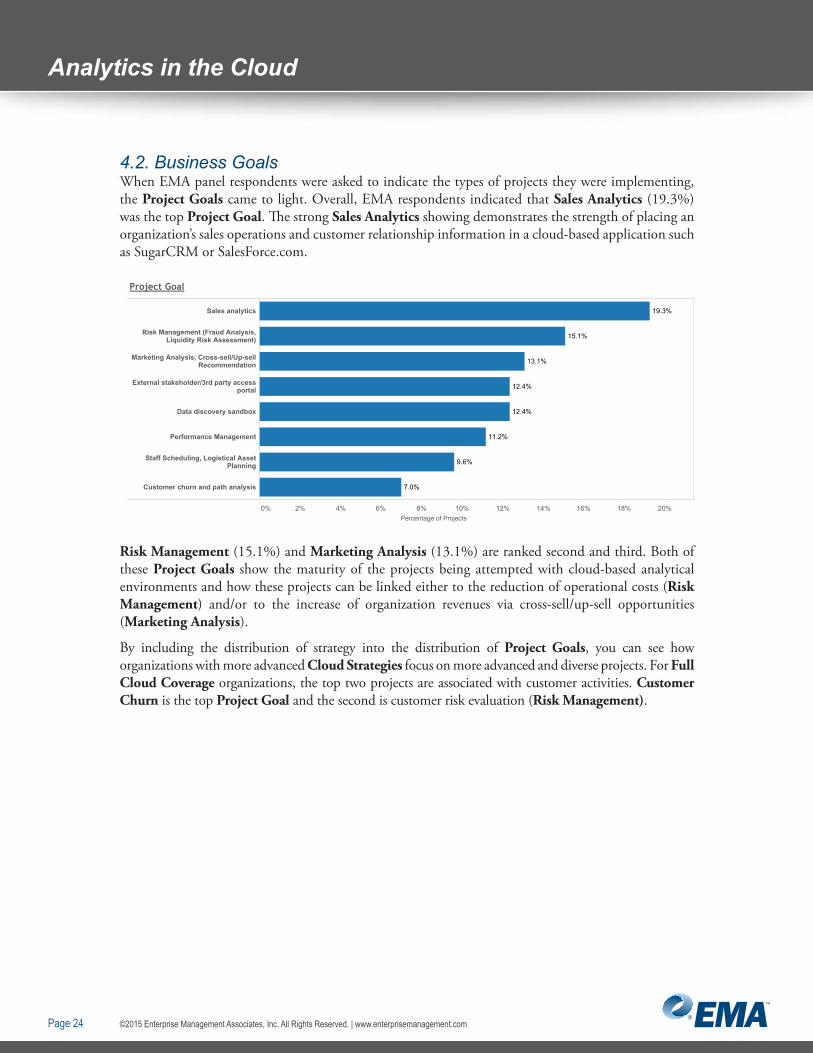
4.2. Business GoalsWhen EMA panel respondents were asked to indicate the types of projects they were implementing, the Project Goals came to light. Overall, EMA respondents indicated that Sales Analytics (19.3%) was the top Project Goal. The strong Sales Analytics showing demonstrates the strength of placing an organization’s sales operations and customer relationship information in a cloud-based application such as SugarCRM or SalesForce.com.Diagram 32
0% 2% 4% 6% 8% 10% 12% 14% 16% 18% 20%
Sales analytics
Risk Management (Fraud Analysis,Liquidity Risk Assessment)
Marketing Analysis, Cross-sell/Up-sellRecommendation
External stakeholder/3rd party accessportal
Data discovery sandbox
Performance Management
Staff Scheduling, Logistical AssetPlanning
Customer churn and path analysis
19.3%
15.1%
13.1%
12.4%
12.4%
11.2%
9.6%
7.0%
Project Goal
Percentage of Projects
Risk Management (15.1%) and Marketing Analysis (13.1%) are ranked second and third. Both of these Project Goals show the maturity of the projects being attempted with cloud-based analytical environments and how these projects can be linked either to the reduction of operational costs (Risk Management) and/or to the increase of organization revenues via cross-sell/up-sell opportunities (Marketing Analysis).
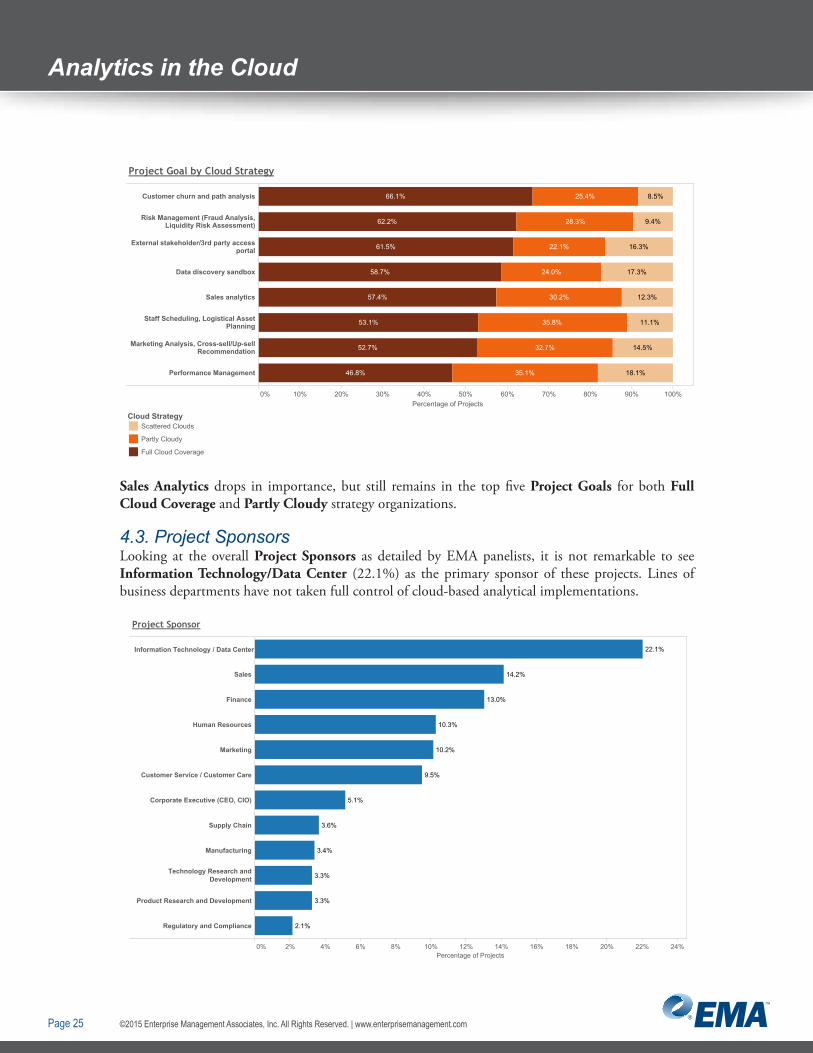
By including the distribution of strategy into the distribution of Project Goals, you can see how organizations with more advanced Cloud Strategies focus on more advanced and diverse projects. For Full Cloud Coverage organizations, the top two projects are associated with customer activities. Customer Churn is the top Project Goal and the second is customer risk evaluation (Risk Management).
©2015 Enterprise Management Associates, Inc. All Rights Reserved. | www.enterprisemanagement.comPage 25
Analytics in the Cloud
Diagram 33
0% 10% 20% 30% 40% 50% 60% 70% 80% 90% 100%
Customer churn and path analysis
Risk Management (Fraud Analysis,Liquidity Risk Assessment)
External stakeholder/3rd party accessportal
Data discovery sandbox
Sales analytics
Staff Scheduling, Logistical AssetPlanning
Marketing Analysis, Cross-sell/Up-sellRecommendation
Performance Management
16.3%
17.3%
12.3%
11.1%
14.5%
18.1%
25.4%
28.3%
22.1%
24.0%
30.2%
35.8%
32.7%
35.1%
66.1%
62.2%
61.5%
58.7%
57.4%
53.1%
52.7%
46.8%
8.5%
9.4%
Project Goal by Cloud Strategy
Cloud StrategyScattered Clouds
Partly Cloudy
Full Cloud Coverage
Percentage of Projects
Sales Analytics drops in importance, but still remains in the top five Project Goals for both Full Cloud Coverage and Partly Cloudy strategy organizations.
4.3. Project SponsorsLooking at the overall Project Sponsors as detailed by EMA panelists, it is not remarkable to see Information Technology/Data Center (22.1%) as the primary sponsor of these projects. Lines of business departments have not taken full control of cloud-based analytical implementations.Diagram 34
0% 2% 4% 6% 8% 10% 12% 14% 16% 18% 20% 22% 24%Percentage of Projects
Sales
Finance
Human Resources
Marketing
Customer Service / Customer Care
Corporate Executive (CEO, CIO)
Supply Chain
Manufacturing
Technology Research andDevelopment
Product Research and Development
Regulatory and Compliance
22.1%
14.2%
13.0%
10.3%
10.2%
9.5%
5.1%
3.6%
3.4%
3.3%
3.3%
2.1%
Project Sponsor
Information Technology / Data Center
©2015 Enterprise Management Associates, Inc. All Rights Reserved. | www.enterprisemanagement.comPage 26
Analytics in the Cloud
However, the next four sponsors—the Sales (14.2%), Finance (13.0%), Human Resources (10.3%), and Marketing (10.2%) line of business departments—have significant influence on these projects. Again, this finding reflects the Project Goal distribution above. Sales needs insight into Sales Analytics. Finance desires to have controls and visibility into Risk Management projects. Marketing requires actionable intelligence into the activities associated with cross-sell/up-sell (Marketing Analytics).
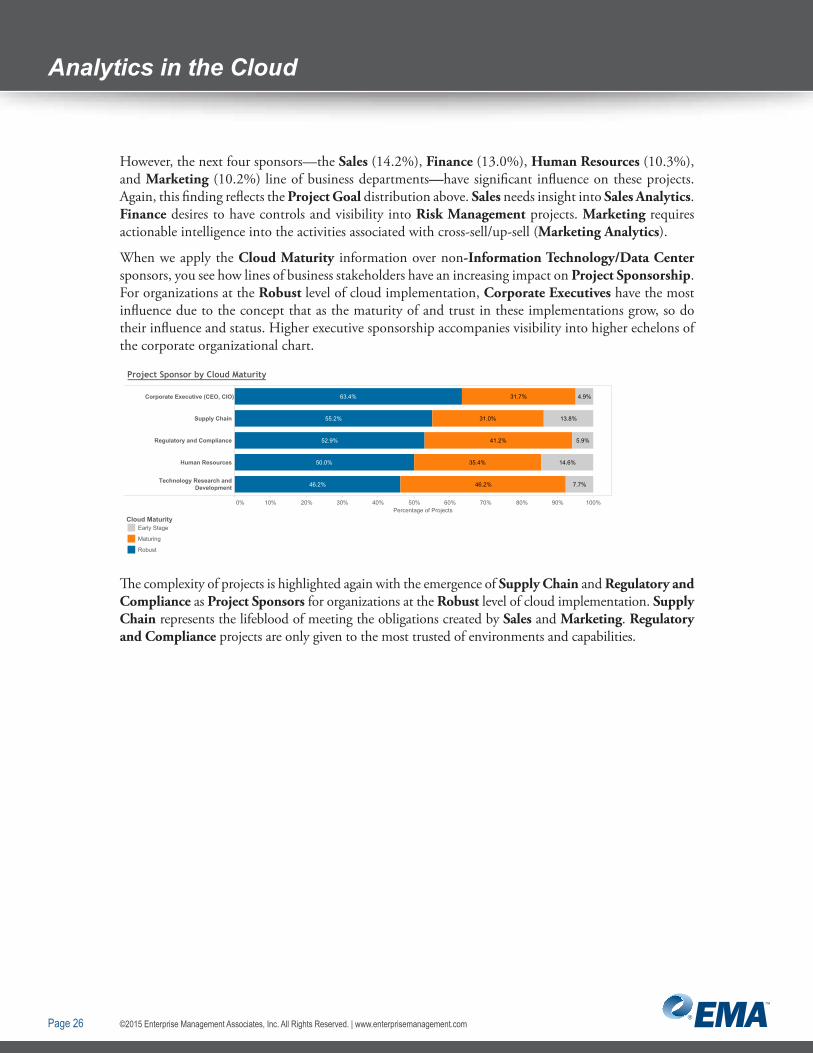
When we apply the Cloud Maturity information over non-Information Technology/Data Center sponsors, you see how lines of business stakeholders have an increasing impact on Project Sponsorship. For organizations at the Robust level of cloud implementation, Corporate Executives have the most influence due to the concept that as the maturity of and trust in these implementations grow, so do their influence and status. Higher executive sponsorship accompanies visibility into higher echelons of the corporate organizational chart. Diagram 35
0% 10% 20% 30% 40% 50% 60% 70% 80% 90% 100%Percentage of Projects
Supply Chain
Regulatory and Compliance
Human Resources
Technology Research andDevelopment
13.8%
14.6%
31.7%
31.0%
41.2%
35.4%
46.2%
63.4%
55.2%
52.9%
50.0%
46.2%
4.9%
5.9%
7.7%
Cloud MaturityEarly Stage
Maturing
Robust
Corporate Executive (CEO, CIO)
Project Sponsor by Cloud Maturity
The complexity of projects is highlighted again with the emergence of Supply Chain and Regulatory and Compliance as Project Sponsors for organizations at the Robust level of cloud implementation. Supply Chain represents the lifeblood of meeting the obligations created by Sales and Marketing. Regulatory and Compliance projects are only given to the most trusted of environments and capabilities.
©2015 Enterprise Management Associates, Inc. All Rights Reserved. | www.enterprisemanagement.comPage 27
Analytics in the Cloud
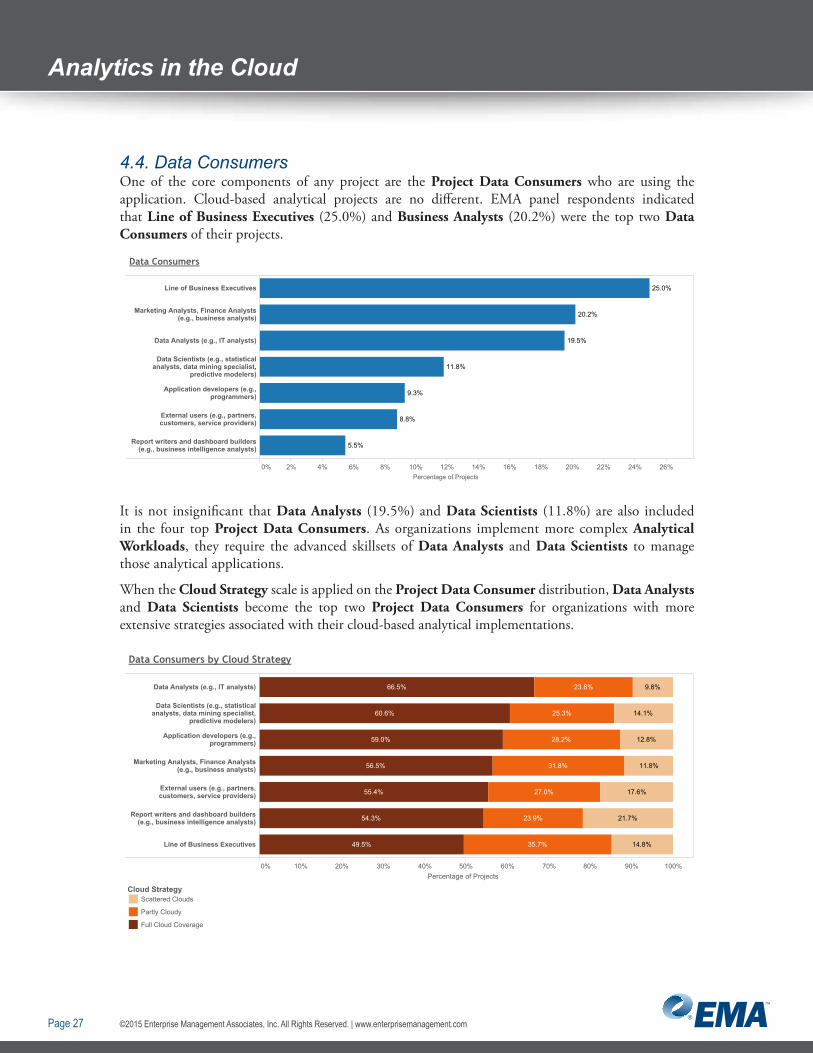
4.4. Data ConsumersOne of the core components of any project are the Project Data Consumers who are using the application. Cloud-based analytical projects are no different. EMA panel respondents indicated that Line of Business Executives (25.0%) and Business Analysts (20.2%) were the top two Data Consumers of their projects.
Diagram 36
0% 2% 4% 6% 8% 10% 12% 14% 16% 18% 20% 22% 24% 26%
Line of Business Executives
Marketing Analysts, Finance Analysts(e.g., business analysts)
Data Analysts (e.g., IT analysts)
Data Scientists (e.g., statisticalanalysts, data mining specialist,
predictive modelers)
Application developers (e.g.,programmers)
External users (e.g., partners,customers, service providers)
Report writers and dashboard builders(e.g., business intelligence analysts)
25.0%
20.2%
19.5%
11.8%
9.3%
8.8%
5.5%
Data Consumers
Percentage of Projects
It is not insignificant that Data Analysts (19.5%) and Data Scientists (11.8%) are also included in the four top Project Data Consumers. As organizations implement more complex Analytical Workloads, they require the advanced skillsets of Data Analysts and Data Scientists to manage those analytical applications.
When the Cloud Strategy scale is applied on the Project Data Consumer distribution, Data Analysts and Data Scientists become the top two Project Data Consumers for organizations with more extensive strategies associated with their cloud-based analytical implementations.
Diagram 37
0% 10% 20% 30% 40% 50% 60% 70% 80% 90% 100%
Data Analysts (e.g., IT analysts)
Data Scientists (e.g., statisticalanalysts, data mining specialist,
predictive modelers)
Application developers (e.g.,programmers)
Marketing Analysts, Finance Analysts(e.g., business analysts)
External users (e.g., partners,customers, service providers)
Report writers and dashboard builders(e.g., business intelligence analysts)
Line of Business Executives
14.1%
12.8%
11.8%
17.6%
21.7%
14.8%
23.8%
25.3%
28.2%
31.8%
27.0%
23.9%
35.7%
66.5%
60.6%
59.0%
56.5%
55.4%
54.3%
49.5%
9.8%
Data Consumers by Cloud Strategy
Cloud StrategyScattered Clouds
Partly Cloudy
Full Cloud Coverage
Percentage of Projects
©2015 Enterprise Management Associates, Inc. All Rights Reserved. | www.enterprisemanagement.comPage 28
Analytics in the Cloud
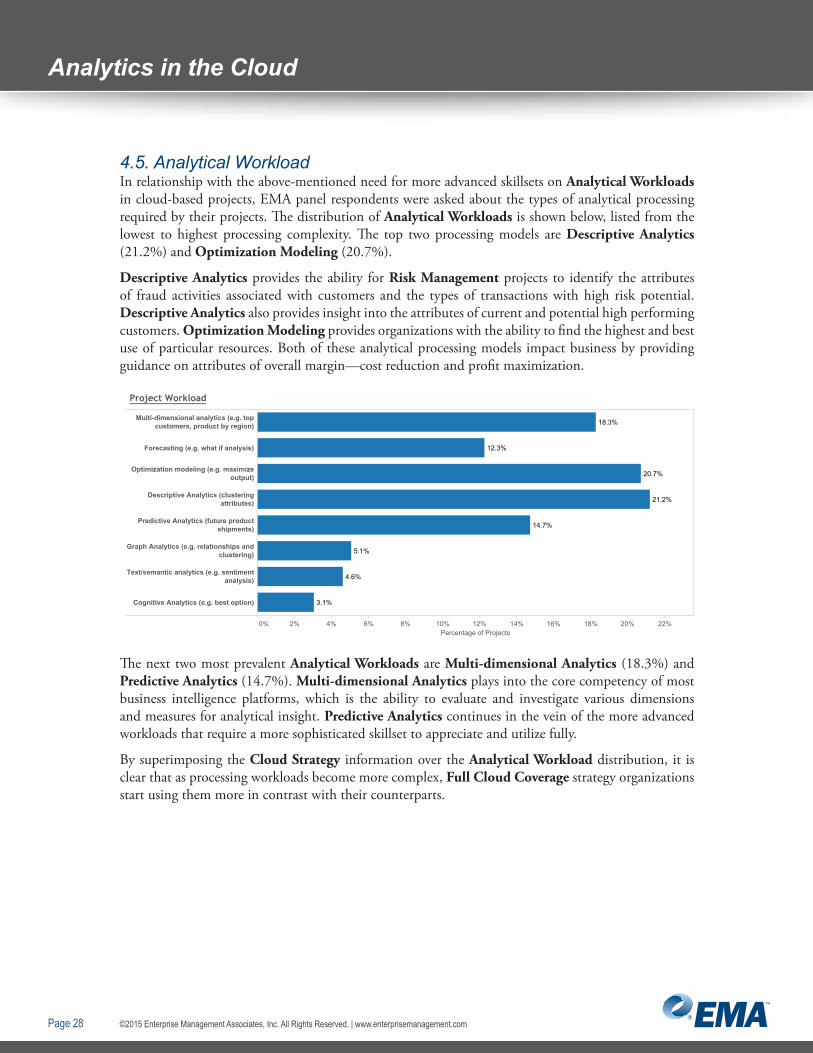
4.5. Analytical WorkloadIn relationship with the above-mentioned need for more advanced skillsets on Analytical Workloads in cloud-based projects, EMA panel respondents were asked about the types of analytical processing required by their projects. The distribution of Analytical Workloads is shown below, listed from the lowest to highest processing complexity. The top two processing models are Descriptive Analytics (21.2%) and Optimization Modeling (20.7%).
Descriptive Analytics provides the ability for Risk Management projects to identify the attributes of fraud activities associated with customers and the types of transactions with high risk potential. Descriptive Analytics also provides insight into the attributes of current and potential high performing customers. Optimization Modeling provides organizations with the ability to find the highest and best use of particular resources. Both of these analytical processing models impact business by providing guidance on attributes of overall margin—cost reduction and profit maximization.
Diagram 38
Project Workload
0% 2% 4% 6% 8% 10% 12% 14% 16% 18% 20% 22%Percentage of Projects
Multi-dimensional analytics (e.g. topcustomers, product by region)
Forecasting (e.g. what if analysis)
Optimization modeling (e.g. maximizeoutput)
Descriptive Analytics (clusteringattributes)
Predictive Analytics (future productshipments)
Graph Analytics (e.g. relationships andclustering)
Text/semantic analytics (e.g. sentimentanalysis)
Cognitive Analytics (e.g. best option)
18.3%
12.3%
20.7%
21.2%
14.7%
5.1%
4.6%
3.1%
The next two most prevalent Analytical Workloads are Multi-dimensional Analytics (18.3%) and Predictive Analytics (14.7%). Multi-dimensional Analytics plays into the core competency of most business intelligence platforms, which is the ability to evaluate and investigate various dimensions and measures for analytical insight. Predictive Analytics continues in the vein of the more advanced workloads that require a more sophisticated skillset to appreciate and utilize fully.
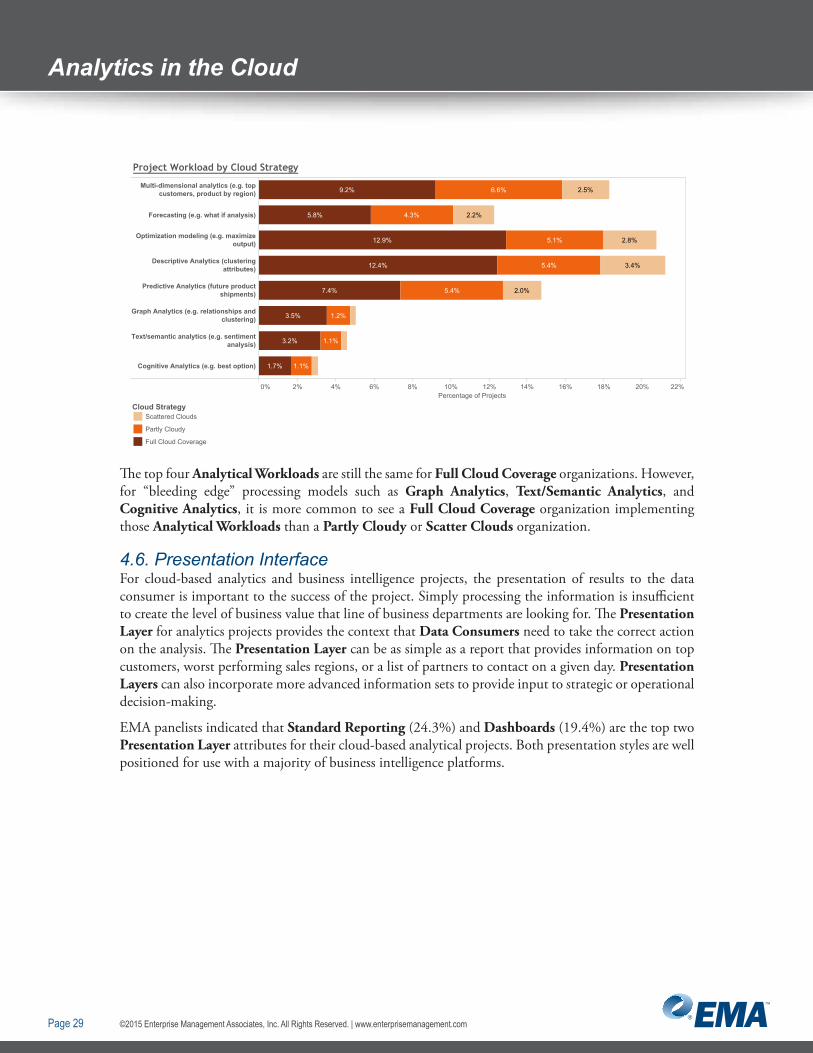
By superimposing the Cloud Strategy information over the Analytical Workload distribution, it is clear that as processing workloads become more complex, Full Cloud Coverage strategy organizations start using them more in contrast with their counterparts.
©2015 Enterprise Management Associates, Inc. All Rights Reserved. | www.enterprisemanagement.comPage 29
Analytics in the Cloud
Diagram 39
0% 2% 4% 6% 8% 10% 12% 14% 16% 18% 20% 22%Percentage of Projects
Multi-dimensional analytics (e.g. topcustomers, product by region)
Forecasting (e.g. what if analysis)
Optimization modeling (e.g. maximizeoutput)
Descriptive Analytics (clusteringattributes)
Predictive Analytics (future productshipments)
Graph Analytics (e.g. relationships andclustering)
Text/semantic analytics (e.g. sentimentanalysis)
Cognitive Analytics (e.g. best option)
12.9%
12.4%
2.5%
2.2%
2.8%
3.4%
2.0%
6.6%
4.3%
5.1%
5.4%
5.4%
1.2%
1.1%
1.1%
9.2%
5.8%
7.4%
3.5%
3.2%
1.7%
Cloud StrategyScattered Clouds
Partly Cloudy
Full Cloud Coverage
Project Workload by Cloud Strategy
The top four Analytical Workloads are still the same for Full Cloud Coverage organizations. However, for “bleeding edge” processing models such as Graph Analytics, Text/Semantic Analytics, and Cognitive Analytics, it is more common to see a Full Cloud Coverage organization implementing those Analytical Workloads than a Partly Cloudy or Scatter Clouds organization.
4.6. Presentation InterfaceFor cloud-based analytics and business intelligence projects, the presentation of results to the data consumer is important to the success of the project. Simply processing the information is insufficient to create the level of business value that line of business departments are looking for. The Presentation Layer for analytics projects provides the context that Data Consumers need to take the correct action on the analysis. The Presentation Layer can be as simple as a report that provides information on top customers, worst performing sales regions, or a list of partners to contact on a given day. Presentation Layers can also incorporate more advanced information sets to provide input to strategic or operational decision-making.
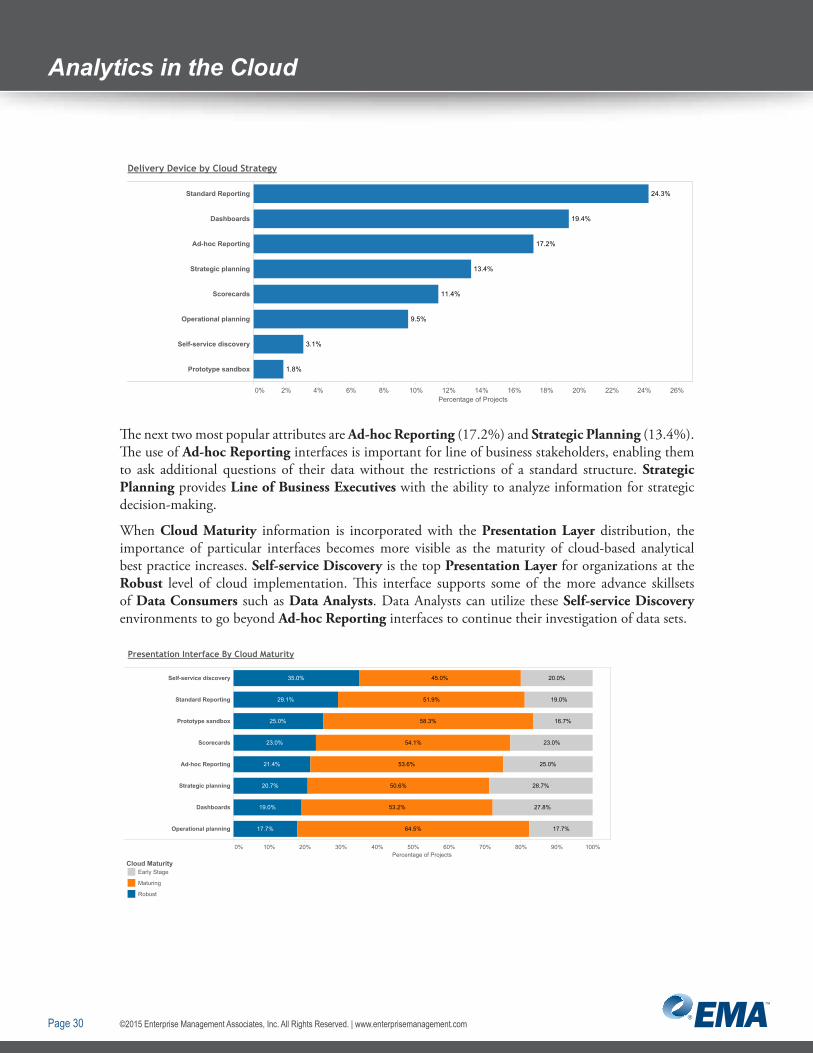
EMA panelists indicated that Standard Reporting (24.3%) and Dashboards (19.4%) are the top two Presentation Layer attributes for their cloud-based analytical projects. Both presentation styles are well positioned for use with a majority of business intelligence platforms.
©2015 Enterprise Management Associates, Inc. All Rights Reserved. | www.enterprisemanagement.comPage 30
Analytics in the Cloud
Diagram 40
0% 2% 4% 6% 8% 10% 12% 14% 16% 18% 20% 22% 24% 26%Percentage of Projects
Standard Reporting
Dashboards
Ad-hoc Reporting
Strategic planning
Scorecards
Operational planning
Self-service discovery
Prototype sandbox
24.3%
19.4%
17.2%
13.4%
11.4%
9.5%
3.1%
1.8%
Delivery Device by Cloud Strategy
The next two most popular attributes are Ad-hoc Reporting (17.2%) and Strategic Planning (13.4%). The use of Ad-hoc Reporting interfaces is important for line of business stakeholders, enabling them to ask additional questions of their data without the restrictions of a standard structure. Strategic Planning provides Line of Business Executives with the ability to analyze information for strategic decision-making.
When Cloud Maturity information is incorporated with the Presentation Layer distribution, the importance of particular interfaces becomes more visible as the maturity of cloud-based analytical best practice increases. Self-service Discovery is the top Presentation Layer for organizations at the Robust level of cloud implementation. This interface supports some of the more advance skillsets of Data Consumers such as Data Analysts. Data Analysts can utilize these Self-service Discovery environments to go beyond Ad-hoc Reporting interfaces to continue their investigation of data sets.
Diagram 41
0% 10% 20% 30% 40% 50% 60% 70% 80% 90% 100%Percentage of Projects
Self-service discovery
Standard Reporting
Prototype sandbox
Scorecards
Ad-hoc Reporting
Strategic planning
Dashboards
Operational planning
20.0%
19.0%
16.7%
23.0%
25.0%
28.7%
27.8%
17.7%
45.0%
51.9%
58.3%
54.1%
53.6%
50.6%
53.2%
64.5%
35.0%
29.1%
25.0%
23.0%
21.4%
20.7%
19.0%
17.7%
Presentation Interface By Cloud Maturity
Cloud MaturityEarly Stage
Maturing
Robust
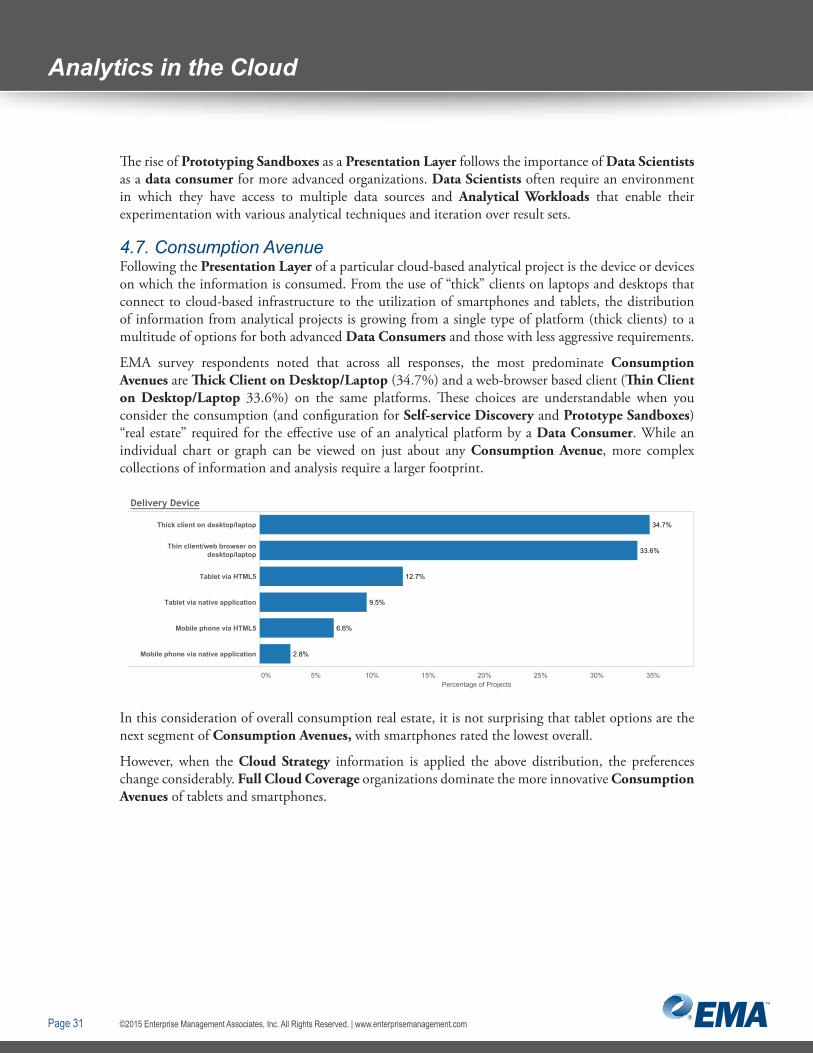
©2015 Enterprise Management Associates, Inc. All Rights Reserved. | www.enterprisemanagement.comPage 31
Analytics in the Cloud
The rise of Prototyping Sandboxes as a Presentation Layer follows the importance of Data Scientists as a data consumer for more advanced organizations. Data Scientists often require an environment in which they have access to multiple data sources and Analytical Workloads that enable their experimentation with various analytical techniques and iteration over result sets.
4.7. Consumption AvenueFollowing the Presentation Layer of a particular cloud-based analytical project is the device or devices on which the information is consumed. From the use of “thick” clients on laptops and desktops that connect to cloud-based infrastructure to the utilization of smartphones and tablets, the distribution of information from analytical projects is growing from a single type of platform (thick clients) to a multitude of options for both advanced Data Consumers and those with less aggressive requirements.
EMA survey respondents noted that across all responses, the most predominate Consumption Avenues are Thick Client on Desktop/Laptop (34.7%) and a web-browser based client (Thin Client on Desktop/Laptop 33.6%) on the same platforms. These choices are understandable when you consider the consumption (and configuration for Self-service Discovery and Prototype Sandboxes) “real estate” required for the effective use of an analytical platform by a Data Consumer. While an individual chart or graph can be viewed on just about any Consumption Avenue, more complex collections of information and analysis require a larger footprint.
Diagram 42
0% 5% 10% 15% 25% 30% 35%20%Percentage of Projects
Thick client on desktop/laptop
Thin client/web browser ondesktop/laptop
Tablet via HTML5
Tablet via native application
Mobile phone via HTML5
Mobile phone via native application
34.7%
33.6%
12.7%
9.5%
6.6%
2.8%
Delivery Device
In this consideration of overall consumption real estate, it is not surprising that tablet options are the next segment of Consumption Avenues, with smartphones rated the lowest overall.
However, when the Cloud Strategy information is applied the above distribution, the preferences change considerably. Full Cloud Coverage organizations dominate the more innovative Consumption Avenues of tablets and smartphones.

©2015 Enterprise Management Associates, Inc. All Rights Reserved. | www.enterprisemanagement.comPage 32
Analytics in the CloudDiagram 43
0% 5% 10% 15% 20% 25% 30% 35%Percentage of Projects
Thick client on desktop/laptop
Thin client/web browser ondesktop/laptop
Tablet via HTML5
Tablet via native application
Mobile phone via HTML5
Mobile phone via native application
12.3%17.8%
18.9%
4.6%
5.8%
1.5%
8.9%
3.1%
3.1%
1.7%
8.1%
6.0%
4.1%
Delivery Device by Cloud Strategy
Cloud StrategyScattered Clouds
Partly Cloudy
Full Cloud Coverage
Thick Client on Desktop/Laptop and Thin Client on Desktop/Laptop have comparable distributions to other organizations on projects. However, Full Cloud Coverage organizations extend their vision for cloud-based implementations to their dominance of the implementation on mobile platforms.
4.8. Main Cloud ComponentWith various Consumption Avenues and Presentation Layers playing an important part in how data consumers utilize information from cloud-based analytics projects, underlying cloud infrastructure becomes an important attribute. Not all of the components of a particular analytical initiative or project are required to be cloud-based for consideration for a cloud-based project; one or more components may be implemented on a cloud-based architecture.
EMA survey respondents were asked which of the following components are the primary cloud-based elements for their project.
• Data Acquisition – Includes operational data capture and bulk data integration.
• Data Management – Comprises data storage and maintenance platforms such as relational databases and NoSQL data stores that support data warehouses, data marts, and data lakes.
• Data Quality/Stewardship – Consists of quality and metadata management models to support the improvement and categorization of data.
• Business Analytics – Incorporates development and implementation of analytical models such as multi-dimension query processing and descriptive and predictive analytics.
• Data Visualization – Includes the display and reporting of the results of business analytical models via reports and static and dynamic dashboards.
• Collaboration – Involves the direction of action associated with the implementation of the concepts listed above: Data Acquisition, Data Management, Data Quality/Stewardship, Business Analytics, and Data Visualization.
• Integrated Analytics Platform – The inclusion of all of the functional components listed above into a single platform.
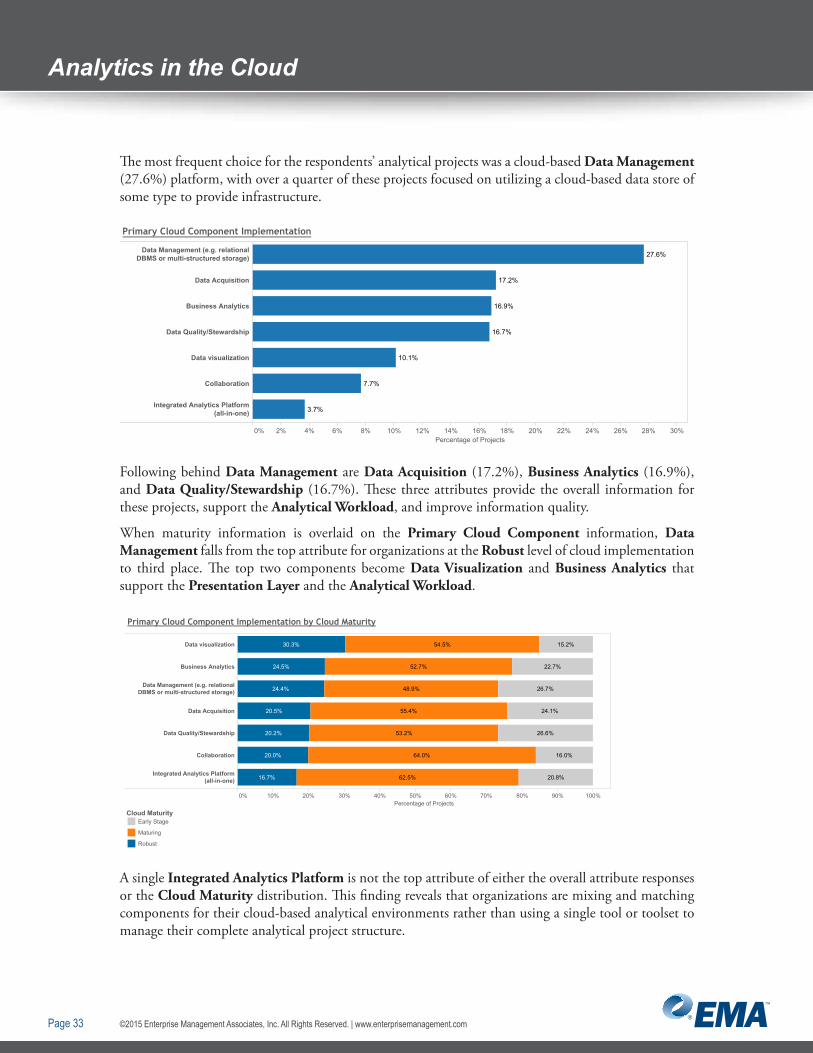
©2015 Enterprise Management Associates, Inc. All Rights Reserved. | www.enterprisemanagement.comPage 33
Analytics in the Cloud
The most frequent choice for the respondents’ analytical projects was a cloud-based Data Management (27.6%) platform, with over a quarter of these projects focused on utilizing a cloud-based data store of some type to provide infrastructure.
Diagram 44
0% 2% 4% 6% 8% 10% 12% 14% 16% 18% 20% 22% 24% 26% 28% 30%Percentage of Projects
Data Management (e.g. relationalDBMS or multi-structured storage)
Data Acquisition
Business Analytics
Data Quality/Stewardship
Data visualization
Collaboration
Integrated Analytics Platform(all-in-one)
27.6%
17.2%
16.9%
16.7%
10.1%
7.7%
3.7%
Primary Cloud Component Implementation
Following behind Data Management are Data Acquisition (17.2%), Business Analytics (16.9%), and Data Quality/Stewardship (16.7%). These three attributes provide the overall information for these projects, support the Analytical Workload, and improve information quality.
When maturity information is overlaid on the Primary Cloud Component information, Data Management falls from the top attribute for organizations at the Robust level of cloud implementation to third place. The top two components become Data Visualization and Business Analytics that support the Presentation Layer and the Analytical Workload.Diagram 45
0% 10% 20% 30% 40% 50% 60% 70% 80% 90% 100%Percentage of Projects
Data visualization
Business Analytics
Data Management (e.g. relationalDBMS or multi-structured storage)
Data Acquisition
Data Quality/Stewardship
Collaboration
Integrated Analytics Platform(all-in-one)
15.2%
22.7%
26.7%
24.1%
26.6%
16.0%
20.8%
54.5%
52.7%
48.9%
55.4%
53.2%
64.0%
62.5%
30.3%
24.5%
24.4%
20.5%
20.2%
20.0%
16.7%
Primary Cloud Component Implementation by Cloud Maturity
Cloud MaturityEarly Stage
Maturing
Robust
A single Integrated Analytics Platform is not the top attribute of either the overall attribute responses or the Cloud Maturity distribution. This finding reveals that organizations are mixing and matching components for their cloud-based analytical environments rather than using a single tool or toolset to manage their complete analytical project structure.
©2015 Enterprise Management Associates, Inc. All Rights Reserved. | www.enterprisemanagement.comPage 34
Analytics in the Cloud
5. Implementation InfrastructureWith the Primary Cloud Components of these specific projects detailed above, it is important to examine the wider cloud-based architectures utilized by organizations in the EMA Cloud-Based Analytics and Business Intelligence study. These horizontal architectures are the infrastructure that individual projects rest upon and provide a measure of reusability for future projects.
5.1. Analytical ElementsAs mentioned above, analytical environments consist of several core components: Data Acquisition, Data Management, Data Quality/Stewardship, Business Analytics, Data Visualization, and Collaboration. These elements can be used individually as part of a cloud-based analytical environment or they can be implemented as a single Integrated Analytics Platform.
EMA panel respondents were asked to detail how their organization implements these Analytical Elements in their cloud environment. Data Visualization was broken into the two components of Reporting and Dashboards to differentiate between those similar, but significantly different aspects of visualizing information.
EMA panel respondents were asked how they implement these Analytical Elements across a range of options. Choices ranged from a completely “non” cloud-based implementation associated with a licensed, on-premises data center implementation to a complete managed services option in which cloud service providers supply the entire environment, often including professional services. These options were defined for the EMA panel respondents as follows.
• On-Premises Data Center – Traditional licensed software installed and operated from an in-house server and computing infrastructure
• Infrastructure as a Service (IaaS) – Includes storage, hardware, servers, and networking components
• Platform as a Service (PaaS) – Data management systems and development environments
• Software as a Service (SaaS) – Hosted application environments
• Managed Services – Fully managed end-to-end technical environment and services to support the delivered solution
The following graph shows the overall importance of various cloud-based implementation strategies of Analytical Elements as indicated by EMA panel respondents. The bars trending to the right side of the graph indicate a higher rate of implementation using cloud-based strategies such as Infrastructure as a Service, Platform as a Service, Software as a Service, or Managed Services. The bars that trend to the left utilize On-Premises Data Center options for implementation.
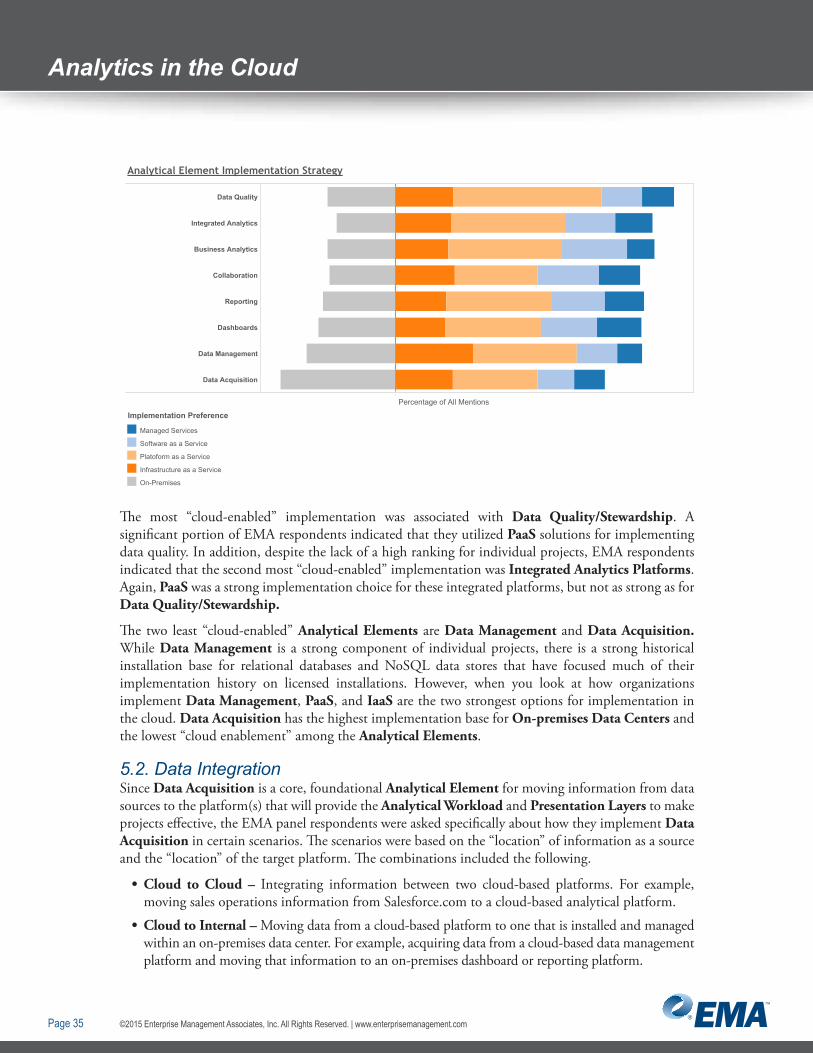
©2015 Enterprise Management Associates, Inc. All Rights Reserved. | www.enterprisemanagement.comPage 35
Analytics in the Cloud
Diagram 46
Data Quality
Integrated Analytics
Business Analytics
Collaboration
Reporting
Dashboards
Data Management
Data Acquisition
Analytical Element Implementation Strategy
Percentage of All Mentions
Managed Services
Software as a Service
Platoform as a Service
Infrastructure as a Service
On-Premises
Implementation Preference
The most “cloud-enabled” implementation was associated with Data Quality/Stewardship. A significant portion of EMA respondents indicated that they utilized PaaS solutions for implementing data quality. In addition, despite the lack of a high ranking for individual projects, EMA respondents indicated that the second most “cloud-enabled” implementation was Integrated Analytics Platforms. Again, PaaS was a strong implementation choice for these integrated platforms, but not as strong as for Data Quality/Stewardship.
The two least “cloud-enabled” Analytical Elements are Data Management and Data Acquisition. While Data Management is a strong component of individual projects, there is a strong historical installation base for relational databases and NoSQL data stores that have focused much of their implementation history on licensed installations. However, when you look at how organizations implement Data Management, PaaS, and IaaS are the two strongest options for implementation in the cloud. Data Acquisition has the highest implementation base for On-premises Data Centers and the lowest “cloud enablement” among the Analytical Elements.
5.2. Data IntegrationSince Data Acquisition is a core, foundational Analytical Element for moving information from data sources to the platform(s) that will provide the Analytical Workload and Presentation Layers to make projects effective, the EMA panel respondents were asked specifically about how they implement Data Acquisition in certain scenarios. The scenarios were based on the “location” of information as a source and the “location” of the target platform. The combinations included the following.
• Cloud to Cloud – Integrating information between two cloud-based platforms. For example, moving sales operations information from Salesforce.com to a cloud-based analytical platform.
• Cloud to Internal – Moving data from a cloud-based platform to one that is installed and managed within an on-premises data center. For example, acquiring data from a cloud-based data management platform and moving that information to an on-premises dashboard or reporting platform.
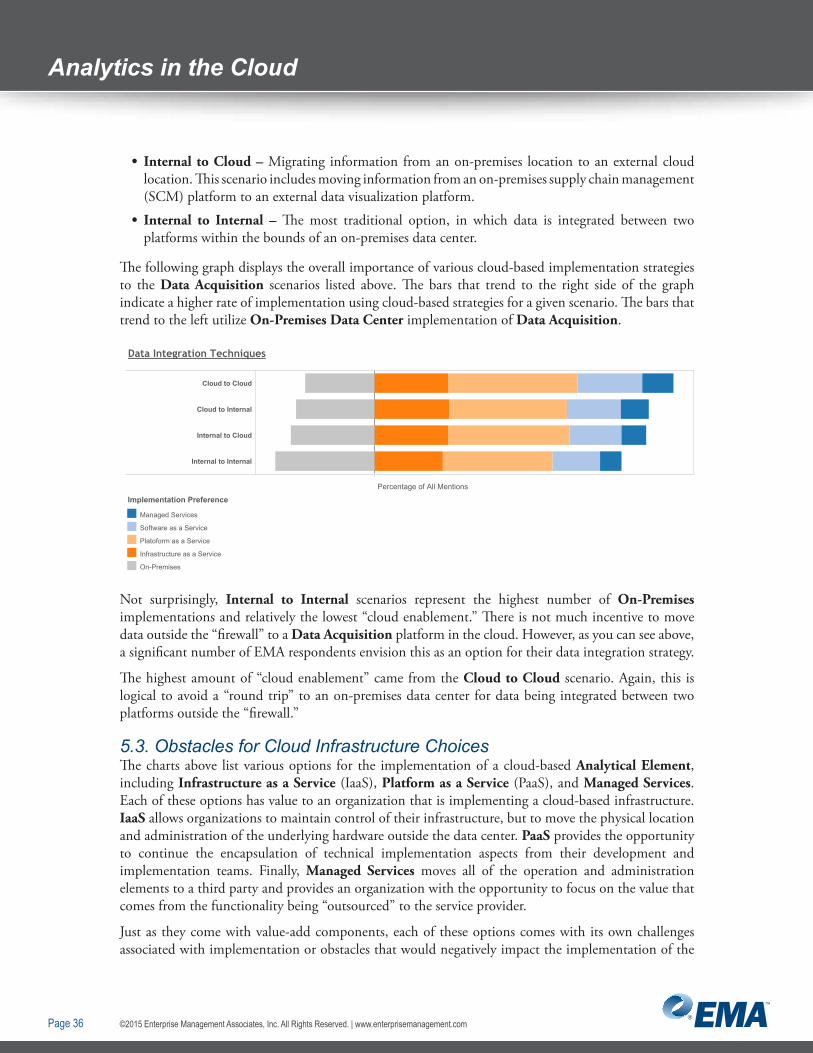
©2015 Enterprise Management Associates, Inc. All Rights Reserved. | www.enterprisemanagement.comPage 36
Analytics in the Cloud
• Internal to Cloud – Migrating information from an on-premises location to an external cloud location. This scenario includes moving information from an on-premises supply chain management (SCM) platform to an external data visualization platform.
• Internal to Internal – The most traditional option, in which data is integrated between two platforms within the bounds of an on-premises data center.
The following graph displays the overall importance of various cloud-based implementation strategies to the Data Acquisition scenarios listed above. The bars that trend to the right side of the graph indicate a higher rate of implementation using cloud-based strategies for a given scenario. The bars that trend to the left utilize On-Premises Data Center implementation of Data Acquisition.
Diagram 47
Cloud to Cloud
Cloud to Internal
Internal to Cloud
Internal to Internal
Data Integration Techniques
Percentage of All Mentions
Managed Services
Software as a Service
Platoform as a Service
Infrastructure as a Service
On-Premises
Implementation Preference
Not surprisingly, Internal to Internal scenarios represent the highest number of On-Premises implementations and relatively the lowest “cloud enablement.” There is not much incentive to move data outside the “firewall” to a Data Acquisition platform in the cloud. However, as you can see above, a significant number of EMA respondents envision this as an option for their data integration strategy.
The highest amount of “cloud enablement” came from the Cloud to Cloud scenario. Again, this is logical to avoid a “round trip” to an on-premises data center for data being integrated between two platforms outside the “firewall.”
5.3. Obstacles for Cloud Infrastructure ChoicesThe charts above list various options for the implementation of a cloud-based Analytical Element, including Infrastructure as a Service (IaaS), Platform as a Service (PaaS), and Managed Services. Each of these options has value to an organization that is implementing a cloud-based infrastructure. IaaS allows organizations to maintain control of their infrastructure, but to move the physical location and administration of the underlying hardware outside the data center. PaaS provides the opportunity to continue the encapsulation of technical implementation aspects from their development and implementation teams. Finally, Managed Services moves all of the operation and administration elements to a third party and provides an organization with the opportunity to focus on the value that comes from the functionality being “outsourced” to the service provider.
Just as they come with value-add components, each of these options comes with its own challenges associated with implementation or obstacles that would negatively impact the implementation of the
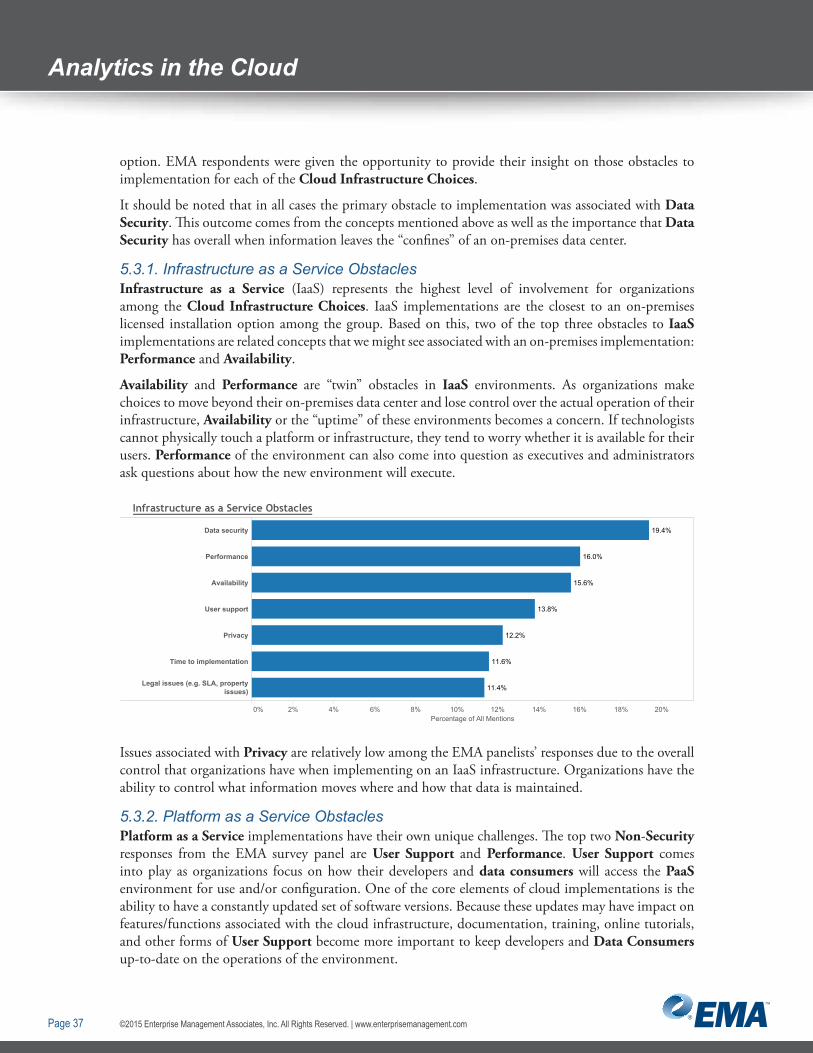
©2015 Enterprise Management Associates, Inc. All Rights Reserved. | www.enterprisemanagement.comPage 37
Analytics in the Cloud
option. EMA respondents were given the opportunity to provide their insight on those obstacles to implementation for each of the Cloud Infrastructure Choices.
It should be noted that in all cases the primary obstacle to implementation was associated with Data Security. This outcome comes from the concepts mentioned above as well as the importance that Data Security has overall when information leaves the “confines” of an on-premises data center.
5.3.1. Infrastructure as a Service ObstaclesInfrastructure as a Service (IaaS) represents the highest level of involvement for organizations among the Cloud Infrastructure Choices. IaaS implementations are the closest to an on-premises licensed installation option among the group. Based on this, two of the top three obstacles to IaaS implementations are related concepts that we might see associated with an on-premises implementation: Performance and Availability.
Availability and Performance are “twin” obstacles in IaaS environments. As organizations make choices to move beyond their on-premises data center and lose control over the actual operation of their infrastructure, Availability or the “uptime” of these environments becomes a concern. If technologists cannot physically touch a platform or infrastructure, they tend to worry whether it is available for their users. Performance of the environment can also come into question as executives and administrators ask questions about how the new environment will execute.
Diagram 48
0% 2% 4% 6% 8% 10% 12% 14% 16% 18% 20%Percentage of All Mentions
Data security
Performance
Availability
User support
Privacy
Time to implementation
Legal issues (e.g. SLA, propertyissues)
19.4%
16.0%
15.6%
13.8%
12.2%
11.6%
11.4%
Infrastructure as a Service Obstacles
Issues associated with Privacy are relatively low among the EMA panelists’ responses due to the overall control that organizations have when implementing on an IaaS infrastructure. Organizations have the ability to control what information moves where and how that data is maintained.
5.3.2. Platform as a Service ObstaclesPlatform as a Service implementations have their own unique challenges. The top two Non-Security responses from the EMA survey panel are User Support and Performance. User Support comes into play as organizations focus on how their developers and data consumers will access the PaaS environment for use and/or configuration. One of the core elements of cloud implementations is the ability to have a constantly updated set of software versions. Because these updates may have impact on features/functions associated with the cloud infrastructure, documentation, training, online tutorials, and other forms of User Support become more important to keep developers and Data Consumers up-to-date on the operations of the environment.

©2015 Enterprise Management Associates, Inc. All Rights Reserved. | www.enterprisemanagement.comPage 38
Analytics in the Cloud
Performance is also a concern for organizations implementing in a PaaS environment. If a PaaS environment is mis-sized or under-scoped for a particular project or workload, concerns emerge that are associated with the Performance of the environment. This is no different from an on-premises environment or an IaaS implementation, but it underscores organizations’ concerns over the overall operations of these cloud-based environments.Diagram 49
0% 2% 4% 6% 8% 10% 12% 14% 16% 18% 20%Percentage of All Mentions
Data security
User support
Performance
Privacy
Availability
Time to implementation
Legal issues (e.g. SLA, propertyissues)
19.0%
16.6%
16.3%
13.9%
11.7%
11.7%
10.7%
Platform as a Service Obstacles
Issues associated with Privacy rise for PaaS implementation in the EMA panelists’ responses. With the lower level of direct control over the environment and the increased level of technical implementation encapsulation, how sensitive information is accessed and protected becomes a higher priority.
5.3.3. (Hosted) Managed Services ObstaclesIn Managed Services implementations, Performance rises to the top non-Security concern among EMA survey panelists. This continues the theme of Performance being important to those implementing outside of their on-premises data center.Diagram 50
0% 2% 4% 6% 8% 10% 12% 14% 16% 18%Percentage of All Mentions
Data security
Performance
Privacy
Time to implementation
Availability
User support
Legal issues (e.g. SLA, propertyissues)
Other (please specify)
17.9%
16.4%
14.8%
14.2%
13.0%
12.7%
10.8%
0.3%
Managed Services Obstacles
Privacy moves into the overall top three obstacles associated with Managed Services implementations. With the complete encapsulation of implementation details to the service provider, organizations are concerned about how information is handled and who has access.

©2015 Enterprise Management Associates, Inc. All Rights Reserved. | www.enterprisemanagement.comPage 39
Analytics in the Cloud
6. Methodology and Demographics6.1. Research MethodologyEMA crafted the Cloud-based Analytics and Business Intelligence End User survey that is the basis for this report. The 2014 survey was based on a previous 2011 survey designed and implemented in partnership between EMA and BARC.
Before the survey was conducted, EMA provided report sponsors with a copy of the survey instrument. However, sponsors had no direct involvement in or influence on the survey creation, survey contents, survey execution, or any of the subsequent evaluation and analysis of the results for this report.
For this research, EMA invited pre-qualified business stakeholders and information technology (IT) professionals to complete an extensive web-based survey. Two hundred fifty-seven business and technology professionals responded to an invitation to provide their insights on Cloud-based Analytics and Business Intelligence strategies and implementation practices. To offer a balanced enterprise view of the subject, the respondent pool was also restricted. Business stakeholders represented 44% of respondents. Technologists were 56%. The 2014 survey instrument was executed in November 2014.
These respondents were further qualified based on their responses to the following questions.
• What is your primary role in the usage and/or management of cloud-based analytics and business intelligence applications/technology within your organization?
• Which of the following best describes your company’s primary industry?
• How would you describe the extent to which cloud-based analytics and business intelligence initiatives have been adopted within your business/organization?
• What is your relation to cloud-based analytics and business intelligence applications/products currently being used within your organization?
• At what phase of implementation are your business area /organization’s cloud-based analytics and business intelligence initiative’s project(s)?
Respondents who failed to qualify on these questions were rejected. As a result, all respondents (in addition to being independently pre-qualified through the initial invitation process) self-identified as being active participants with a working knowledge of current operational and analytical data management practices within their company that is presently researching, planning, or implementing cloud-based strategies and technologies.
7. Author
John Myers, EMA

About Enterprise Management Associates, Inc.Founded in 1996, Enterprise Management Associates (EMA) is a leading industry analyst firm that provides deep insight across the full spectrum of IT and data management technologies. EMA analysts leverage a unique combination of practical experience, insight into industry best practices, and in-depth knowledge of current and planned vendor solutions to help EMA’s clients achieve their goals. Learn more about EMA research, analysis, and consulting services for enterprise line of business users, IT professionals and IT vendors at www.enterprisemanagement.com or blogs.enterprisemanagement.com. You can also follow EMA on Twitter, Facebook or LinkedIn.
This report in whole or in part may not be duplicated, reproduced, stored in a retrieval system or retransmitted without prior written permission of Enterprise Management Associates, Inc. All opinions and estimates herein constitute our judgement as of this date and are subject to change without notice. Product names mentioned herein may be trademarks and/or registered trademarks of their respective companies. “EMA” and “Enterprise Management Associates” are trademarks of Enterprise Management Associates, Inc. in the United States and other countries.
©2015 Enterprise Management Associates, Inc. All Rights Reserved. EMA™, ENTERPRISE MANAGEMENT ASSOCIATES®, and the mobius symbol are registered trademarks or common-law trademarks of Enterprise Management Associates, Inc.
Corporate Headquarters: 1995 North 57th Court, Suite 120 Boulder, CO 80301 Phone: +1 303.543.9500 Fax: +1 303.543.7687 www.enterprisemanagement.com3080.011315