Embed Size (px)
Citation preview
Analytik von Biopharmazeutika –Vom Bioreaktor bis zum finalen Produkt
Gemeinsames Symposium des PVZ und der DPhG Fachgruppe Arzneimittelkontrolle/Pharmazeutische Analytik
Braunschweig, 12. März 2015
Christian Hunzinger
Agenda
DPhG Symposium Braunschweig | Christian Hunzinger | 12.03.20152
Introduction
− Analytics of Biopharmaceuticals
− Process Analytics as a Specific Segment
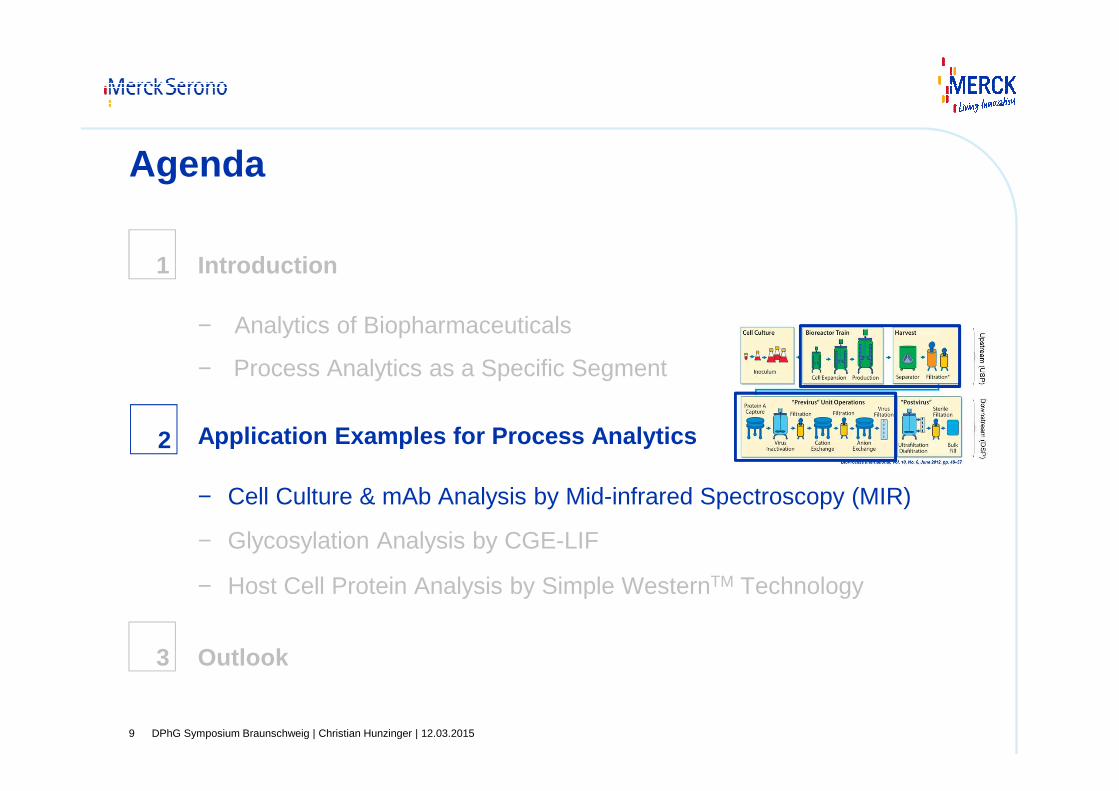
Application Examples for Process Analytics
− Cell Culture & mAb Analysis by Mid-infrared Spectroscopy (MIR)
− Glycosylation Analysis by CGE-LIF
− Host Cell Protein Analysis by Simple WesternTM Technology
Outlook
1
2
3
DPhG Symposium Braunschweig | Christian Hunzinger | 12.03.20153
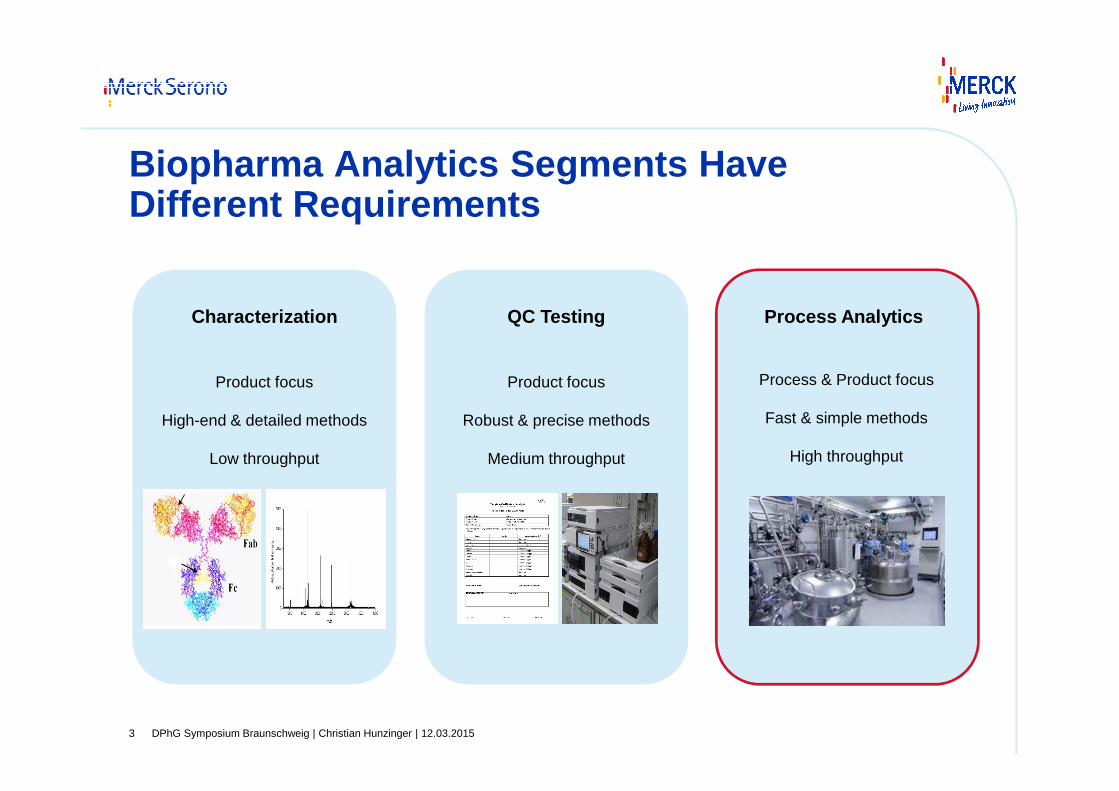
Biopharma Analytics Segments HaveDifferent Requirements
Characterization
Product focus
High-end & detailed methods
Low throughput
QC Testing
Product focus
Robust & precise methods
Medium throughput
Process Analytics
Process & Product focus
Fast & simple methods
High throughput
DPhG Symposium Braunschweig | Christian Hunzinger | 12.03.201544
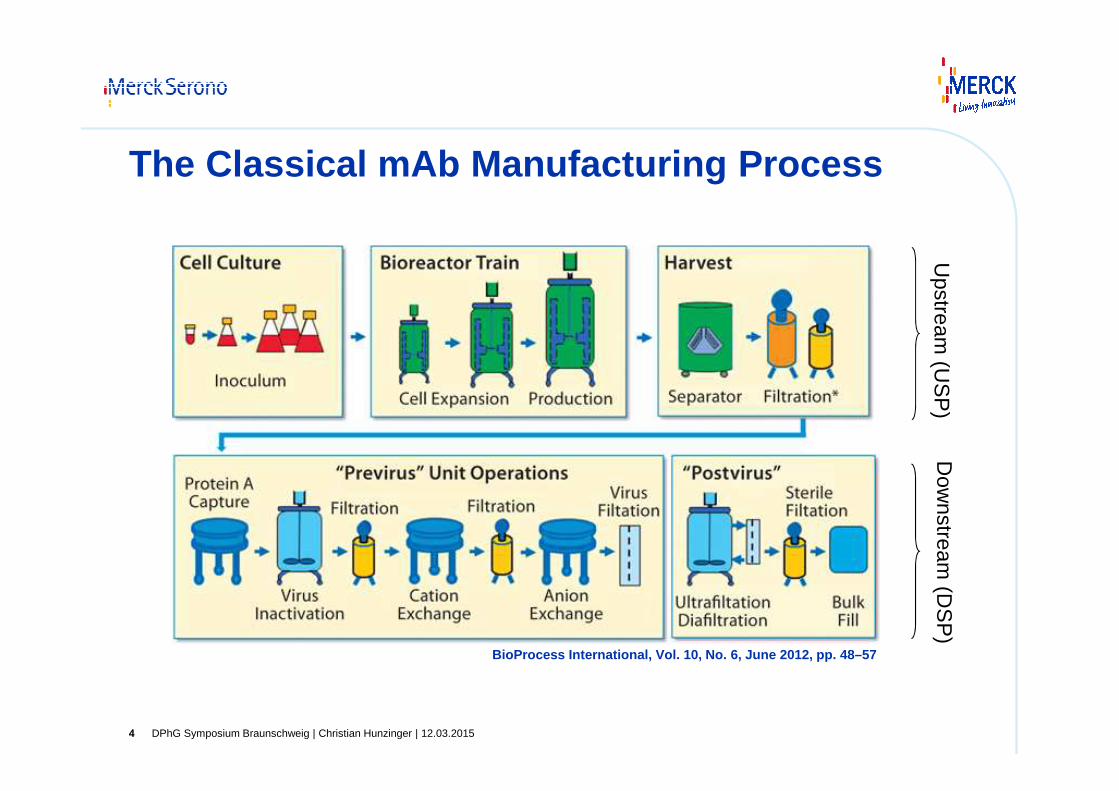
The Classical mAb Manufacturing ProcessU
pstream (U
SP
)D
ownstream
(DS
P)
BioProcess International, Vol. 10, No. 6, June 2012 , pp. 48–57
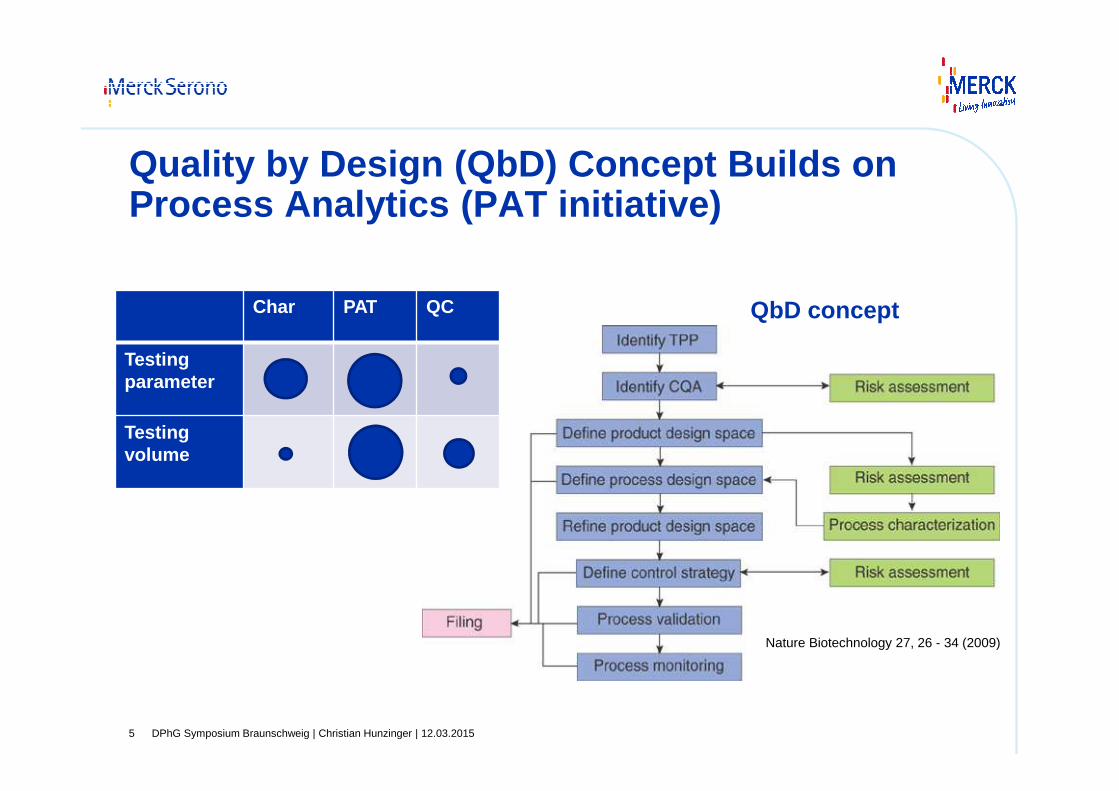
Quality by Design (QbD ) Concept Builds on Process Analytics (PAT initiative)
DPhG Symposium Braunschweig | Christian Hunzinger | 12.03.20155
Nature Biotechnology 27, 26 - 34 (2009)
Char PAT QC
Testingparameter
Testingvolume
QbD concept
DPhG Symposium Braunschweig | Christian Hunzinger | 12.03.20156
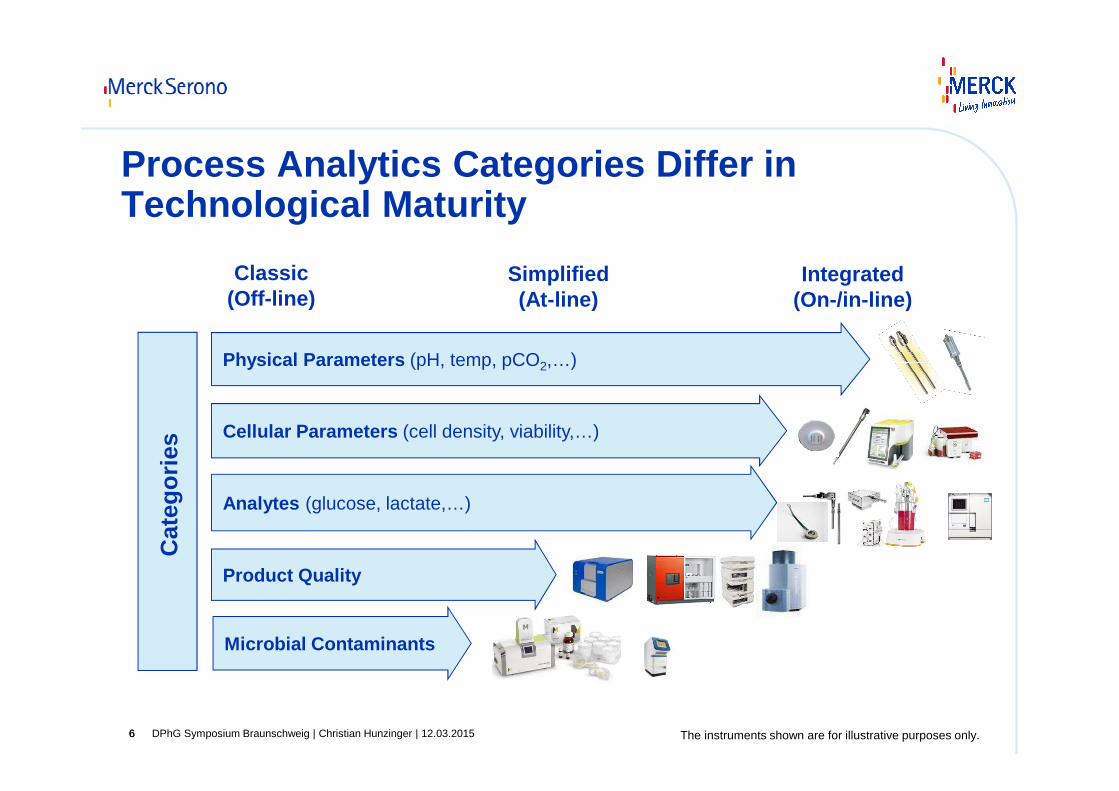
Process Analytics Categories Differ in Technological Maturity
6
Classic(Off-line)
Simplified(At-line)
Cat
egor
ies
Integrated(On-/in-line)
Physical Parameters (pH, temp, pCO2,…)
Microbial Contaminants
Cellular Parameters (cell density, viability,…)
Analytes (glucose, lactate,…)
Product Quality
The instruments shown are for illustrative purposes only.
DPhG Symposium Braunschweig | Christian Hunzinger | 12.03.20157
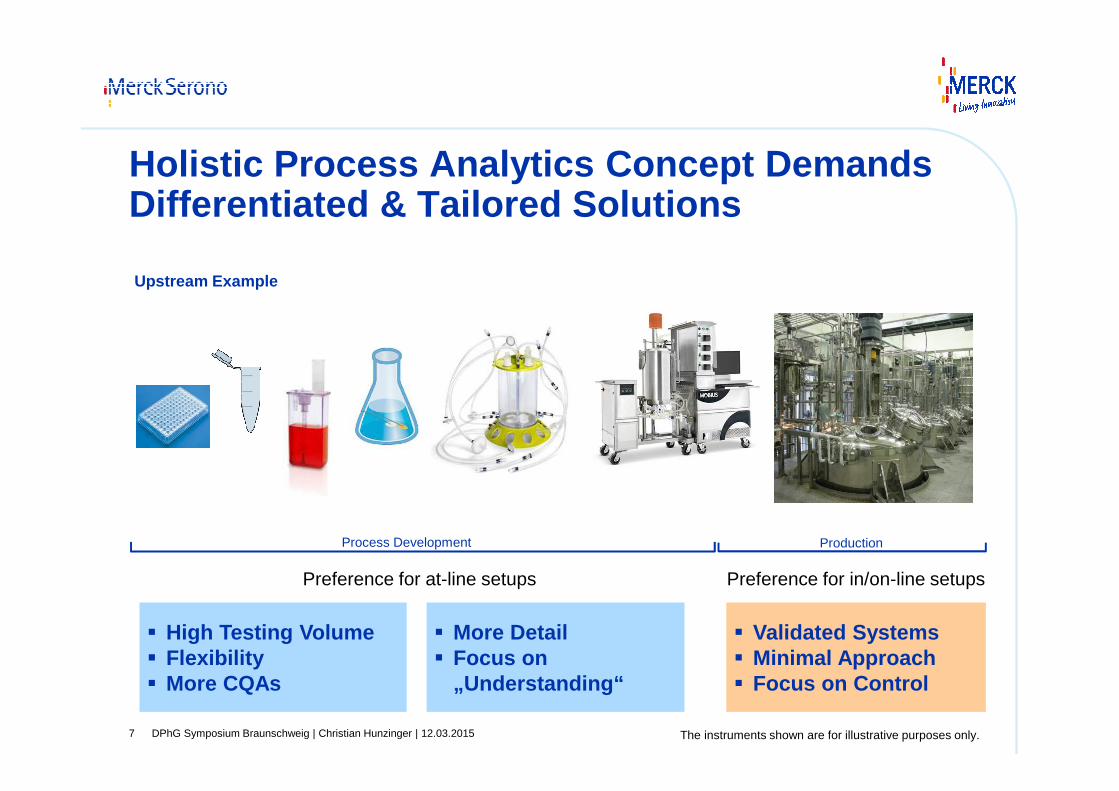
Holistic Process Analytics Concept DemandsDifferentiated & Tailored Solutions
Process Development
Upstream Example
Production
� High Testing Volume � Flexibility� More CQAs
Preference for at-line setups Preference for in/on-line setups
� More Detail� Focus on
„Understanding“
� Validated Systems � Minimal Approach� Focus on Control
The instruments shown are for illustrative purposes only.
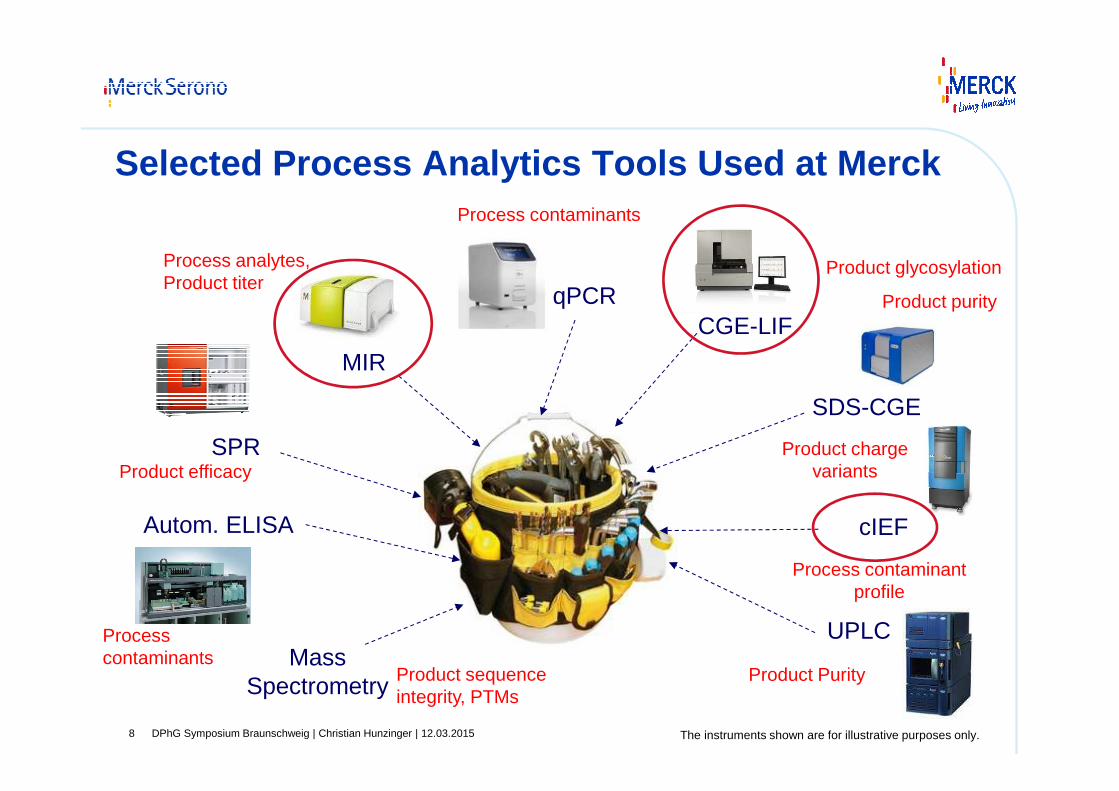
Selected Process Analytics Tools Used at Merck
DPhG Symposium Braunschweig | Christian Hunzinger | 12.03.20158
Autom. ELISA
SPR
CGE-LIF
UPLC
SDS-CGE
cIEF
qPCR
Mass Spectrometry
MIR
The instruments shown are for illustrative purposes only.
Product glycosylation
Product purity
Product chargevariants
Product Purity
Process analytes,Product titer
Processcontaminants
Product efficacy
Product sequenceintegrity, PTMs
Process contaminants
Process contaminantprofile
Agenda
DPhG Symposium Braunschweig | Christian Hunzinger | 12.03.20159
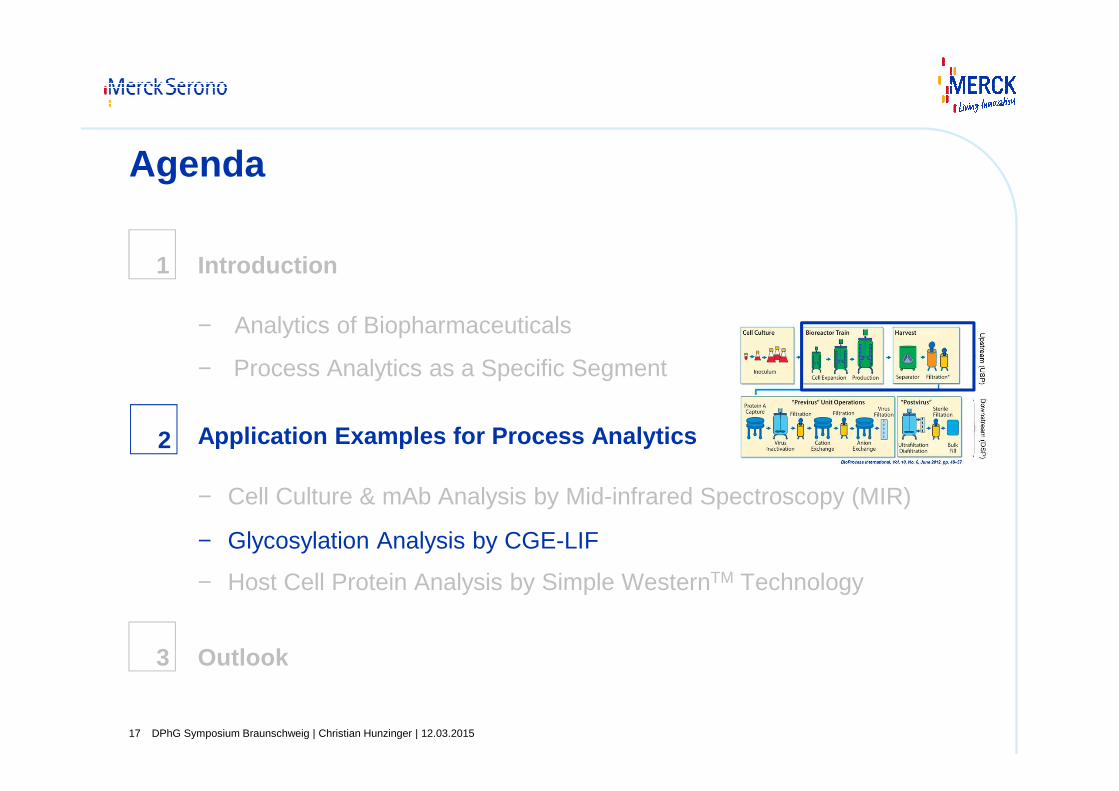
Introduction
− Analytics of Biopharmaceuticals
− Process Analytics as a Specific Segment
Application Examples for Process Analytics
− Cell Culture & mAb Analysis by Mid-infrared Spectroscopy (MIR)
− Glycosylation Analysis by CGE-LIF
− Host Cell Protein Analysis by Simple WesternTM Technology
Outlook
1
2
3
DPhG Symposium Braunschweig | Christian Hunzinger | 12.03.201510
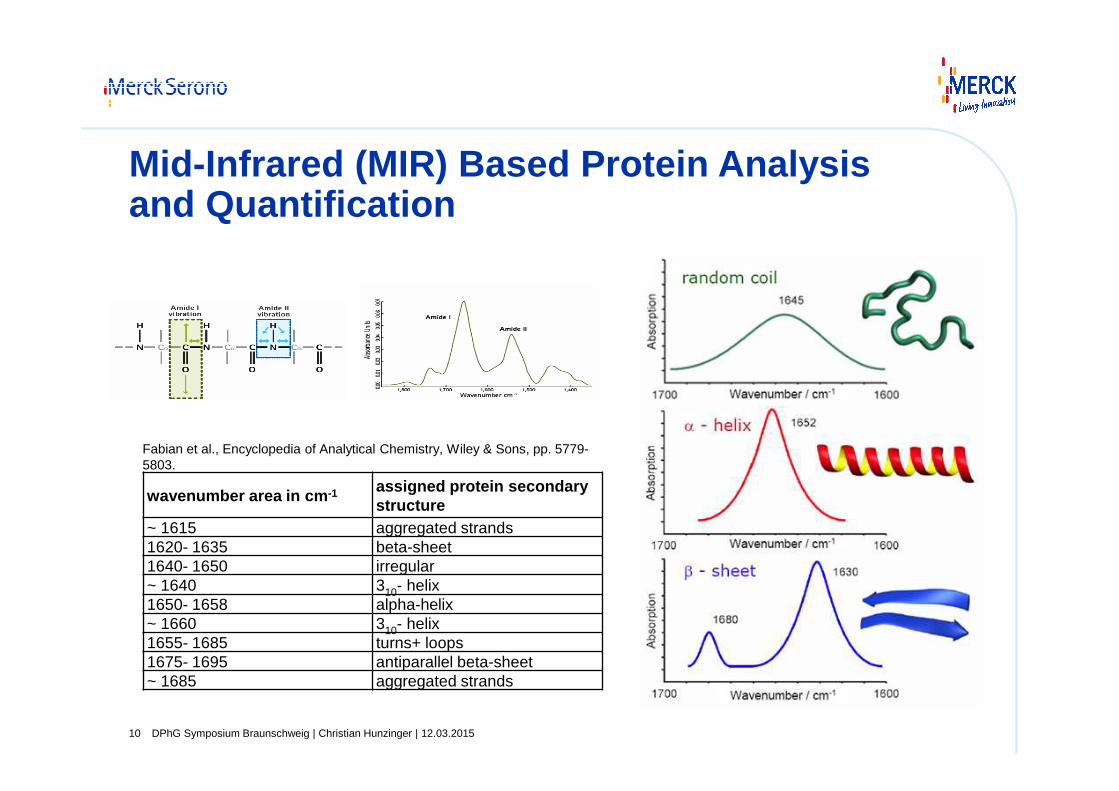
wavenumber area in cm -1 assigned protein secondary structure
~ 1615 aggregated strands1620- 1635 beta-sheet1640- 1650 irregular~ 1640 310- helix1650- 1658 alpha-helix~ 1660 310- helix1655- 1685 turns+ loops1675- 1695 antiparallel beta-sheet~ 1685 aggregated strands
Fabian et al., Encyclopedia of Analytical Chemistry, Wiley & Sons, pp. 5779-5803.
Mid-Infrared (MIR) Based Protein Analysisand Quantification
DPhG Symposium Braunschweig | Christian Hunzinger | 12.03.201511
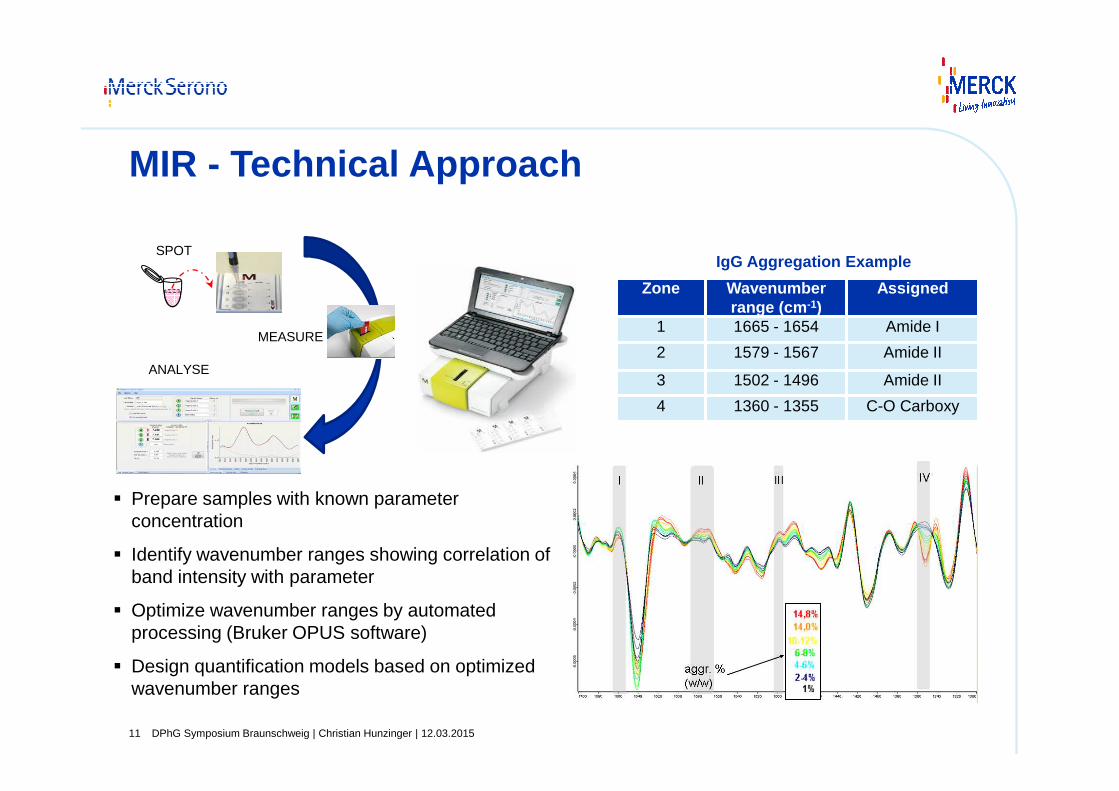
SPOT
ANALYSE
� Prepare samples with known parameterconcentration
� Identify wavenumber ranges showing correlation ofband intensity with parameter
� Optimize wavenumber ranges by automatedprocessing (Bruker OPUS software)
� Design quantification models based on optimizedwavenumber ranges
MEASURE
MIR - Technical Approach
Zone Wavenumber range (cm -1)
Assigned
1 1665 - 1654 Amide I
2 1579 - 1567 Amide II
3 1502 - 1496 Amide II
4 1360 - 1355 C-O Carboxy
IgG Aggregation Example
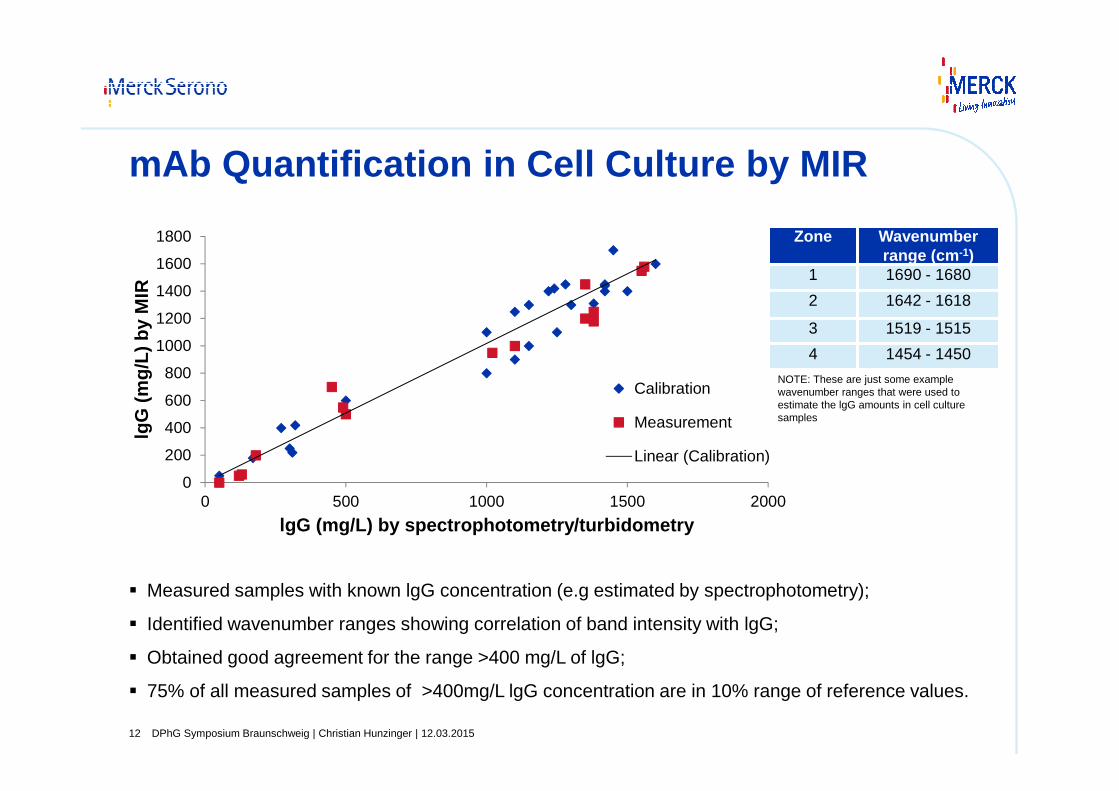
mAb Quantification in Cell Culture by MIR
DPhG Symposium Braunschweig | Christian Hunzinger | 12.03.201512
Zone Wavenumberrange (cm -1)
1 1690 - 1680
2 1642 - 1618
3 1519 - 1515
4 1454 - 1450
NOTE: These are just some example wavenumber ranges that were used to estimate the lgG amounts in cell culture samples
� Measured samples with known lgG concentration (e.g estimated by spectrophotometry);
� Identified wavenumber ranges showing correlation of band intensity with lgG;
� Obtained good agreement for the range >400 mg/L of lgG;
� 75% of all measured samples of >400mg/L lgG concentration are in 10% range of reference values.
0
200
400
600
800
1000
1200
1400
1600
1800
0 500 1000 1500 2000
lgG
(m
g/L)
by
MIR
lgG (mg/L) by spectrophotometry/turbidometry
Calibration
Measurement
Linear (Calibration)
DPhG Symposium Braunschweig | Christian Hunzinger | 12.03.201513
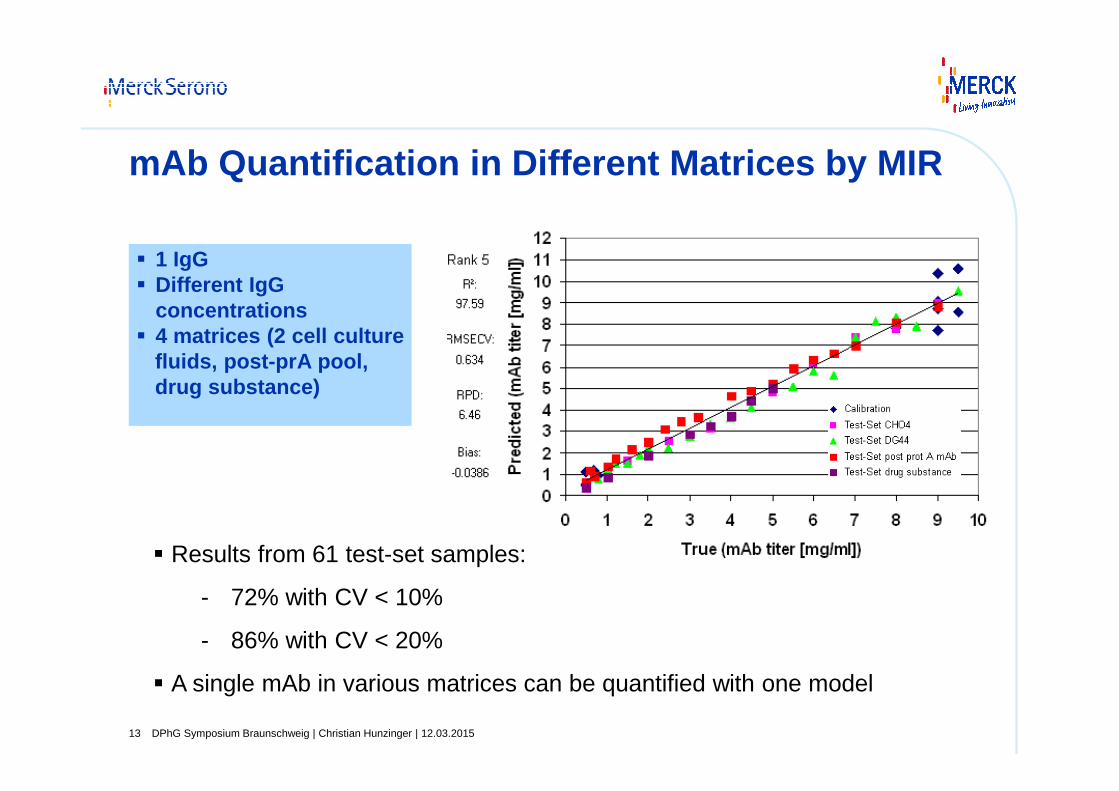
mAb Quantification in Different Matrices by MIR
� Results from 61 test-set samples:
- 72% with CV < 10%
- 86% with CV < 20%
� A single mAb in various matrices can be quantified with one model
� 1 IgG� Different IgG
concentrations� 4 matrices (2 cell culture
fluids, post-prA pool, drug substance)
DPhG Symposium Braunschweig | Christian Hunzinger | 12.03.201514
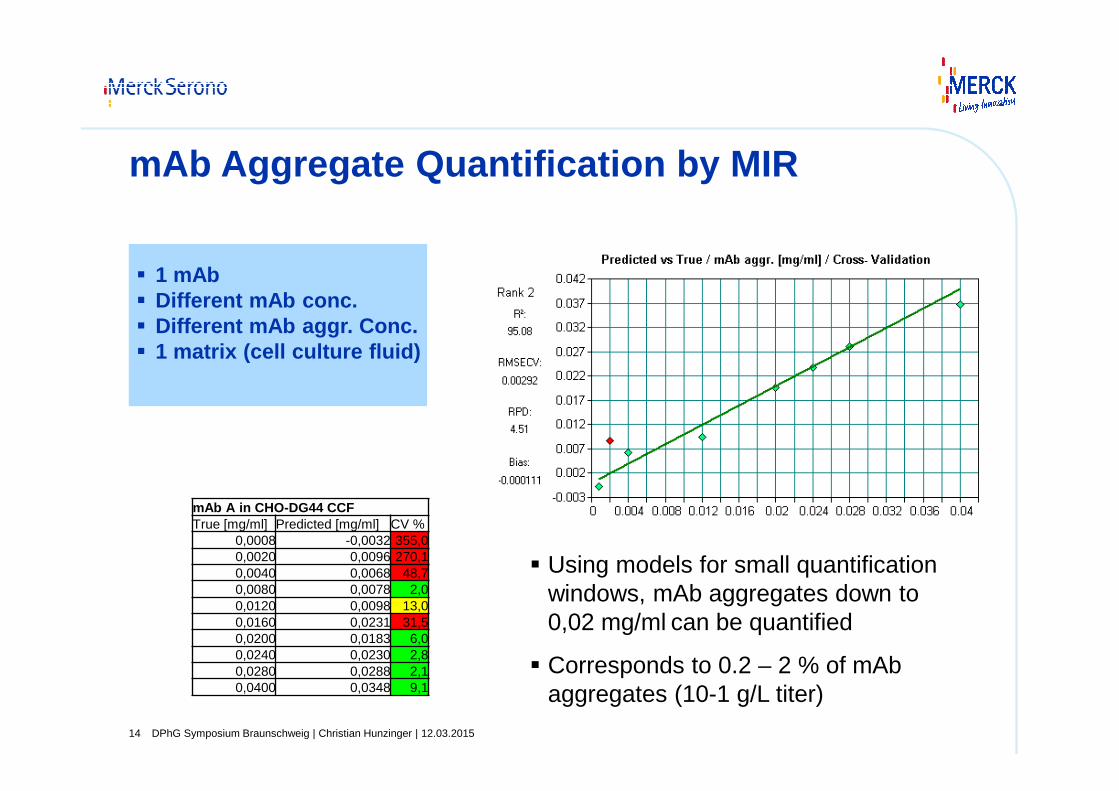
� Using models for small quantificationwindows, mAb aggregates down to0,02 mg/ml can be quantified
� Corresponds to 0.2 – 2 % of mAbaggregates (10-1 g/L titer)
mAb A in CHO-DG44 CCFTrue [mg/ml] Predicted [mg/ml] CV %
0,0008 -0,0032 355,00,0020 0,0096 270,10,0040 0,0068 48,70,0080 0,0078 2,00,0120 0,0098 13,00,0160 0,0231 31,50,0200 0,0183 6,00,0240 0,0230 2,80,0280 0,0288 2,10,0400 0,0348 9,1
mAb Aggregate Quantification by MIR
� 1 mAb� Different mAb conc.� Different mAb aggr. Conc.� 1 matrix (cell culture fluid)
Relative Cell Viability in Cell Culture by MIR
DPhG Symposium Braunschweig | Christian Hunzinger | 12.03.201515
0
20
40
60
80
100
120
0 20 40 60 80 100 120
cell
viab
ility
(%
) by
MIR
cell viability (%) by trypan blue staining
Calibration
Measurement
Linear (Calibration)
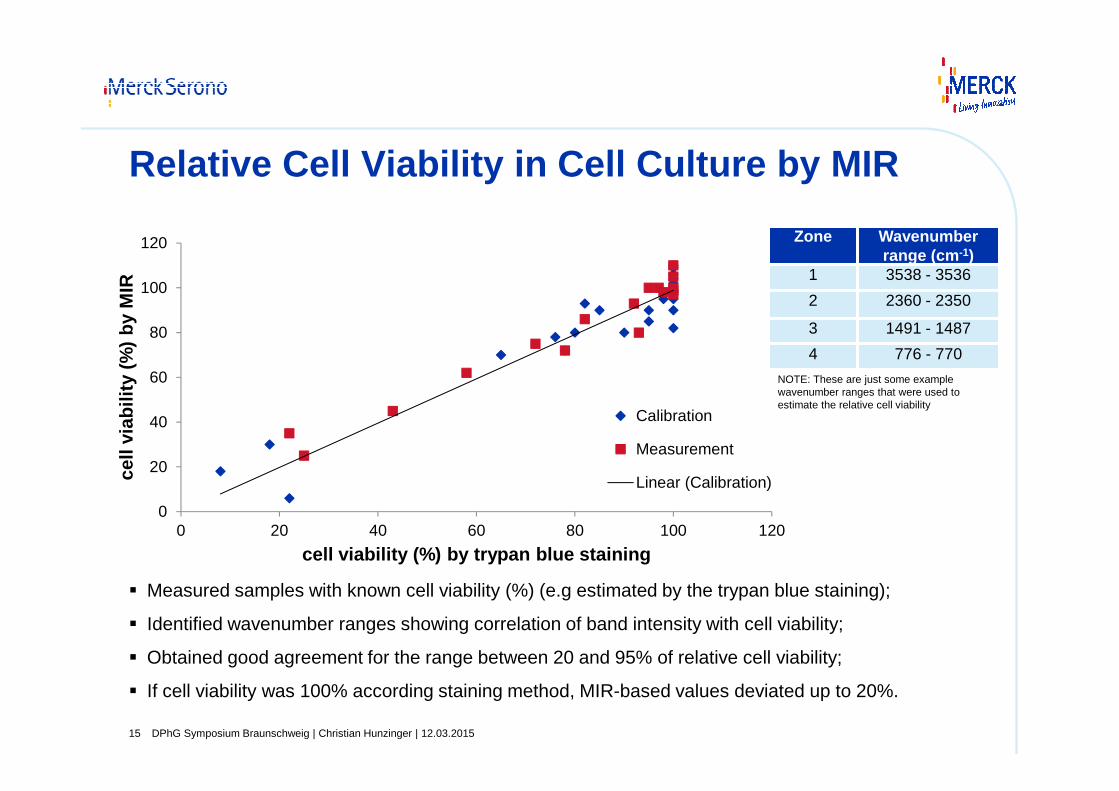
Zone Wavenumberrange (cm -1)
1 3538 - 3536
2 2360 - 2350
3 1491 - 1487
4 776 - 770
NOTE: These are just some example wavenumber ranges that were used to estimate the relative cell viability
� Measured samples with known cell viability (%) (e.g estimated by the trypan blue staining);
� Identified wavenumber ranges showing correlation of band intensity with cell viability;
� Obtained good agreement for the range between 20 and 95% of relative cell viability;
� If cell viability was 100% according staining method, MIR-based values deviated up to 20%.
Lactate Quantification in Cell Culture by MIR
DPhG Symposium Braunschweig | Christian Hunzinger | 12.03.201516
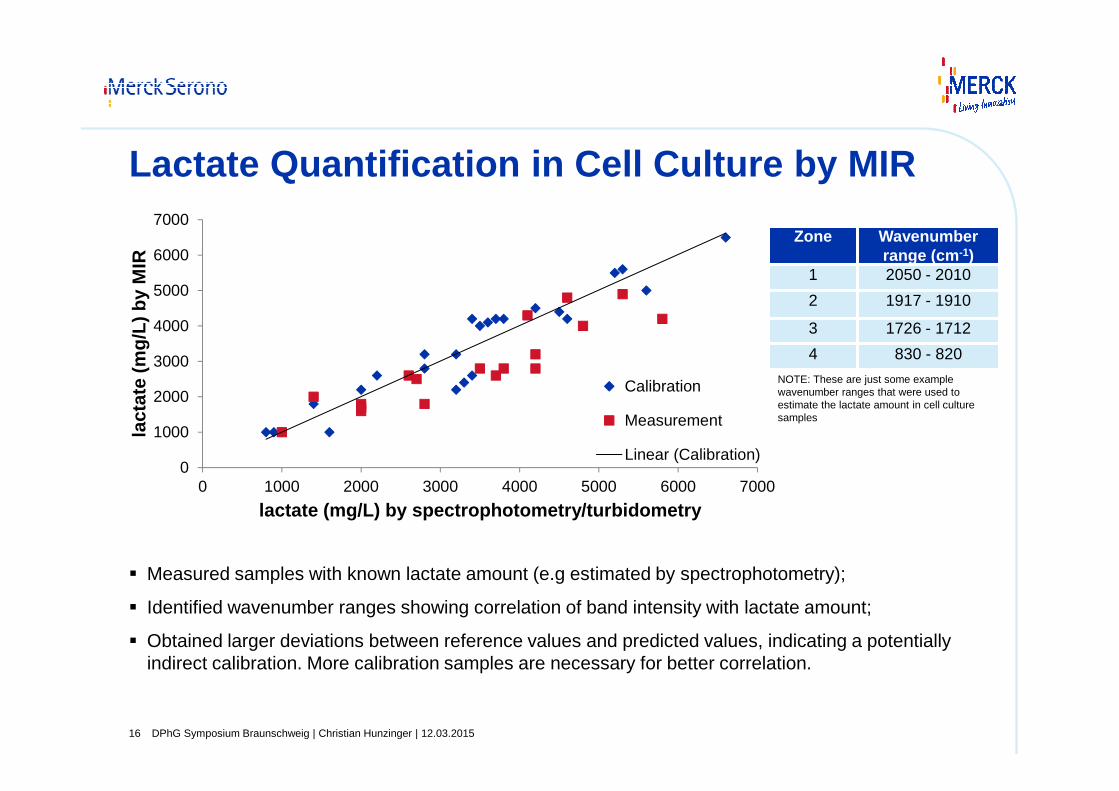
Zone Wavenumberrange (cm -1)
1 2050 - 2010
2 1917 - 1910
3 1726 - 1712
4 830 - 820
NOTE: These are just some example wavenumber ranges that were used to estimate the lactate amount in cell culture samples
� Measured samples with known lactate amount (e.g estimated by spectrophotometry);
� Identified wavenumber ranges showing correlation of band intensity with lactate amount;
� Obtained larger deviations between reference values and predicted values, indicating a potentiallyindirect calibration. More calibration samples are necessary for better correlation.
0
1000
2000
3000
4000
5000
6000
7000
0 1000 2000 3000 4000 5000 6000 7000
lact
ate
(mg/
L) b
y M
IR
lactate (mg/L) by spectrophotometry/turbidometry
Calibration
Measurement
Linear (Calibration)
Agenda
DPhG Symposium Braunschweig | Christian Hunzinger | 12.03.201517
Introduction
− Analytics of Biopharmaceuticals
− Process Analytics as a Specific Segment
Application Examples for Process Analytics
− Cell Culture & mAb Analysis by Mid-infrared Spectroscopy (MIR)
− Glycosylation Analysis by CGE-LIF
− Host Cell Protein Analysis by Simple WesternTM Technology
Outlook
1
2
3
C. Hunzinger | APV Seminar | Berlin, 16. April 201318
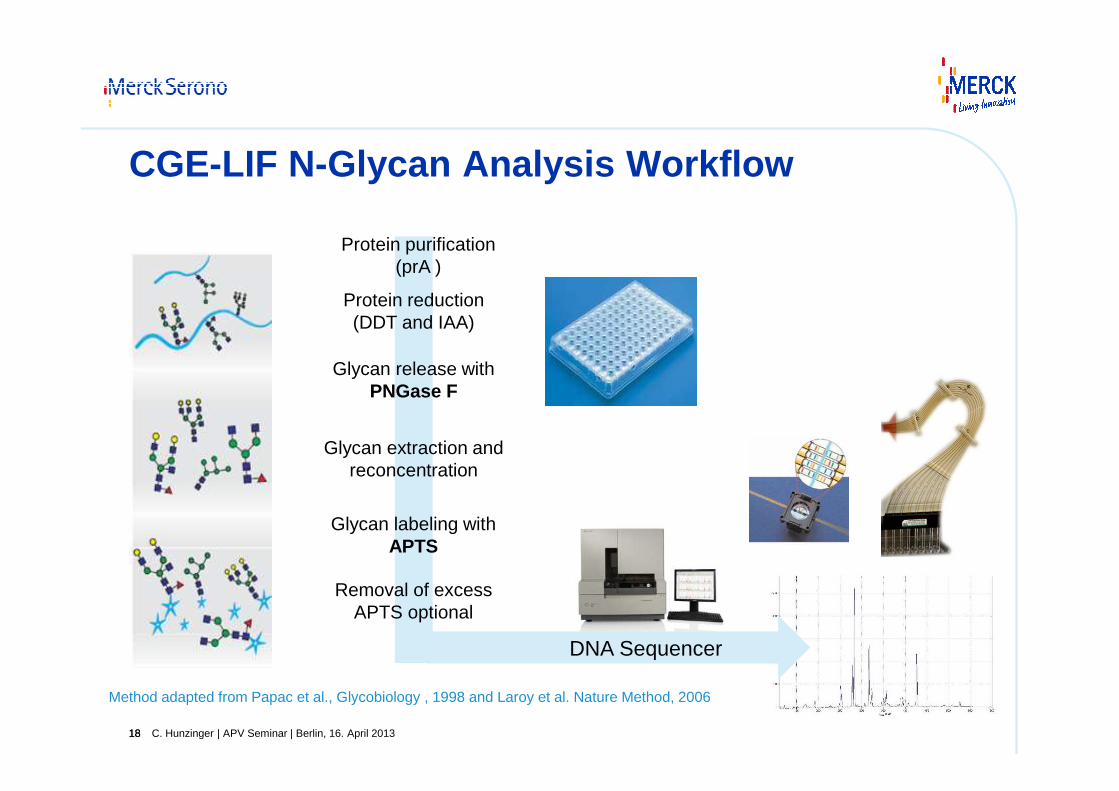
CGE-LIF N-Glycan Analysis Workflow
18
Removal of excess APTS optional
Glycan release with PNGase F
Glycan extraction and reconcentration
Glycan labeling with APTS
Method adapted from Papac et al., Glycobiology , 1998 and Laroy et al. Nature Method, 2006
Protein reduction (DDT and IAA)
DNA Sequencer
Protein purification (prA )
C. Hunzinger | APV Seminar | Berlin, 16. April 20131919
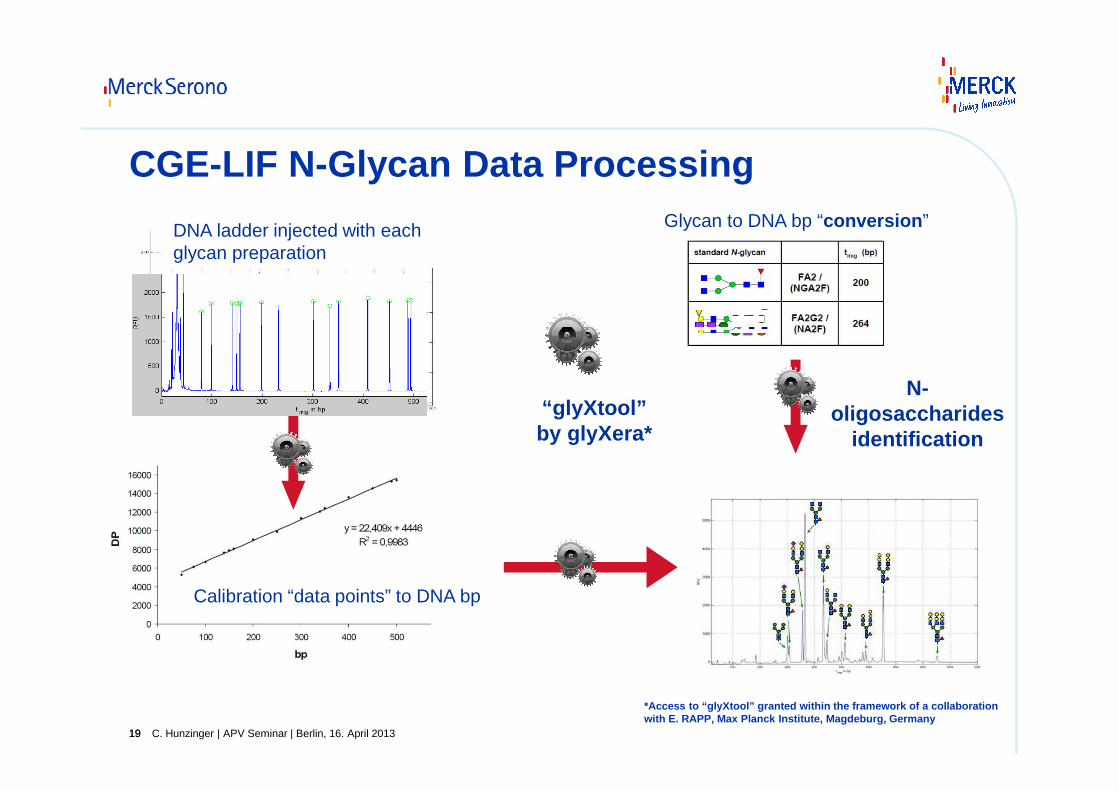
“glyXtool”by glyXera*
DNA ladder injected with each glycan preparation
Calibration “data points” to DNA bp
N-oligosaccharides
identification
Glycan to DNA bp “conversion ”
*Access to “glyXtool” granted within the framework of a collaboration with E. RAPP, Max Planck Institute, Magdeburg, Germ any
CGE-LIF N-Glycan Data Processing
C. Hunzinger | APV Seminar | Berlin, 16. April 201320
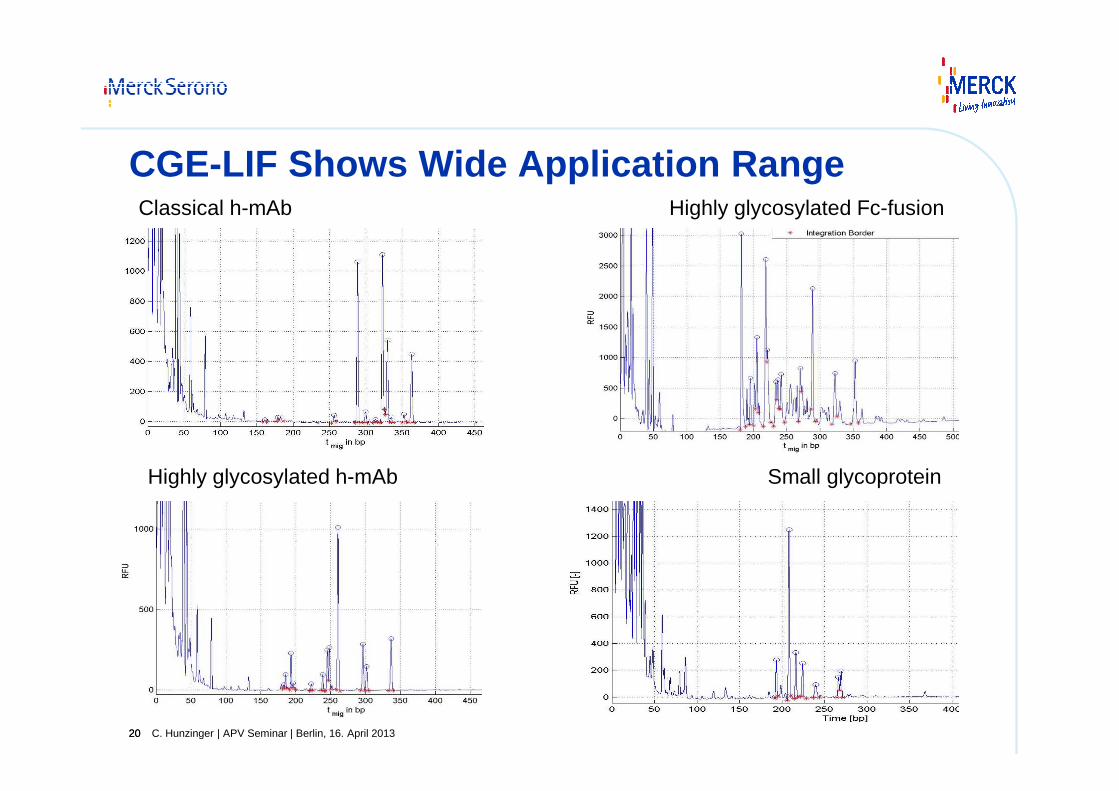
CGE-LIF Shows Wide Application Range
20
Highly glycosylated h-mAb
Classical h-mAb Highly glycosylated Fc-fusion
Small glycoprotein
C. Hunzinger | APV Seminar | Berlin, 16. April 201321
1 64
3
57
2
1 64
3
57
2
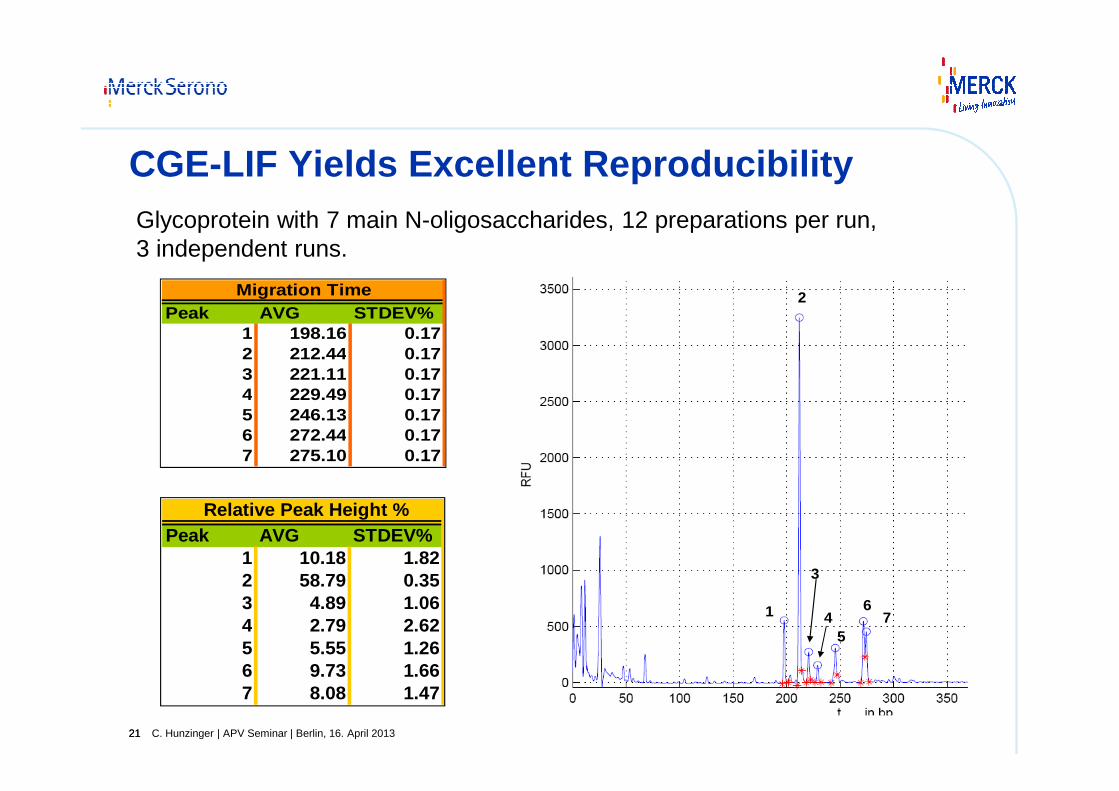
CGE-LIF Yields Excellent Reproducibility
21
Peak AVG STDEV%1 198.16 0.172 212.44 0.173 221.11 0.174 229.49 0.175 246.13 0.176 272.44 0.177 275.10 0.17
Migration Time
Peak AVG STDEV%1 10.18 1.822 58.79 0.353 4.89 1.064 2.79 2.625 5.55 1.266 9.73 1.667 8.08 1.47
Relative Peak Height %
Glycoprotein with 7 main N-oligosaccharides, 12 preparations per run, 3 independent runs.
Agenda
DPhG Symposium Braunschweig | Christian Hunzinger | 12.03.201522
Introduction
− Analytics of Biopharmaceuticals
− Process Analytics as a Specific Segment
Application Examples for Process Analytics
− Cell Culture & mAb Analysis by Mid-infrared Spectroscopy (MIR)
− Glycosylation Analysis by CGE-LIF
− Host Cell Protein Analysis by Simple WesternTM Technology
Outlook
1
2
3
Current Standard Host Cell Protein (HCP) Analysis is Limited
23 DPhG Symposium Braunschweig | Christian Hunzinger | 12.03.2015
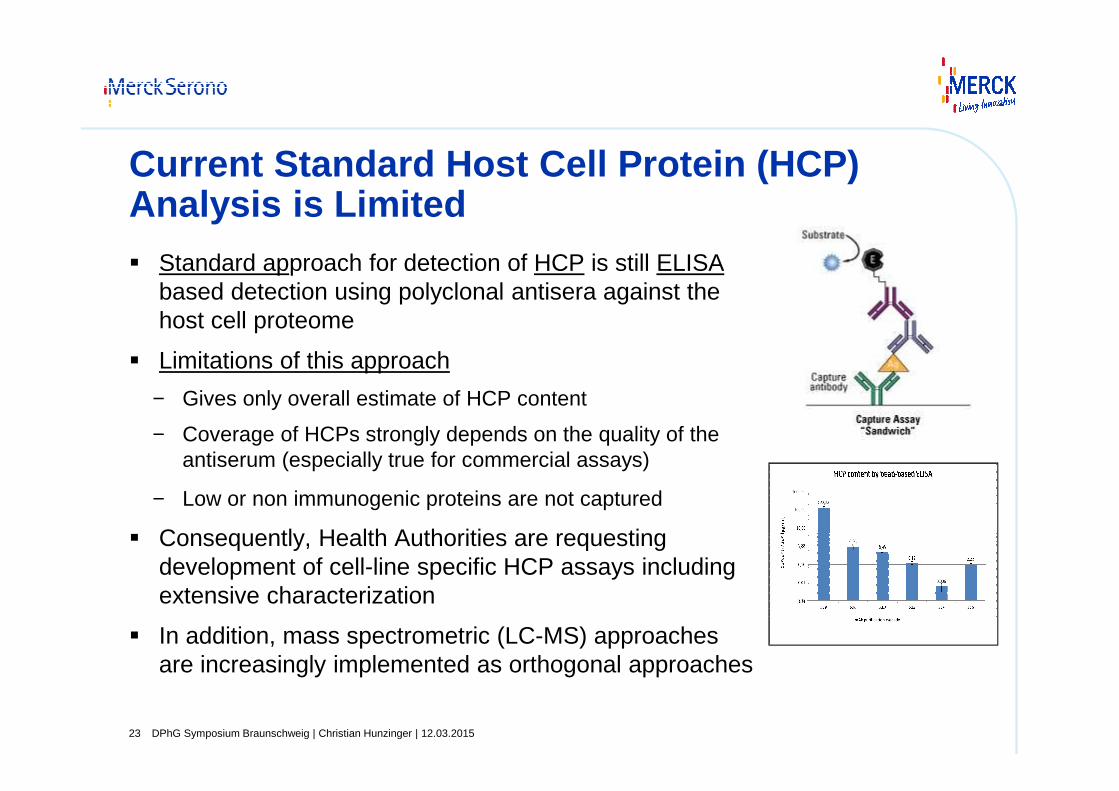
� Standard approach for detection of HCP is still ELISAbased detection using polyclonal antisera against the host cell proteome
� Limitations of this approach
− Gives only overall estimate of HCP content
− Coverage of HCPs strongly depends on the quality of the antiserum (especially true for commercial assays)
− Low or non immunogenic proteins are not captured
� Consequently, Health Authorities are requesting development of cell-line specific HCP assays including extensive characterization
� In addition, mass spectrometric (LC-MS) approaches are increasingly implemented as orthogonal approaches
Standard HCP Characterization by 2D -PAGE/ Immunoblotting
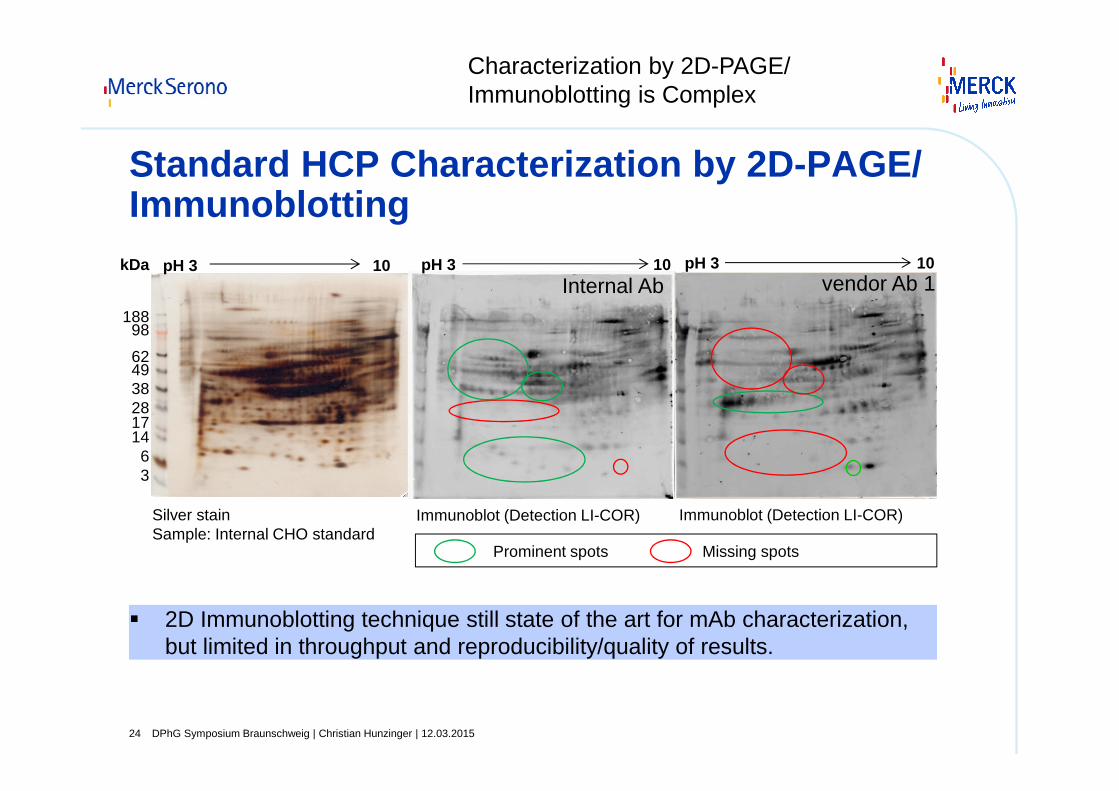
pH 3 10kDa
18898
624938281714
63
24 DPhG Symposium Braunschweig | Christian Hunzinger | 12.03.2015
Internal AbpH 3 10
vendor Ab 1
Silver stain Sample: Internal CHO standard
pH 3 10
Immunoblot (Detection LI-COR) Immunoblot (Detection LI-COR)
Prominent spots Missing spots
Characterization by 2D-PAGE/ Immunoblotting is Complex
� 2D Immunoblotting technique still state of the art for mAb characterization, but limited in throughput and reproducibility/quality of results.
Assessment of the Simple Western Technology for HCP Characterization
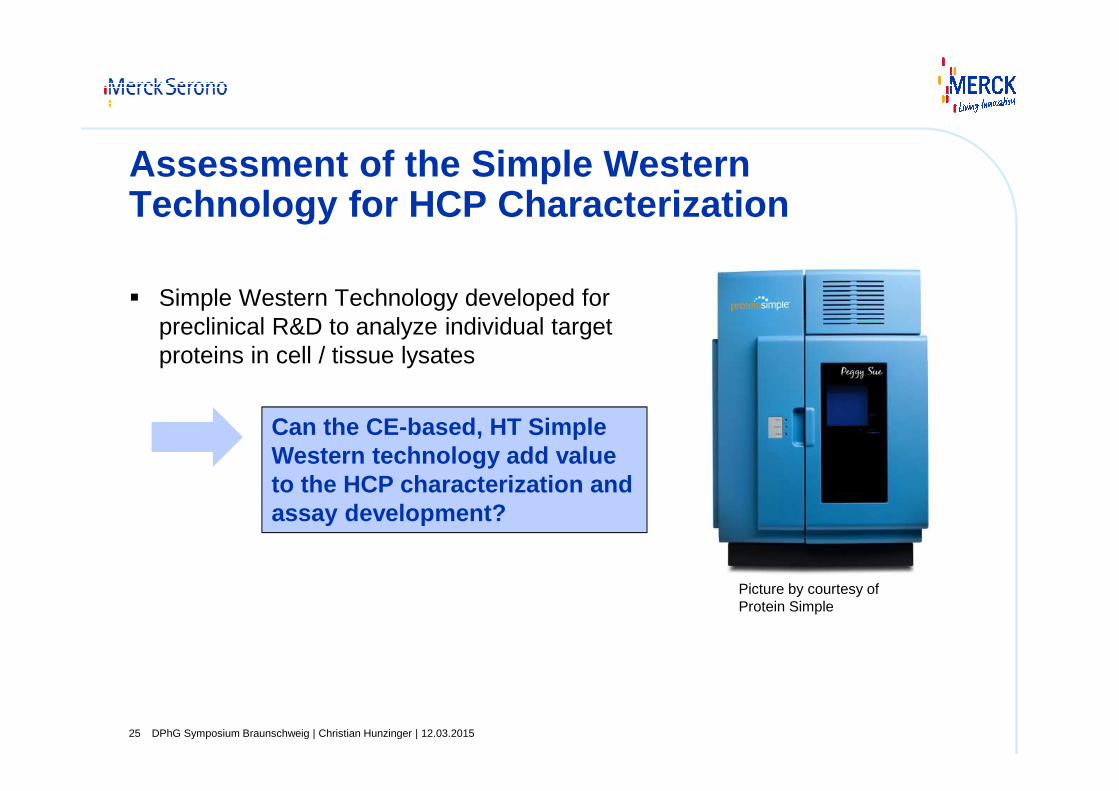
� Simple Western Technology developed for preclinical R&D to analyze individual target proteins in cell / tissue lysates
DPhG Symposium Braunschweig | Christian Hunzinger | 12.03.201525
Can the CE-based, HT Simple Western technology add value to the HCP characterization and assay development?
Picture by courtesy of Protein Simple
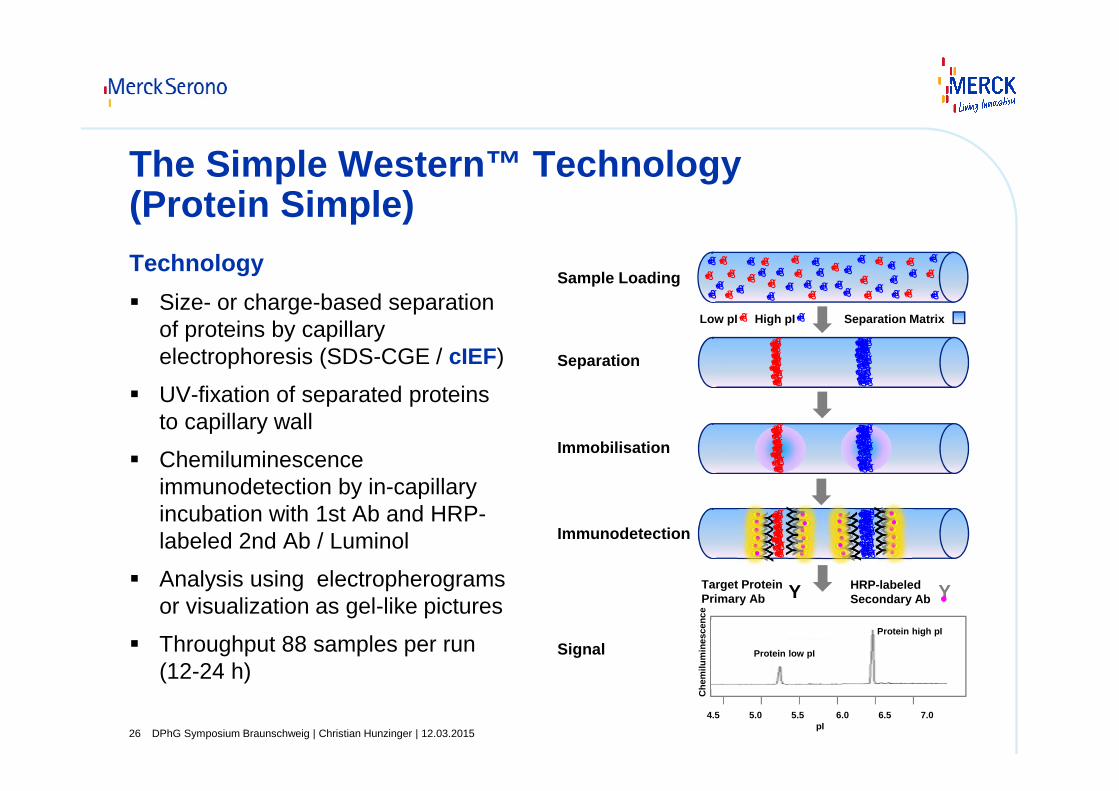
The Simple Western™ Technology (Protein Simple)Technology
� Size- or charge-based separation of proteins by capillary electrophoresis (SDS-CGE / cIEF)
� UV-fixation of separated proteins to capillary wall
� Chemiluminescenceimmunodetection by in-capillary incubation with 1st Ab and HRP-labeled 2nd Ab / Luminol
� Analysis using electropherogramsor visualization as gel-like pictures
� Throughput 88 samples per run (12-24 h)
DPhG Symposium Braunschweig | Christian Hunzinger | 12.03.201526
YYY YYY
YY
Y YYY
Y YYY
YYYYY Y
YY
HRP-labeledSecondary Ab
Separation Matrix
Y Y
Low pI High pI
Target ProteinPrimary Ab
Che
milu
min
esce
nce
Protein low pI
Protein high pI
4.5 5.0 5.5 6.0 6.5 7.0pI
Sample Loading
Separation
Immobilisation
Immunodetection
Signal
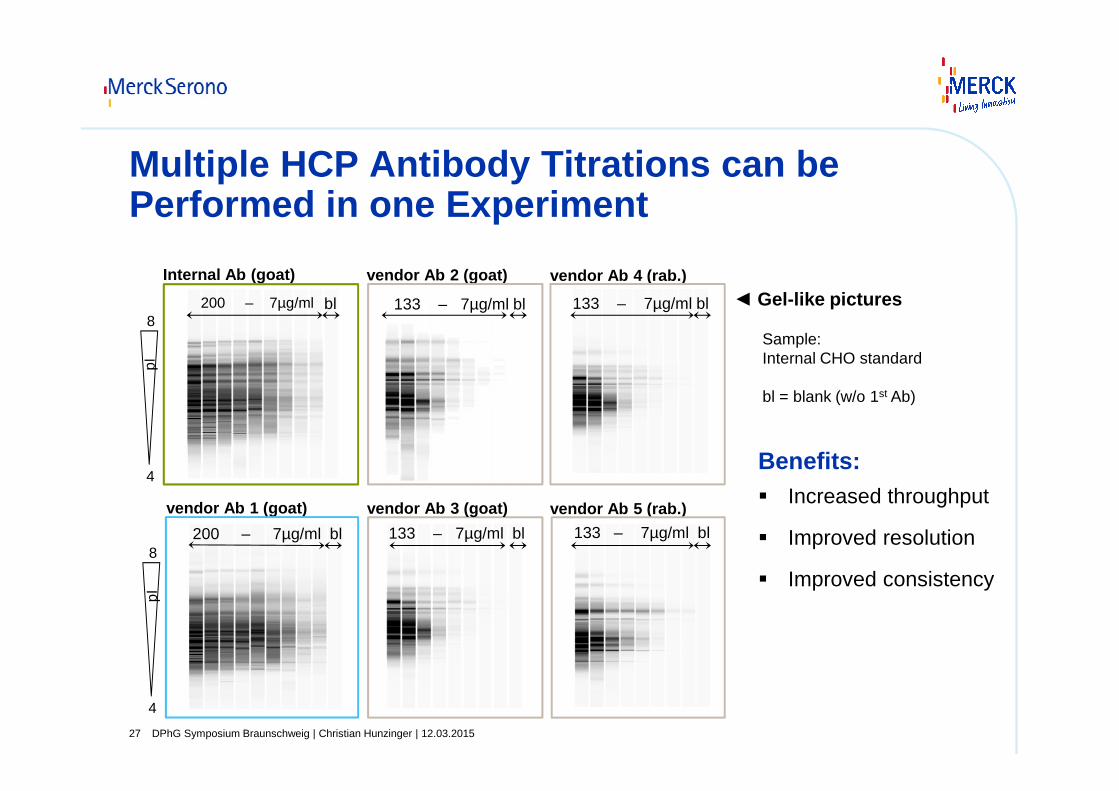
Multiple HCP Antibody Titrations can be Performed in one Experiment
DPhG Symposium Braunschweig | Christian Hunzinger | 12.03.201527
vendor Ab 1 (goat)
200 – 7µg/ml bl
Internal Ab (goat)
bl200 – 7µg/ml
vendor Ab 2 (goat)
133 – 7µg/ml bl
vendor Ab 3 (goat)
133 – 7µg/ml bl
vendor Ab 4 (rab.)
133 – 7µg/ml bl
vendor Ab 5 (rab.)
133 – 7µg/ml bl
◄ Gel-like pictures
Sample: Internal CHO standard
bl = blank (w/o 1st Ab)
8
4
pI
8
4
pI
Benefits:� Increased throughput
� Improved resolution
� Improved consistency
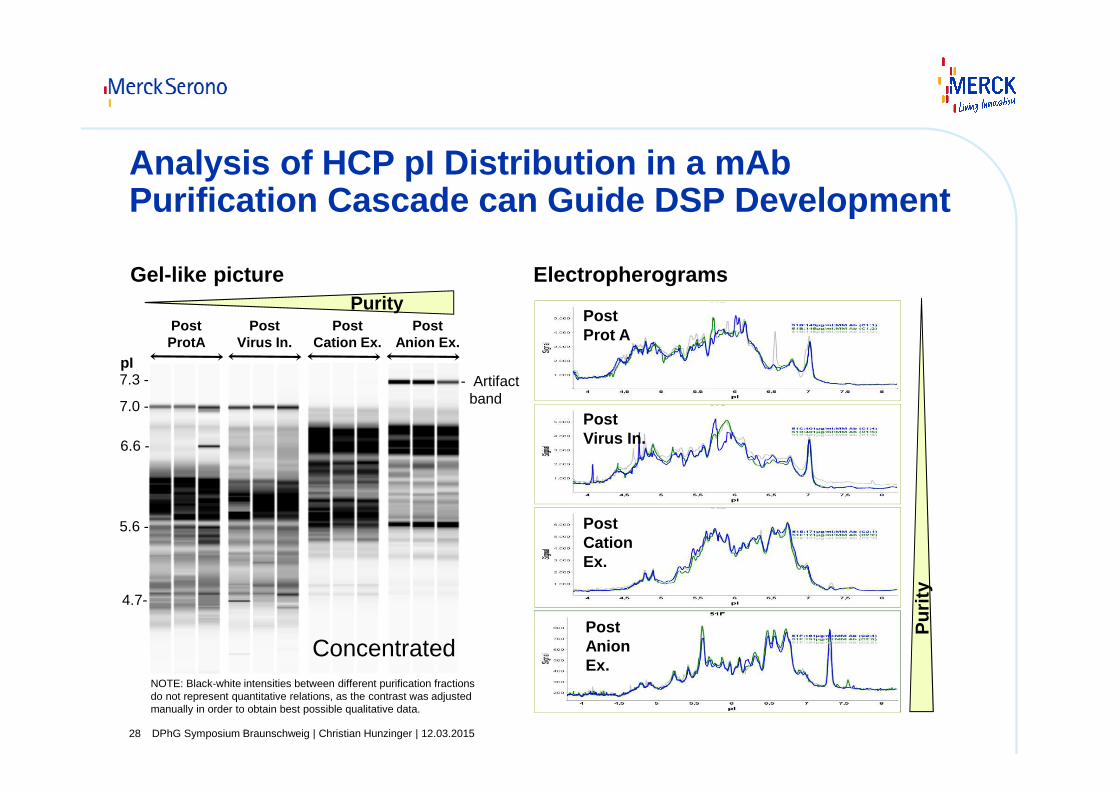
Analysis of HCP pI Distribution in a mAbPurification Cascade can Guide DSP Development
DPhG Symposium Braunschweig | Christian Hunzinger | 12.03.201528
pI7.3 -
7.0 -
6.6 -
5.6 -
4.7-
- Artifact band
NOTE: Black-white intensities between different purification fractions do not represent quantitative relations, as the contrast was adjusted manually in order to obtain best possible qualitative data.
Post ProtA
Post Virus In.
Post Cation Ex.
Post Anion Ex.
Gel-like picture ElectropherogramsPurity
Pur
ity
Post Prot A
Post Virus In.
Post Cation Ex.
Concentrated Post Anion Ex.
Agenda
DPhG Symposium Braunschweig | Christian Hunzinger | 12.03.201529
Introduction
− Analytics of Biopharmaceuticals
− Process Analytics as a Specific Segment
Application Examples for Process Analytics
− Cell Culture Analysis by Mid-infrared Spectroscopy (MIR )
− Product Titer and Aggregation Analysis by MIR
− Host Cell Protein Analysis by Simple Western TM Technology
Outlook
1
2
3
DPhG Symposium Braunschweig | Christian Hunzinger | 12.03.201530
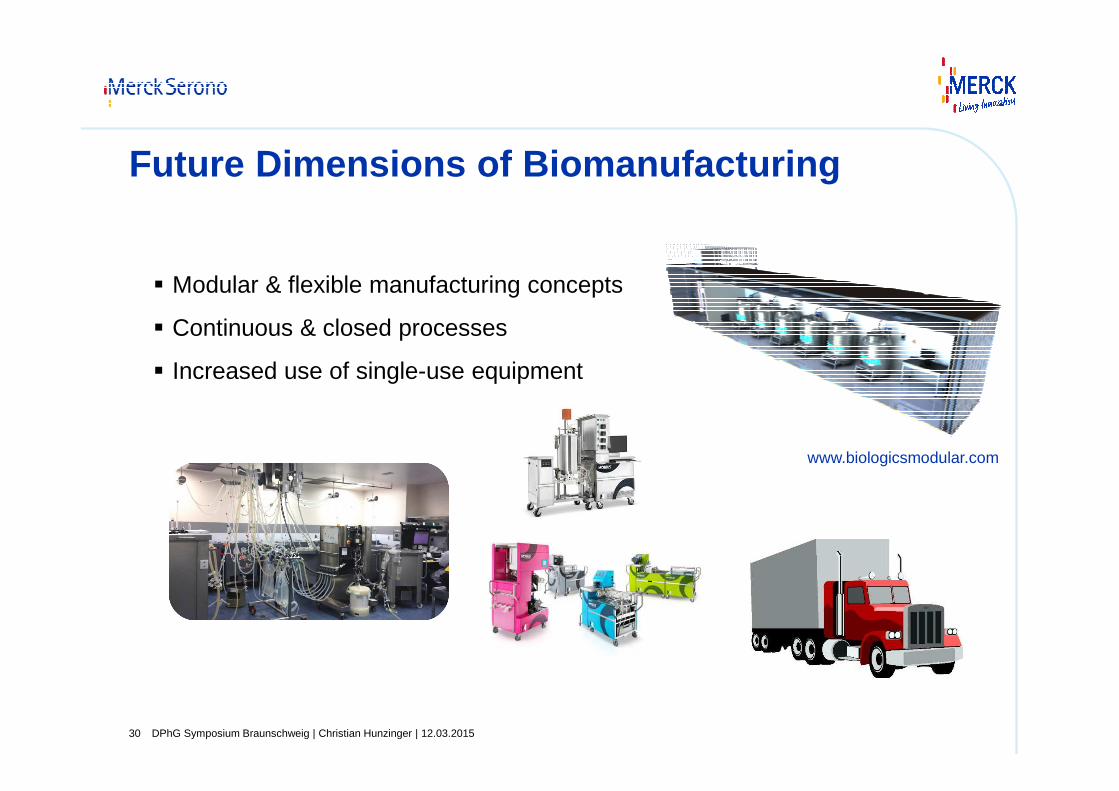
Future Dimensions of Biomanufacturing
www.biologicsmodular.com
� Modular & flexible manufacturing concepts
� Continuous & closed processes
� Increased use of single-use equipment
DPhG Symposium Braunschweig | Christian Hunzinger | 12.03.201531
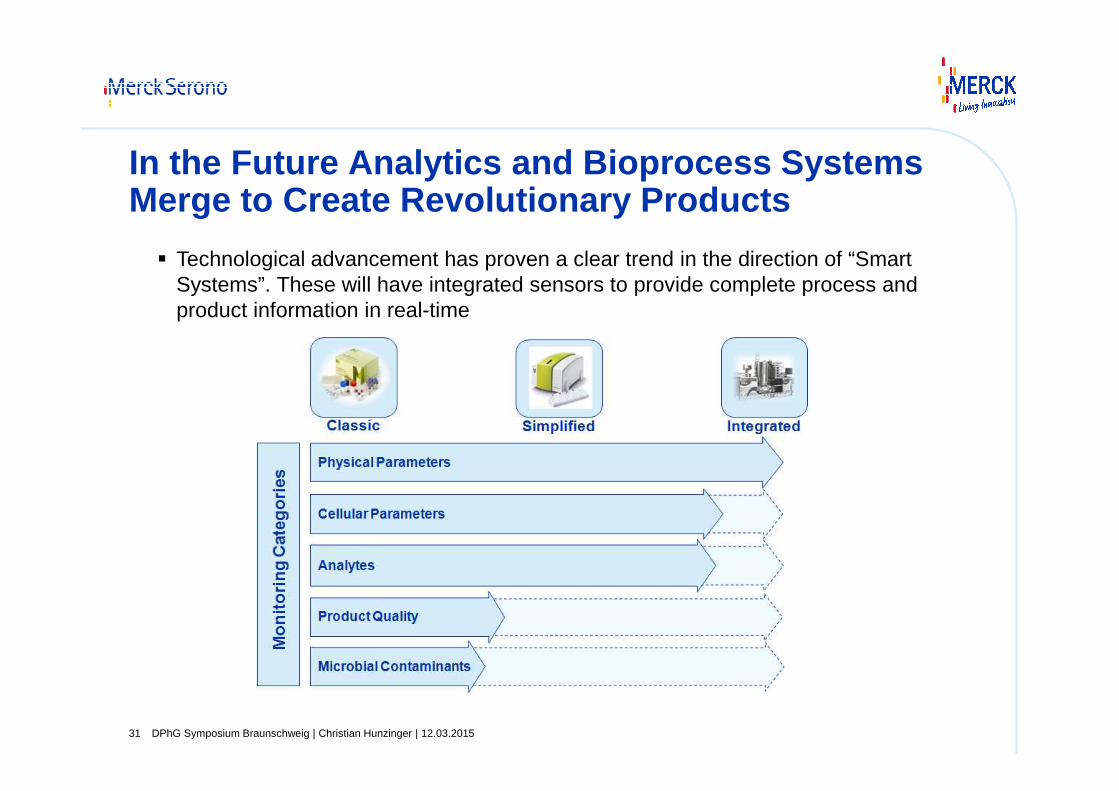
In the Future Analytics and Bioprocess Systems Merge to Create Revolutionary Products
� Technological advancement has proven a clear trend in the direction of “Smart Systems”. These will have integrated sensors to provide complete process and product information in real-time

DPhG Symposium Braunschweig | Christian Hunzinger | 12.03.201532
� Supriyadi Hafiz
� Tanja Henzler
� Marie-Lisa Hülser
� Stefanie Kloos
� Ana Krstanovic
� Alexandra Krog
� Johanna Lörsch
� Flavie Robert
� Thomas Siegl
� Romas Skudas
Acknowledgements
Merck KGaA Technische Universität, Darmstadt
� Florian Capito
� Harald Kolmar
In case of further questions, please contact me [email protected]