Embed Size (px)
Citation preview
FACILITATOR GUIDE
Analyze and Interpret Surveillance Data
Created: 2013


Analyze and Interpret Surveillance Data. Atlanta, GA: Centers for Disease Control and Prevention (CDC), 2013.
ANALYZE AND INTERPRET SURVEILLANCE DATA
FACILITATOR GUIDE |2
Table of Contents
Analyze and Interpret Surveillance Data ..................................... 3LEARNING OBJECTIVES ................................................................................. 3 ESTIMATED COMPLETION TIME ....................................................................... 3 TRAINING TECHNIQUES.................................................................................. 3 PREREQUISITES ............................................................................................ 3 MATERIALS AND EQUIPMENT .......................................................................... 3 REFERENCES AND RESOURCES ........................................................................ 3 PREPARATION CHECKLIST .............................................................................. 4 FONT GLOSSARY ........................................................................................... 4 ICON GLOSSARY ........................................................................................... 4 MODULE CONTENT ........................................................................................ 6 SKILL ASSESSMENT .................................................................................... 34
ANALYZE AND INTERPRET SURVEILLANCE DATA
FACILITATOR GUIDE |3
Analyze and Interpret Surveillance Data
LEARNING OBJECTIVES At the end of the training, participants will be able to: • Describe data to collect based on the objective of a surveillance system.• Identify how to present surveillance data.• Interpret surveillance data, including trends and patterns.
ESTIMATED COMPLETION TIME • 3 ½ hours (2 hours presentation; 1 ½ hours skill assessment)
TRAINING TECHNIQUES • Content and examples will be presented using lectures and group
discussion. Skill assessment will be in small groups.
PREREQUISITES • Introduction to NCD Epidemiology• NCD Burden of Disease• NCD Surveillance in Public Health• Descriptive and Analytic Studies
MATERIALS AND EQUIPMENT For the Facilitator: • PowerPoint file for presentationFor the Participant: • Participant Guide
REFERENCES AND RESOURCES • CDC Global Youth Tobacco Surveillance, 2000–2007. MMWR Surv
Summ. Jan 25, 2008;57 Suppl 1:1–32.• CDC QuickStats: Death Rates for the Three Leading Causes of Injury
Death–United States, 1979–2007. MMWR Weekly Report. Aug 6,2010;59(30):957.
• Central America FETP Basic and Intermediate Curriculum• Conducting Surveillance• Organizing and Presenting• Surveillance Interpretation and Analysis• Moorman JE, Rudd RA, Johnson CA, et al. National surveillance for
asthma–United States, 1980–2004. MMWR Surveill Summ. Oct 192007;56(8):1–54.
ANALYZE AND INTERPRET SURVEILLANCE DATA
FACILITATOR GUIDE |4
• Remington RP, Brownson RC, Wegner MV, eds. Chronic DiseaseEpidemiology and Control. 3rd ed. Washington DC: American PublicHealth Association; 2010.
• Teutsch SM, Churchill, R. Elliot, eds. Principles and Practice of PublicHealth Surveillance. 2nd ed. New York: Oxford University Press, Inc.;2000.
• WHO Global Health Risks.http://www.who.int/healthinfo/global_burden_disease/global_health_risks/en/index.html
• WHO Global Infobase. https://apps.who.int/infobase/Comparisons.aspx• WHO International Classification of Diseases (ICD).
http://www.who.int/classifications/icd/en/• WHO Non-communicable Disease Profile, United Republic of Tanzania.
https://apps.who.int/infobase/CountryProfiles.aspx• WHO The Global Burden of Disease: 2004 Update.
http://www.who.int/healthinfo/global_burden_disease/2004_report_update/en/index.html
PREPARATION CHECKLIST The following are action items to be completed by the facilitator prior to training:
___ Review slides
FONT GLOSSARY The following fonts are used in this guide:
Font Type Font Meaning
Plain Script
Bold Instructions
Italics Answers
ICON GLOSSARY The following icons are used in this guide:
Image Type Image Meaning
Activity Icon
Small group exercise.
ANALYZE AND INTERPRET SURVEILLANCE DATA
FACILITATOR GUIDE |5
Image Type Image Meaning
Flip Chart Icon
Write responses during facilitator-led discussions or debriefs.
Question Icon
Question for facilitator to ask participants.
ANALYZE AND INTERPRET SURVEILLANCE DATA
FACILITATOR GUIDE |6
MODULE CONTENT
Duration/ Slide-Number What To Do/What To Say
5 minutes
Question
• Welcome participants.• Introduce yourself if you are a new facilitator.• Explain that this lesson gives an overview of analyzing
and interpreting surveillance data on NCDs.• Ask participants if they have experience analyzing and
interpreting surveillance data.• Briefly discuss how the skills and knowledge they learn
in this module will help them at their jobs. For example:o To understand the burden of an NCD in a community
and to monitor its trend over time, it is important to alsounderstand the causes of NCDs: behavioral,environmental, and social factors.
o NCD surveillance systems collect information on thesefactors.
• Explain that this lesson will take approximately 3 ½hours to complete.
• Explain that after learning the lesson, participants willcomplete a skill assessment in small groups.
ANALYZE AND INTERPRET SURVEILLANCE DATA
FACILITATOR GUIDE |7
Duration/ Slide-Number What To Do/What To Say
1 minute Slide 2
• Read the slide.
2 minutes Slide 3
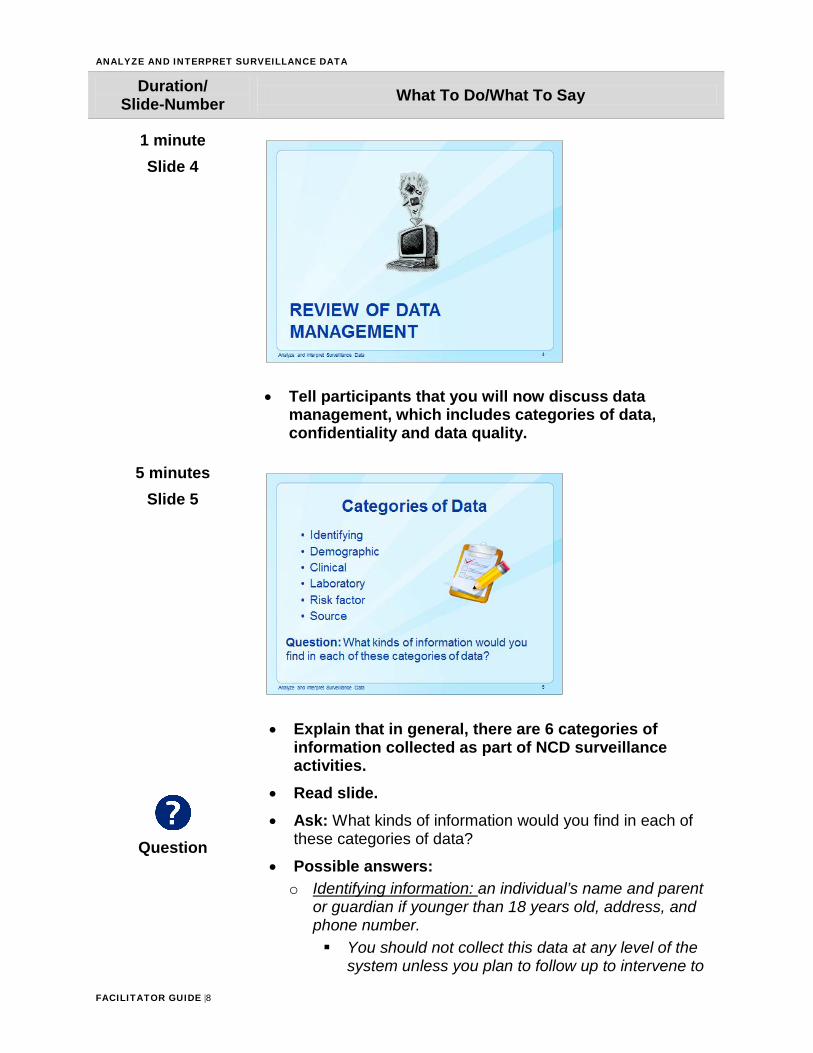
• Explain that this is an overview of the topics to bediscussed today.
• Read the slide.
ANALYZE AND INTERPRET SURVEILLANCE DATA
FACILITATOR GUIDE |8
Duration/ Slide-Number What To Do/What To Say
1 minute Slide 4
• Tell participants that you will now discuss datamanagement, which includes categories of data,confidentiality and data quality.
5 minutes Slide 5
Question
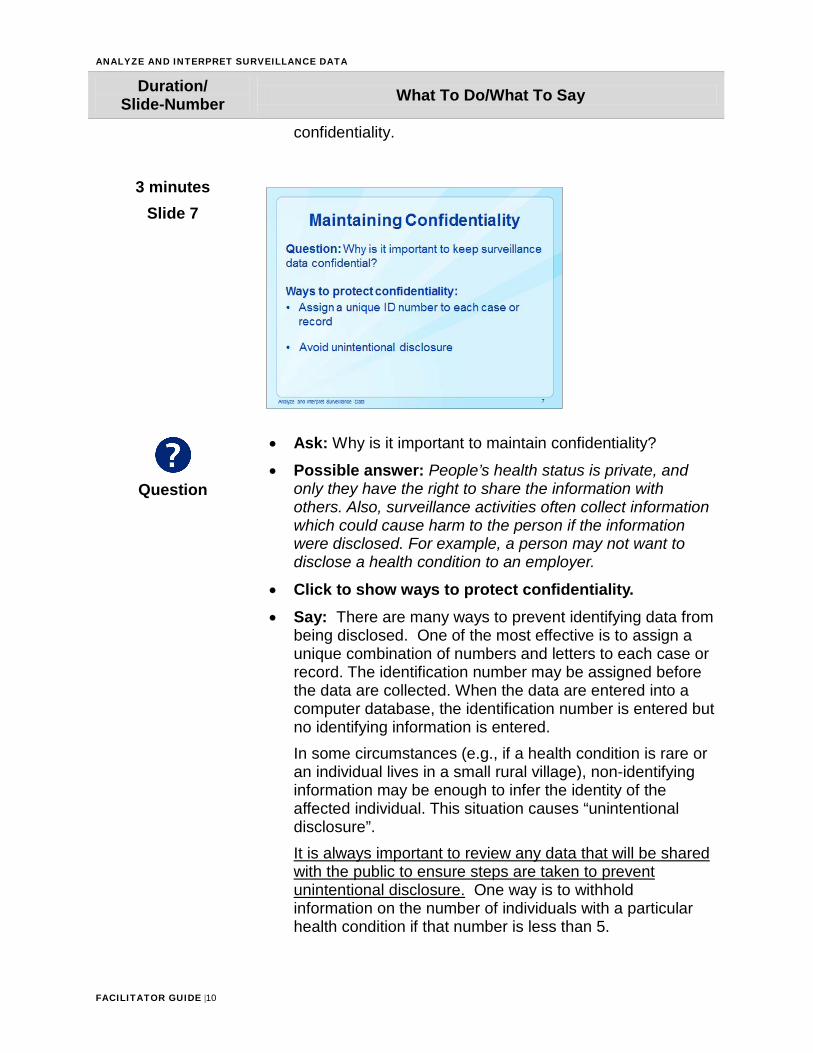
• Explain that in general, there are 6 categories ofinformation collected as part of NCD surveillanceactivities.
• Read slide.• Ask: What kinds of information would you find in each of
these categories of data?
• Possible answers:o Identifying information: an individual’s name and parent
or guardian if younger than 18 years old, address, andphone number. You should not collect this data at any level of the
system unless you plan to follow up to intervene to
ANALYZE AND INTERPRET SURVEILLANCE DATA
FACILITATOR GUIDE |9
Duration/ Slide-Number What To Do/What To Say
help the respondent. Identifying information will be discussed on the next
slide about confidentiality.o Demographic data: age, sex, race or ethnicityo Clinical data: diagnosis, signs, symptoms, and physical
measurements such as blood pressure, weight, and height
o Laboratory information (tests and results): for example,chest X-rays and measured glucose values
o Risk factor information includes, for example, familyhistory of a health condition, diet, and smoking status
o Source information includes name of reporting physician,clinic, hospital or laboratory; date of report: This datamay be collected from busy hospital and clinic personnel;however, it is a lot of data for survey staff to enter.
• Explain any concepts or types of information thatparticipants missed when answering the question.
• Explain that we will discuss risk factors in more detaillater in the presentation.
2 minutes Slide 6
• Say: One of the keys to data management is confidentiality.Public health professionals must ensure that all datacollected as part of public health activities are keptconfidential. Some surveillance systems (e.g., vital-eventregistries and case-based disease registries) collectidentifying information. In other systems, such assurveillance based on surveys, identifying information isusually not entered into a database, ensuring
ANALYZE AND INTERPRET SURVEILLANCE DATA
FACILITATOR GUIDE |10
Duration/ Slide-Number What To Do/What To Say
confidentiality.
3 minutes Slide 7
Question
• Ask: Why is it important to maintain confidentiality?
• Possible answer: People’s health status is private, andonly they have the right to share the information withothers. Also, surveillance activities often collect informationwhich could cause harm to the person if the informationwere disclosed. For example, a person may not want todisclose a health condition to an employer.
• Click to show ways to protect confidentiality.• Say: There are many ways to prevent identifying data from
being disclosed. One of the most effective is to assign aunique combination of numbers and letters to each case orrecord. The identification number may be assigned beforethe data are collected. When the data are entered into acomputer database, the identification number is entered butno identifying information is entered.In some circumstances (e.g., if a health condition is rare oran individual lives in a small rural village), non-identifyinginformation may be enough to infer the identity of theaffected individual. This situation causes “unintentionaldisclosure”.It is always important to review any data that will be sharedwith the public to ensure steps are taken to preventunintentional disclosure. One way is to withholdinformation on the number of individuals with a particularhealth condition if that number is less than 5.
ANALYZE AND INTERPRET SURVEILLANCE DATA
FACILITATOR GUIDE |11
Duration/ Slide-Number What To Do/What To Say
3 minutes Slide 8
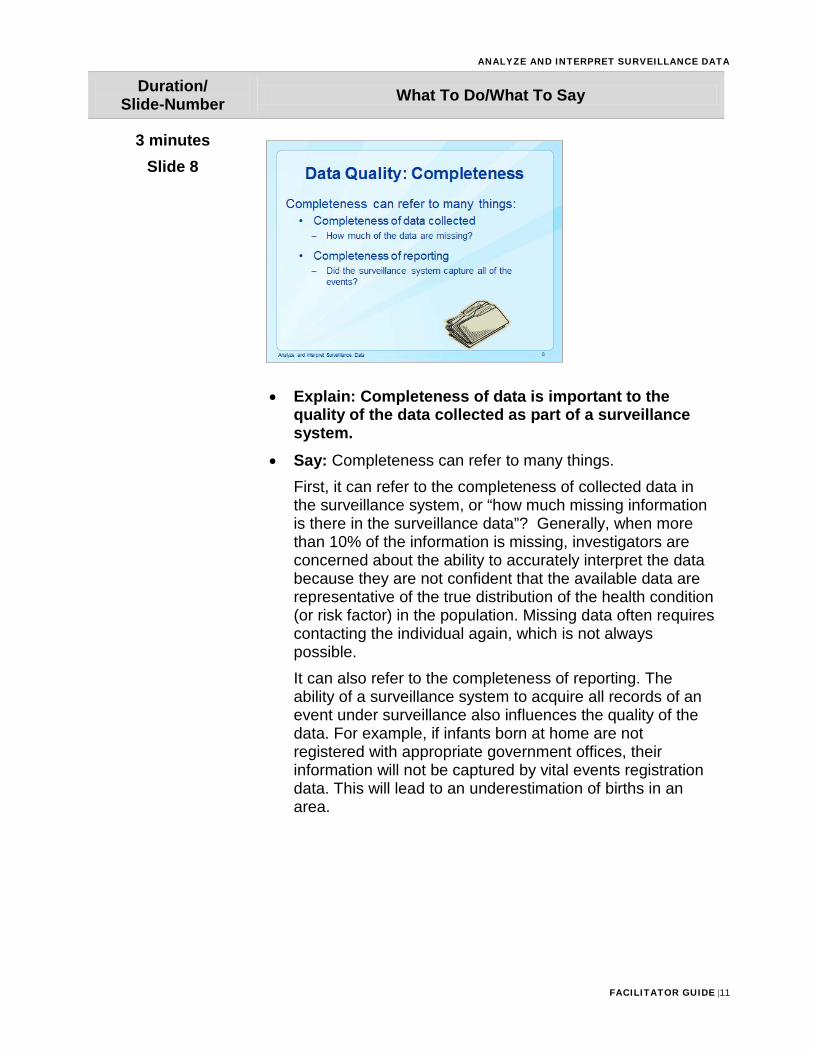
• Explain: Completeness of data is important to thequality of the data collected as part of a surveillancesystem.
• Say: Completeness can refer to many things.First, it can refer to the completeness of collected data inthe surveillance system, or “how much missing informationis there in the surveillance data”? Generally, when morethan 10% of the information is missing, investigators areconcerned about the ability to accurately interpret the databecause they are not confident that the available data arerepresentative of the true distribution of the health condition(or risk factor) in the population. Missing data often requirescontacting the individual again, which is not alwayspossible.It can also refer to the completeness of reporting. Theability of a surveillance system to acquire all records of anevent under surveillance also influences the quality of thedata. For example, if infants born at home are notregistered with appropriate government offices, theirinformation will not be captured by vital events registrationdata. This will lead to an underestimation of births in anarea.
ANALYZE AND INTERPRET SURVEILLANCE DATA
FACILITATOR GUIDE |12
Duration/ Slide-Number What To Do/What To Say
5 minutes Slide 9
Question
Question
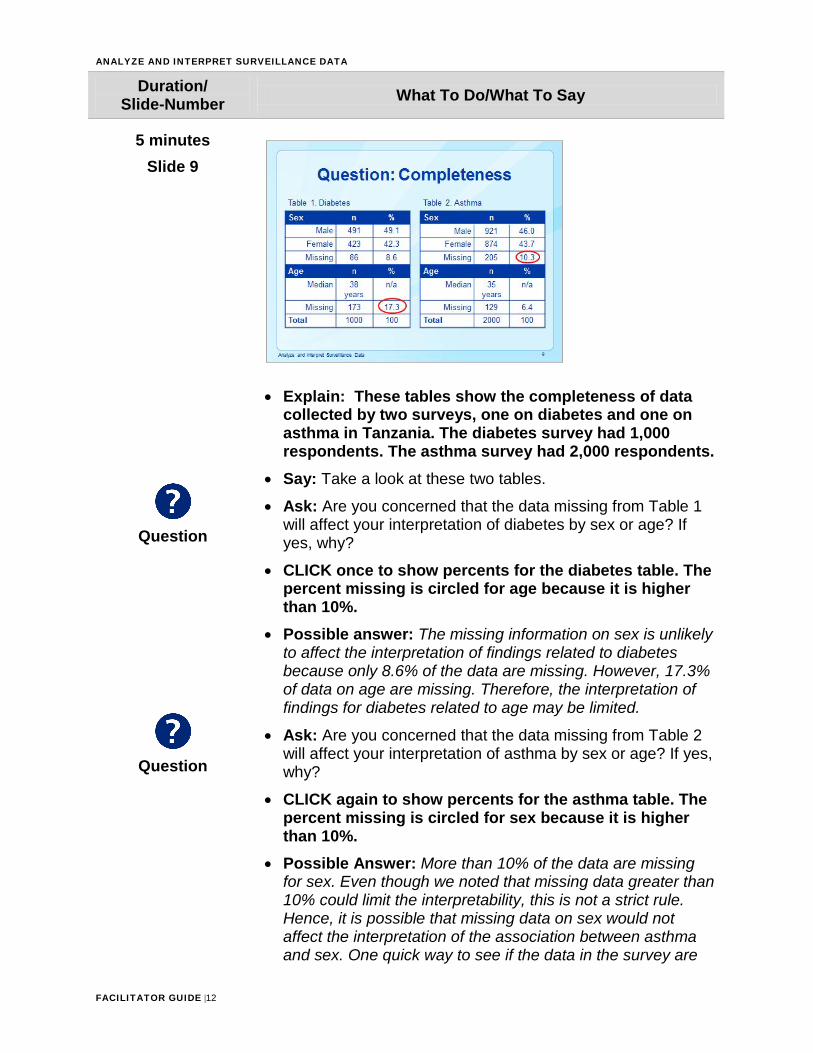
• Explain: These tables show the completeness of datacollected by two surveys, one on diabetes and one onasthma in Tanzania. The diabetes survey had 1,000respondents. The asthma survey had 2,000 respondents.
• Say: Take a look at these two tables.
• Ask: Are you concerned that the data missing from Table 1will affect your interpretation of diabetes by sex or age? Ifyes, why?
• CLICK once to show percents for the diabetes table. Thepercent missing is circled for age because it is higherthan 10%.
• Possible answer: The missing information on sex is unlikelyto affect the interpretation of findings related to diabetesbecause only 8.6% of the data are missing. However, 17.3%of data on age are missing. Therefore, the interpretation offindings for diabetes related to age may be limited.
• Ask: Are you concerned that the data missing from Table 2will affect your interpretation of asthma by sex or age? If yes,why?
• CLICK again to show percents for the asthma table. Thepercent missing is circled for sex because it is higherthan 10%.
• Possible Answer: More than 10% of the data are missingfor sex. Even though we noted that missing data greater than10% could limit the interpretability, this is not a strict rule.Hence, it is possible that missing data on sex would notaffect the interpretation of the association between asthmaand sex. One quick way to see if the data in the survey are
ANALYZE AND INTERPRET SURVEILLANCE DATA
FACILITATOR GUIDE |13
Duration/ Slide-Number What To Do/What To Say
similar to the source population, the population from which individuals were selected for the survey, is to compare the distribution of sex in the survey to the source population. For instance, if the survey was conducted among residents of Morogoro, you could compare the sex distribution in your survey with that of Morogoro. If the proportions are similar, then the missing data are not likely to affect your findings. However, if they are different, the 10% of missing information on sex may limit interpretation of your findings.
• Explain: In order to see if your sample population has asimilar distribution for a variable missing more than 10%, youneed to assess how different your sample estimate is fromthe general population. If the sample estimate is more than10% different than the estimate seen in the sourcepopulation, then you need to explore ways to deal with themissing data in your sample because your original estimatesmay be too high or too low. Relying on this flawedinformation may lead to inappropriate allocation of funds forinterventions that don’t address the true needs of yourpopulation.Remember, further examination into missing data shouldbe done when approximately 10% or more of the data aremissing. Since there is only about 6.5% of the datamissing for age in Table 2, missing information isunlikely to affect interpretations about how age impactsasthma in your sample.
3 minutes Slide 10
Question
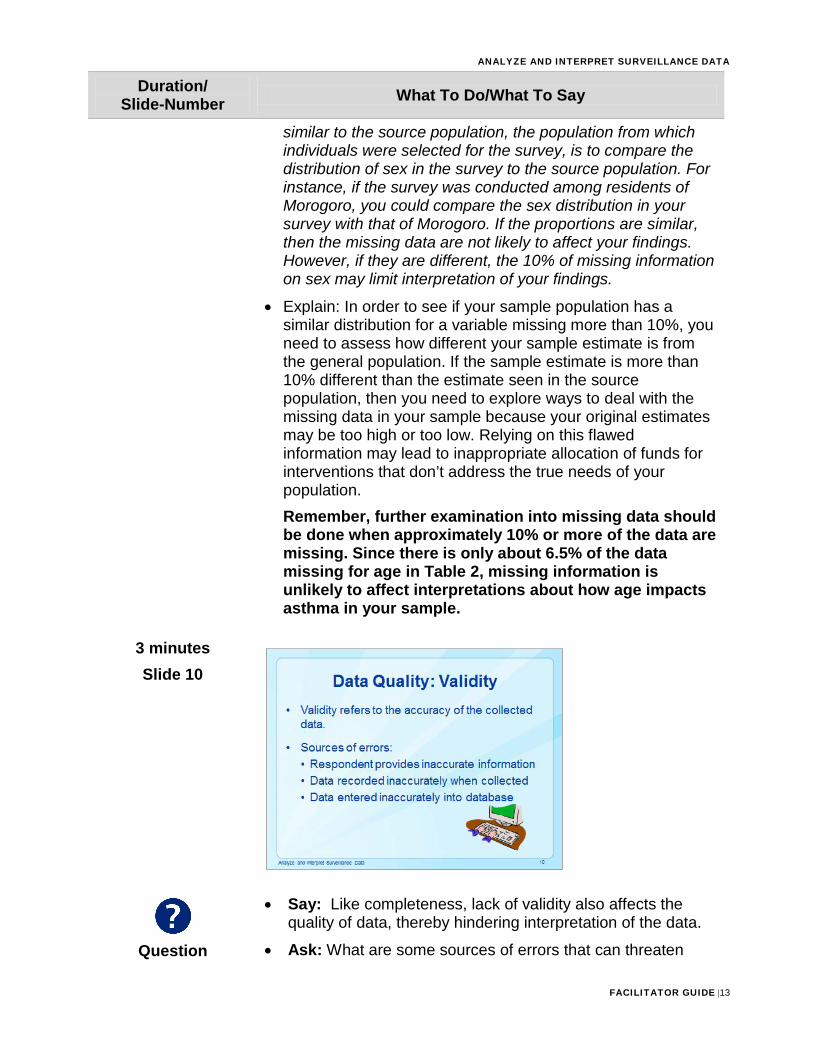
• Say: Like completeness, lack of validity also affects thequality of data, thereby hindering interpretation of the data.
• Ask: What are some sources of errors that can threaten
ANALYZE AND INTERPRET SURVEILLANCE DATA
FACILITATOR GUIDE |14
Duration/ Slide-Number What To Do/What To Say
validity?
• Click to show answers.• Possible Answers:
o Survey respondents provide inaccurate information. Thisoften occurs when the topic or issue is sensitive and a‘socially desirable response’ is clear. For example,someone may say he seeks monthly medical evaluationsfor his diabetes when, in reality, he may not have soughtmedical attention in years.
o Data are recorded erroneously when they are beingcollected. For instance, the data collector mightinadvertently record a respondent’s year of birth as 1997instead of 1957.
o Errors may occur when data are entered into a computerdatabase.
5 minutes Slide 11
Question
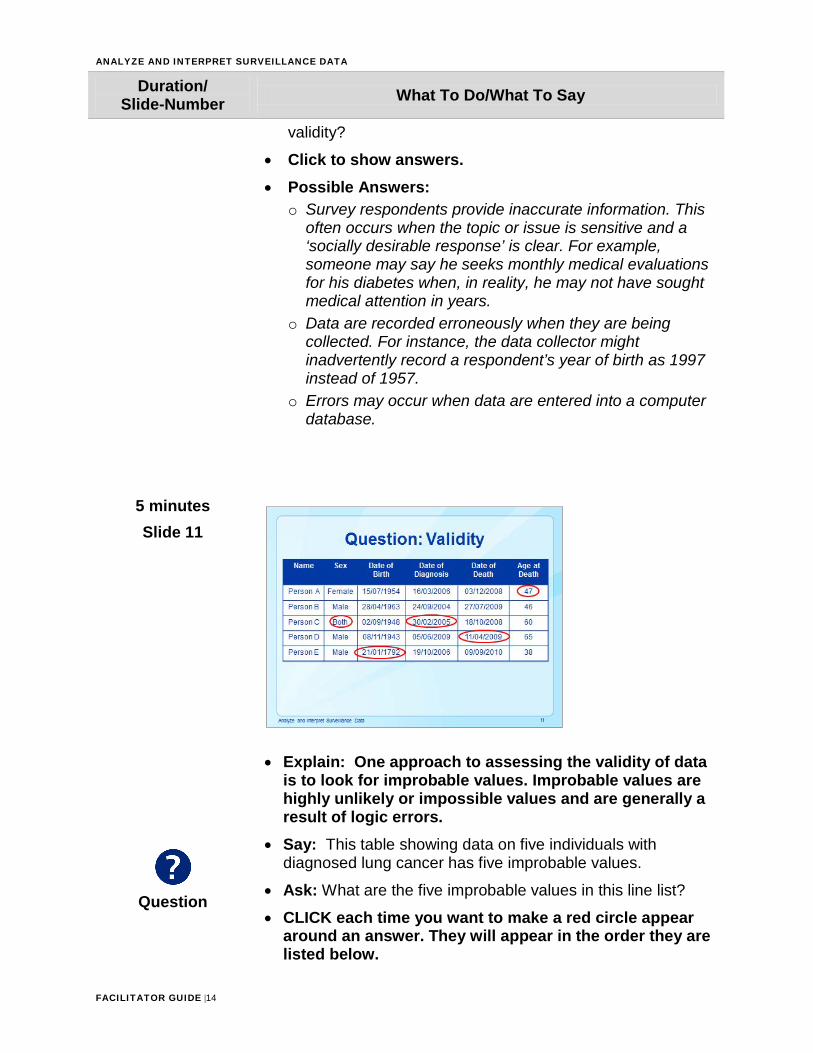
• Explain: One approach to assessing the validity of datais to look for improbable values. Improbable values arehighly unlikely or impossible values and are generally aresult of logic errors.
• Say: This table showing data on five individuals withdiagnosed lung cancer has five improbable values.
• Ask: What are the five improbable values in this line list?
• CLICK each time you want to make a red circle appeararound an answer. They will appear in the order they arelisted below.
ANALYZE AND INTERPRET SURVEILLANCE DATA
FACILITATOR GUIDE |15
Duration/ Slide-Number What To Do/What To Say
• Possible answers:1. Person A was 54 years old when she died, not 47 years
old (assuming the dates of birth and death are correct).2. Person C cannot be both a male and female. Sex refers
to an individual’s biological attributes, whereas genderrefers to the way a person self-identifies.
3. Person C could not have received a diagnosis on30/02/2005 since February never has 30 days.
4. Person D could not have died before his diagnosis date.5. Person E could not have been born in 1792.
1 minute Slide 12
• Tell participants that you will now discuss analyzingsurveillance data. Explain that analysis using statisticalsoftware is not the focus of this lesson.
2 minutes Slide 13
• Read the slide.
ANALYZE AND INTERPRET SURVEILLANCE DATA
FACILITATOR GUIDE |16
Duration/ Slide-Number What To Do/What To Say
• Say: Knowing the goals of surveillance before data collectionbegins will guide both the types of data which are collectedand the kinds of analyses to be performed. Before analyzingsurveillance data, it is important to make sure the analyticapproach you take will be able to address the surveillanceobjective.
2 minutes Slide 14
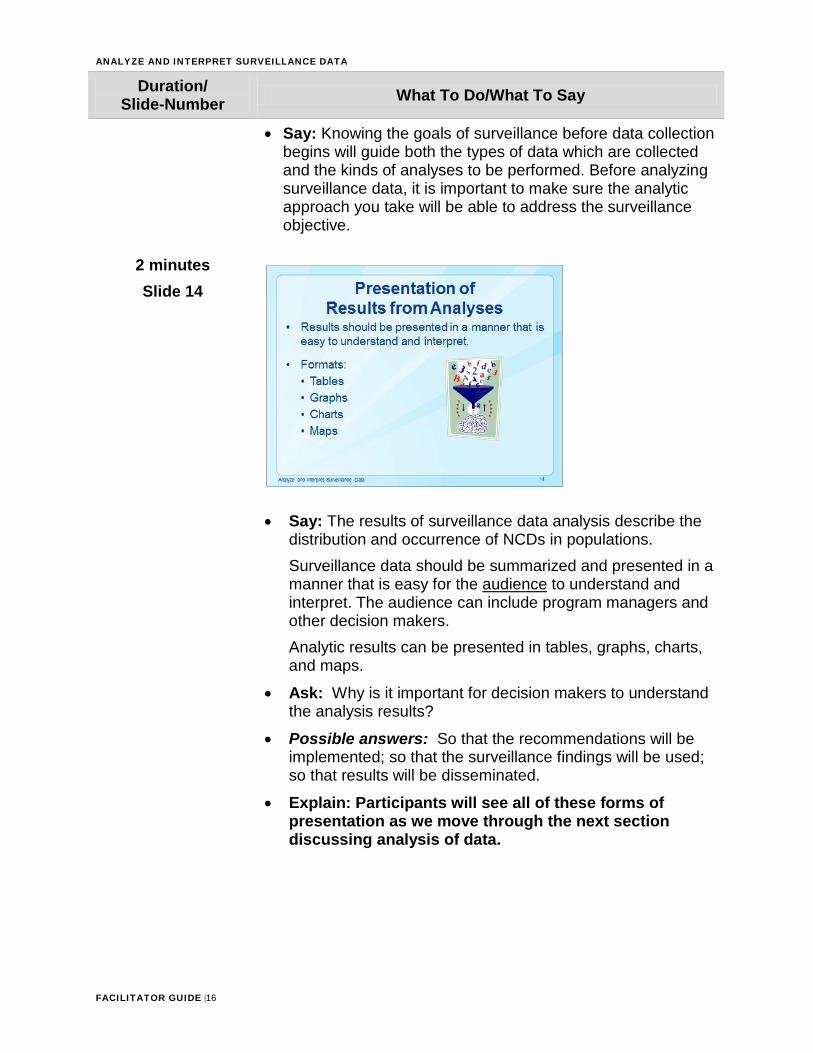
• Say: The results of surveillance data analysis describe thedistribution and occurrence of NCDs in populations.Surveillance data should be summarized and presented in amanner that is easy for the audience to understand andinterpret. The audience can include program managers andother decision makers.Analytic results can be presented in tables, graphs, charts,and maps.
• Ask: Why is it important for decision makers to understandthe analysis results?
• Possible answers: So that the recommendations will beimplemented; so that the surveillance findings will be used;so that results will be disseminated.
• Explain: Participants will see all of these forms ofpresentation as we move through the next sectiondiscussing analysis of data.
ANALYZE AND INTERPRET SURVEILLANCE DATA
FACILITATOR GUIDE |17
Duration/ Slide-Number What To Do/What To Say
1 minute Slide 15
• Explain: Surveillance data are used to describe thedistribution of a health condition or event in a community byperson, place, and time. This is referred to as descriptiveepidemiology.
2 minutes Slide 16
Question
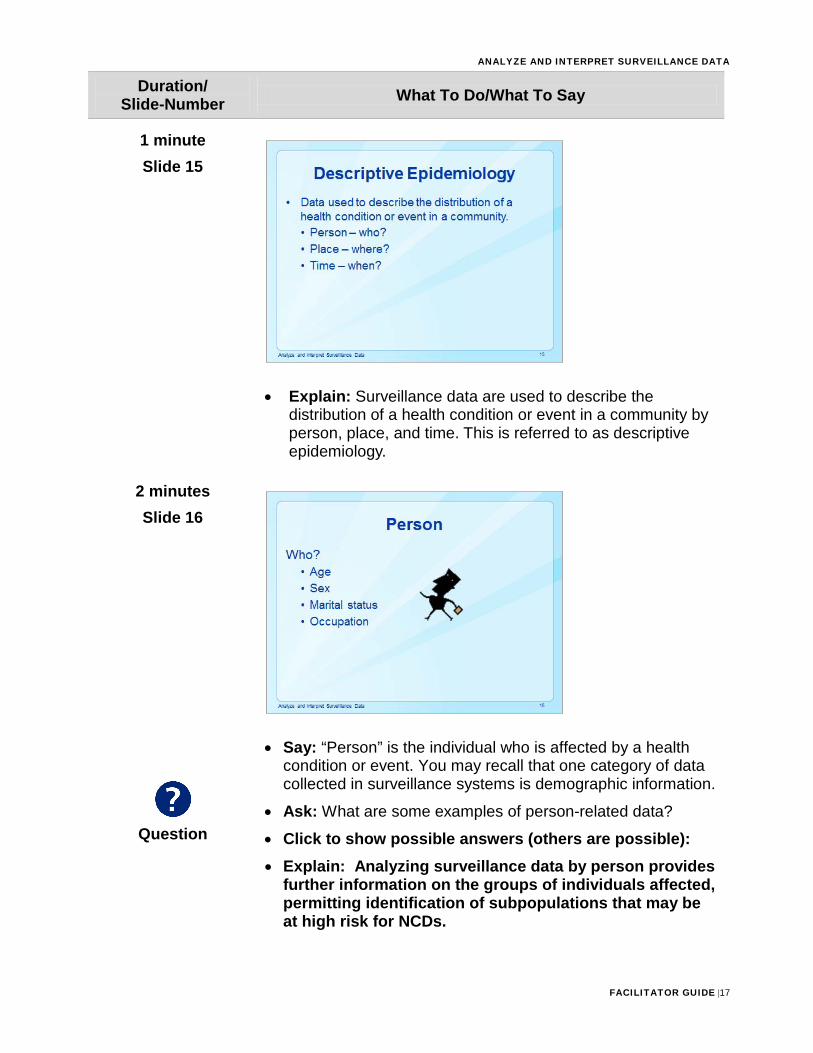
• Say: “Person” is the individual who is affected by a healthcondition or event. You may recall that one category of datacollected in surveillance systems is demographic information.
• Ask: What are some examples of person-related data?
• Click to show possible answers (others are possible):• Explain: Analyzing surveillance data by person provides
further information on the groups of individuals affected,permitting identification of subpopulations that may beat high risk for NCDs.
ANALYZE AND INTERPRET SURVEILLANCE DATA
FACILITATOR GUIDE |18
Duration/ Slide-Number What To Do/What To Say
3 minutes Slide 17
Question
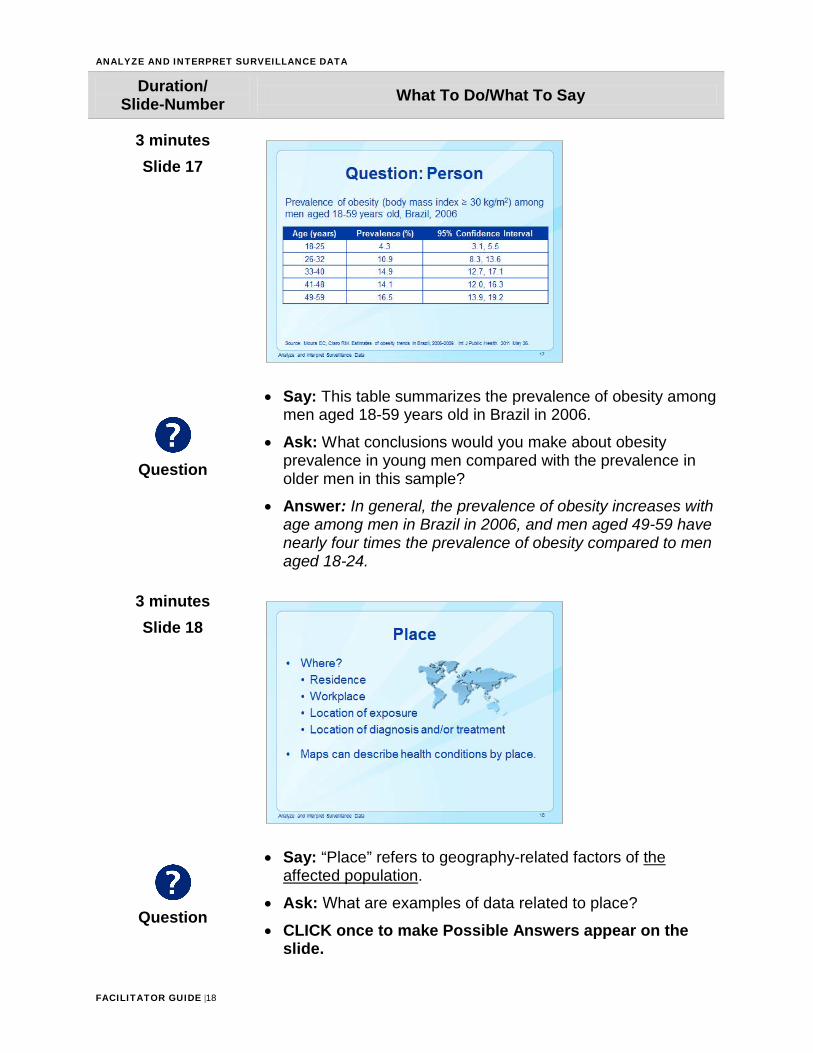
• Say: This table summarizes the prevalence of obesity amongmen aged 18-59 years old in Brazil in 2006.
• Ask: What conclusions would you make about obesityprevalence in young men compared with the prevalence inolder men in this sample?
• Answer: In general, the prevalence of obesity increases withage among men in Brazil in 2006, and men aged 49-59 havenearly four times the prevalence of obesity compared to menaged 18-24.
3 minutes Slide 18
Question
• Say: “Place” refers to geography-related factors of theaffected population.
• Ask: What are examples of data related to place?
• CLICK once to make Possible Answers appear on theslide.
ANALYZE AND INTERPRET SURVEILLANCE DATA
FACILITATOR GUIDE |19
Duration/ Slide-Number What To Do/What To Say
• Possible Answers:o Place of residenceo Workplaceo Place of exposureo Place where an individual sought diagnosis or treatment
3 minutes Slide 19
Question
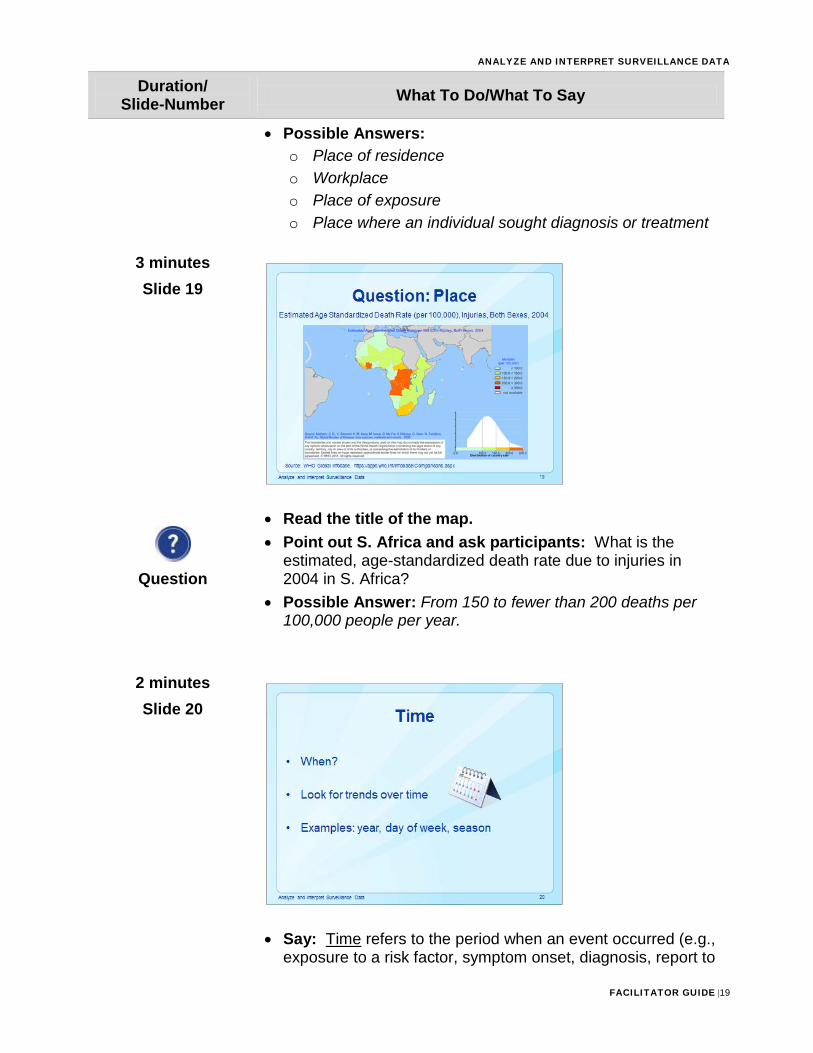
• Read the title of the map.• Point out S. Africa and ask participants: What is the
estimated, age-standardized death rate due to injuries in2004 in S. Africa?
• Possible Answer: From 150 to fewer than 200 deaths per100,000 people per year.
2 minutes Slide 20
• Say: Time refers to the period when an event occurred (e.g.,exposure to a risk factor, symptom onset, diagnosis, report to
ANALYZE AND INTERPRET SURVEILLANCE DATA
FACILITATOR GUIDE |20
Duration/ Slide-Number What To Do/What To Say
public health officials). Investigators look for changes in rates of health conditions over time (trends).
• Ask: What are some examples of time?
• CLICK on the slide to show examples.
3 minutes Slide 21
Question
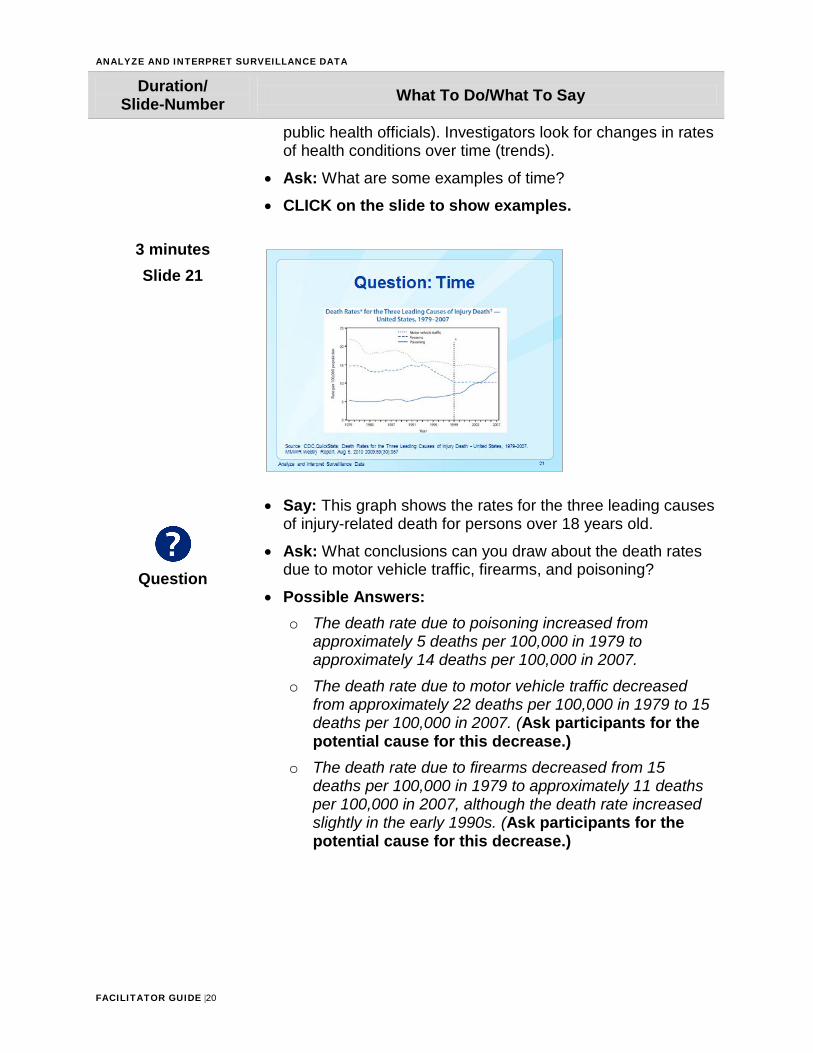
• Say: This graph shows the rates for the three leading causesof injury-related death for persons over 18 years old.
• Ask: What conclusions can you draw about the death ratesdue to motor vehicle traffic, firearms, and poisoning?
• Possible Answers:o The death rate due to poisoning increased from
approximately 5 deaths per 100,000 in 1979 toapproximately 14 deaths per 100,000 in 2007.
o The death rate due to motor vehicle traffic decreasedfrom approximately 22 deaths per 100,000 in 1979 to 15deaths per 100,000 in 2007. (Ask participants for thepotential cause for this decrease.)
o The death rate due to firearms decreased from 15deaths per 100,000 in 1979 to approximately 11 deathsper 100,000 in 2007, although the death rate increasedslightly in the early 1990s. (Ask participants for thepotential cause for this decrease.)
ANALYZE AND INTERPRET SURVEILLANCE DATA
FACILITATOR GUIDE |21
Duration/ Slide-Number What To Do/What To Say
3 minutes Slide 22
Question
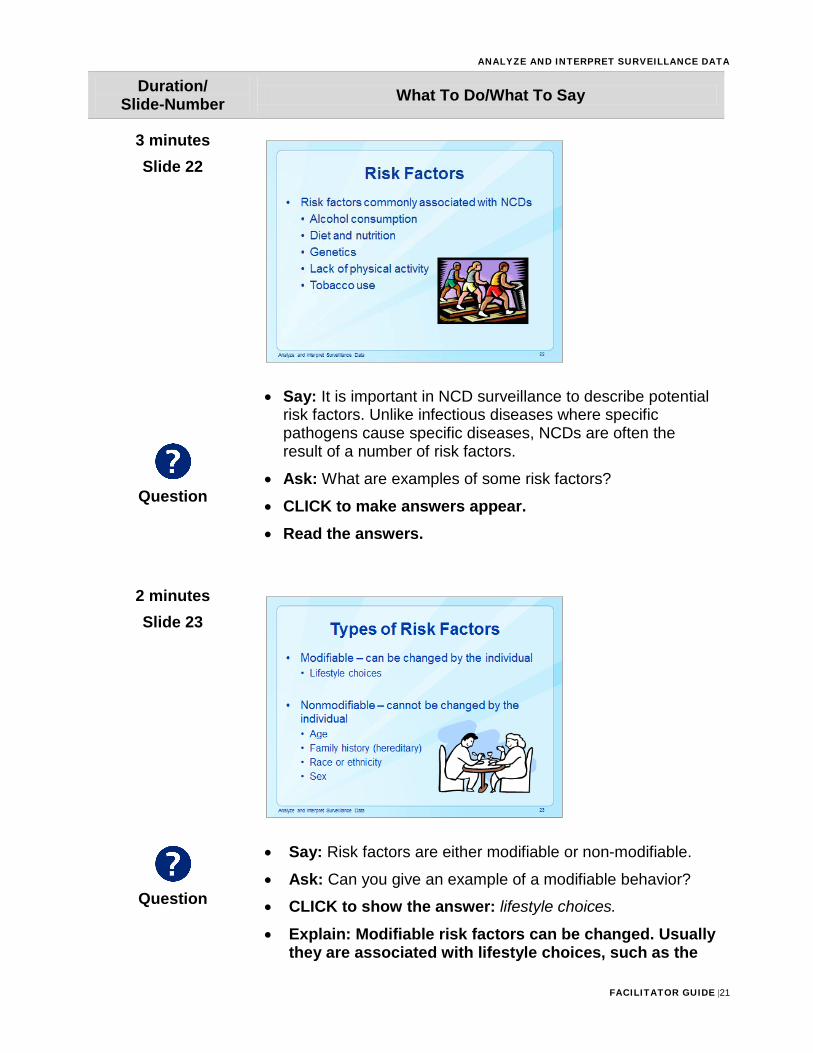
• Say: It is important in NCD surveillance to describe potentialrisk factors. Unlike infectious diseases where specificpathogens cause specific diseases, NCDs are often theresult of a number of risk factors.
• Ask: What are examples of some risk factors?
• CLICK to make answers appear.• Read the answers.
2 minutes Slide 23
Question
• Say: Risk factors are either modifiable or non-modifiable.
• Ask: Can you give an example of a modifiable behavior?
• CLICK to show the answer: lifestyle choices.
• Explain: Modifiable risk factors can be changed. Usuallythey are associated with lifestyle choices, such as the
ANALYZE AND INTERPRET SURVEILLANCE DATA
FACILITATOR GUIDE |22
Duration/ Slide-Number What To Do/What To Say
Question
extent of physical activity and choice of diet. • Ask: What are examples of non-modifiable behaviors?
• CLICK to show possible.• Explain: Non-modifiable risk factors cannot be changed.
Age, family history (hereditary), race or ethnicity, andbiological sex are examples. An example of ahereditary, non-modifiable risk factor is a mutation onthe BRCA1 or BRCA2 gene, which increases risk forbreast cancer.
5 minutes Slide 24
Question
Question
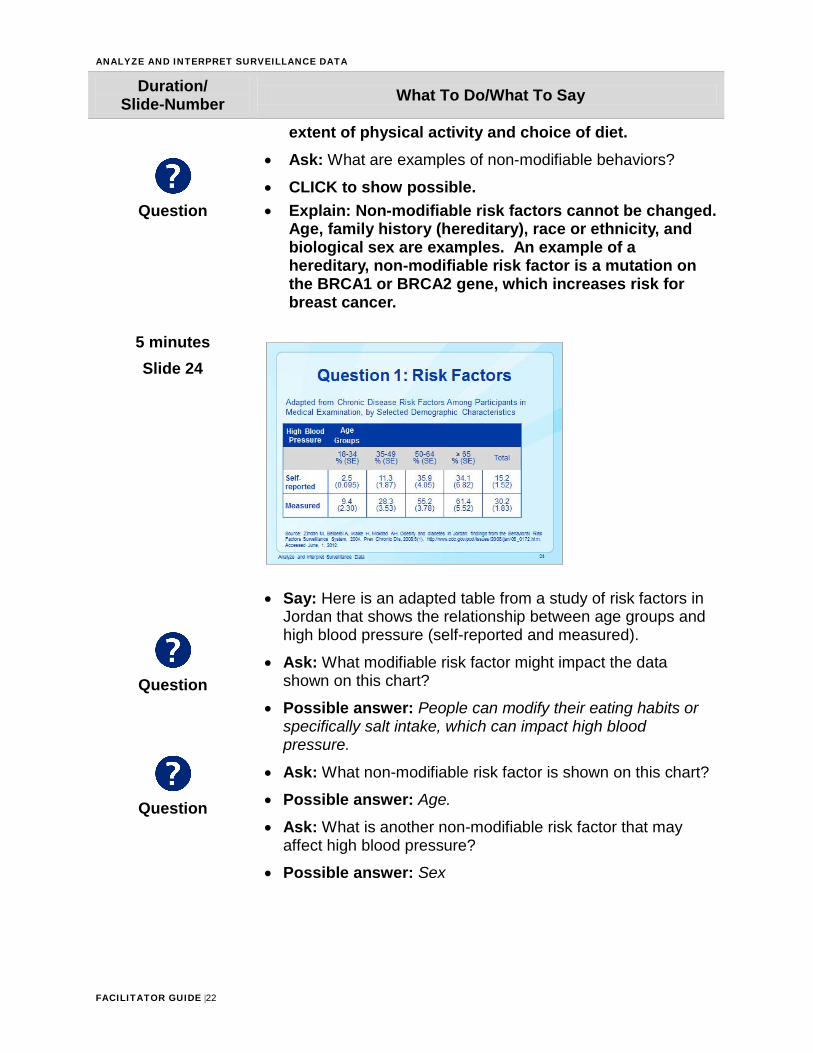
• Say: Here is an adapted table from a study of risk factors inJordan that shows the relationship between age groups andhigh blood pressure (self-reported and measured).
• Ask: What modifiable risk factor might impact the datashown on this chart?
• Possible answer: People can modify their eating habits orspecifically salt intake, which can impact high bloodpressure.
• Ask: What non-modifiable risk factor is shown on this chart?
• Possible answer: Age.
• Ask: What is another non-modifiable risk factor that mayaffect high blood pressure?
• Possible answer: Sex
ANALYZE AND INTERPRET SURVEILLANCE DATA
FACILITATOR GUIDE |23
Duration/ Slide-Number What To Do/What To Say
then the prevalence drops at ages 45-49.
5 minutes Slide 25
Question
Question
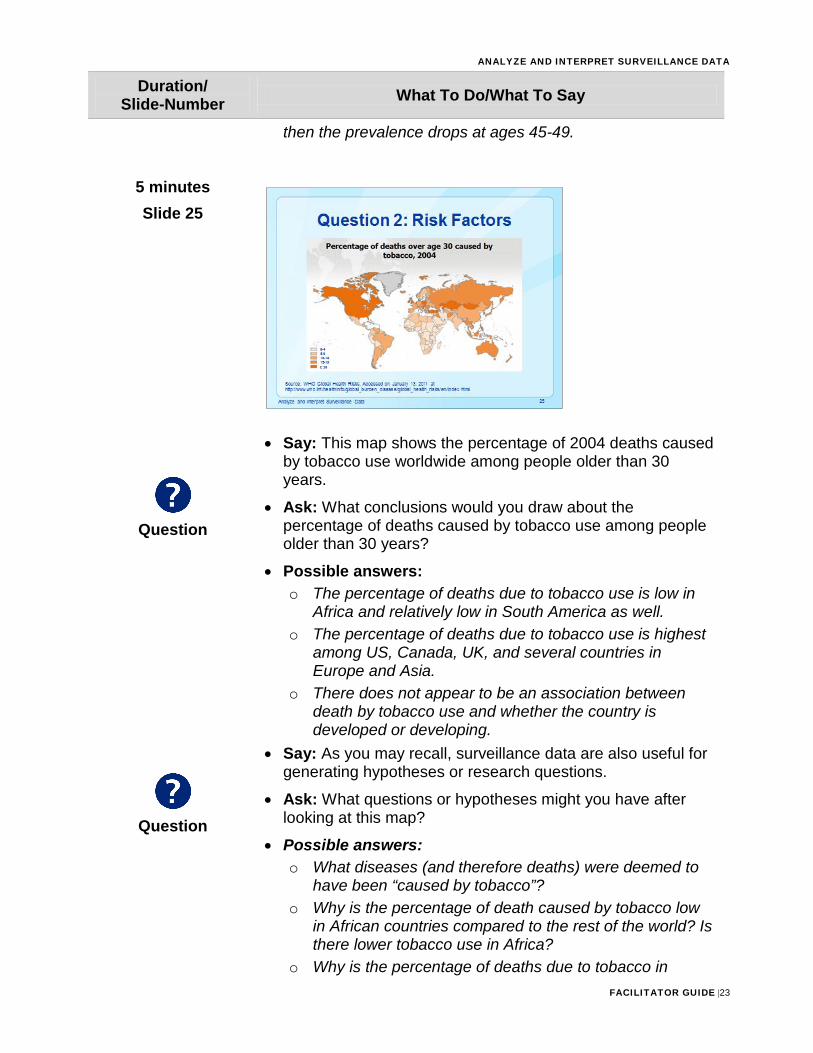
• Say: This map shows the percentage of 2004 deaths causedby tobacco use worldwide among people older than 30years.
• Ask: What conclusions would you draw about thepercentage of deaths caused by tobacco use among peopleolder than 30 years?
• Possible answers:o The percentage of deaths due to tobacco use is low in
Africa and relatively low in South America as well.o The percentage of deaths due to tobacco use is highest
among US, Canada, UK, and several countries inEurope and Asia.
o There does not appear to be an association betweendeath by tobacco use and whether the country isdeveloped or developing.
• Say: As you may recall, surveillance data are also useful forgenerating hypotheses or research questions.
• Ask: What questions or hypotheses might you have afterlooking at this map?
• Possible answers:o What diseases (and therefore deaths) were deemed to
have been “caused by tobacco”?o Why is the percentage of death caused by tobacco low
in African countries compared to the rest of the world? Isthere lower tobacco use in Africa?
o Why is the percentage of deaths due to tobacco in
ANALYZE AND INTERPRET SURVEILLANCE DATA
FACILITATOR GUIDE |24
Duration/ Slide-Number What To Do/What To Say
Kazakhstan, Mongolia, and Turkey so high?
2 minutes Slide 26
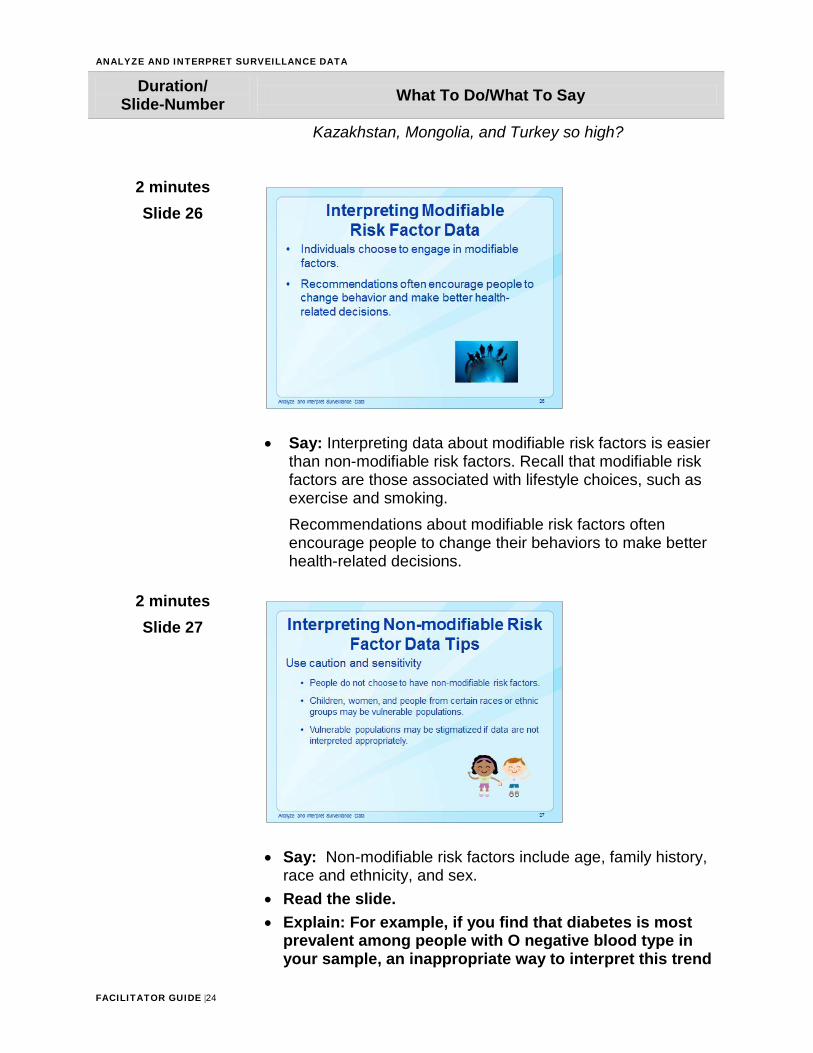
• Say: Interpreting data about modifiable risk factors is easierthan non-modifiable risk factors. Recall that modifiable riskfactors are those associated with lifestyle choices, such asexercise and smoking.Recommendations about modifiable risk factors oftenencourage people to change their behaviors to make betterhealth-related decisions.
2 minutes Slide 27
• Say: Non-modifiable risk factors include age, family history,race and ethnicity, and sex.
• Read the slide.• Explain: For example, if you find that diabetes is most
prevalent among people with O negative blood type inyour sample, an inappropriate way to interpret this trend
ANALYZE AND INTERPRET SURVEILLANCE DATA
FACILITATOR GUIDE |25
Duration/ Slide-Number What To Do/What To Say
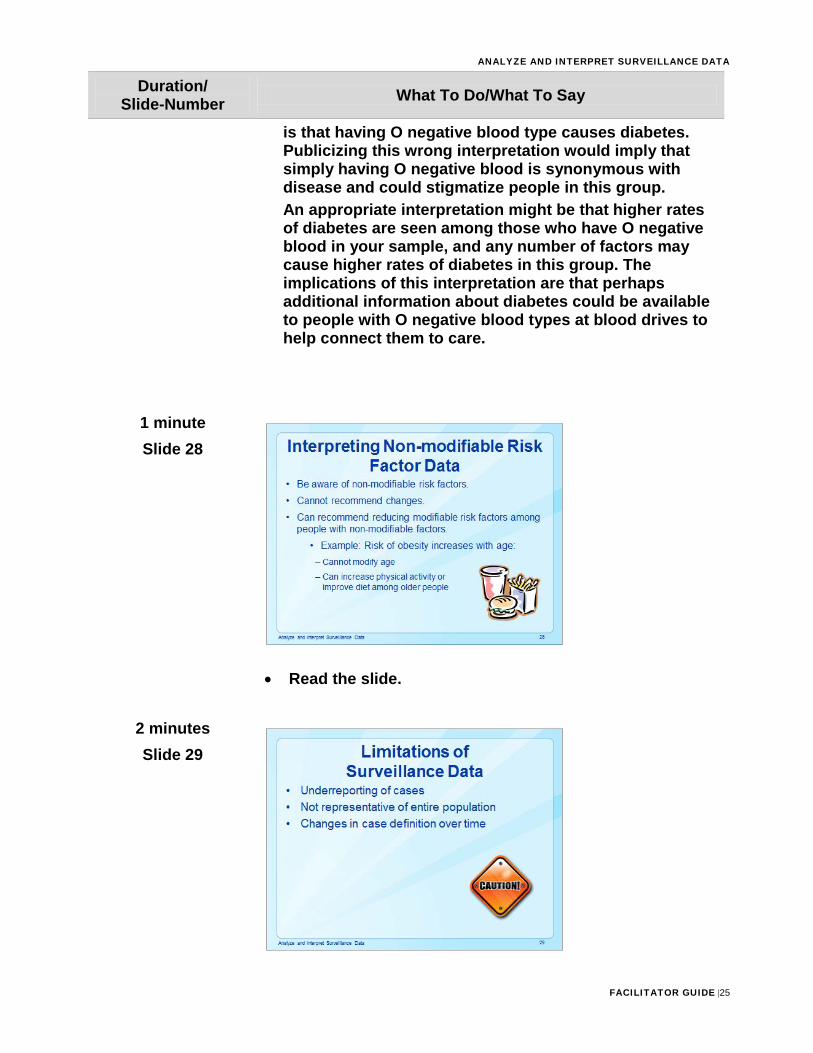
is that having O negative blood type causes diabetes. Publicizing this wrong interpretation would imply that simply having O negative blood is synonymous with disease and could stigmatize people in this group. An appropriate interpretation might be that higher rates of diabetes are seen among those who have O negative blood in your sample, and any number of factors may cause higher rates of diabetes in this group. The implications of this interpretation are that perhaps additional information about diabetes could be available to people with O negative blood types at blood drives to help connect them to care.
1 minute Slide 28
• Read the slide.
2 minutes Slide 29
ANALYZE AND INTERPRET SURVEILLANCE DATA
FACILITATOR GUIDE |26
Duration/ Slide-Number What To Do/What To Say
• Say: Earlier you were asked to interpret tables, graphs,charts, and maps. However, interpreting surveillance data isnot always easy or straightforward.
• Explain: The key to interpreting surveillance dataaccurately is to know the limitations of the data beingused. The most common limitations to surveillance dataare underreporting, representativeness and changes incase definition. These will be discussed further in thenext slides.
2 minutes Slide 30
• Read the information on the slide.• Explain: For notifiable (mandatory reporting) health
conditions, it is the responsibility of the diagnosingphysician or medical facility to report. These physiciansmay not be aware, or may just not participate. Inaddition, parents or families are responsible forreporting vital events (such as births, deaths) that occuroutside of medical facilities.
• Say: Periodic education should be conducted to raiseawareness on the responsibilities of reporting.
ANALYZE AND INTERPRET SURVEILLANCE DATA
FACILITATOR GUIDE |27
Duration/ Slide-Number What To Do/What To Say
2 minutes Slide 31
Question
• Ask: Can you share an example of underreporting that youmay have experienced in your work?
• Explain that you may see different reporting rates fromhospitals than from private physicians, and this mayresult in an underrepresentation of specific groups inyour results.
3 minutes Slide 32
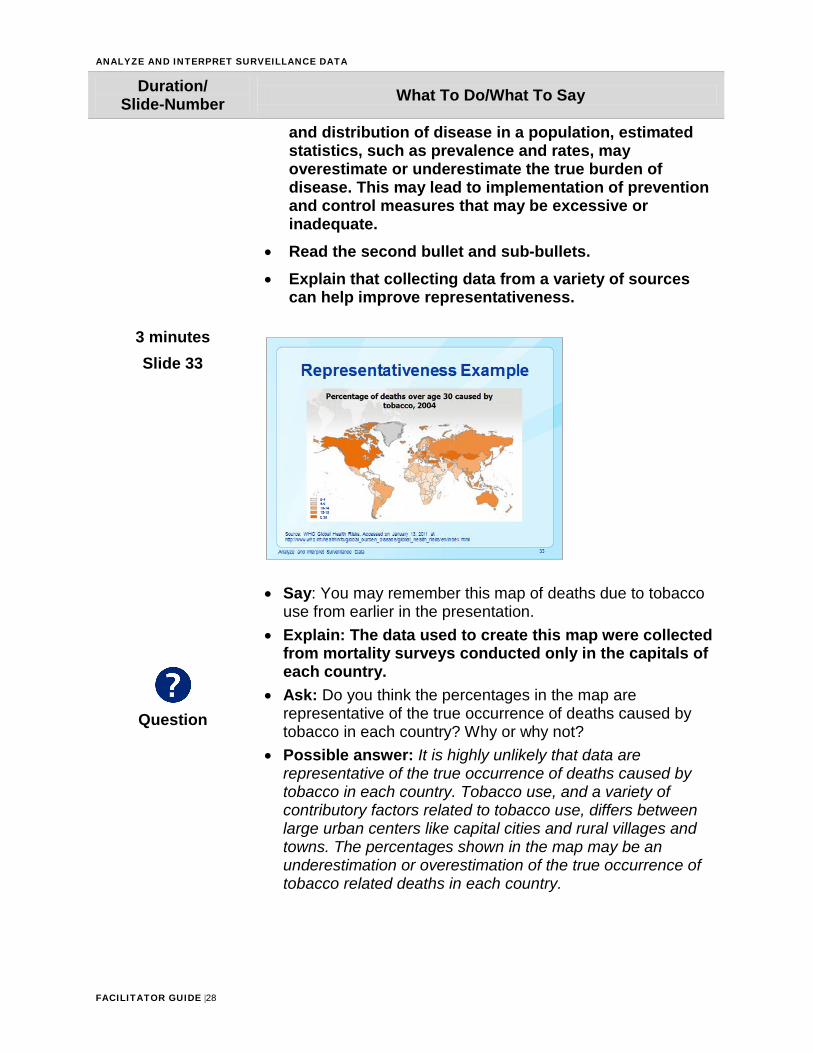
• Read the first bullet.• Explain that one of the goals of collecting surveillance
data is to be able to generalize findings to the sourcepopulation.
• Surveillance data that are representative of the truedistribution of a disease in a population permit publichealth authorities to take effective measures to reducethe burden of NCDs.
• When data are not representative of the true occurrence
ANALYZE AND INTERPRET SURVEILLANCE DATA
FACILITATOR GUIDE |28
Duration/ Slide-Number What To Do/What To Say
and distribution of disease in a population, estimated statistics, such as prevalence and rates, may overestimate or underestimate the true burden of disease. This may lead to implementation of prevention and control measures that may be excessive or inadequate.
• Read the second bullet and sub-bullets.• Explain that collecting data from a variety of sources
can help improve representativeness.
3 minutes Slide 33
Question
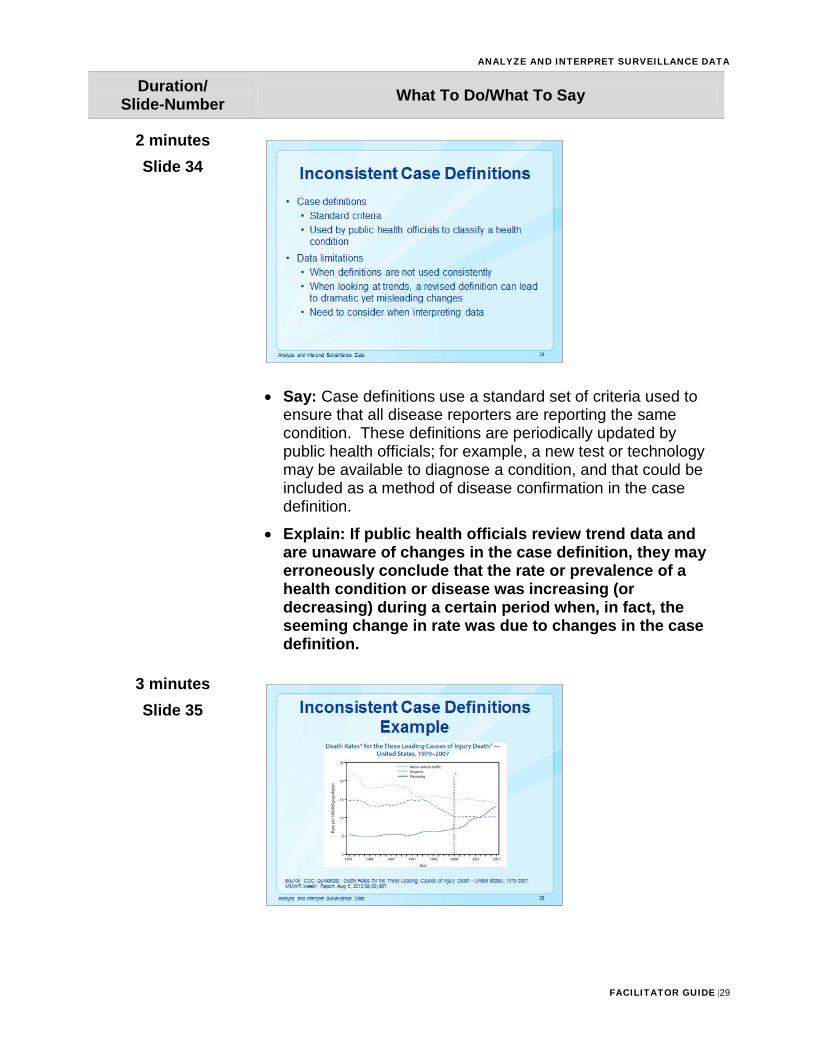
• Say: You may remember this map of deaths due to tobaccouse from earlier in the presentation.
• Explain: The data used to create this map were collectedfrom mortality surveys conducted only in the capitals ofeach country.
• Ask: Do you think the percentages in the map arerepresentative of the true occurrence of deaths caused bytobacco in each country? Why or why not?
• Possible answer: It is highly unlikely that data arerepresentative of the true occurrence of deaths caused bytobacco in each country. Tobacco use, and a variety ofcontributory factors related to tobacco use, differs betweenlarge urban centers like capital cities and rural villages andtowns. The percentages shown in the map may be anunderestimation or overestimation of the true occurrence oftobacco related deaths in each country.
ANALYZE AND INTERPRET SURVEILLANCE DATA
FACILITATOR GUIDE |29
Duration/ Slide-Number What To Do/What To Say
2 minutes Slide 34
• Say: Case definitions use a standard set of criteria used toensure that all disease reporters are reporting the samecondition. These definitions are periodically updated bypublic health officials; for example, a new test or technologymay be available to diagnose a condition, and that could beincluded as a method of disease confirmation in the casedefinition.
• Explain: If public health officials review trend data andare unaware of changes in the case definition, they mayerroneously conclude that the rate or prevalence of ahealth condition or disease was increasing (ordecreasing) during a certain period when, in fact, theseeming change in rate was due to changes in the casedefinition.
3 minutes Slide 35
ANALYZE AND INTERPRET SURVEILLANCE DATA
FACILITATOR GUIDE |30
Duration/ Slide-Number What To Do/What To Say
Question
Question
• Say: We’re looking again at the three leading causes ofinjury-related death in the US. It looks as if the death rate forpoisoning is increasing over time, and is decreasing forfirearms and motor vehicle crashes. Take a look at the blackvertical dotted line in 1999. This dotted line represents achange in the case definitions for the ICD codes for deathsresulting from poisoning, firearms, and motor vehiclecrashes.
• Ask: Now that we know that the case definition haschanged, how might this have impacted the rates for eachcause of injury death?
• Possible answer: As a result, deaths caused by poisoningincreased more steeply, whereas deaths caused by motorvehicle crashes decreased. There was little change in therate for firearms, and it continued to follow the previousdownward trend. We can’t be sure if these increases ordecreases were solely due to the new ICD codes or was alsothe result of true changes in the death rate in the population.
• Say: As you may recall from earlier in this presentation, wefound that the rate of deaths due to poisoning increased from5 deaths per 100,000 in 1979 to 14 deaths per 100,000 in2007.
• Ask: Knowing that there was a change in case definition in1999, how might that impact the change in rates that wediscussed earlier?
• Possible answer: The increase we see in the poisoningdeath rate may not be as dramatic as depicted in the graph.With this new case definition, perhaps more cases are beingcoded as poisoning deaths.
2 minutes Slide 36
ANALYZE AND INTERPRET SURVEILLANCE DATA
FACILITATOR GUIDE |31
Duration/ Slide-Number What To Do/What To Say
• Explain how ICD codes can be used to ensureconsistent case definitions.
• Read the slide.
10 minutes Slide 37- 43
Flip Chart
• Tell participants you will now have a fun, review gameof what they learned in the lesson.
• Note: Adjust number of questions depending onnumber of tables and teams. If participants arealready at small tables, you may keep them togetheras a team. Otherwise, divide the class into teams offour or five participants.
• After participants are in their teams, ask each team to(quickly) give you a team name. Record team nameson a flip chart.
• Tell participants to discuss answers in their teamsbefore providing them out loud. Correct answers willreceive two points. You may give one point forpartially correct answers.
• Begin by clicking on the following slides, one questionat a time.
• To reveal the answers, click on the slide after thequestion appears (and participants answer thequestion).
• Record points on flip chart.(Optional) Provide a prize to winning team.
ANALYZE AND INTERPRET SURVEILLANCE DATA
FACILITATOR GUIDE |32
Duration/ Slide-Number What To Do/What To Say
ANALYZE AND INTERPRET SURVEILLANCE DATA
FACILITATOR GUIDE |33
Duration/ Slide-Number What To Do/What To Say
1 ½ hours (1 hour assessment; 30 minutes review)
Slide 44
Activity
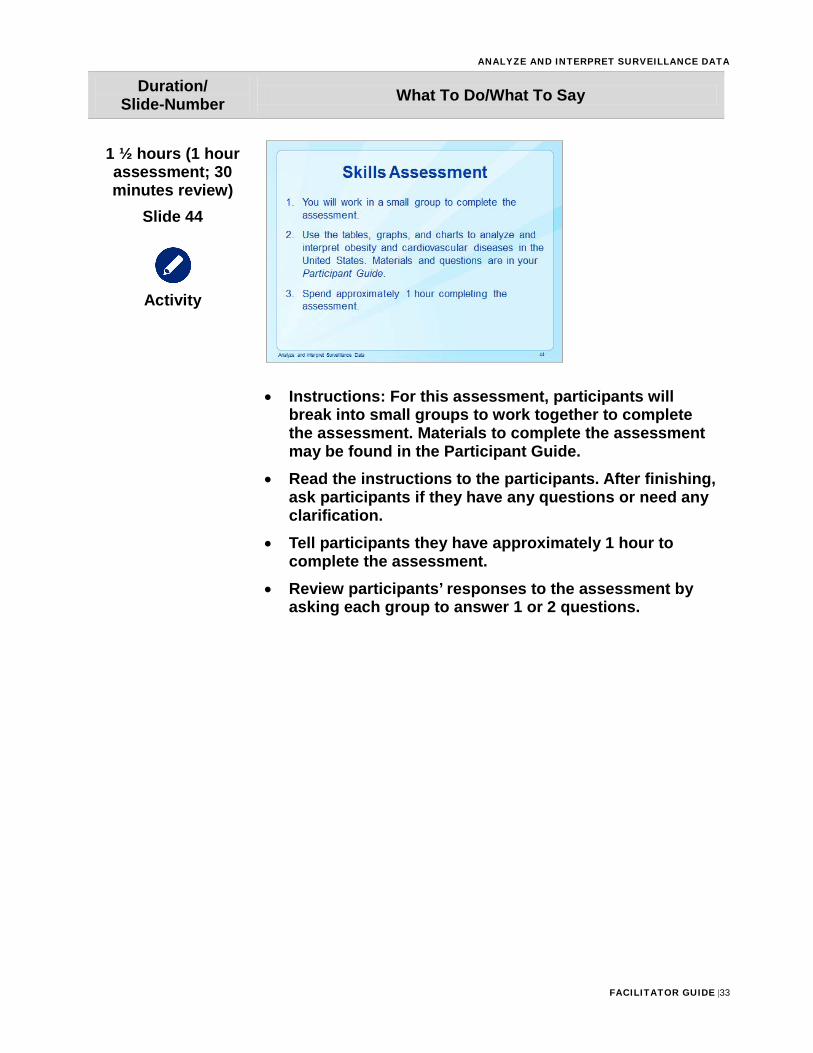
• Instructions: For this assessment, participants willbreak into small groups to work together to completethe assessment. Materials to complete the assessmentmay be found in the Participant Guide.
• Read the instructions to the participants. After finishing,ask participants if they have any questions or need anyclarification.
• Tell participants they have approximately 1 hour tocomplete the assessment.
• Review participants’ responses to the assessment byasking each group to answer 1 or 2 questions.
ANALYZE AND INTERPRET SURVEILLANCE DATA
FACILITATOR GUIDE |34
SKILL ASSESSMENT
Instructions: 1. You will work in small groups to complete the assessment.2. Select a member of your group to record your responses.3. There are 3 parts to this assessment. Groups will have approximately 1 hour to
complete the assessment.4. At the end of the assessment, one member from the group will share your answers
with the class. (30 minutes)
Part 1. Background (10 minutes) For this skill assessment, you will examine CVD mortality and obesity. 1. If the objective of a surveillance system is to characterize and monitor trends in
obesity in the United States, what categories, and specific data within each category, should be collected?
Answer: Note: The following is a suggested list of data within each category; it is not exhaustive and participants should be encouraged to share items not listed below. Information to collect includes identifying, demographic, clinical, and risk factor. There is no laboratory data to collect.
o Identifying: At the very least, the person’s city or town of residence should becollected.
o Demographic: Age, sex, race/ethnicity, and occupation should be collected. Otherinformation may include education, and socioeconomic status.
o Clinical information: Height and weight can be collected as self-reported butmeasured would be preferred.
o Risk factors: Information to be collected includes diet and physical activity.
2. In general terms, how would you present the data you collected in Question 1?
Answer: Data should be described by person, place, and time. It would be helpful to summarize demographic and risk factor information in tables and figures. A map would be useful to visualize where obesity is prevalent. Finally, a line graph showing the obesity trend over time would also be informative.
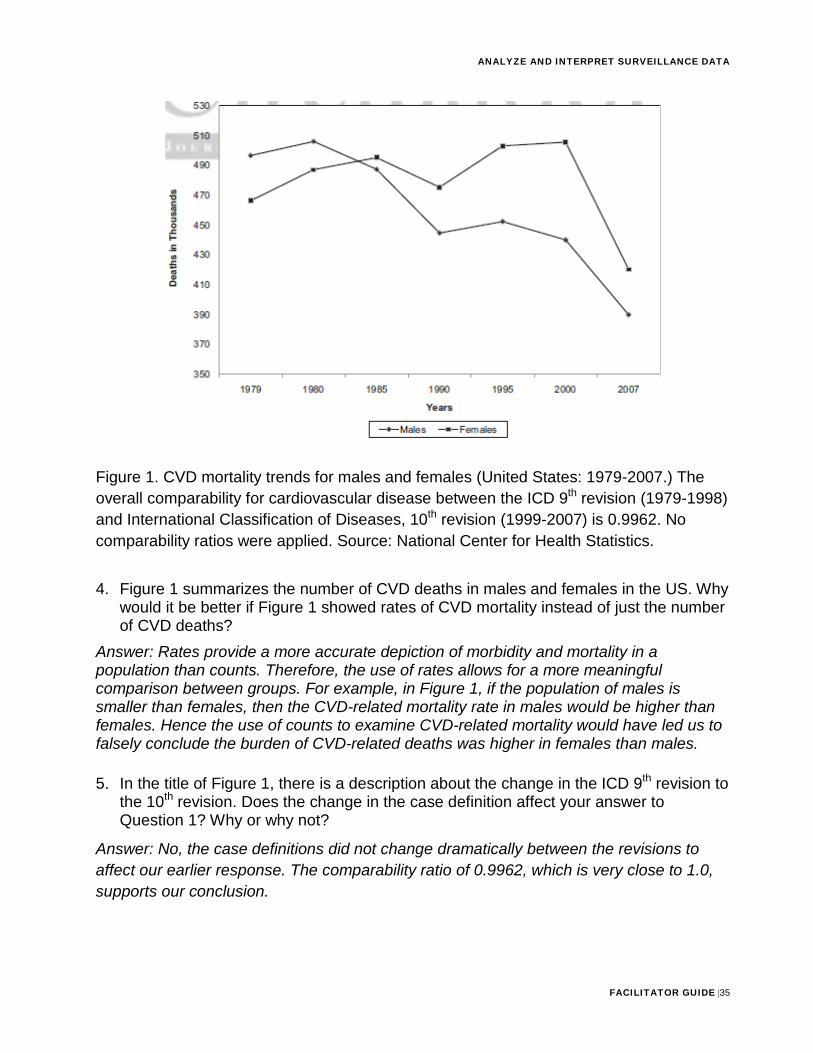
Part 2. Select Heart Disease-specific Mortality Counts and Rates in the US (20 minutes) 3. Using Figure 1, describe the trend observed in CVD-related mortality among males
and females from 1979-2007.
Answer: Before 1985, the number of CVD deaths in females was lower than males. However, since 1985 the number of CVD deaths in females has been higher than males. Overall, the number of CVD deaths in females increased from 1979-2000, although there was a slight decline from 1985-1990. Since 2000, there has been a dramatic drop in CVD-specific deaths among females. Overall, the number of CVD deaths in males has decreased over time, with a slight increase from 1979-1980 and 1990-1995, with a large drop in CVD deaths from 2000-2007.
ANALYZE AND INTERPRET SURVEILLANCE DATA
FACILITATOR GUIDE |35
Figure 1. CVD mortality trends for males and females (United States: 1979-2007.) The overall comparability for cardiovascular disease between the ICD 9th revision (1979-1998) and International Classification of Diseases, 10th revision (1999-2007) is 0.9962. No comparability ratios were applied. Source: National Center for Health Statistics.
4. Figure 1 summarizes the number of CVD deaths in males and females in the US. Whywould it be better if Figure 1 showed rates of CVD mortality instead of just the numberof CVD deaths?
Answer: Rates provide a more accurate depiction of morbidity and mortality in a population than counts. Therefore, the use of rates allows for a more meaningful comparison between groups. For example, in Figure 1, if the population of males is smaller than females, then the CVD-related mortality rate in males would be higher than females. Hence the use of counts to examine CVD-related mortality would have led us to falsely conclude the burden of CVD-related deaths was higher in females than males.
5. In the title of Figure 1, there is a description about the change in the ICD 9th revision tothe 10th revision. Does the change in the case definition affect your answer toQuestion 1? Why or why not?
Answer: No, the case definitions did not change dramatically between the revisions to affect our earlier response. The comparability ratio of 0.9962, which is very close to 1.0, supports our conclusion.
ANALYZE AND INTERPRET SURVEILLANCE DATA
FACILITATOR GUIDE |36
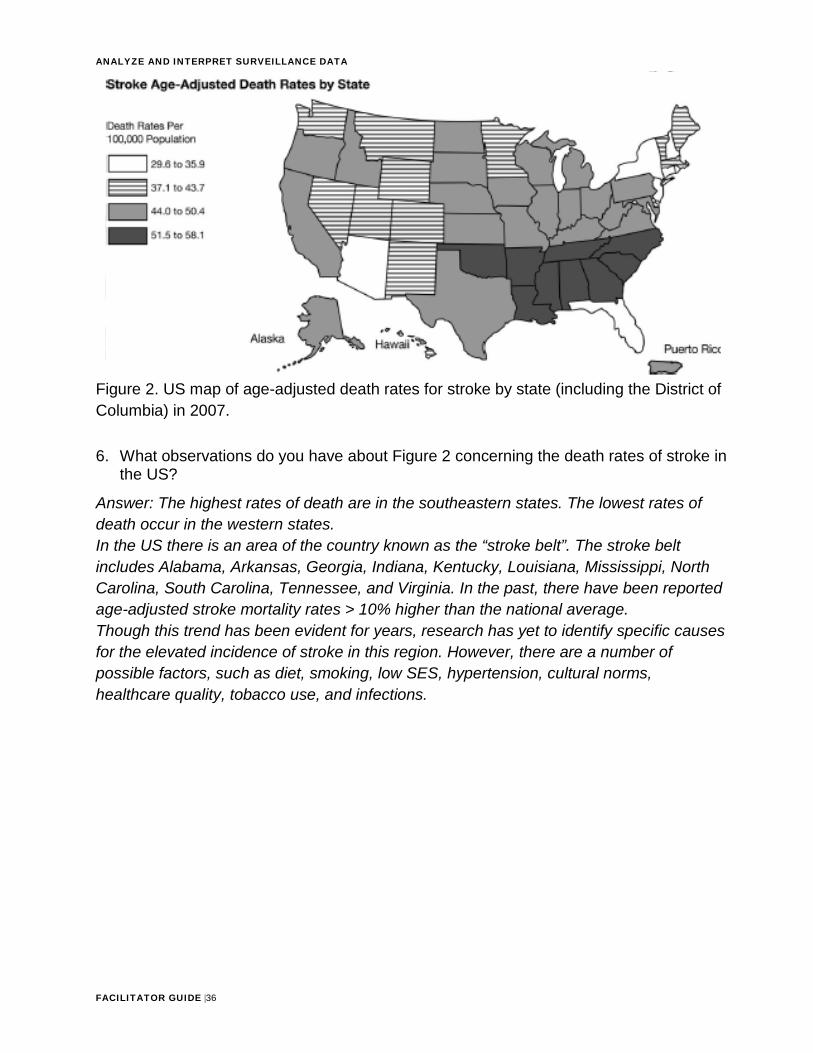
Figure 2. US map of age-adjusted death rates for stroke by state (including the District of Columbia) in 2007.
6. What observations do you have about Figure 2 concerning the death rates of stroke inthe US?
Answer: The highest rates of death are in the southeastern states. The lowest rates of death occur in the western states. In the US there is an area of the country known as the “stroke belt”. The stroke belt includes Alabama, Arkansas, Georgia, Indiana, Kentucky, Louisiana, Mississippi, North Carolina, South Carolina, Tennessee, and Virginia. In the past, there have been reported age-adjusted stroke mortality rates > 10% higher than the national average. Though this trend has been evident for years, research has yet to identify specific causes for the elevated incidence of stroke in this region. However, there are a number of possible factors, such as diet, smoking, low SES, hypertension, cultural norms, healthcare quality, tobacco use, and infections.
ANALYZE AND INTERPRET SURVEILLANCE DATA
FACILITATOR GUIDE |37
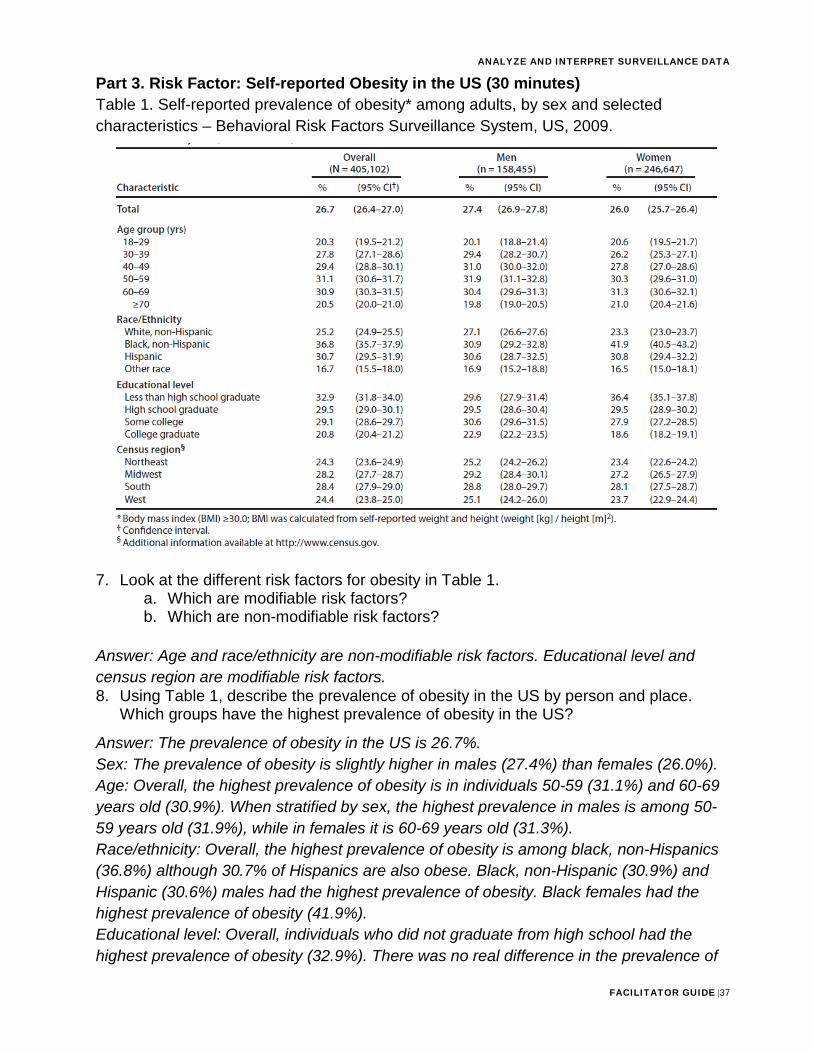
Part 3. Risk Factor: Self-reported Obesity in the US (30 minutes) Table 1. Self-reported prevalence of obesity* among adults, by sex and selected characteristics – Behavioral Risk Factors Surveillance System, US, 2009.
7. Look at the different risk factors for obesity in Table 1.a. Which are modifiable risk factors?b. Which are non-modifiable risk factors?
Answer: Age and race/ethnicity are non-modifiable risk factors. Educational level and census region are modifiable risk factors. 8. Using Table 1, describe the prevalence of obesity in the US by person and place.
Which groups have the highest prevalence of obesity in the US?
Answer: The prevalence of obesity in the US is 26.7%. Sex: The prevalence of obesity is slightly higher in males (27.4%) than females (26.0%). Age: Overall, the highest prevalence of obesity is in individuals 50-59 (31.1%) and 60-69 years old (30.9%). When stratified by sex, the highest prevalence in males is among 50-59 years old (31.9%), while in females it is 60-69 years old (31.3%). Race/ethnicity: Overall, the highest prevalence of obesity is among black, non-Hispanics (36.8%) although 30.7% of Hispanics are also obese. Black, non-Hispanic (30.9%) and Hispanic (30.6%) males had the highest prevalence of obesity. Black females had the highest prevalence of obesity (41.9%). Educational level: Overall, individuals who did not graduate from high school had the highest prevalence of obesity (32.9%). There was no real difference in the prevalence of
ANALYZE AND INTERPRET SURVEILLANCE DATA
FACILITATOR GUIDE |38
obesity among males who did not graduate from high school education and those who had some college education. However, among females, those who did not graduate from high school had the highest prevalence of obesity (36.4%), and there appeared to be a decreasing trend in obesity prevalence with increasing educational level. Census region: Overall, the highest prevalence of obesity was in the South (28.4%), and Midwest (28.2%). This was true for males and females.
ANALYZE AND INTERPRET SURVEILLANCE DATA
FACILITATOR GUIDE |39
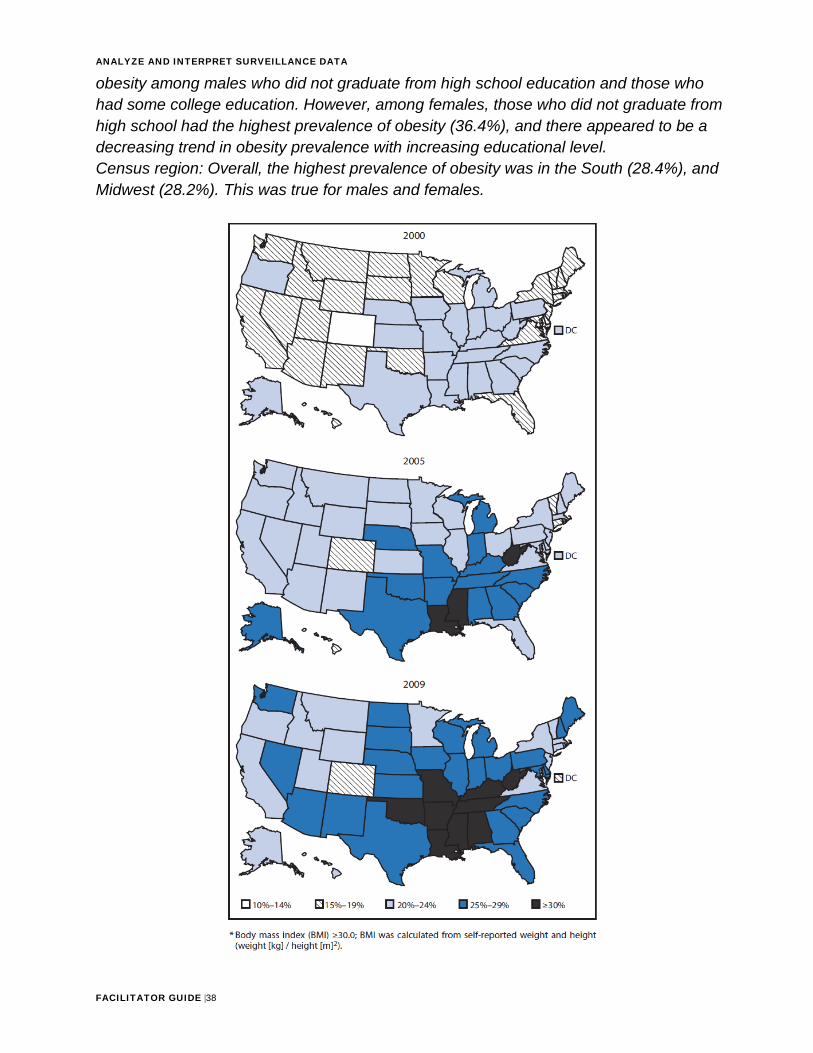
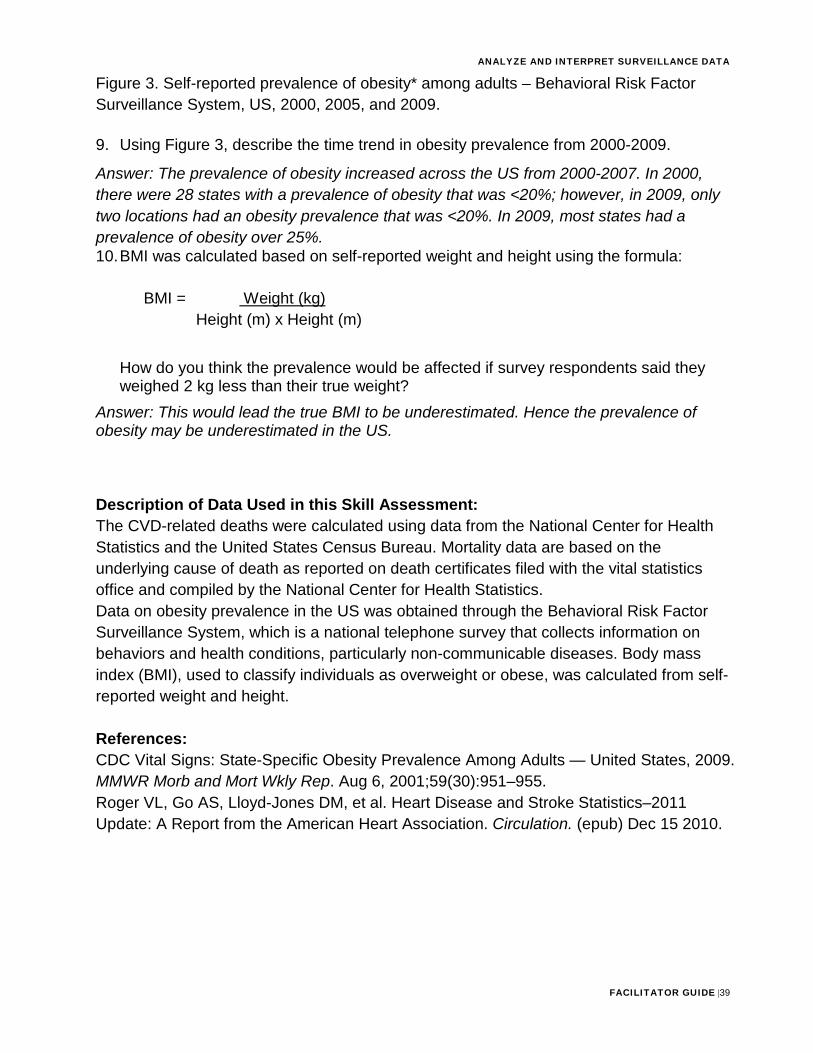
Figure 3. Self-reported prevalence of obesity* among adults – Behavioral Risk Factor Surveillance System, US, 2000, 2005, and 2009. 9. Using Figure 3, describe the time trend in obesity prevalence from 2000-2009.
Answer: The prevalence of obesity increased across the US from 2000-2007. In 2000, there were 28 states with a prevalence of obesity that was <20%; however, in 2009, only two locations had an obesity prevalence that was <20%. In 2009, most states had a prevalence of obesity over 25%. 10. BMI was calculated based on self-reported weight and height using the formula:
BMI = Weight (kg)
Height (m) x Height (m)
How do you think the prevalence would be affected if survey respondents said they weighed 2 kg less than their true weight?
Answer: This would lead the true BMI to be underestimated. Hence the prevalence of obesity may be underestimated in the US.
Description of Data Used in this Skill Assessment: The CVD-related deaths were calculated using data from the National Center for Health Statistics and the United States Census Bureau. Mortality data are based on the underlying cause of death as reported on death certificates filed with the vital statistics office and compiled by the National Center for Health Statistics. Data on obesity prevalence in the US was obtained through the Behavioral Risk Factor Surveillance System, which is a national telephone survey that collects information on behaviors and health conditions, particularly non-communicable diseases. Body mass index (BMI), used to classify individuals as overweight or obese, was calculated from self-reported weight and height. References: CDC Vital Signs: State-Specific Obesity Prevalence Among Adults — United States, 2009. MMWR Morb and Mort Wkly Rep. Aug 6, 2001;59(30):951–955. Roger VL, Go AS, Lloyd-Jones DM, et al. Heart Disease and Stroke Statistics–2011 Update: A Report from the American Heart Association. Circulation. (epub) Dec 15 2010.


![INDEX [] · o Calculate, analyze, and interpret measurement system capability using repeatability and ... Risk management • Process MonitoringFailure Mode Effect Analysis (FMEA)](https://img.pdfslide.net/doc/110x75/5e8914ee45dad3458c15b0f0/index-o-calculate-analyze-and-interpret-measurement-system-capability-using.jpg)