Embed Size (px)
Citation preview

University of Tennessee, Knoxville University of Tennessee, Knoxville
TRACE: Tennessee Research and Creative TRACE: Tennessee Research and Creative
Exchange Exchange
Masters Theses Graduate School
5-2018
ANALYZING COLLEGE STUDENTS' PERCEPTIONS OF THE DAIRY ANALYZING COLLEGE STUDENTS' PERCEPTIONS OF THE DAIRY
INDUSTRY THROUGH A DAIRY FARM VISIT: A CONVENIENCE INDUSTRY THROUGH A DAIRY FARM VISIT: A CONVENIENCE
SAMPLE APPROACH SAMPLE APPROACH
Erin Nicole Allen University of Tennessee
Follow this and additional works at: https://trace.tennessee.edu/utk_gradthes
Recommended Citation Recommended Citation Allen, Erin Nicole, "ANALYZING COLLEGE STUDENTS' PERCEPTIONS OF THE DAIRY INDUSTRY THROUGH A DAIRY FARM VISIT: A CONVENIENCE SAMPLE APPROACH. " Master's Thesis, University of Tennessee, 2018. https://trace.tennessee.edu/utk_gradthes/5064
This Thesis is brought to you for free and open access by the Graduate School at TRACE: Tennessee Research and Creative Exchange. It has been accepted for inclusion in Masters Theses by an authorized administrator of TRACE: Tennessee Research and Creative Exchange. For more information, please contact [email protected].
To the Graduate Council:
I am submitting herewith a thesis written by Erin Nicole Allen entitled "ANALYZING COLLEGE
STUDENTS' PERCEPTIONS OF THE DAIRY INDUSTRY THROUGH A DAIRY FARM VISIT: A
CONVENIENCE SAMPLE APPROACH." I have examined the final electronic copy of this thesis for
form and content and recommend that it be accepted in partial fulfillment of the requirements
for the degree of Master of Science, with a major in Agricultural Leadership, Education and
Communications.
Joseph L. Donaldson, Major Professor
We have read this thesis and recommend its acceptance:
Gina M. Pighetti, Carrie A. Stevens
Accepted for the Council:
Dixie L. Thompson
Vice Provost and Dean of the Graduate School
(Original signatures are on file with official student records.)

ANALYZING COLLEGE STUDENTS’ PERCEPTIONS
OF THE DAIRY INDUSTRY THROUGH A DAIRY FARM
VISIT:
A CONVENIENCE SAMPLE APPROACH
A Thesis Presented for the
Master of Science
Degree
The University of Tennessee, Knoxville
Erin Nicole Allen
May 2018
ii
ABSTRACT
Potentially due to a lack of trust and limited communication between farmers and
consumers, there is an issue of consumer misinformation about the dairy industry. Consumer
perception is negatively impacting the industry and hurting dairy farmers across the country.
Agritourism and dairy farm visits have had limited study. From the standpoint of consumer
perception, today’s college students make up an intriguing study population. This generation,
Generation Z, is in the process of developing their buying behaviors; they will eventually make
up a significant portion of consumers with a great deal of buying power (Priporas, Stylos &
Fotiadis, 2017). The purpose of this study was to analyze college students’ perceptions of the
dairy industry before and after visiting an operating dairy farm to see if their perceptions
changed, if at all. The objectives for the study include a comparison of participants’ perceptions
of herd health, dairy regulations, and farm practices prior to and after the farm visit. The
researcher also sought to evaluate participants’ satisfaction with the dairy farm visit. An
instrument was created to align with prior research and the study objectives. The instrument was
validated by an expert panel and found to be reliable through pilot testing. A convenience sample
of participants (N=8) was recruited from the History of Food course at the University of
Tennessee. Participants completed a pretest before the dairy farm visit and a posttest afterwards.
This dairy farm visit included a tour, lecture, and opportunities to ask dairy farmers questions.
The results from comparing the pretest/posttest perceptions suggest that the dairy farm visits had
a positive impact on the participants’ perceptions of the dairy industry. Almost 90% of the
participants agreed when asked if: this dairy visit motivated them to buy more dairy products,
they were taught something new on the visit, and the visit made them perceive the dairy industry
more positively. Recommendations include the need to provide consumers with dairy farm visits
that are scheduled at more convenient times and that include an intentional educational
experience.

iii
TABLE OF CONTENTS
Chapter One Introduction and General Information ....................................................................... 1 Statement of the Problem ............................................................................................................ 2 Purpose and Objectives ............................................................................................................... 2 Significance and Stakeholders .................................................................................................... 2 Limitations and Assumptions ..................................................................................................... 2 Operational Definitions ............................................................................................................... 3
Chapter Two Literature Review ...................................................................................................... 4 Consumer Concerns .................................................................................................................... 4 Agritourism ................................................................................................................................. 5 Consumer Demographics ............................................................................................................ 6 Characteristics of Prior Generations ........................................................................................... 7 Characteristics of Generation Z .................................................................................................. 9 Constructivism .......................................................................................................................... 10 Literature Review Summary ..................................................................................................... 11
Chapter Three Materials and Methods .......................................................................................... 12 Purpose of the Study ................................................................................................................. 12 Study Design ............................................................................................................................. 12 Population ................................................................................................................................. 12 Instrumentation ......................................................................................................................... 13 Data Collection ......................................................................................................................... 15 Data Analysis ............................................................................................................................ 15 Sample Size ............................................................................................................................... 16
Chapter Four Results..................................................................................................................... 17 Purpose of the Study ................................................................................................................. 17 Demographic Characteristics of Farm Visit Participants.......................................................... 18 Agricultural Education Background of Participants ................................................................. 19 Comparing Participants’ Pre/Posttest Responses: Herd Health ................................................ 20 Comparing Participants’ Pre/Post Responses: Dairy Regulations ............................................ 22 Comparing Participants’ Pre/Post Responses: Farm Practices ................................................. 24 Participants’ Satisfaction with the Dairy Visit.......................................................................... 26 Summary of Key Findings ........................................................................................................ 28 Participant Demographics & Agricultural Education Background .......................................... 28 Participant Herd Health Responses ........................................................................................... 28 Participant Dairy Regulation Responses ................................................................................... 28 Participant Farm Practice Responses ........................................................................................ 28 Satisfaction with Dairy Farm Visit ........................................................................................... 29
Chapter Five Conclusions, Discussion and Recommendations .................................................... 30 Purpose of the Study ................................................................................................................. 30 Discussion and Implications ..................................................................................................... 30 Conclusions ............................................................................................................................... 33 Recommendations for Future Research .................................................................................... 35
List of References ......................................................................................................................... 37 Appendices .................................................................................................................................... 43
Appendix A: Talking Points Script ........................................................................................... 44 Appendix B: Pretest .................................................................................................................. 45

iv
Appendix C: Posttest................................................................................................................. 51 Appendix D: Consent Form ...................................................................................................... 58 Appendix E: Cover Letter ......................................................................................................... 60 Appendix F: IRB Correspondences .......................................................................................... 61 Appendix G: Dairy Farming Presentation ................................................................................ 64
Vita ................................................................................................................................................ 74
v
LIST OF TABLES
Table 1. Reliability Coefficients ................................................................................................... 14 Table 2. Demographic Profile of Participants............................................................................... 18 Table 3: Dairy and Agricultural Exposure of Participants ............................................................ 19 Table 4. Herd Health ..................................................................................................................... 21 Table 5: Dairy Regulations ........................................................................................................... 23 Table 6: Farm Practices ................................................................................................................ 25 Table 7: Dairy Visit Satisfaction................................................................................................... 27 Table 8: Correlation Matrix .......................................................................................................... 70

vi
LIST OF FIGURES
Figure 1. Dairy Farm Stations Map .............................................................................................. 73

1
CHAPTER ONE
INTRODUCTION AND GENERAL INFORMATION
Today, farm and ranch families make up less than two percent of the population in the
United States of America. The average American is at least three generations removed from the
farm, and these demographics have contributed to a disconnect of information between farmers
and consumers (“Our Food Link”, 2018). Consumer perceptions of agriculture have been studied
from several perspectives over the past 25 years, including consumers’ farm experience or a lack
thereof; animal well-being and ethical treatment of livestock (Weber, Hoban, Kendall & Bull,
1995); food nutrition and safety (Reed, 2015); and how new technologies may impact agriculture
(Weber, Hoban, Kendall & Bull, 1995; Clark & Ohkawa, 2005).
Barkema (1993) found that consumers showed concerns with how their food was raised
and the nutritional effects of consuming specific foods. In a 1995 study, consumers expressed
strong concerns that technology had numerous negative effects on agriculture. The researchers
postulated that these consumer concerns were the result of consumers being at least one
generation removed from having experience on farms and ranches (Weber, Hoban, Kendall &
Bull, 1995). This finding was echoed in a study of consumer perceptions regarding crop
production and pesticide usage which found that consumers with no prior farm experience
expressed both concerns about food safety and an overall lack of information regarding the
safety of production practices (Clark & Ohkawa, 2005).
Consumer perceptions may have negatively affected the dairy industry, especially dairy
producers (Ventura, 2015). Fluid milk consumption in the United States peaked in 1985 at 227
pounds per person and has been gradually decreasing over the years. The low in 2016 was
measured at being 154 pounds of fluid milk consumed per person (USDA Economic Research
Service, 2018). One of the largest challenges for the dairy industry is the divide between public
perceptions and industry practices, causing less public trust (von Keyserkingk, 2013). Wolf
(2016), studied over 2,500 American consumers and farmers and found that 63% of respondents
were concerned with dairy cattle welfare and perceived that dairy farmers had the largest impact
on dairy cow welfare.
While research has documented the challenges associated with public’s perception of the
dairy industry research has provided limited solutions for addressing the challenges. Yet, dairy
farm visits may offer an opportunity for educating consumers. Farm visits and agritourism
activities have become increasingly popular in recent years. A main goal of farmers choosing to
participate in farm visits is to properly educate the public about farming (Tew & Barbieri, 2012).
However, one self-led farm visit study surveyed consumers before and after touring a dairy farm,
and the results suggested that consumers still had concerns surrounding cow-calf separation and
access to the outdoors (Ventura, 2016).
College students are an interesting population to consider for dairy farm visits as they are
developing consumer habits that may continue throughout their lives. These consumer habits will
have a huge impact on our economy along with our food systems (Priporas, Stylos & Fotiadis,
2017). Today’s college students predominately represent Generation Z, individuals born since
the mid-1990’s. Generation Z is poised to become the largest generation of consumers by 2020,

2
and it is estimated that they will spend approximately $44 billion annually (Fromm, 2018).
Statement of the Problem
If college students reflect the consumer concerns that research has identified from
broader consumer studies, their levels of fluid milk consumption may continue to decline.
College students’ negative perceptions of dairy management may discourage consumption of
milk and dairy products, as shown in dairy consumption levels in recent years (USDA Economic
Research Service, 2018). Due to Generation Z’s spending power, this population and their
perceptions of the dairy industry were explored. Understanding the potential value of dairy farm
visits as a consumer education tool is important for influencing consumers.
Purpose and Objectives
The purpose of this descriptive correlational study was to analyze college students’ perceptions
of the dairy industry before and after visiting an operating dairy farm to see if their perceptions
changed, if at all. The objectives for the study are listed below:
1. Describe demographic characteristics and agricultural education background of farm
visit participants.
2. Compare participants’ perceptions of herd health prior to and after the farm visit.
3. Compare participants’ perceptions of dairy regulations prior to and after the farm
visit.
4. Compare participants’ perceptions of farm practices prior to and after the farm visit.
5. Evaluate participants’ satisfaction with the dairy farm visit.
Significance and Stakeholders
Due to the broad nature of this research, multiple parties benefit from this study about
Generation Z perceptions in the context of a dairy farm visit. This study was needed to help the
dairy industry better understand consumers’ concerns and demands. This study may encourage
consumers to understand dairy farming from the viewpoint of the famer, possibly obtain a
glimpse into their typical day. This farm visit may also be beneficial for students in agriculture to
understand consumer opinions. Agricultural educators may use the results of this study to
improve on-farm education for consumers in the future.
Limitations and Assumptions
The limitations of the study were:
The convenience sample approach was a limitation because results cannot be generalized
to all college students as the participants were not randomly selected. Another limitation
was the time of day and day of the week in which the study was carried out. Although
more students may have wanted to participate, their schedules may have prevented them
from doing so.
Farmers’ answers to participants’ questions may have been influenced by the farmers’
varied experiences and levels of expertise. This lack of standard, research-based answers
presented a limitation.
Participants and their dairy consumption levels prior to the farm visit were not measured
as part of this study which presents a limitation. It is unknown if the participants were

3
actual dairy consumers, and if so, it is unknown if their consumption levels are consistent
with typical consumers.
One final limitation was the opinions college students already had before participating in
the dairy farm visit as participants were recruited from a College of Agricultural Sciences
and Natural Resources course. However, the course was open to students of all majors
without regard to the students’ academic major. Again, as a convenience sample
approach, the results are limited to the participants studied.
In conducting this study, three assumptions were made:
It was assumed that the consumers provided accurate answers to the survey questions and
read the questions carefully.
Research participants were asked not to post to social media or take any photographs
during the farm visit. The consent form expressed this constraint as the dairy farm is a
research facility that may have visible, proprietary research. It was assumed that this
constraint influenced neither student satisfaction nor perception.
The farm’s physical condition (i.e., cleanliness) on the day the farm tour was conducted
may have influenced the participants’ perceptions. It was assumed that the farm’s
physical conditions were typical on the day the study was conducted.
Operational Definitions
The operational definitions for this study are listed below.
Agritourism: is the union of agriculture and tourism, and it is designed to attract visitors
to an agricultural enterprise (farm, ranch, or agricultural business) for education or
entertainment and create additional income for the agricultural enterprise (National
Agricultural Law Center, 2018).
Dairy farm visit for consumers: a form of agritourism that involves hosting a group of
consumers out to a dairy farm for an educational tour and opportunity to ask the dairy
farmers questions (Ventura, 2016).
College students: refers to any undergraduate or graduate student enrolled at the
University of Tennessee (UT), Knoxville, for the spring semester in 2018.
Farmers: refers to personnel of the UT Little River Animal and Environmental Unit, a
research facility of the University of Tennessee, assigned to dairy production and
management.
Farm stations: various regions around the dairy farm where different topics were covered
throughout the farm visit.
Developmental evaluation: refers to the concept of developing new approaches in real-
world situations. It is analogous to the concept of “research and development” in private
sector product development. Evaluators use this approach when developing an innovation
that addresses a complex problem or occurs in a complex environment (Better
Evaluation, 2018).

4
CHAPTER TWO
LITERATURE REVIEW
The literature review presented here used the following databases and resources,
available from the University of Tennessee Libraries:
Agricola database
Web of Science
Academic Search Complete
Agriculture Database (Web of Science)
Searches of these databases included the following search terms and phrases: “dairy production
and consumer perception”, “farm visits”, “consumer perception of agriculture”, “agricultural
public education”, “dairy farming”, and “dairy perception”. This chapter addresses the following:
consumer concerns, agritourism, consumer demographics, generational differences,
characteristics of Generation Z, and constructivism.
Consumer Concerns
According to Boogaard, the public’s concerns with where their food comes from have
been growing in recent years as people are becoming more and more removed from rural
communities and farming altogether. [People want healthy, safe, cheap food available to them
every day of the year but they are not pleased with new farming technologies that dairy farmers
use to make that happen for them.] After being asked select questions by researchers,
respondents were not sure how to feel, because economically, they want cheap food from their
own country, but sometimes it saves money to have food imported. This study also recognized
that those who grew up, have worked on, or lived near some sort of farm or rural community are
more open to new technologies regarding agriculture (Boogaard, 2011).
In a study of 500 consumers, Croney (2011) found that consumers have specific concerns
regarding the dairy industry. Specifically, consumers are worried about the sustainability and
environmental impacts of modern farm practices, animal welfare and food safety. Croney
postulated that addressing and understanding the frame of reference behind these ethical
concerns is important to the long-term success of the dairy industry. The study concluded on the
fact that as dairy industry practices continue to be ethically challenged, the need to further
understand these consumer concerns becomes even greater (2011).
In another consumer study, participants completed a questionnaire regarding what factors
influence their purchasing decisions when buying milk at the grocery store. Results indicated
many consumers would be willing to spend more if they were insured a higher animal welfare
quality. An interesting finding was the fact that consumers usually say slightly different answers
when they are being interviewed verses when they are voting on specific policy changes for the
government structure, like environmental regulations (de Graaf, 2016). Olynk (2013) studied
consumers using a special technology to simulate an actual grocery store experience. The results
showed a correlation between frequency of consumption and consumers’ belief that dairy
products “closer to the cow” are less processed so they worry about antibiotic use less as
compared to other food items (Olynk, 2013).

5
Weinrich, Kuhl, Zuhlsdorf & Spiller (2014) studied consumer perceptions of dairy cow
housing. They showed participants pictures of various dairy cow living arrangements and
recorded their opinions regarding barn and pasture systems. The public associated a negative
connotation to cows that live inside all year and a positive one to cows on pasture. Researchers
noticed a correlation existed between those who had experience with farming and positive
perceptions of dairy barn systems.
One study by Ventura (2015) chose to explore the differing knowledge and opinions
regarding the dairy industry among professionals and consumers. Half of the study covered dairy
industry professionals (including farmers and Extension agents) while the other half focused on
consumers. Respondents were interviewed about their opinions on cow welfare and their views
on problems. The study showed that there are welfare issues, like other agricultural industries,
but it suggests that the best option for improving the public’s opinions are on farm visits for
consumers wanting to learn about the dairy industry (Ventura, 2015).
Agritourism
Agritourism is defined as the union of agriculture and tourism, and it is designed to
attract visitors to an agricultural enterprise (farm, ranch, or agricultural business) for education or
entertainment and create additional income for the agricultural enterprise. Agritourism allows
farmers to market for their own farm and to facilitate a relationship with the public in their area.
It also ensures the success of farms and the ability for them to earn their living and expand their
businesses (National Agricultural Law Center, 2018).
In the United States, the first forms of agritourism can be dated back to the 1800s, when
city dwelling families wanted to escape the heat in the summer so they chose to go visit farms
out in the country. In the 1920’s, when cars were available to the public, farm visits became even
more possible to American families. During World War II and the Great Depression, families
began to seek out an escape to the countryside even more. The public became increasingly
interested in petting zoos, horseback riding and other forms of rural recreation in the 1960’s and
1970’s. Finally, in the 1980’s and 1990’s, farm bed and breakfasts, large farm tours and
vacations out to rural farms became increasingly popular for consumers. Since Americans are
sometimes four generations removed from farm life and that more people are disconnected from
where their food comes from, agritourism provides an avenue for consumers to establish this
important connection. Since 2000, there has been tremendous growth in the amount of
agritourism programs available across the country ("A Brief History of Agritourism,
Internationally and in the United States", 2013).
Internationally, farm visits and forms of agritourism called “farm stay holidays” were
developed in Europe, Australia, and New Zealand. In Italy around the 1950’s, many farms were
abandoned when farmers decided to leave and find work in larger cities, to better provide for
their families. An Italian law was passed in 1985 to offer incentives and rules on agritourism, to
try and make it more popular in the country. Now Italy is home to almost 20,000 farms that
participate in some level of agritourism. London developed WWOOF-ing (Working Weekends
on Organic Farms) was developed in 1971 to provide a way for people to escape to the British
countryside to get away from the large cities. Now WWOOF farms can be found in over 40
countries around the globe and are continuing to grow in popularity ("A Brief History of
6
Agritourism, Internationally and in the United States", 2013).
A potential drawback of agritourism could be landowner liability for the farmers or those
in charge of the agritourism activities. Compliance with agritourism statutes can negate these
legal risks. Agritourism is a growing industry since it can be an excellent way to educate the
public about specific farming industries and create additional revenue for farmers (National
Agricultural Law Center, 2018). A 2014 study sought to explore specifics behind agritourism
and additional revenues earned for the farmers and their families. Results indicated that the
profits were high for small farms where their focus was the farm. There was a positive revenue
improvement for hobby farms, but not drastic ones. For larger farms, the profits improved, but
not at a statistically significant level (Schilling, Attavanich & Jin, 2014).
A study based in the California Valley sought to explore sustainable community
involvement and production agriculture. The study described potential future success of
agritourism and if there were any aspects that could potentially make it more beneficial and
profitable for farmers. Researchers explored the areas of farm sustainability and potential
avenues in agritourism. The study concluded farmers should address both sustainable farming
and community-involved forms of agritourism. This is because consumers will be more willing
to support farms that are environmentally sustainable and those that offer various forms of
agritourism to the community (Brodt, Feenstra, Kozloff, Klonsky & Tourte, 2006). A Michigan
study used consumer focus groups to describe ways to strengthen agritourism for local farms and
ensure the success of them. Respondents suggested that web pages personal referrals to other
local agritourism farms were valuable for increasing visitation numbers. The research found that
to combat competition between different agritourism areas, farmers must begin to work with
each other to develop creative ideas to make all their farms a travel destination in the state (Che,
Veeck & Veeck, 2005).
A 2012 study sought to explore the benefits and differences in agritourism and various
other farm entrepreneurial ventures. Data from this study concluded that agritourism is highly
successful in creating jobs, additional profits for the farm, and conserving cultural heritage along
with the environment. Farmers exhibited a strong desire to continue the tradition of the farm and
the agritourism aspect, as well as pass the business along to the next generation. This study
confirmed that there are numerous benefits and very few pitfalls when it comes to adding a form
of agritourism to a family farm (Barbieri, 2013).
Consumer Demographics
Researchers have explored consumers’ demographic characteristics including income,
gender, education levels, and their relationship with purchasing involvement. Consumers with
the most purchasing power are usually women who have children, have high education levels
and moderate income levels. This confirms that demographics of consumers are directly related
to purchasing involvement and power, and it may be a useful explanation of consumer habits in
future research (Slama & Tashchian, 1985).
Researchers have studied consumer demographics specifically relating to organic
purchasing behaviors. A French study surveyed more than 54,000 adult consumers. Responses
indicated that those who chose to purchase organic food products had more education, were less
7
overweight, and followed a diet of more recommended fiber and calorie levels as compared to
those who did not choose organic products. The researchers also found that both male and female
organic consumers had higher education levels than non-organic consumers. Regarding income
levels, no significant differences were found between consumers who prefer organic and those
who prefer conventional food. Other research in various countries has confirmed that consumer’s
income levels do not influence organic purchasing behaviors, but rather education level seemed
to have the most impact (Kesse-Guyot et al., 2013).
A 2012 literature review explored factors that impact consumers buying behaviors, other
than age, gender, education level and income. This analysis found two main characteristics
impacting consumer buying habits. One of these avenues is overall health of the consumer, and
how it predicts their buying behaviors. Multiple studies showed that consumer health, weight and
daily exercise drastically influenced the types of decisions made by consumers. Those that were
overweight chose fewer fruits and vegetables than those who were not overweight. The other
characteristic that impacted consumer’s purchasing habits was their personal opinions of
environmental protection and sustainability of farms, making them more likely to purchase local
foods marked as “sustainable”. This literature review demonstrates the divergent factors
associated with consumers and their motivations for purchasing specific food items (Verain et
al., 2012).
Research has also examined consumers’ willingness to sacrifice taste for health benefits
available in certain foods. The findings showed that taste is the prevailing factor with the vast
majority of consumers. In fact, only a small group of consumers select less appealing foods for
the potential future health benefits (Verbeke, 2006).
Researchers have attempted to delineate the demographic information of consumers who
had a more difficult time making purchasing decisions when buying food products. The results
demonstrated that consumers that had the most difficult time choosing between brands, prices,
and other factors in a grocery store were female, older in age, and were less educated. This and
other studies of consumer demographics contribute to better understanding of consumers and
may contribute to the success of agriculture (Walsh & Mitchell, 2005).
Characteristics of Prior Generations
The focus of this study are the consumer perceptions of college students towards the
dairy industry. The evaluated (or subjects of program evaluation) for the study are dairy farm
visits, a form of agritourism. Demographers and researchers commonly refer to today’s college
students as part of Generation Z, and previous generations are referred to as Millennials,
Generation X, Baby Boomers, and Traditionalists. To understand Generation Z, the following
discussion provides an overview of the previous generations. Specifically, information that
defines the generations and describes what is known about their consumer perceptions and
behaviors is delineated. This discussion is followed by a description of Generation Z which
compares and contrasts Generation Z to previous generations with an emphasis on consumer
perceptions and behaviors.

8
Millennials
Millennials are those individuals born from 1982-1994. This population is known for
being excellent multi-taskers, technologically savvy, unafraid to seek advice, creative problem
solvers, socially conscious, and highly selective when making buying decisions (Wmfc, 2018). It
is known that this generation compares price when shopping, but these consumers are likely to
pay more for a brand that they judge to be socially responsible (“Personality Traits of
Millennials: How to Market this Generation; Morris Creative Group”, 2018). Millennials would
rather spend money on experiences than tangible goods. Millennial women have vast purchasing
power as compared to previous generations (“15 Consumer Behaviors Setting 5 Generations
Apart; Precision Dialogue", 2018).
Generation X
Generation X is composed of individuals born between 1965 and 1981. This generation
values higher education, preserving the planet, independence, and work-life balance. This
generation, can be suspicious of Baby Boomer values. Generation X think ethically, have a
strong sense of entitlement, and are unimpressed and skeptical of authority (Wmfc, 2018). When
making decisions, they have an expressed interest in having all the facts presented to them. They
also have a high degree of brand loyalty. Generation X enjoys being loyal to specific brands and
will take part in reward programs to try to save money. In fact, most will not purchase until they
have read more about it. This generation wants to learn what to expect and why a specific
product would benefit them (“15 Consumer Behaviors Setting 5 Generations Apart; Precision
Dialogue", 2018).
Baby Boomers
The Baby Boomer generation was born between 1946 and 1964. Some characteristics
include: optimism; a strong belief in equal opportunities; a tendency to question everything; a
tendency to trust members of their generation rather than the younger generations; and a
tendency to have good communication skills. From a consumer standpoint, this generation likes
to be aware of the options available to them, and they appreciate choices and flexibility. They
prefer direct, in person communication (Wmfc, 2018). Baby Boomers tend to be more
individualistic as opposed to other generations that may be more influenced by peer decisions.
Baby Boomers are believed to be more practical and pragmatic shoppers than other generations.
It is believed that this generation has been saving substantial financial resources, and that they
will have tremendous buying power through 2028 (“15 Consumer Behaviors Setting 5
Generations Apart; Precision Dialogue", 2018).
Traditionalists
Traditionalists were born prior to 1945 and are now making up a smaller portion of the
consumer population. Today, they are 73 years of age or older. Due to their experience in wars in
their lifetime and the Great Depression, they are thrifty and enjoy saving money. Traditionalists
value hard work and loyalty in a major way. However, they do not conform to change or
ambiguity well (Wmfc, 2018). This generation wants authenticity and transparency in their
buying options as consumers. Traditionalists have more time available to spend with family and
grandchildren, so they keep their loved ones in mind when shopping (“15 Consumer Behaviors
Setting 5 Generations Apart; Precision Dialogue", 2018).

9
Characteristics of Generation Z
“Generation Z” encompasses those born from 1995 to 2012, and the majority of this
generation are now on the cusp of adult life. Market analysts are defining them as “the next big
retail disrupter” due to their anticipated amount of spending power. This generation is described
as full of hard workers, slightly anxious, and mindful of the future and their impact on our world.
Generation Z is also more ethnically diverse than the preceding generations and cultural issues
are perceived differently by them, by having a more open-minded approach. Some researchers
also note the highly protective upbringing of this generation, as many of their parents were
overly cautious and focused on safety when raising their children. Overall, they tend to focus on
sensible job and career options, enjoy leading private lives and tend to be cautious (Williams,
2018).
Members of Generation Z are comfortable with technology, as they have grown up using
it- therefore they are constantly subjected to an informational overload (Williams, 2018). This
generation to be made up of “digital natives”, especially as compared to previous generations
and it is anticipated that this will carry over into their consumer behaviors in the coming years
(Hradiska, 2013). In a 2016 study, researchers discussed how Generation Z are a different
category of learners inside and outside of the classroom. This generation is very technologically
savvy and are self-motivated. Regular, lecture-type classes may not be as engaging and exciting
for Gen Z, therefore new research like the present study, needs to be conducted to better
understand this generation. Facilitating a dynamic, exciting learning environment, educators can
begin to take the steps to encourage this generation in the learning process and be more engaged
in an educational setting (Shatto & Erwin, 2016).
A recent study sought to better understand the technological marketing impacts and how
they influence Generation Z and their purchasing decisions. The researcher noted that this
generation is already behaving differently than past generations, since they are more focused on
innovation. The study confirmed that technology has a strong impact on Generation Z
consumers. It also solidified the fact that this generation majorly depends on technology to make
informed consumer decisions. Therefore, Generation Z desires a more technology-based retail
experience, to make their shopping experience simpler and more informed. This smart retailing
approach is an important marketing tool since Generation Z is going to hold much of the buying
power in the years to come (Priporas, Stylos & Fotiadis, 2017). Another 2017 study focused on
marketing and how Generation Z are influenced by social media and their peer’s decisions.
Social media is the single most influential marketing tool for Generation Z (Silva, Machado &
Cruz, 2017).
One study sought to explore the generational and gender differences regarding consumer
buying habits and the wasteful nature of them. The survey design demonstrated that regardless of
generation, women are better at keeping consumption levels reasonable and sustainable.
However, results also showed that Generation Z excelled in reducing unneeded consumption of
food and other consumer products, suggesting that they are more mindful consumers than
previous generations (Bulut, Kökalan Çımrin & Doğan, 2017).
In summary, Generation Z has been shown to have several different consumer
characteristics than previous generations, including their affinity for technology. This generation

10
will have substantial consumer buying power. Yet, very few studies show the consumer
perceptions of Generation Z and how the agricultural industry might consider these perceptions
for success.
Constructivism
Due to the complex nature of Generation Z students, there is much to consider when
thinking of the most efficient ways to go about educating this specific generation. It is known
that critical thinking and teamwork will be integral to their workplace success. One 2015 study
focused on constructivism in the classroom. This study showed that cooperative learning (group
work) greatly benefits on students and the development of their own ideas and conclusions. (Igel
& Urquhart, 2012).
The definition of constructivism is when students in a learning environment are given
deep understanding of a specific topic and their ideas cognitively develop to come up with their
own constructions of learner reorganization. This is a highly complex and nonlinear learning
process, vastly different than other learning styles. A major difference between constructivism
and other learning styles is that it is not the result of development, learning is in fact, the
development of the students’ thoughts and ideas. Teachers need to allow learners time to develop
their own questions and theories, to help them reach their own answers. These open-ended
questions and learning techniques welcome student errors or mistakes because they are stepping
stones in the constructivist journey. Students often learn well in a constructivist setting where
they are interacting with their surroundings (Fosnot, 2005).
One study sought to understand graduate student cooperative learning and constructivism
in a classroom setting and measured the students’ opinions of it afterwards. Their general
thoughts were that social interaction is necessary in the constructivist learning environment
because it helps students to think through ideas logically and work out problems verbally.
Cognitive development happens through understanding new topics and problem solving as a
group. Lastly, the students determined that without social interaction, the constructivist learning
would have been far less successful (Nyikos & Hashimoto, 1997).
In one study in 2006 at UC Davis, faculty and students developed a constructivist
approach to a class curriculum for an agricultural class at the university. This learning style when
tested proved to show great success due to the diverse nature of the material presented to the
students. In various forms of learning environments, the student interest and retention levels
clearly increased, showing that constructivist, outside-the-box thinking was highly successful in
learning the new information (Parr & Van Horn, 2006).
In a study researching agricultural literacy and constructivist approach, researchers
sought to explore ways to improve agricultural literacy throughout the general population of the
United States. The model developed challenged the usual standardized testing approach, because
more promising results were found in a constructivist, student communicative environment for
learning. The researchers also proposed that as school systems grow and evolve, it is important
for testing to do the same. Multiple teaching techniques are encouraged when teaching
agricultural literacy in a classroom setting, due to the complex nature combined with lots of ideas
open to interpretation by students. Working through the problems on their own along with

11
classmates helps students to better understand the content and empowers them to discuss it
comfortably (Powell & Trexler, 2008).
Literature Review Summary
In the United States, less than two percent of the population is made up of farm and ranch
families, and consumers are now up to three generations removed from farming- leading to a
huge disconnect between the public and agriculture (“Our Food Link”, 2018). Research has
shown that consumers have varied concerns about dairy farming, including health (antibiotic
use), farm management practices (housing) and regulations (on animal welfare and milk quality)
(Croney, 2011). Additionally, consumers have voiced their concerns about food safety and the
processing of dairy products (Olynk, 2013). In the last 30 years, agritourism has been growing in
popularity, because consumers are interested in how their food is raised. The benefits for the
farmers are noticeable too, such as additional income for the farm and creating a relationship
with the public in their community (Barbieri, 2013). Consumers are now more health conscience
than before and it has been shown that their personal health impacts the decisions they make
when shopping at the grocery store (Verain et al., 2012). Broadly speaking, each generation
brings a new set of demands as a population of consumers. This study chose to focus on
Generation Z, because they are just now entering adulthood and this technology-driven group is
going to be have a lot of buying power in the coming years (Williams, 2018). Generation Z is
made up of a different kind of learners, they enjoy an engaging educational setting that is not a
typical lecture-type classroom (Shatto & Erwin, 2016). A constructivist approach can be
considered when thinking of Generation Z consumers, because it is said to be the most exciting
and interesting one, where students can learn from their surroundings and arrive to their own
conclusions (Fosnot, 2005).

12
CHAPTER THREE
MATERIALS AND METHODS
The materials and methods for this study are included in this chapter. It is organized into
eight sections: purpose of the study, population, study design, variables, instrumentation, data
collection, and data analysis of student participants’ perceptions of the dairy industry. This study
was approved by the University of Tennessee Institutional Review Board (see Appendix F).
Purpose of the Study
The purpose of this study was to analyze college students’ perceptions of the dairy industry
before and after visiting an operating dairy farm to see if their perceptions changed, if at all. The
objectives for the study are listed below:
1. Describe demographic characteristics and agricultural education background of farm
visit participants.
2. Compare participants’ perceptions of herd health prior to and after the farm visit.
3. Compare participants’ perceptions of dairy regulations prior to and after the farm
visit.
4. Compare participants’ perceptions of farm practices prior to and after the farm visit.
5. Evaluate participants’ satisfaction with the dairy farm visit.
Study Design
The research design for this study was descriptive-correlational. A preexperimental
design, the one-group protest-posttest design, was utilized (Campbell & Stanley, 1963). This
research design is represented by:
O1___X___O2
Where: O1___=___consumer pretest (observation one)
X___=___dairy farm visit for consumers (treatment)
O2___=___consumer posttest (observation two)
Participants that chose to partake in this project completed the study instrument before
and after participating in a dairy farm visit for consumers. This dairy farm visit included a tour,
miniature lecture, and an opportunity to ask questions of dairy farmers. The study design
represented a developmental evaluation approach whereby data was collected on how the
program performs in complicated situations (Patton, 2006). In the study described here, tools
were developed to facilitate and measure the results of a farm visit. Specifically, these tools
were: pretest, posttest, farm visit talking points script, and farm visit mini-lecture. The pretest
occurred before the farm visit and the posttest occurred after the farm visit. The other tools were
used while the farm visit was in progress, not necessarily in lock-step, representing a
developmental evaluation approach. In many ways, non-formal education, such as the farm visit
conducted for this study, represents a complicated environment to study.
Population
The population for this study were college students aged 18 and older. A convenience
sampling approach, which is a non-probability sampling method, was used for this study. Since
the research was conducted at the University of Tennessee dairy farm, the research participants

13
were recruited from the University of Tennessee. Participants were recruited by partnering with
the Food Science Department and the professor in charge of the History of Food course in Spring
2018. The researcher used two screening questions in recruiting research participants: the
researcher asked potential participants if they were 18 years of age or older and if they could
walk comfortably on level ground for approximately two hours. Research participants who
answered the two screening questions in the affirmative were presented with an informed
consent form. Only participants who signed the consent form could participate in this research
study.
Participants were invited to be bussed to the UT dairy farm, complete a pretest, tour the
farm, speak with farmers and employees for approximately 90 minutes and finish with a posttest
and breakfast for the group. All participants signed a consent agreement prior to touring the
farm.
Instrumentation
Questionnaire
The researcher developed a questionnaire to administer as a pretest (see Appendix B) and
a posttest (see Appendix C). The questionnaire creation was informed by the literature review, to
specifically address the research questions. Questions for this study were reviewed by a panel of
three experts in both Animal Science (one expert) and Agricultural Leadership, Education, and
Communications (two experts) to establish instrument validity. Minor phrasing and wording
alterations were made to the pre/posttest versions prior to the pilot test in a classroom. Questions
were also reviewed by management at the University of Tennessee Little River Animal and
Environmental Unit.
The participants completed the two surveys; the pretest before the farm tour and the
posttest after the farm tour. The only difference between the pretest and posttest is the fact that
the pretest asked participants’ demographic information and agriculture experience while the
posttest inquired about dairy visit satisfaction. This pretest was designed to measure their initial
thoughts of the dairy industry as well as collect their personal demographic information. Items
focused on agreement or disagreement with dairy industry topics. This allowed for comparison
measures to determine to what extent, if any, that participants’ opinions changed from having the
tour and getting to talk to the farmers about their concerns. The survey questions were modeled
after Talbert’s (1995, 1996 & 1997) survey question style about high schoolers’ opinions about
agriculture. A sample pretest and posttest question was: A cow’s udder is cleaned prior to
milking. A: Strongly Disagree. B: Disagree. C: Neutral. D: Agree. E: Strongly Agree. Questions
were positively and negatively worded to reduce bias, for example the use of only positive
questions may have produced only positive responses (Colton & Covert, 2007).
Pilot Test and Pilot Test Analyses
For the pilot test, a History of Food fall 2017 course was used and 47 participants
completed the survey. During the pilot testing, participants did not express confusion with the
phrasing of the questions, and the instrument delivered a high level of reliability.
Typically, for testing reliability with nominal data, a test/retest technique is used.
However, for this study the budget and time involved prevented test/retest. Reliability for the

14
Likert-type scales was calculated using Cronbach’s Alpha and can be found in Table 1.
Reliability for different sections of the survey ranged from r=.881 to r=.884 with an overall
reliability of r=.886 indicating high reliability per conventions by Davis (1971).
Principal components analysis was used to identify and compute any potential factors.
This analysis used pairwise deletion (statistical technique that deletes or removes one answer that
is blank, rather than the whole case from the study) with varimax rotation (to simplify the
expression in terms of just a few items). Ideally, there would have been one factor from each of
the three main sections (Herd Health, Dairy Regulations, and Farm Practices) with a high level
of variance. The initial Eigenvalues showed that the first factor explained 34% of the variance.
Subsequent factors were more challenging to delineate than the initial factor. However, all items
had a correlation of 0.4 or above with all other items. (See the correlation matrix for all 25 items
in Table 8.) The pilot test sample of 47 did not meet the minimum suggested sample of 100 for
principal components analysis (Gorsuch, 1993; Kline, 1979; MacCallum, Widaman, Zhang &
Hong, 1999). As a developmental evaluation, the study reported here was not aimed at creating
an instrument with measured scales. Therefore, the principal components analysis did not inform
the questionnaire administration nor the data analyses, but the correlation data did indicate a
quality instrument that was measuring similar constructs relative to dairy farms, reinforcing a
high level of reliability.
After the pilot test, no items were eliminated from the instrument. However, one question
was divided into three to simplify it. This question was originally stated as “Growing up, did you
participate in 4-H, FFA or any school-related agriculture-related programs?”. The item was
separated into three questions on question numbers 6-9 on the pretest.
Farm Visit
To prepare for the farm visit, a talking points script (Appendix A) was provided to the
farmers to ensure that all topics were covered when talking to the participants and to limit the
likelihood of different farmers providing contradictory information. The participants had an
hour-long guided tour of the dairy farm led by two of the farmers and an additional 30 minutes
after the tour to ask any other questions to the employees and farmers.
Dairy Farming Presentation
The initial plan for the day of the dairy farm visit was for the participants to watch and
listen to the PowerPoint presentation about the dairy industry in general, before beginning the
walking portion of the farm tour. This presentation was also going to be presented and discussed
by one of the farmers that oversaw helping to guide the walking tour of the farm. The day of the
Table 1. Reliability Coefficients (N=47)
Section Number of Items Cronbach’s Alpha: Pilot Test
Herd Health 8 .884
Dairy Regulations 8 .881
Farm Practices 9 .882
Overall 25 .886

15
actual dairy farm visit, the morning milking was almost complete when the participants arrived
out to the farm, so the group began there, to give the participants the opportunity to see the
milking parlor in action while cows were being milked. Since this was a major part of the pretest
and posttest questions, it seemed very important for the participants to witness the milking parlor
experience. Unfortunately, this meant that the presentation about the dairy industry had to be
moved to the end of the schedule, after the walking tour portion was completed. For future farm
visits and studies, it would be best to still allow for additional time to give the presentation by
one of the farmers prior to the tour of the dairy farm. This would get some of the basic, initial
questions out of the way and allow participants to begin brainstorming their own questions to ask
on the tour. Another aspect that goes along with this is excellent communication and
coordination with the dairy farm, ensuring that there will be enough time to do the presentation
and still see some dairy cows in the parlor.
Data Collection
Initially to recruit participants, the researcher went to the History of Food Spring 2018
course to talk about the dairy farm visit and see which students had interest in touring the farm.
Recruitment materials were distributed to students, which consisted of the Consent Form
(Appendix D) and Cover Letter (Appendix E).
Transportation was provided to and from UT campus in Knoxville, Tennessee to the UT
Little River Animal and Environmental Unit in Walland, Tennessee at no charge to the
participants (approximately 40 miles round trip). On the day of the study, every participant
signed two copies of the consent form, one that was kept and saved by the researcher and another
for the participant to keep. Right after signing the consent forms the participants completed the
pretest, prior to touring the dairy farm. The farm tour took place in one group of all eight
participants at the same time and they moved from station to station as planned. To finish up the
dairy farm tour, one of the farmers presented a mini-lecture using an on-screen presentation
covering the broad ideas surrounding the dairy industry (Appendix G). After the dairy farm tour,
the participants completed the posttest to measure to what extent if at all their perceptions of the
dairy industry had changed. All the pretests and posttests were gathered and compiled in SPSS
software for analysis.
Data Analysis
The survey data was inputted into IBM SPSS Statistics software for analysis (IBM Corp.,
2017). Dependent variables in this study were to what extent consumer’s opinions about the
dairy industry changed after participating in the farm visit. The independent variables would be
gender, race/ethnicity, current dairy consumption levels and buying behaviors. The topic areas
were prior farm experience/knowledge, herd health, dairy regulations, farm practices, and farm
visit satisfaction. The dependent variables were their attitudes towards the dairy industry.
Primarily, descriptive statistics were used, specifically, mean, mode, and percentage for
the demographic questions. Data was analyzed using dependent t-tests to compare participants’
perceptions from their pretest responses to their posttest responses. For the t-tests, a significance
level of .05 was set a priori. For all t-tests, list wise deletion was used whereby a respondent who
did not provide both a pretest and posttest response was excluded from the t-tests rather than
from the entire study. In all cases, two-tailed tests were employed to test statistical significance
16
of possible increases or decreases in agreement level.
Sample Size
Unfortunately, this study yielded a low participant size for the actual farm visit study.
The researcher was hoping to get approximately 30 participants to be able to participate, but only
8 could attend on the day of. Several factors may explain the reasoning behind this fact. First off,
there was no true financial or other incentive that was possible to offer the participants, so
undoubtedly, very few even showed a peaked interest in the dairy farm visit. The time of day of
the study (7:30 AM- 10 AM) also may have been a factor in their decision-making process, as
many undergraduates have morning classes. Since this study was seeking to test the instrument
and how it handled a difficult environment, the conclusions found in this study can be carried
over to future farm visit research and expanded upon with a larger sample size. It should be
known that broad conclusions cannot be generalized to all college students at the University of
Tennessee.

17
CHAPTER FOUR
RESULTS
The results for this study are presented in this chapter. It is organized into eight sections:
purpose of the study, demographic characteristics of the farm visit participants, comparing
participants’ pre/posttest responses: herd health, comparing participants’ pre/posttest responses:
dairy regulations, comparing participants’ pre/posttest responses: farm practices, evaluating
participants’ satisfaction levels with the farm visit, and a summary of key findings.
Purpose of the Study
The purpose of this study was to analyze college students’ perceptions of the dairy industry
before and after visiting an operating dairy farm to see if their perceptions changed, if at all. The
objectives for the study are listed below:
1. Describe demographic characteristics and agricultural education background of farm
visit participants.
2. Compare participants’ perceptions of herd health prior to and after the farm visit.
3. Compare participants’ perceptions of dairy regulations prior to and after the farm
visit.
4. Compare participants’ perceptions of farm practices prior to and after the farm visit.
5. Evaluate participants’ satisfaction with the dairy farm visit.

18
Demographic Characteristics of Farm Visit Participants
Of the 8 participants in this study, 37.5% were 19 years old, 25% were 21 years old, 25%
were 22 and 12.5% were 23 years or older. Much of the participants grew up in a residence that
was not on a farm (87.5%) with only one participant having had a farm as a childhood residence
(this does not count as childhood farm exposure or experience- only where they grew up). There
were slightly more female participants (62.5%) than male participants in this study (Table 2).
Characteristic N %
Childhood Residence
Farm 1 12.5
Non-farm 7 87.5
Gender
Male 3 37.5
Female 5 62.5
Prefer not to say 0 0.0
Age
19 3 37.5
20 0 0.0
21 2 25
22 2 25
23 older 1 12.5
Table 2. Demographic Profile of Participants

19
Agricultural Education Background of Participants
Of the participants in this study, 62.5% had previously been to a working dairy farm. The
participants were equally represented regarding college majors. One-half of the group (50%)
were in an agriculture-related program while the remainder were not in an agriculture-related
major (50%). Three-fourths of the participants (75%) had not been involved in either 4-H or FFA
earlier in life, while 62.5% had not been involved in any school-related agriculture-related
program (Table 3).
Experience N %
Been to a working dairy farm
Yes 5 62.5
No 3 37.5
In an agriculture-related college program
Yes 4 50.0
No 4 50.0
4-H involvement
Yes 2 25.0
No 6 75.0
FFA involvement
Yes 2 25.0
No 6 75.0
School-related agriculture-related program involvement
Yes 3 37.5
No 5 62.5
Table 3: Dairy and Agricultural Exposure of Participants (N=8)

20
Comparing Participants’ Pre/Posttest Responses: Herd Health
Participants’ herd health perceptions were measured using a 5-point scale where: 1=
Strongly Disagree, 2= Disagree, 3= Neutral, 4= Agree, and 5= Strongly Agree. To test for
differences, if any, among participants’ regarding their perception of dairy herd health before and
after the dairy farm tour, paired sample t-tests were performed. For the eight herd health items,
five were found to be statistically significant as follows:
For the item, Dairy farms offer enrichment (such as cow scratchers) and other aspects to
have a high level of animal welfare, the results showed an increase in the student’s agreement
from pretest (M = 3.38, SD = .92) to posttest scores (M =4.5, SD = .53, t = -3.81, p .05).
For the item, Dairy farmers ask for help from nutritionists to make sure the cows are eating
quality diets, the results showed an increase in the students’ agreement from posttest scores
(M = 4.63, SD = .52) as compared to the pretest (M = 3.88, SD = .991, t= -2.393, p .05).
The item, Dairy cows are always pregnant and never given a break from milking, has reverse
polarity, whereby a decreased posttest mean indicates increased positive perceptions of the
dairy industry. From the pretest (M = 2.38, SD = .92) to the posttest (M = 1.63, SD = .52, t =
2.049, p .01), respondents’ agreement decreased.
For the item, Dairy cows are only given antibiotics when they are ill and in need of them, the
responses from the pretest (M = 3.0, SD = .93) to posttest (M = 4.38, SD = .52, t = -4.245, p
.05) indicating that respondents’ perceptions changed from neutral to agreement.
Finally, the item, Dairy cows are uncomfortable because they stand for most their days,
showed statistically significant differences from pretest to posttest. This item has reverse
polarity, meaning that a disagreement answer is the positive response. From the pretest (M =
2.38, SD = .92) to the posttest (M = 1.5, SD = .53, t = 2.497, p .05), indicating that
agreement decreased.
When comparing pretest and posttest means for the other herd health items, none were found to
have statistically significant differences as shown in Table 4. The mean score for hoof trimming
decreased from pretest (4.13) to posttest (3.75) indicating some neutrality regarding perceptions.
The mean score for overall health only slightly increased from pretest (1.25) to posttest (1.63) for
this negatively worded item suggesting (a) that participants perceive that dairy farmers do care
about the overall health of their cows, and (b) the dairy farm visit had no effect on this
perception. Regarding the negatively worded item, cows constantly being genetically altered, the
pretest (2.38) and the posttest (2.38) means were identical. This indicates that (a) participants
perceive that dairy cows are not constantly being genetically altered, and (b) the dairy farm visit
did not change their perception of this.

21
Variable Mean SD t p
1. Dairy farmers schedule annual hoof trimmings to help
prevent cows from becoming lame and being in pain.
-.38 .74 1.426 .197
Pretest 4.13 .35
Posttest 3.75 .89
2. Dairy farmers do not care about the overall health of
their cows.
-.38 1.51 -.704 .504
Pretest 1.25 .46
Posttest 1.63 1.41
3. Dairy cows are constantly being genetically altered. 0 1.07 .000 1.00
Pretest 2.38 .52
Posttest 2.38 .92
4. Dairy farms offer enrichment (such as cow scratchers)
and other aspects to have a high level of animal welfare.
-1.13 .84 -3.813 .007*
Pretest 3.38 .92
Posttest 4.5 .54
5. Dairy farmers ask for help from nutritionists to make
sure the cows are eating quality diets.
-.75 .89 -2.393 .048*
Pretest 3.88 .99
Posttest 4.63 .52
6. Dairy cows are always pregnant and never given a
break from milking.
.75 1.04 2.049 .080**
Pretest 2.38 .92
Posttest 1.63 .52
7. Dairy cows are only given antibiotics when they are ill
and in need of them.
-1.38 .92 -4.245 .004*
Pretest 3.0 .93
Posttest 4.38 .52
8. Dairy cows are uncomfortable because they stand for
most their days.
.88 .99 2.497 .041*
Pretest 2.38 .92
Posttest 1.5 .54
* p .05; ** p .01; *** p .001 a Respondents used the following scale to answer these questions: 1= Strongly Disagree,
2=Disagree, 3=Neutral, 4=Agree, 5=Strongly Agree
Items marked with this have reverse polarity, whereby disagreement is the positive response
Table 4. Herd Health (N=8)

22
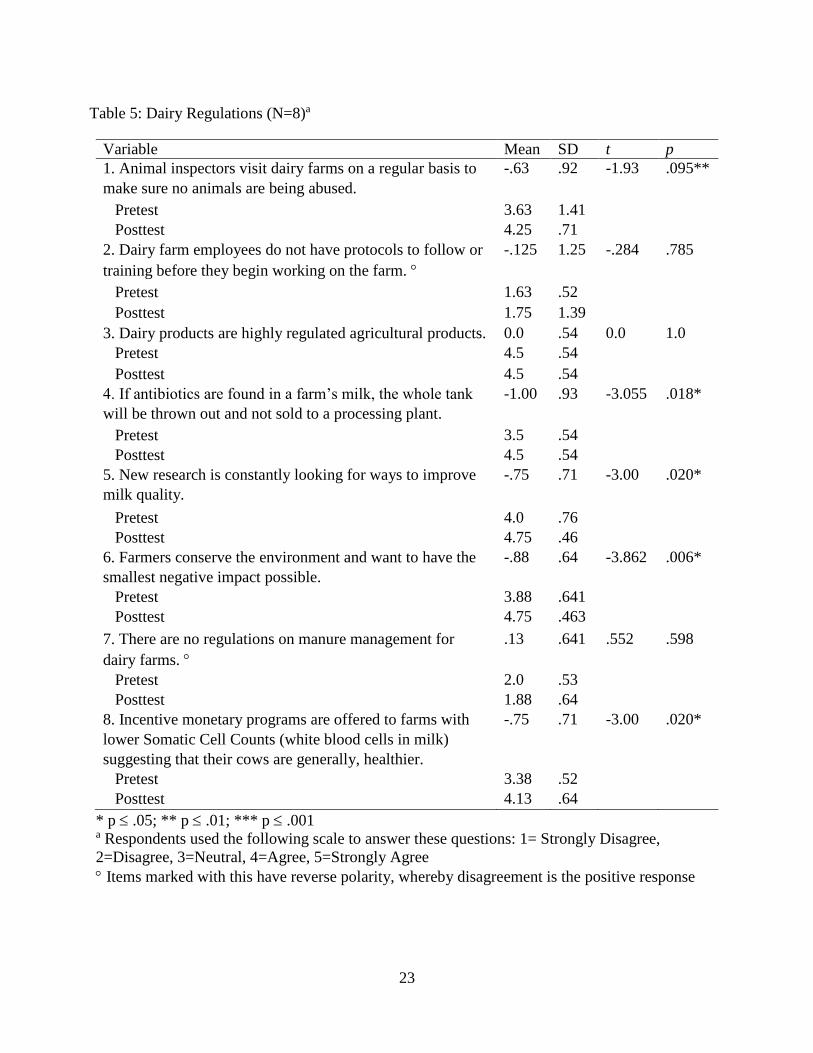
Comparing Participants’ Pre/Post Responses: Dairy Regulations
Participants provided their perceptions on dairy regulations in respect to the dairy farm
visit and a 5-point scale was used to do so. The scale is 1= Strongly Disagree, 2= Disagree, 3=
Neutral, 4= Agree, and 5= Strongly Agree. To test for differences, if any, among participants’
regarding their perception of dairy regulations prior to and after the dairy farm tour, paired
sample t-tests were performed. For the eight dairy regulation items, five were found to be
statistically significant.
For the item, Animal inspectors visit dairy farms on a regular basis to make sure no
animals are being abused, the results showed an increase in the student’s agreement from
pretest (M = 3.63, SD = 1.41) to posttest scores (M = 4.25, SD = .71, t = -.284, p .01).
On another item, If antibiotics are found in a farm’s milk, the whole tank will be thrown
out and not sold to a processing plant, responses demonstrated an increase from pretest
(M = 3.5, SD = .54) to the posttest responses (M = 4.5, SD = .54, t = -3.055, p .05).
For the item, New research is constantly looking for ways to improve milk quality, the
numbers showed a slight increase from the pretest (M= 4.0, SD= .76) to the posttest (M =
4.75, SD = .46, t = -3.0, p .05) in participants’ responses.
With the item, Farmers conserve the environment and want to have the smallest negative
impact possible, the participants’ responses from the pretest (M = 3.88, SD = .64) to the
posttest (M = 4.75, SD = .46, t = -3.862, p .05) increased.
Lastly, on the item, Incentive monetary programs are offered to dairy farms with lower
Somatic Cell Counts (white blood cells in milk) suggesting that their cows are generally,
healthier, participants’ responses from the pretest (M = 3.38, SD = .52) to the posttest (M
= 4.13, SD = .64, t = -3.0, p .05) increased.
Results for all tests of the dairy regulations items are shown in Table 5. The mean score for
employee protocols increased from pretest (1.63) to posttest (1.75), indicating some
disagreement regarding participants’ perceptions. The mean score for strict regulations on dairy
products there was no change in the data from the pretest (4.5) to posttest (4.5) for this item
suggesting (a) that participants perceive that dairy products are highly regulated, and (b) the
dairy farm visit had no effect on this specific perception. Regarding the negatively worded item,
there are no regulations on manure management for dairy farms, the pretest (2.0) and the posttest
(1.88) means changed, suggesting a stronger level of disagreement than before. This indicates
that participants appear to feel confident in the regulations that are in place for dairy farms.
23
Variable Mean SD t p
1. Animal inspectors visit dairy farms on a regular basis to
make sure no animals are being abused.
-.63 .92 -1.93 .095**
Pretest 3.63 1.41
Posttest 4.25 .71
2. Dairy farm employees do not have protocols to follow or
training before they begin working on the farm.
-.125 1.25 -.284 .785
Pretest 1.63 .52
Posttest 1.75 1.39
3. Dairy products are highly regulated agricultural products. 0.0 .54 0.0 1.0
Pretest 4.5 .54
Posttest 4.5 .54
4. If antibiotics are found in a farm’s milk, the whole tank
will be thrown out and not sold to a processing plant.
-1.00 .93 -3.055 .018*
Pretest 3.5 .54
Posttest 4.5 .54
5. New research is constantly looking for ways to improve
milk quality.
-.75 .71 -3.00 .020*
Pretest 4.0 .76
Posttest 4.75 .46
6. Farmers conserve the environment and want to have the
smallest negative impact possible.
-.88 .64 -3.862 .006*
Pretest 3.88 .641
Posttest 4.75 .463
7. There are no regulations on manure management for
dairy farms.
.13 .641 .552 .598
Pretest 2.0 .53
Posttest 1.88 .64
8. Incentive monetary programs are offered to farms with
lower Somatic Cell Counts (white blood cells in milk)
suggesting that their cows are generally, healthier.
-.75 .71 -3.00 .020*
Pretest 3.38 .52
Posttest 4.13 .64
* p .05; ** p .01; *** p .001 a Respondents used the following scale to answer these questions: 1= Strongly Disagree,
2=Disagree, 3=Neutral, 4=Agree, 5=Strongly Agree
Items marked with this have reverse polarity, whereby disagreement is the positive response
Table 5: Dairy Regulations (N=8)a

24
Comparing Participants’ Pre/Post Responses: Farm Practices
Participants’ perceptions were measured on farm practices using a 5-point scale where 1=
Strongly Disagree, 2= Disagree, 3= Neutral, 4= Agree, and 5= Strongly Agree. Out of the nine
questions in part three, seven were statistically significant.
For the item, Only female dairy calves are useful on the farm, the item had reverse
polarity whereby disagreement was the positive response. From the pretest (M = 2.63,
S.D. = .71) to the posttest (M = 4.38, S.D. = .52, t = -7.0, p < .00) the participants
strengthened their agreement that male and female dairy calves do not have the same
value on the farm.
For the item, Dairy calves are removed from their mothers, thus receiving poor nutrition,
the question had reverse polarity, meaning that disagreement was the positive response.
From the pretest (M = 2.13, SD = .35) to the posttest (M = 1.5, SD = .54, t = 2.38, p
.05) the participants gave stronger disagreement responses.
On the item, Dairy barns are cleaned at least once a day while the bedding is cleaned 2
to 3 times each day, there was increased agreement from the pretest (M = 3.75, SD = .46)
to the posttest (M = 4.5, SD = .54, t = -4.583, p .05).
On the item, Dairy farmers want to keep things as clean as possible to limit the spread of
disease and provide high quality milk, the participants indicated higher agreement level
from pretest (M = 4.5, SD = .54) to posttest (M = 4.88, SD = .36, t = -2.049, p .01).
For the item, Because milking parlors are dirty, bacteria will get into the milk, the
question had reverse polarity, meaning that a disagreement response is the positive
response. Agreement decreased from pretest (M = 2.88, SD = .84) to posttest (M = 2.0,
SD = 1.07, t = 3.862, p .05).
On the item, Milking employees follow sanitizing protocols like: wearing new gloves for
each shift and disinfecting the cow’s udders, there was an increase in responses from
pretest (M = 4.38, SD = .52) to posttest (M = 4.88, SD = .36, t = -2.646, p .05).
Lastly, on the item, Newborn dairy calves are fed colostrum to help jump start their
immune systems, agreement increased (M = 3.88, SD = .84) to posttest (M = 4.5, SD =
.54, t = -2.38, p .05).
The other three questions in this section were not found to be statistically significant and are
listed in Table 6. The mean score for raw milk vs. pasteurized milk was identical from the pretest
(2.63) to posttest (2.63), which suggests that (a) participants disagree about this idea of milk and
(b) the dairy farm visit had no effect on this specific perception. Regarding the negatively
worded item, dairy cows live in their own waste on a constant basis, the pretest (2.13) and the
posttest (2.38) means were slightly increased. This indicates that (a) participants perceive that
dairy cows are not living in their own waste constantly and (b) the dairy farm visit did in fact
change their perception of these topics.

25
* p .05; ** p .01; *** p .001 a Respondents used the following scale to answer these questions: 1= Strongly Disagree,
2=Disagree, 3=Neutral, 4=Agree, 5=Strongly Agree
Items marked with this have reverse polarity, whereby disagreement is the positive response.
Table 6: Farm Practices (N=8)a
Variable Mean SD t p
1. Raw milk is healthier than pasteurized milk. 2.63 .93 .00 1.0
Pretest 2.63 1.06
Posttest 2.63 1.19
2. Only female dairy calves are useful on the farm. -1.75 .71 -7.0 .000***
Pretest 2.63 .74
Posttest 4.38 .52
3. Dairy calves are removed from their mothers, thus
receiving poor nutrition.
.63 .74 2.38 .049*
Pretest 2.13 .35
Posttest 1.5 .54
4. Dairy barns are cleaned at least once a day while the
bedding is cleaned 2 to 3 times each day.
-.75 .46 -4.583 .003**
Pretest 3.75 .46
Posttest 4.5 .54
5. Dairy farmers want to keep things as clean as possible to
limit the spread of disease and provide high quality milk.
-.38 .52 -2.049 .080*
Pretest 4.5 .54
Posttest 4.9 .35
6. Because milking parlors are dirty, bacteria will get into
the milk.
.88 .64 3.862 .006**
Pretest 2.88 .84
Posttest 2.0 1.07
7. Milking employees follow sanitizing protocols like:
wearing new gloves for each shift and disinfecting the
cow’s udders.
-.50 .54 -2.646 .033*
Pretest 4.38 .52
Posttest 4.88 .36
8. Dairy cattle live in their own waste on a constant basis. -.25 1.04 -.683 .516
Pretest 2.13 .61
Posttest 2.38 1.19
9. Newborn dairy calves are fed colostrum to help jump
start their immune systems.
-.63 .74 -2.376 .049*
Pretest 3.88 .84
Posttest 4.5 .54

26
Participants’ Satisfaction with the Dairy Visit
Participants provided their overall satisfaction with the dairy farm visit at the end of the
study and they used a 5-point scale to explain their thoughts. The scale is 1= Strongly Disagree,
2= Disagree, 3= Neutral, 4= Agree, and 5= Strongly Agree. 87.5% of the participants marked
“Strongly Agree” or “Agree” when asked if the dairy visit taught them something they did not
know before. Once again, 87.5% of the participants selected “Strongly Agree” or “Agree” when
asked if the dairy visit motivated them to buy more dairy products. When the participants were
asked if they would recommend this dairy visit to others, 100% chose “Agree” or “Strongly
Agree”. Also, 100% of the participants agreed or strongly agreed that all their questions about
the dairy industry were answered on the visit. Finally, 87.5% marked “Strongly Agree” or
“Agree” when asked if their perspective of the dairy industry is more positive because of this
visit (Table 7).

27
Variable Mean SD N %
This dairy visit taught me something I did not know
before.
4.38 .74 (8) (100)
Neutral 1 12.5
Agree 3 37.5
Strongly Agree 4 50
This visit has motivated me to buy more dairy products. 4.0 .93 (8) (100)
Strongly Disagree 1 12.5
Agree 5 62.5
Strongly Agree 2 25
I would recommend this dairy visit to others. 4.75 .46 (8) (100)
Agree 2 25
Strongly Agree 6 75
My questions about the dairy industry were answered
today.
4.38 .52 (8) (100)
Agree 5 62.5
Strongly Agree 3 37.5
My perspective on the dairy industry is more positive
because of this visit.
4.25 .71 (8) (100)
Neutral 1 12.5
Agree 4 50
Strongly Agree 3 37.5
a Respondents used the following scale to answer these questions: 1= Strongly Disagree,
2=Disagree, 3=Neutral, 4=Agree, 5=Strongly Agree
Table 7: Dairy Visit Satisfaction (N=8) a

28
Summary of Key Findings
The following is a summary of the key findings of this study, organized by each of the
objectives.
Participant Demographics & Agricultural Education Background
The demographic information collected from the 8 participants in this study were age,
childhood residence, and gender. 37.5% of the participants were 19 years old, 25% were 21 years
of age, 25% were 22 years old, and 12.5% were 23 years or older. Most of the participants,
87.5%, grew up in a childhood residence that was not on a farm, with only one participant grew
up on a farm. Finally, there were slightly more female participants (62.5%) than male
participants in this study.
The personal agricultural educational background information that was collected in this
study focused on dairy farm exposure, college majors, FFA, 4-H, and school-related agricultural-
related programs in the pasts of the participants. 62.5% had previously been to a working dairy
farm prior to this dairy visit study. The participants were equally represented regarding their
college majors. One-half of the group were in an agriculture-related college program, while the
remainder were not in an agriculture-related major. Three-fourths of the participants had not
been involved in either 4-H or FFA earlier in life, while 62.5% had not been involved in any
school-related agriculture-related program previously in life.
Participant Herd Health Responses
Participants changed their perceptions of herd health because of the dairy farm visit.
Specifically, statistically significant increases were found in participants’ level of agreement in
the use of enrichment (cow scratchers); a dairy nutritionist aiding in dietary formulation;
pregnancy care; proper antibiotic usage and withdrawal periods; and cow comfort. However,
participants’ perceptions of hoof trimming, overall health, and genetically altered cows did not
change due to the farm visit.
Participant Dairy Regulation Responses
Participants in this farm visit study altered their perceptions regarding dairy regulations
because of the dairy farm visit. Specifically, statistically significant increases were found in the
participants’ levels of agreement to the following topics: animal welfare inspectors; antibiotic
testing before milk is processed (whole tank is thrown out if test is failed); milk quality research
(constantly learning on how to improve SCC levels); environmental rules (farmers wanting to
conserve resources); and incentive monetary programs available for dairy farms (earn extra
money if SCC is lower). However, participants’ perceptions of dairy employee
training/protocols, regulations on dairy products and manure management rules did not change
because of the farm visit.
Participant Farm Practice Responses
Participants changed their perceptions of farm practices because of the dairy farm visit.
Specifically, statistically significant increases were found in participants’ levels of agreement
regarding the topics of: calf removal from mother cows; female calves being more valuable than

29
male calves; barn/bedding cleanings (daily/2-3 times each day); how farmers try to limit the
spread of disease on the farm and produce high quality milk; cleanliness of milking parlors;
milking parlor procedures for employees to follow (new gloves every milking/ udder
disinfectant) and the importance behind them; and colostrum feedings to newborn calves.
Conversely, participants’ perceptions of raw milk nutritional information and dairy cows live in
their own waste on a constant basis did not change due to the farm visit.
Satisfaction with Dairy Farm Visit
The final objective of the study was to measure participants’ satisfaction levels regarding
the dairy farm visit. 87.5% of the participants either agreed or strongly agreed when asked if the
dairy visit taught them something they did not know prior to the visit. Once again, 87.5% of the
participants selected responded positively with “Strongly Agree” or “Agree” when they were
asked if the dairy visit motivated them to buy more dairy products in the future. When the
participants were asked if they would recommend this dairy visit to others, 100% agreed or
strongly agreed positively. Also, 100% of the participants agreed or strongly agreed that all their
questions about the dairy industry were answered on the visit at the dairy. Lastly, 87.5%
responded positively and agreed or strongly agreed when they were asked if their perspective of
the dairy industry is more positive because of this visit.
30
CHAPTER FIVE
CONCLUSIONS, DISCUSSION AND RECOMMENDATIONS
This study’s conclusions, discussion, and recommendations are included in this chapter.
It is organized into four parts: purpose of the study, discussion and implications, conclusions,
and recommendations for future research.
Purpose of the Study
The purpose of this study was to analyze college students’ perceptions of the dairy industry
before and after visiting an operating dairy farm to see if their perceptions changed, if at all. The
objectives for the study are listed below:
1. Describe demographic characteristics and agricultural education background of farm visit
participants.
2. Compare participants’ perceptions of herd health prior to and after the farm visit.
3. Compare participants’ perceptions of dairy regulations prior to and after the farm visit.
4. Compare participants’ perceptions of farm practices prior to and after the farm visit.
5. Evaluate participants’ satisfaction with the dairy farm visit.
Discussion and Implications
This study offers evidence for the use of dairy farm visits as a consumer education tool,
particularly for Generation Z consumers. The results of small studies such as this one present
important considerations for dairy producers, agricultural educators, and researchers for the
future. This study presents valuable information for planning and conducting larger participant
studies of consumer perceptions and dairy farm visits in years to come. The following discussion
suggests implications regarding dairy farm visits for consumers and consumer perceptions,
including ways to improve the dairy farm visit experience.
Dairy Farm Visits for Consumers
Overall, participants held positive perceptions regarding certain aspects of the dairy
industry prior to the farm visit. For example, participants perceived that dairy farmers care about
the overall health of their cows, and the dairy farm visit had no influence on this perception as
measured via pretest and posttest. This is not surprising given that over 60% of the participants
had been to a working dairy farm before. This suggests that dairy farm exposure alone can lead
to a more positive perception of the industry. However, it is interesting to note that despite the
participants’ agricultural background, they developed even more favorable perceptions of herd
health, dairy regulations, and farm practices after touring the dairy farm.
Dairy farm visits are a valuable educational tool because they change consumer
perceptions of the dairy industry. As Ventura discussed in his 2016 study, overall perceptions
improved after providing a guided dairy farm visit, but some consumer concerns remained the
same, even after the tour. College student participants in this study make up an interesting
portion of the consumer population. This generation, also known as Generation Z, is in the
process of developing their buying behaviors and will eventually make up a significant portion of
31
consumers in the United States with a great deal of buying power (Priporas, Stylos & Fotiadis,
2017).
Since a dairy farm is a dynamic environment, this study took a developmental approach
(Patton, 2006). This refers to the concept of developing new evaluative approaches in real-world
situations. It is analogous to the concept of “research and development” in private sector product
development. Evaluators use this approach when developing an innovation that addresses a
complex problem or one that occurs in a complex environment. In the study described here, tools
were developed to facilitate and measure the results of a farm visit. Specifically, these tools
were: pretest, posttest, farm visit talking points script, and farm visit mini-lecture. The pretest
occurred before the farm visit and the posttest occurred after the farm visit. The other tools were
used while the farm visit was in progress, representing a developmental evaluation approach
(Better Evaluation, 2018). This developmental approach is essential to explore how farm visits
could be improved in the future, because of their complex nature that include multiple variables
and factors.
Consumer Perceptions
This study sought to identify concerns regarding dairy farming, if any, among Generation
Z consumers and determine the value of a dairy farm visit. Positive changes in consumer
perception were found across all areas in this study: herd health, dairy regulations, and farm
practices. This suggests that the dairy farm visit aided in the participant’s understanding of many
specific topics regarding the dairy industry. However, a closer examination of the topics showed
areas where the participants’ perceptions were not altered. Specifically, participants disagreed
that “raw milk is healthier than pasteurized milk” and “dairy cattle live in their own waste on a
constant basis”. Interestingly, the study did not alter the participants’ perceptions from
“disagree” to “strongly disagree” for these two items. Therefore, both pasteurized milk and waste
management may be areas of emphasis for future investigation and education.
One reason that could explain perceptions to these two topics that the farmers who led the
farm tour did not directly reference the topics or make the point clear to the participants. A
second idea is that potentially the participants misunderstood the details surrounding that topic.
To ensure that consumers develop their understanding, it is essential that the educators provide
an intentional educational experience. In other words, educators conducting dairy farm visits
must be clear, concise, and discuss all the important consumer topics. Croney (2011) postulated
that consumer concerns were loosely based around food safety, animal welfare, modern farm
practices and the environmental impacts of farming. As Boogaard (2011), mentioned in his
works, consumers are demanding healthy, safe and cheap food available to them, but they may
be deterred by some of the newer farming practices. This study underscores that while
consumers do have expansive topics and concerns, pasteurized milk and waste management may
be areas for educational emphasis with Generation Z consumers.
A dairy farm visit does not address every educational need. After the farm visit, more
participants tended to agree that: (a) dairy farmers do not schedule annual hoof trimmings to help
prevent cows from becoming lame and being in pain, (b) only female dairy cows are useful on
the farm, and (c) dairy cattle live in their own waste on a constant basis. Potentially, participants
witnessed or heard something during the dairy farm visit that swayed their opinions. Participants

32
may have remembered a certain idea they heard or read prior to the farm visit which led them to
respond negatively. This is consistent with Ventura’s (2016) self-led farm visit study that
surveyed consumers before and after touring a dairy farm. The results of that study suggested
that consumers still had concerns surrounding specific topics, even after the dairy farm visit
(Ventura, 2016). To address these concerns from consumers, more research needs to be
conducted in this specific area with a larger sample size.
Dairy Visit Satisfaction Levels
Participants reported high satisfaction with the dairy farm visit. Almost 90% of the
participants selected “Agree” or “Strongly Agree” when asked: (a) if this dairy visit had
motivated them to buy more dairy products in the future, (b) if they were taught something new
on the dairy visit, and (c) if their perception of the dairy industry is more positive because of the
farm visit. All the participants also reported agreement when asked if all their questions were
answered on the dairy farm visit. Lastly, all the participants in the study indicated a high level of
agreement in the posttest satisfaction section and said they would recommend this dairy visit to
others. Overall, these responses from the participants suggest that the dairy visit was a success in
teaching Generation Z consumers something new about the dairy industry and most importantly,
they left the visit with a more positive perception of the industry. Farm visits as an educational
tool are consistent with the literature about Generation Z learning preferences. As Shatto &
Erwin (2016) discussed, this population of students enjoy a more exciting, dynamic learning
environment. The positive responses recorded from this group of Generation Z students
reinforces the need to provide education in new environments, including outdoors.
Since 62.5% of the participants in this study had previously been to a working dairy farm,
this previous experience may have influenced those who chose to participate. If their previous
experiences were positive, informative and interesting ones, they may have been motivated to
participate in this study. It is also important to take perceptions into consideration when looking
at the conclusions from the study, because any preconceived perceptions could have been due to
their past experiences on dairy farms. Measuring consumer satisfaction as part of dairy farm
visits provides a great opportunity for participants to voice their ideas for improving the farm
visit and any potential complaints. These types of discussions will only aid in improving dairy
farm visits and ensuring their success and importance in the future.
Dairy Farm Visit Improvements
A major limitation of this study was the date and time that the dairy farm visit occurred.
Since 8 AM classes are common for undergraduate students, it would have been beneficial to
have the dairy farm tour in the late afternoon or evening to better accommodate the college
student’s class schedules. In the future, it would be interesting to see how many undergraduate
college students would be able to attend an afternoon/evening dairy farm visit in which they got
to observe the evening milking, rather than the morning milking. With more participants from
diverse backgrounds, the results would be more meaningful and more representative of
Generation Z consumers.
For future farm visits, scheduling should coincide with the schedules of the potential
participants and take into consideration the target population for the study. Planning a time in
which the dairy farm visit accommodates many more of the potential participants’ schedules is

33
vital to the success of this form of agricultural education, especially when studying Generation Z.
With a more expansive and diverse group of participants, dairy farmers will be able to reach
more consumers within the population, making a broader impact. Ensuring that participant work
and school schedules do not overlap with the dairy farm visit is an excellent idea and will only
make it simpler and more possible for the participants to choose to participate if that is their
desire.
Another limitation for this study was the weather on the day of the dairy farm visit. Since
it was conducted in January, potential participants may have been deterred by the colder
temperatures and chosen not to participate. Ideally, conducting the study in the warmer months
of the year would be ideal. Warmer weather could also positively affect participant numbers,
therefore leading to stronger participant numbers as well as responses for the study.
The researcher developed a talking points script for the farmers to use while discussing
dairy topics during the farm visit. The goal of this was to encompass the topics that address
consumer concerns about herd health, regulations, and farm practices (and were addressed on the
pretest and posttest). This was done to give participants a frame of reference regarding common
dairy cattle and farm management practices.
The farmers providing the dairy farm visit did not follow the talking points script in all
cases during the farm visit, specifically in these areas: (a) the differences between raw milk and
pasteurized milk; (b) bull calves and their usefulness on a dairy farm; and (c) hoof trimmings for
the herd along with the importance behind them. When comparing pretest and posttest results,
these were the same topic areas where participants did not demonstrate a change in perception.
Therefore, this reaffirmed the researchers’ use of the talking points script. For future farm
visits and research, it would be beneficial to confirm with the farm educators the importance
behind discussing each one of the topics and potentially assign certain topics to certain people to
assure the accurate communication of information.
Conclusions
The study conclusions are organized by research objectives.
Research Question 1: Describe demographic characteristics and agricultural education
background of farm visit participants.
Conclusion: The majority of participants were: female, did not grow up on a farm, had
previously been to a working dairy farm, and lacked previous experience in 4-H, FFA and
school-related agricultural-related programs. Participants were evenly split between having an
agricultural college major and having a non-agricultural major.
Support: Of the participants in this study, 62.5% were female, 87.5% did not grow up on a farm,
and 62.5% had previously been to a working dairy farm prior to this study. Also, 25% of the
participants had been involved in 4-H and FFA while 37.5% had been involved in a school-
related agriculture-related program. One-half of participants were majoring in an agricultural
discipline, and one-half were not majoring in agriculture.

34
Research Question 2: Compare participants’ perceptions of herd health prior to and after the
farm visit.
Conclusion: Participants’ perceptions of dairy farm herd health improved because of the farm
visit experience.
Support: Statistically significant increases were found in participants’ level of agreement in the
use of enrichment (cow scratchers), dietary quality (using a nutritionist), pregnancy care,
antibiotic usage, and cow comfort.
Conclusion: Participants in this farm visit study showed high levels of agreement with the
following perceptions before the farm visit: (a) dairy farmers schedule annual hoof trimming to
prevent lameness and pain, (b) dairy farmers care about the overall herd health, and (c) dairy
cows are not being constantly genetically altered; and none of the perceptions changed
substantially due to the farm visit.
Support: The mean score decreased from pre-test to post-test for the hoof trimming item. The
mean score increased for perception of overall health, but not at a statistically significant level.
The mean score remained the same from pre-test to post-test for perceptions of genetically
altered cows.
Research Question 3: Compare participants’ perceptions of dairy regulations prior to and
after the farm visit.
Conclusion: Participants in this farm visit study developed more favorable perceptions of dairy
regulations (related to consumer milk quality and environmental concerns) because of the dairy
farm visit.
Support: The statistically significant increases were found in the participants’ levels of
agreement to the following topics: animal welfare inspectors, antibiotic testing before milk is
processed (whole tank is thrown out if test is failed), milk quality research (constantly learning
on how to improve SCC levels), environmental rules (farmers wanting to conserve resources),
and incentive monetary programs available for dairy farms (earn extra money if SCC is lower).
62.5% of the items in this section regarding dairy regulations were statistically significant to
suggest that participants’ levels of agreement increased from the pretest to the posttest.
Conclusion: Participants in this farm visit study showed agreement with the following
perceptions before the farm visit: (a) dairy products are highly regulated agricultural products,
(b) dairy farm employees have protocols to follow or training, and (c) dairy farms have
regulations on manure management; and none of these perceptions changed substantially due to
the farm visit.
Support: The mean scores for dairy products as highly regulated agricultural products and dairy
farm employees following protocols or training showed slight increases in agreement, but not at
statistically significant levels. The mean scores remained the same from pretest to posttest for
perceptions of genetically altered cows.

35
Research Question 4: Compare participants’ perceptions of farm practices prior to and after
the farm visit.
Conclusion: Participants perceptions of farm practices improved because of the dairy farm visit.
Support: Statistically significant increases were found in participants’ levels of agreement
regarding calf removal from mother cows; female calves being more valuable than male calves;
barn/bedding cleanings (daily/2-3 times each day); how farmers try to limit the spread of disease
on the farm and produce high quality milk; cleanliness of milking parlors, milking parlor
procedures for employees to follow (new gloves every milking/ udder disinfectant) and the
importance behind them; and colostrum feedings to newborn calves. 66.7% of the items in this
category regarding dairy farm practices were statistically significant to suggest that participants’
levels of agreement increased from the pretest to the posttest.
Conclusion: Participants in this farm visits study tended to agree with the following perceptions
before the farm visit: (a) raw milk and pasteurized milk have the same overall health value, (b),
waste management practices ensure that cattle do not “live in their own waste”. Neither of these
perceptions changed due to the farm visit.
Support: The mean scores showed more agreement from pretest to posttest for the waste
management item, but not at a statistically significant level. The mean score remained the same
from pretest to posttest for perceptions of raw milk and pasteurized milk having the same overall
health value.
Research Question 5: Evaluate participants’ satisfaction with the dairy farm visit.
Conclusion: The vast majority of the participants were satisfied with the dairy farm visit.
Support: 87.5% of the participants in this study demonstrated agreement or strong agreement
when asked the following items: if the dairy visit taught them something they did not know prior
to the visit, if the dairy visit motivated them to buy more dairy products in the future, and if their
perspective of the dairy industry is more positive because of this visit. 100% of the participants
in this study demonstrated agreement or strong agreement when asked the following items: if
they would recommend this dairy visit to others, and if all their questions about the dairy
industry were answered on the dairy visit.
Recommendations for Future Research
Additional research regarding the consumer perceptions of the dairy industry, particularly
among Generation Z, and how farm visits may positively influence consumer perceptions is
highly recommended. This is supported by the finding that 100% of the participants in this study
reported that they would recommend a dairy farm visit to others. The instrument developed for
this study may also be useful for understanding consumer perceptions or as a benchmark-type
survey for dairy farmers to measure the success of their own farm visits over time.

36
Measuring satisfaction levels of every participant is suggested, as it is an essential
component to the success of dairy farm visits. If participants did not enjoy their dairy farm visit,
organizers should be made aware of that fact and changes could potentially be made to improve
them, if necessary. It is recommended that organizers of dairy farm visits seek feedback from
participants, potentially by asking a question such as, “Please describe what you would change
about this dairy farm visit, if anything”. This feedback could be valuable for improving dairy
farm visits and making them successful consumer education tools.
Additional studies would be valuable for the dairy industry, dairy farmers, and
agritourism in general. Researchers should focus on ways to have a more expansive set of
participants, thus leading to a stronger and more diverse dataset that would be more
representative of Generation Z consumers. Although this was a small study of 8 participants, the
instrument was found to be valid and reliable. A larger group of study participants would allow
researchers to identify and compute any potential factors thereby strengthening the measurement
of consumer perceptions. A minimum suggested sample of 100 consumers is suggested for
principal components analysis (Gorsuch, 1993; Kline, 1979; MacCallum, Widaman, Zhang &
Hong, 1999).

37
LIST OF REFERENCES

38
A Brief History of Agritourism, Internationally and in the United States. (2013). In Colorado
Cultural, Heritage and Agritourism Strategic Plan.
Barbieri, C. (2013). Assessing the sustainability of agritourism in the US: a comparison between
agritourism and other farm entrepreneurial ventures. Journal Of Sustainable Tourism, 21(2),
252-270. http://dx.doi.org/10.1080/09669582.2012.685174
Barkema, A. (1993, December). Reaching consumers in the twenty-first century: the
short way around the barn. American Agricultural Economics Association. Issue 75, 1126-
1131.
Boogaard, B. K., Bock, B. B., Oosting, S. J., Wiskerke, J. S. C. & van der Zijpp, A. J.
(2011). Social acceptance of dairy farming: The ambivalence between the two faces of
modernity. Journal Agriculture Environmental Ethics, Issue 24, 259-282. doi:
10.1007/s10806-010-9256-4
Brodt, S., Feenstra, G., Kozloff, R., Klonsky, K., & Tourte, L. (2006). Farmer-Community
Connections and the Future of Ecological Agriculture in California. Agriculture And
Human Values, 23(1), 75-88. http://dx.doi.org/10.1007/s10460-004-5870-y
Bulut, Z., Kökalan Çımrin, F., & Doğan, O. (2017). Gender, generation and sustainable
consumption: Exploring the behaviour of consumers from Izmir, Turkey. International
Journal Of Consumer Studies, 41(6), 597-604. http://dx.doi.org/10.1111/ijcs.12371
Campbell, D. T. & Stanley, J. C. (1963). Experimental and quasi-experimental designs
for research. Boston, MA: Houghton Mifflin.
Che, D., Veeck, A., & Veeck, G. (2005). Sustaining production and strengthening the
agritourism product: Linkages among Michigan agritourism destinations. Agriculture
And Human Values, 22(2), 225-234. http://dx.doi.org/10.1007/s10460-004-8282-0
Clark, J., & Ohkawa, H. (2005). New discoveries in agrochemicals. Washington: DC.
Colton, D. & Covert, R. W. (2007). Designing and constructing instruments for social
research and evaluation. San Fransisco, CA: John Wiley & Sons, Inc.
Croney, C. C. & Anthony, R. (2011). Invited review: Ruminated conscientiously: Scientific and
socio-ethical challenges for US dairy production. Journal of Dairy Science, Issue 94, 539-
546. doi: 10.3168/jds.2010-3627
Davis, J. A. (1971). Elementary survey analysis, Englewood, NJ: Prentice-Hall.
de Graff, S., Van Loo, E., Bijttebier, J., Vanhonacker, F., Lauwers, L., Tuyttens, F.A.M.,
& Verbeke, W. (2016). Determinants of consumer intention to purchase animal-friendly
milk. Journal of Dairy Science, Issue 99, 8304-8313. Retrieved from
http://dx.doi.org/10.3168/jds.2016-10886

39
Fosnot, C. (2005). Constructivism (2nd ed., pp. 8-35). New York: Teachers College Press.
Fromm, J. (2018). How much Financial Influence does Gen Z have? Forbes. Retrieved
22 January 2018, from https://www.forbes.com/sites/jefffromm/2018/01/10/what-
you-need-to-know-about-the-financial-impact-of-gen-z-influence/#5bb960f256fc
Gorsuch, R. L. (1983). Factor analysis (2nd ed.). Hillsdale,NJ: Erlbaum.
Hradiska, E. (2013). Identity and Consumer Behavior of the Generation Z. Marketing Identity,
199-214.
IBM Corp. (2017). IBM SPSS Statistics for Windows, Version 25.0. Armonk, NY: IBM Corp.
Igel, C., & Urquhart, V. (2012). Generation Z, Meet Cooperative Learning. Middle School
Journal, 43(4), 16-21. http://dx.doi.org/10.1080/00940771.2012.11461816
Kesse-Guyot, E., Péneau, S., Méjean, C., Szabo de Edelenyi, F., Galan, P., Hercberg, S., &
Lairon, D. (2013). Profiles of Organic Food Consumers in a Large Sample of French
Adults: Results from the Nutrinet-Santé Cohort Study. Plos ONE, 8(10), e76998.
http://dx.doi.org/10.1371/journal.pone.0076998
Kline, P. (1979). Psychometrics and psychology. London, England: Acaderric Press.
MacCallum, R. C., Widaman, K. F., Zhang, S., & Hong S. (1999). Sample size in factor analysis.
Psychological Methods, Issue 4, 84-99.
National Agricultural Law Center. (2018). Agritourism Overview. Retrieved 3 April 2018, from
http://nationalaglawcenter.org/overview/agritourism/
Nyikos, M., & Hashimoto, R. (1997). Constructivist Theory Applied to Collaborative Learning
in Teacher Education: In Search of ZPD. The Modern Language Journal, 81(4), 506.
http://dx.doi.org/10.2307/328893
Olynk, N. J. & Ortega, D. L. (2013). Consumer preferences for verified dairy cattle
management practices in processed dairy products. Food Control, Issue 30, 298-305.
Received from http://dx.doi.org/10.1016/j.foodcont.2012.07.030
Our Food Link. (2018). Fb.org. Retrieved 2 April 2018, from
https://www.fb.org/programs/womens-leadership-program/our-food-link/
Parr, D., & Van Horn, M. (2006). Development of Organic and Sustainable Agricultural
Education at the University of California, Davis: a Closer Look at Practice and
Theory. Hortechnology, 16(3)
Patton, M. Q. (2006). Evaluation for the way we work. The Nonprofit Quarterly, 13 (1), 28–33.

40
Personality Traits of Millennials: How to Market to this Generation | Morris Creative Group.
(2018). Morris Creative Group. Retrieved 3 April 2018, from
https://www.morriscreative.com/personality-traits-millennials-market-generation/
Priporas, C., Stylos, N., & Fotiadis, A. (2017). Generation Z consumers' expectations of
interactions in smart retailing: A future agenda. Computers In Human Behavior, Issue 77,
374-381. Retrieved from: http://dx.doi.org/10.1016/j.chb.2017.01.058
Powell, D., & Trexler, C. (2008). Agricultural Literacy: Clarifying a Vision for Practical
Application. Journal Of Agricultural Education, 49(1), 85-98.
Reed, A. (2015). Snared: Ethics and Nature in Animal Protection. Ethnos, 82(1), 68-85.
Retrieved from: http://dx.doi.org/10.1080/00141844.2015.1028563
Schilling, B., Attavanich, W., & Jin, Y. (2014). Does Agritourism Enhance Farm
Profitability?. Journal Of Agricultural And Resource Economics, 39(1), 69-87.
Shatto, B., & Erwin, K. (2016). Moving on From Millennials: Preparing for Generation Z. The
Journal Of Continuing Education In Nursing, 47(6), 253-254.
http://dx.doi.org/10.3928/00220124-20160518-05
Slama, M., & Tashchian, A. (1985). Selected Socioeconomic and Demographic Characteristics
Associated with Purchasing Involvement. Journal Of Marketing, 49(1), 72.
http://dx.doi.org/10.2307/1251177
Silva, S., Machado, J., & Cruz, M. (2017). The influence of WOM and Peer Interaction in the
Decision-Making Process of Generation Z within the family. International Journal Of
Marketing Communication And New Media, 2(2).
Talbert, B. A., & Larke, A., Jr. (1995). Factors influencing minority and non-minority
students to enroll in an introductory agriscience course in Texas. Journal of Agricultural
Education, 36(1), 38-45.
Talbert, B. A. (1996, December). Attitudes toward agriculture of urban students enrolled
in high school agricultural education by gender and ethnicity. Proceedings of the
1996 National Agricultural Education Research Meeting: Partnerships for
Success Through Research in Agricultural Education, Cincinnati, Ohio.
Talbert, B. A. (1997, December). Comparison of attitudes toward agriculture of urban
high school students by agricultural education enrollment status, minority status, and gender.
Proceedings of the 24th Annual National Agricultural Education Research Meeting, Las
Vegas, Nevada
Tew, C., & Barbieri, C. (2012). The perceived benefits of agritourism: The provider’s
Perspective. Tourism Management, 33(1), 215-224. Retrieved from:
http://dx.doi.org/10.1016/j.tourman.2011.02.005

41
USDA ERS - Dairy Data. (2018). Ers.usda.gov. Retrieved 2 March 2018, from
https://www.ers.usda.gov/data-products/dairy-data/
Ventura, B. A. Animal welfare concerns and values of stakeholders
within the dairy industry. Journal of Agricultural and Environmental Ethics, 28(1),
109-126. Retrieved September 30, 2016, from
http://apps.webofknowledge.com.proxy.lib.utk.edu:90/full_record.do?product=UA
&seach_mode=GeneralSearch&qid=8&SID=3EJww2MPmVRNysSumzz&page=
5&doc=49
Ventura B. A., von Keyserlingk M. A. G., Wittman H., Weary D. M. (2016). What Difference
Does a Visit Make? Changes in Animal Welfare Perceptions after Interested Citizens Tour a
Dairy Farm. (2013, October). Invited review: Sustainability of the US dairy industry. Journal
of Dairy Science, 96(9), 5405-5425. Retrieved October 01, 2016, from
http://apps.webofknowledge.com.proxy.lib.utk.edu/90/full_record.do?product=UA
&search_mode=GeneralSearch&qid=5&SID=3EJww2MPmVRNysSumzz&page=
1&doc=7
Verain, M., Bartels, J., Dagevos, H., Sijtsema, S., Onwezen, M., & Antonides, G. (2012).
Segments of sustainable food consumers: a literature review. International Journal Of
Consumer Studies, 36(2), 123-132. http://dx.doi.org/10.1111/j.1470-6431.2011.01082.x
Verbeke, W. (2006). Functional foods: Consumer willingness to compromise on taste for
health?. Food Quality And Preference, 17(1-2), 126-131.
http://dx.doi.org/10.1016/j.foodqual.2005.03.003
von Keyserlingk, M., Martin, N., Kebreab, E., Knowlton, K., Grant, R., & Stephenson, M.
(2013). Invited review: Sustainability of the US dairy industry. Journal Of Dairy Science,
96(9), 5405-5425. http://dx.doi.org/10.3168/jds.2012-6354
Walsh, G., & Mitchell, V. (2005). Demographic characteristics of consumers who find it difficult
to decide. Marketing Intelligence & Planning, 23(3), 281-295.
http://dx.doi.org/10.1108/02634500510597319
Weinrich, R., Kuhl, S., Zuhlsdorf, A., & Spiller, A. (2014). Consumer attitudes in
Germany towards different dairy housing systems and their implications for the
marketing of pasture raised milk. International Food and Agribusiness Management Review,
17(4), 205
Williams, A. (2018). Move Over, Millennials, Here Comes Generation Z. Nytimes.com.
Retrieved 4 April 2018, from https://www.nytimes.com/2015/09/20/fashion/move-over-
millennials-here-comes-generation-z.html
Wolf, C. A. (2016, July). Public and farmer perceptions of dairy cattle welfare in the
United States. Journal of Dairy Science, 99(7), 5892-5903. Retrieved October 01,
2016, from

42
http://apps.webofknowledge.com.proxy.lib.utk.edu:90/full_record.do?product=UA
&seach_mode=GeneralSearch&qid=1&SID=3EJww2MPmVRNysSumzz&page=
1&doc=7
15 Consumer Behaviors Setting 5 Generations Apart Precision Dialogue. (2018). Precision
Dialogue. Retrieved 3 April 2018, from http://www.precisiondialogue.com/generations-
consumer-behaviors/
(2018). Wmfc.org. Retrieved 3 April 2018, from
http://www.wmfc.org/uploads/GenerationalDifferencesChart.pdf

43
APPENDICES

44
Appendix A: Talking Points Script
Parlor:
Antibiotic usage/rules
Inspections and parlor rules
Parlor protocols and steps
Animal care protocols
Dairy product regulations
SCC counts and incentive programs
Raw milk vs. pasteurized
Calves:
Genetics, breeding
Advantages of A.I.
Pregnancy, dry cows, reproductive cycle
Research rules and goals of studies
Bull calves, calf separation
Colostrum
Barn/Manure Management:
Hoof trimmings: benefits and reasons behind them
Herd health, nutrition
Cow enrichment (scratchers), animal welfare
Cow comfort
Manure management, low environmental impact
Regular barn/bed cleanings and why

45
Appendix B: Pretest

46

47

48
49

50

51
Appendix C: Posttest

52

53
54

55

56

57

58
Appendix D: Consent Form

59

60
Appendix E: Cover Letter

61
Appendix F: IRB Correspondences

62

63

64
Appendix G: Dairy Farming Presentation
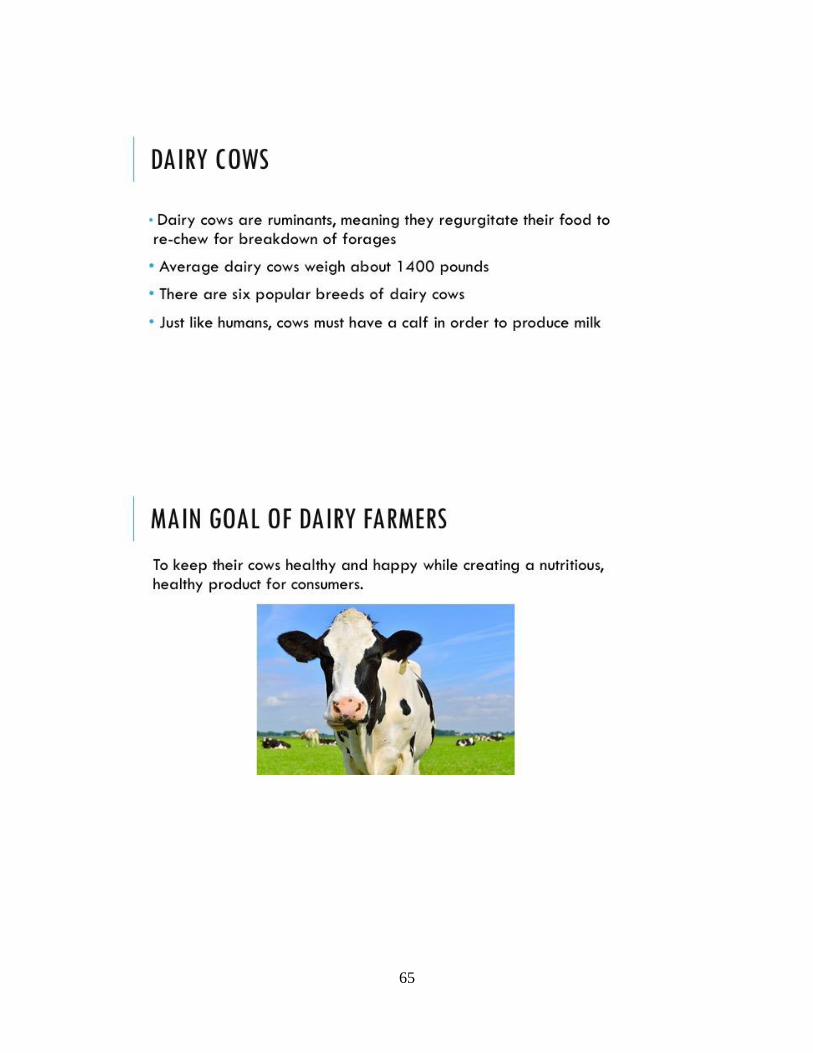
65

66

67
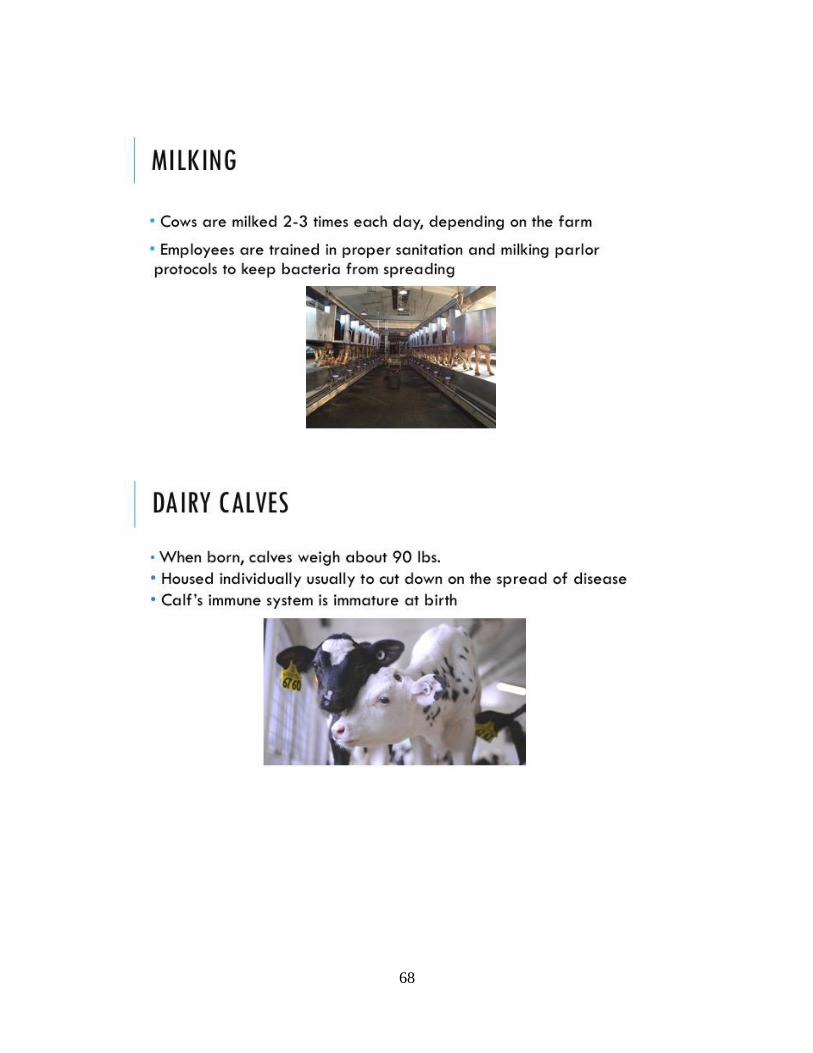
68

69

70
Table 8: Correlation Matrix
Herd
Health
1
Herd
Health 2
Herd
Health 3
Herd
Health 4
Herd
Health 5
Herd
Health 6
Herd
Health 7
Herd Health 8
Herd Health 1 1.000 0.265 -0.137 -0.006 0.390 0.351 0.261 0.021
Herd Health 2 0.265 1.000 -0.100 0.165 0.451 0.262 0.129 0.354
Herd Health 3 -0.137 -0.100 1.000 -0.189 -0.274 -0.337 -0.222 -0.100
Herd Health 4 -0.006 0.165 -0.189 1.000 0.408 0.281 0.269 0.389
Herd Health 5 0.390 0.451 -0.274 0.408 1.000 0.557 0.258 0.387
Herd Health 6 0.351 0.262 -0.337 0.281 0.557 1.000 0.410 0.330
Herd Health 7 0.261 0.129 -0.222 0.269 0.258 0.410 1.000 0.311
Herd Health 8 0.021 0.354 -0.100 0.389 0.387 0.330 0.311 1.000
Dairy Reg 1 0.336 0.433 -0.334 0.283 0.624 0.552 0.253 0.492
Dairy Reg 2 0.220 0.292 0.046 0.201 0.491 0.381 0.136 0.144
Dairy Reg 3 0.289 0.421 -0.261 0.349 0.543 0.381 0.246 0.266
Dairy Reg 4 0.339 0.320 -0.162 0.235 0.105 0.456 0.576 0.079
Dairy Reg 5 0.207 0.247 -0.325 0.244 0.438 0.451 0.310 0.298
Dairy Reg 6 0.141 0.214 -0.061 0.274 0.056 0.033 0.308 0.278
Dairy Reg 7 0.157 0.275 -0.264 0.347 0.413 0.273 0.311 0.258
Dairy Reg 8 0.202 0.165 -0.067 0.434 0.368 0.248 0.242 0.144
Farm Practices 1 -0.004 -0.157 0.042 0.043 0.249 0.112 0.177 0.121
Farm Practices 2 -0.144 -0.004 -0.199 0.030 0.087 0.232 0.031 0.134
Farm Practices 3 0.149 0.268 -0.341 0.359 0.504 0.597 0.421 0.406
Farm Practices 4 0.011 0.011 -0.358 0.446 0.378 0.248 0.093 0.252
Farm Practices 5 0.282 0.296 -0.141 0.299 0.562 0.389 0.194 0.371
Farm Practices 6 0.247 0.350 -0.341 0.256 0.297 0.372 0.232 0.323
Farm Practices 7 0.294 0.322 -0.316 0.344 0.472 0.301 0.244 0.275
Farm Practices 8 0.313 0.301 -0.361 0.249 0.631 0.584 0.276 0.505
Farm Practices 9 0.298 0.308 -0.213 0.255 0.502 0.417 0.381 0.420

71
Table 8: Correlation Matrix (continued)
Dairy
Reg 1
Dairy
Reg 2
Dairy Reg
3
Dairy Reg
4
Dairy Reg
5
Dairy Reg
6
Dairy Reg
7
Dairy
Reg 8
Herd Health 1 0.336 0.220 0.289 0.339 0.207 0.141 0.157 0.202
Herd Health 2 0.433 0.292 0.421 0.320 0.247 0.214 0.275 0.165
Herd Health 3 -0.334 0.046 -0.261 -0.162 -0.325 -0.061 -0.264 -0.067
Herd Health 4 0.283 0.201 0.349 0.235 0.244 0.274 0.347 0.434
Herd Health 5 0.624 0.491 0.543 0.105 0.438 0.056 0.413 0.368
Herd Health 6 0.552 0.381 0.381 0.456 0.451 0.033 0.273 0.248
Herd Health 7 0.253 0.136 0.246 0.576 0.310 0.308 0.311 0.242
Herd Health 8 0.492 0.144 0.266 0.079 0.298 0.278 0.258 0.144
Dairy Reg 1 1.000 0.505 0.521 0.171 0.462 0.199 0.562 0.167
Dairy Reg 2 0.505 1.000 0.621 0.173 0.422 0.065 0.552 0.282
Dairy Reg 3 0.521 0.621 1.000 0.229 0.689 0.147 0.591 0.330
Dairy Reg 4 0.171 0.173 0.229 1.000 0.289 0.332 0.212 0.317
Dairy Reg 5 0.462 0.422 0.689 0.289 1.000 0.378 0.420 0.291
Dairy Reg 6 0.199 0.065 0.147 0.332 0.378 1.000 0.170 0.093
Dairy Reg 7 0.562 0.552 0.591 0.212 0.420 0.170 1.000 0.453
Dairy Reg 8 0.167 0.282 0.330 0.317 0.291 0.093 0.453 1.000
Farm Practices
1
0.179 0.355 0.079 -0.094 -0.107 -0.179 0.312 0.131
Farm Practices
2
0.437 0.131 0.138 -0.035 0.085 0.019 0.314 -0.032
Farm Practices
3
0.542 0.422 0.367 0.404 0.468 0.238 0.388 0.135
Farm Practices
4
0.391 0.224 0.237 0.005 0.331 0.121 0.165 0.100
Farm Practices
5
0.453 0.283 0.486 0.154 0.442 0.071 0.484 0.314
Farm Practices
6
0.442 0.033 0.156 0.193 0.298 0.266 0.180 0.098
Farm Practices
7
0.461 0.229 0.444 0.292 0.408 0.339 0.597 0.420
Farm Practices
8
0.734 0.347 0.435 0.134 0.500 0.249 0.570 0.220
Farm Practices
9
0.428 0.190 0.360 0.502 0.467 0.273 0.372 0.438

72
Table 8: Correlation Matrix (continued)
Farm
Practices
1
Farm
Practices
2
Farm
Practices
3
Farm
Practices
4
Farm
Practices
5
Farm
Practices
6
Farm
Practices
7
Farm
Practices
8
Herd Health
1
-0.004 -0.144 0.149 0.011 0.282 0.247 0.294 0.313
Herd Health
2
-0.157 -0.004 0.268 0.011 0.296 0.350 0.322 0.301
Herd Health
3
0.042 -0.199 -0.341 -0.358 -0.141 -0.341 -0.316 -0.361
Herd Health
4
0.043 0.030 0.359 0.446 0.299 0.256 0.344 0.249
Herd Health
5
0.249 0.087 0.504 0.378 0.562 0.297 0.472 0.631
Herd Health
6
0.112 0.232 0.597 0.248 0.389 0.372 0.301 0.584
Herd Health
7
0.177 0.031 0.421 0.093 0.194 0.232 0.244 0.276
Herd Health
8
0.121 0.134 0.406 0.252 0.371 0.323 0.275 0.505
Dairy Reg 1 0.179 0.437 0.542 0.391 0.453 0.442 0.461 0.734
Dairy Reg 2 0.355 0.131 0.422 0.224 0.283 0.033 0.229 0.347
Dairy Reg 3 0.079 0.138 0.367 0.237 0.486 0.156 0.444 0.435
Dairy Reg 4 -0.094 -0.035 0.404 0.005 0.154 0.193 0.292 0.134
Dairy Reg 5 -0.107 0.085 0.468 0.331 0.442 0.298 0.408 0.500
Dairy Reg 6 -0.179 0.019 0.238 0.121 0.071 0.266 0.339 0.249
Dairy Reg 7 0.312 0.314 0.388 0.165 0.484 0.180 0.597 0.570
Dairy Reg 8 0.131 -0.032 0.135 0.100 0.314 0.098 0.420 0.220
Farm
Practices 1
1.000 0.292 0.162 0.036 0.021 -0.064 0.167 0.182
Farm
Practices 2
0.292 1.000 0.166 0.079 0.292 0.049 0.216 0.328
Farm
Practices 3
0.162 0.166 1.000 0.337 0.312 0.551 0.359 0.617
Farm
Practices 4
0.036 0.079 0.337 1.000 0.181 0.337 0.247 0.358
Farm
Practices 5
0.021 0.292 0.312 0.181 1.000 0.359 0.614 0.589
Farm
Practices 6
-0.064 0.049 0.551 0.337 0.359 1.000 0.427 0.511
Farm
Practices 7
0.167 0.216 0.359 0.247 0.614 0.427 1.000 0.526
Farm
Practices 8
0.182 0.328 0.617 0.358 0.589 0.511 0.526 1.000
Farm
Practices 9
0.054 0.137 0.574 0.186 0.444 0.479 0.561 0.502

73
Figure 1. Dairy Farm Stations Map
74
VITA
Erin N. Allen is a graduate student at the University of Tennessee in Knoxville. Upon
completion and approval of this thesis report, she will receive a Master of Science degree in
Agricultural Leadership, Education and Communications. Previously, Erin earned a Bachelor of
Science degree in Animal Science, also from the University of Tennessee. At the time of writing
this thesis report, Erin held a position as a graduate teaching assistant for the Office of
Information Technology. There, she assisted students and faculty with troubleshooting issues
with Zoom (an online meeting tool). Also during graduate school, Erin worked as a Dairy
Extension intern, working with Dr. Peter Krawczel to help coordinate Extension meetings across
the state and working on the Southeast Milk Quality Initiative. Prior to graduate school, Erin
worked at Cruze dairy farm as a milker and assistant herdsman, also while being on the UT
Dairy Challenge team. Upon graduation in May, Erin plans to work in the field of Extension or
dairy agritourism in the Knoxville, TN area.