Embed Size (px)
Citation preview
Analyzing Cost-Time Trade-Offs
• There are always cost-time trade-offs in project management.– You can completing a project early by hiring more
workers or running extra shifts.– There are often penalties if projects extend
beyond some specific date, and a bonus may be provided for early completion.
• Crashing a project means expediting some activities to reduce overall project completion time and total project costs.
Cost to Crash
• To assess the benefit of crashing certain activities, either from a cost or a schedule perspective, the project manager needs to know the following times and costs.
• Normal time (NT) is the time necessary to complete and activity under normal conditions.
• Normal cost (NC) is the activity cost associated with the normal time.
• Crash time (CT) is the shortest possible time to complete an activity.
• Crash cost (CC) is the activity cost associated with the crash time.
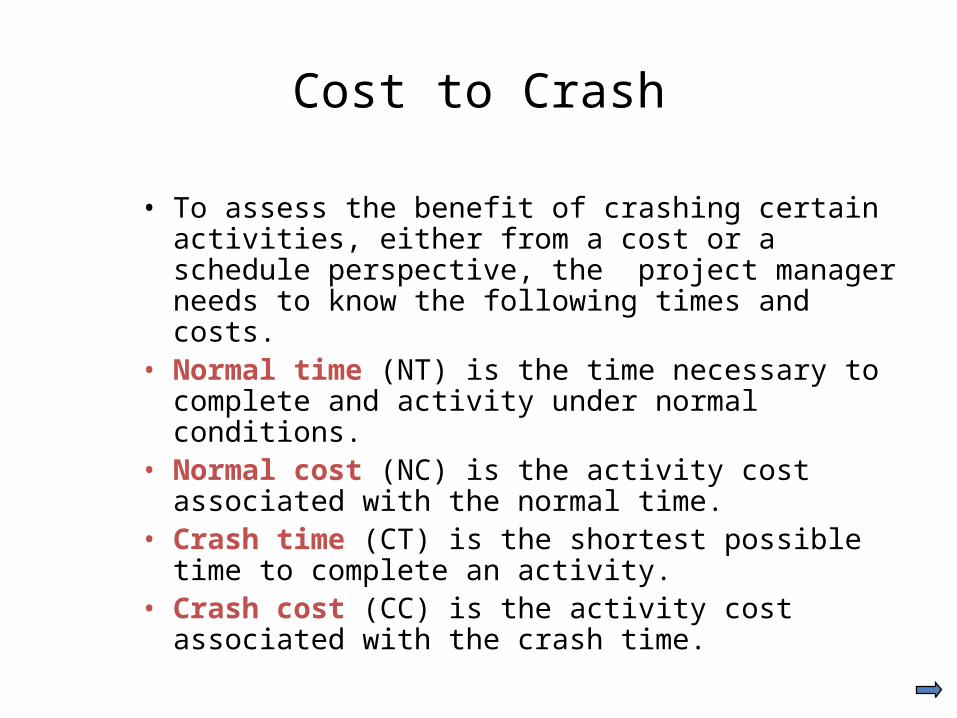
Cost to Crash per Period
The Cost to Crash per Time Period =
CC − NC
NT − CT
Crash Cost − Normal Cost
Normal Time − Crash Time
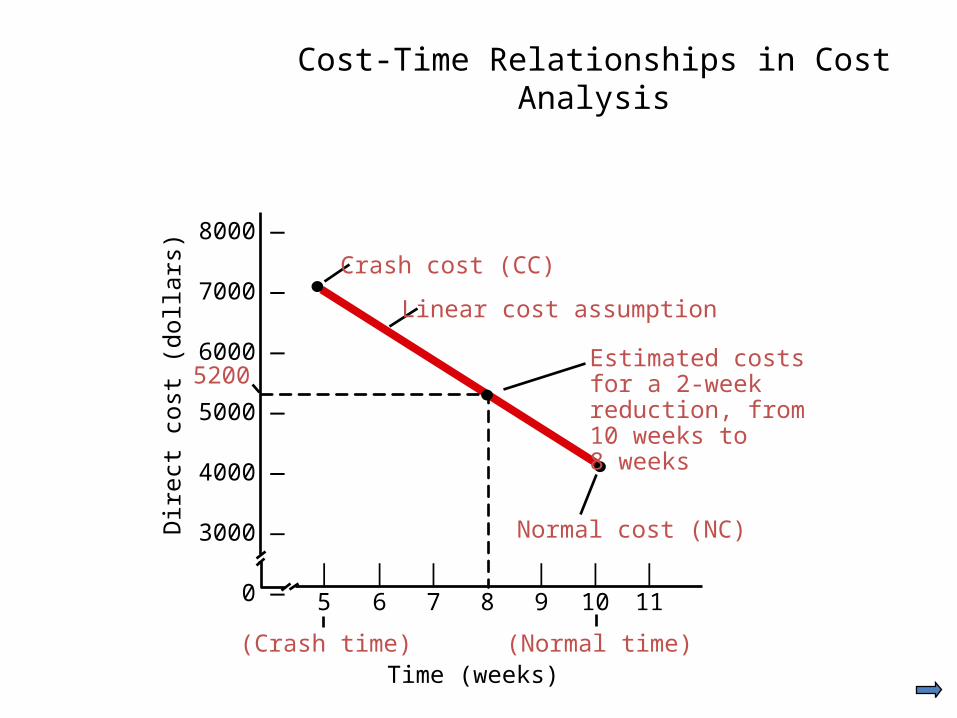
Linear cost assumption
8000 —
7000 —
6000 —
5000 —
4000 —
3000 —
0 —
Dire
ct c
ost (
dolla
rs)
| | | | | |5 6 7 8 9 10 11
Time (weeks)
Crash cost (CC)
Normal cost (NC)
(Crash time) (Normal time)
Estimated costs for a 2-week reduction, from 10 weeks to 8 weeks
5200
Cost-Time Relationships in Cost Analysis
• The objective of cost analysis is to determine the project schedule that minimizes total project costs.
• A minimum-cost schedule is determined by starting with the normal time schedule and crashing activities along the critical path in such a way that the costs of crashing do not exceed the savings in indirect and penalty costs.
Minimizing CostsMinimizing Costs
• Use these steps to determine the minimum cost schedule:
1. Determine the project’s critical path(s).2. Find the activity or activities on the critical path(s) with
the lowest cost of crashing per time unit.3. Reduce the time for this activity until…
a. It cannot be further reduced orb. Until another path becomes critical, orc. The increase in direct costs exceeds the savings that result from
shortening the project (which lowers indirect costs & penalties).
4. Repeat this procedure until the increase in direct costs is larger than the savings generated by shortening the project.
Minimum Cost ScheduleMinimum Cost Schedule
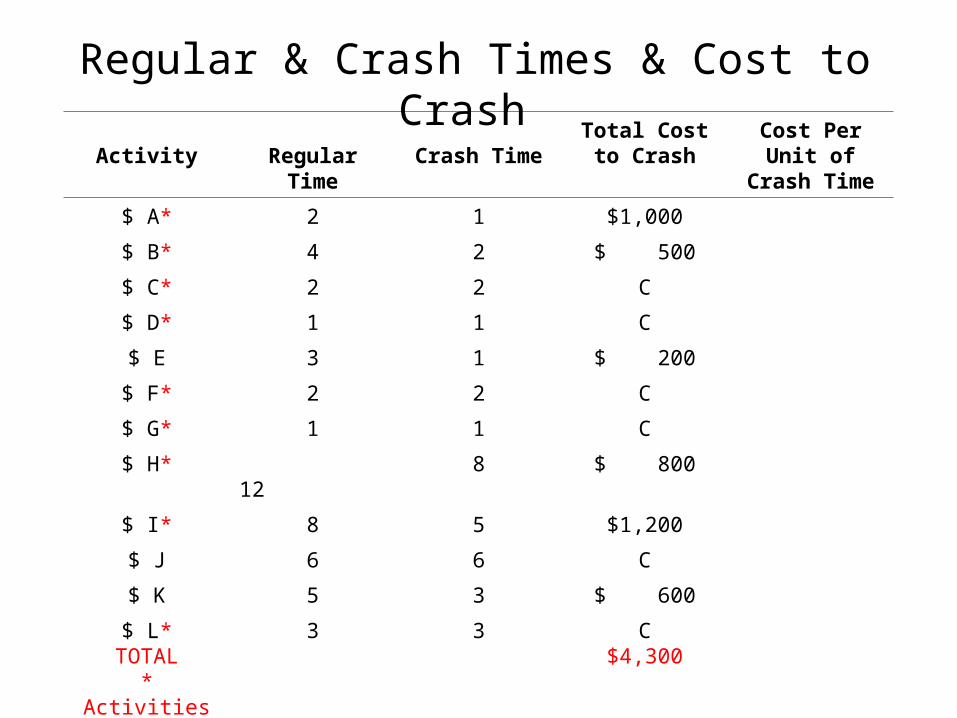
Regular & Crash Times & Cost to Crash
Activity Regular Time Crash TimeTotal Costto Crash
Cost Per Unit of Crash Time
$ A* 2 1 $1,000
$ B* 4 2 $ 500
$ C* 2 2 C
$ D* 1 1 C
$ E 3 1 $ 200
$ F* 2 2 C
$ G* 1 1 C
$ H* 12 8 $ 800
$ I* 8 5 $1,200
$ J 6 6 C
$ K 5 3 $ 600
$ L*TOTAL
* Activities on critical path
3 3 C$4,300
START A2
B4
C2
D1
F2
G1
H12
J6
I8
K5
L3
END
E3
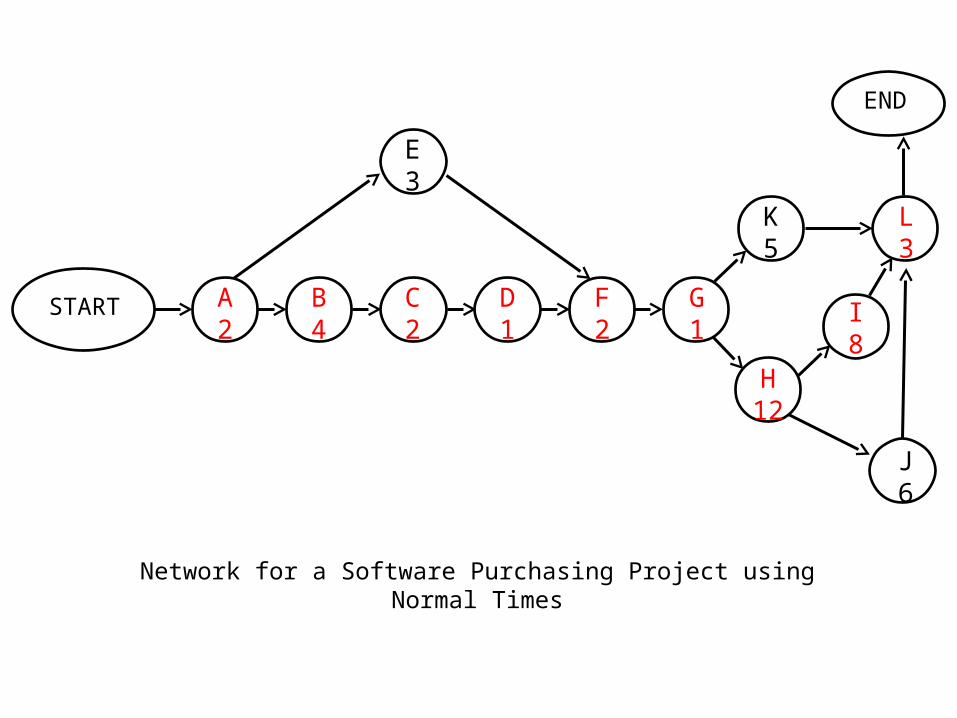
Network for a Software Purchasing Project using Normal Times
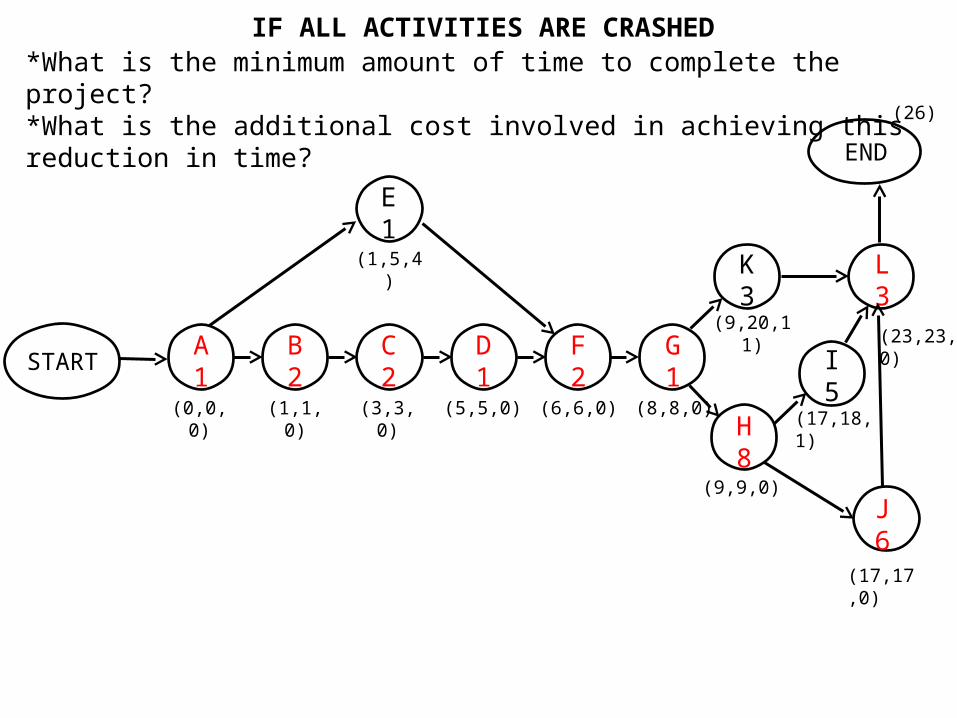
IF ALL ACTIVITIES ARE CRASHED
STARTA1
B2
C2
D1
F2
G1
H8
J6
I5
K3
L3
END
E1
(1,5,4)
(8,8,0)(6,6,0)(5,5,0)(0,0,0) (1,1,0) (3,3,0)
(26)
(23,23,0)
(17,18,1)
(17,17,0)
(9,20,11)
(9,9,0)
*What is the minimum amount of time to complete the project?*What is the additional cost involved in achieving this reduction in time?
START A2
B4
C2
D1
F2
G1
H12
J6
I8
K5
L3
END
E3
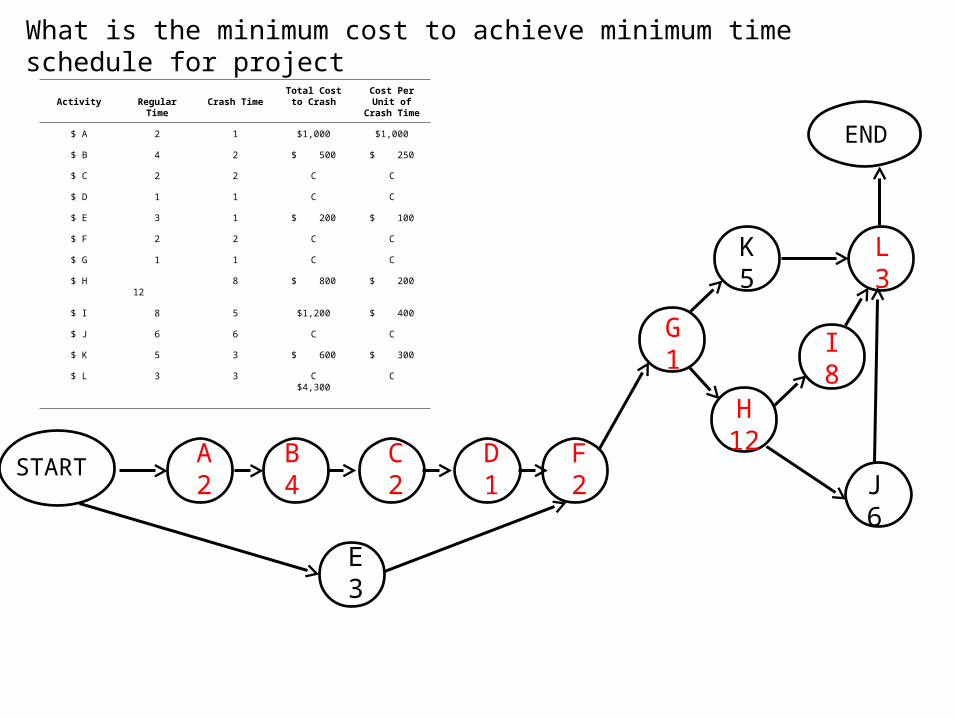
What is the minimum cost to achieve minimum time schedule for project
Activity Regular Time Crash TimeTotal Costto Crash
Cost Per Unit of Crash Time
$ A 2 1 $1,000 $1,000
$ B 4 2 $ 500 $ 250
$ C 2 2 C C
$ D 1 1 C C
$ E 3 1 $ 200 $ 100
$ F 2 2 C C
$ G 1 1 C C
$ H 12 8 $ 800 $ 200
$ I 8 5 $1,200 $ 400
$ J 6 6 C C
$ K 5 3 $ 600 $ 300
$ L 3 3 C$4,300
C
STARTA2
B4
C2
D1
F2
G1
H12
J6
I8
K5
L3
END
E3
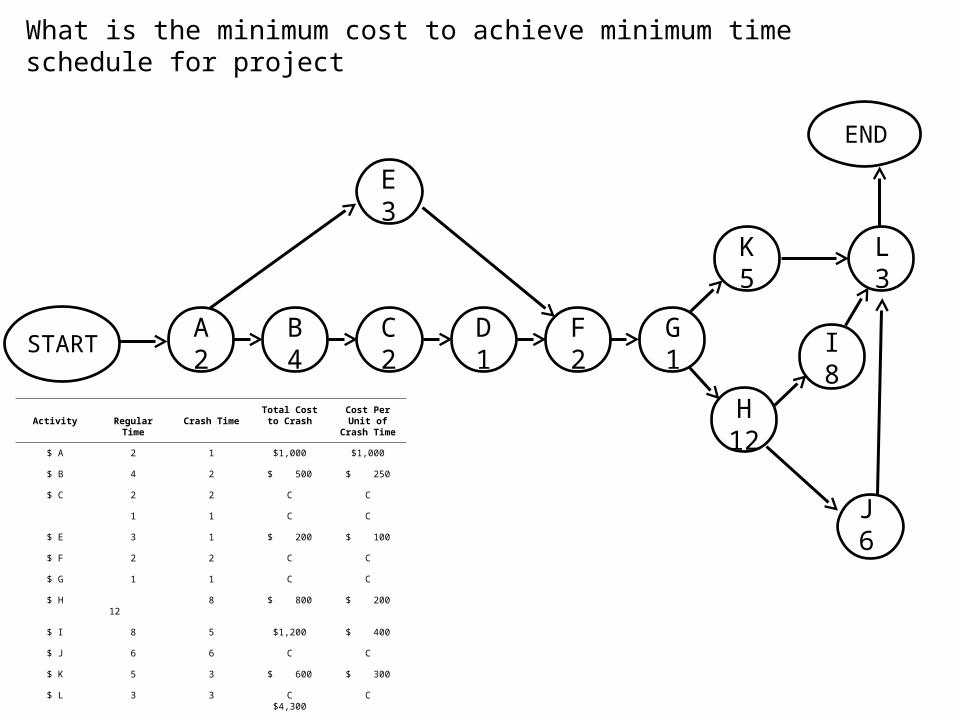
What is the minimum cost to achieve minimum time schedule for project
Activity Regular Time Crash TimeTotal Costto Crash
Cost Per Unit of Crash Time
$ A 2 1 $1,000 $1,000
$ B 4 2 $ 500 $ 250
$ C 2 2 C C
1 1 C C
$ E 3 1 $ 200 $ 100
$ F 2 2 C C
$ G 1 1 C C
$ H 12 8 $ 800 $ 200
$ I 8 5 $1,200 $ 400
$ J 6 6 C C
$ K 5 3 $ 600 $ 300
$ L 3 3 C$4,300
C
STARTA2
B4
C2
D1
F2
G1
H12
J6
I8
K5
L3
END
E3
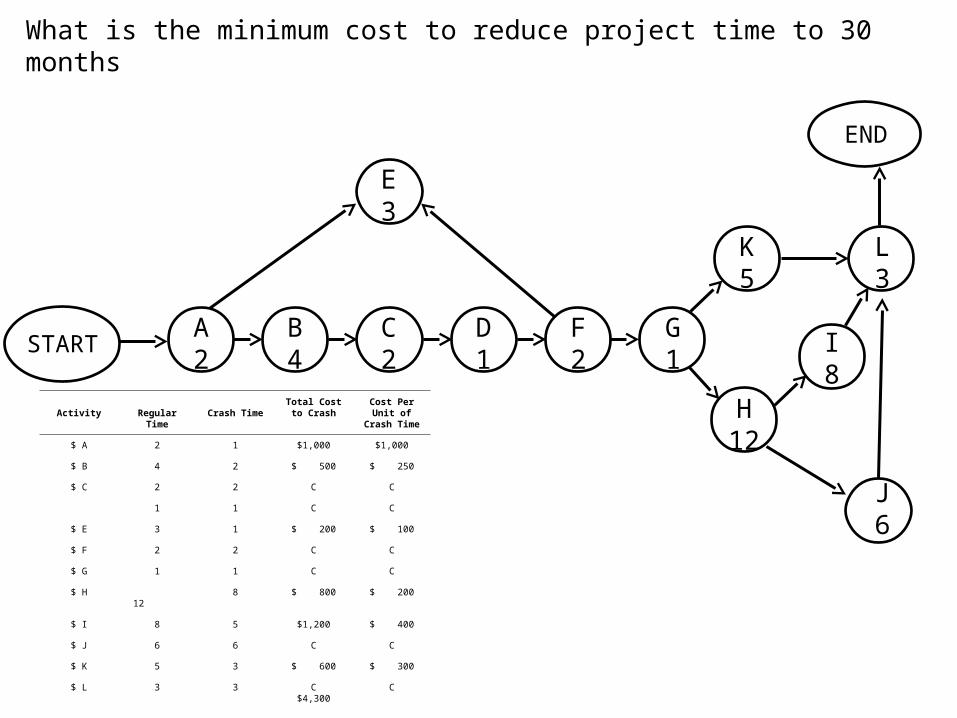
What is the minimum cost to reduce project time to 30 months
Activity Regular Time Crash TimeTotal Costto Crash
Cost Per Unit of Crash Time
$ A 2 1 $1,000 $1,000
$ B 4 2 $ 500 $ 250
$ C 2 2 C C
1 1 C C
$ E 3 1 $ 200 $ 100
$ F 2 2 C C
$ G 1 1 C C
$ H 12 8 $ 800 $ 200
$ I 8 5 $1,200 $ 400
$ J 6 6 C C
$ K 5 3 $ 600 $ 300
$ L 3 3 C$4,300
C
STARTA2
B4
C2
D1
F2
G1
H12
J6
I8
K5
L3
END
E3
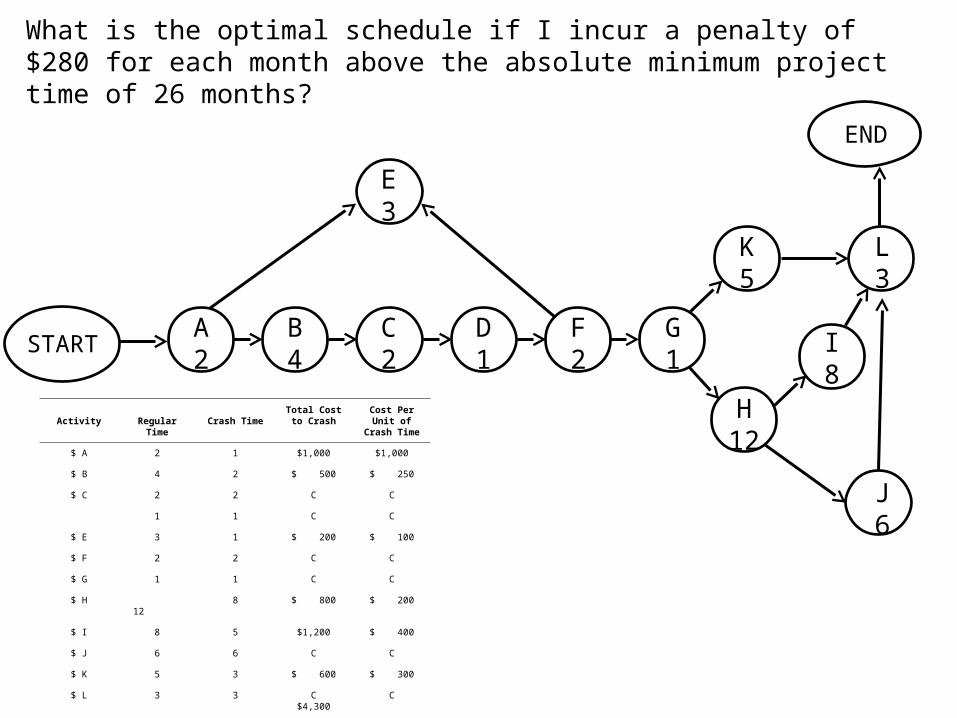
What is the optimal schedule if I incur a penalty of $280 for each month above the absolute minimum project time of 26 months?
Activity Regular Time Crash TimeTotal Costto Crash
Cost Per Unit of Crash Time
$ A 2 1 $1,000 $1,000
$ B 4 2 $ 500 $ 250
$ C 2 2 C C
1 1 C C
$ E 3 1 $ 200 $ 100
$ F 2 2 C C
$ G 1 1 C C
$ H 12 8 $ 800 $ 200
$ I 8 5 $1,200 $ 400
$ J 6 6 C C
$ K 5 3 $ 600 $ 300
$ L 3 3 C$4,300
C
© 2007 Pearson Education
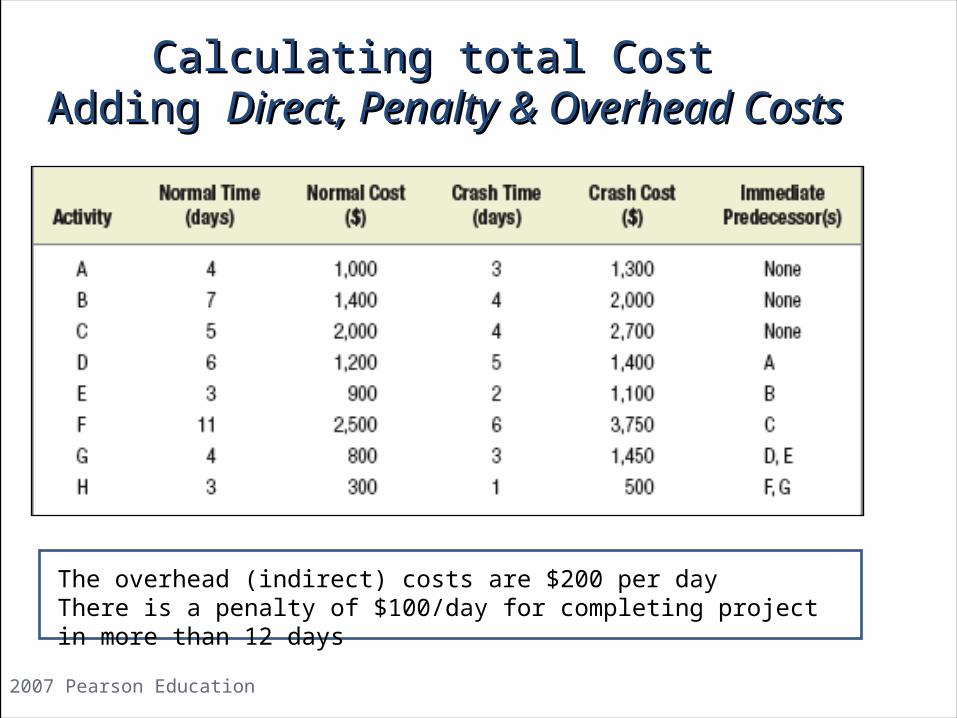
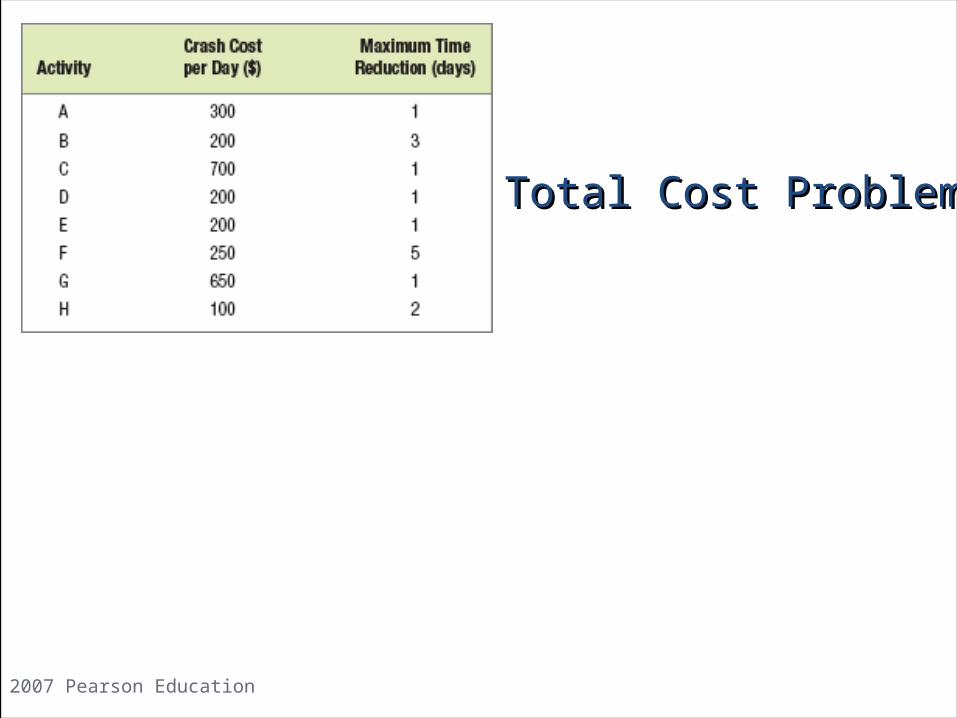
Calculating total CostCalculating total Cost Adding Adding Direct, Penalty & Overhead CostsDirect, Penalty & Overhead Costs
The overhead (indirect) costs are $200 per dayThere is a penalty of $100/day for completing project in more than 12 days
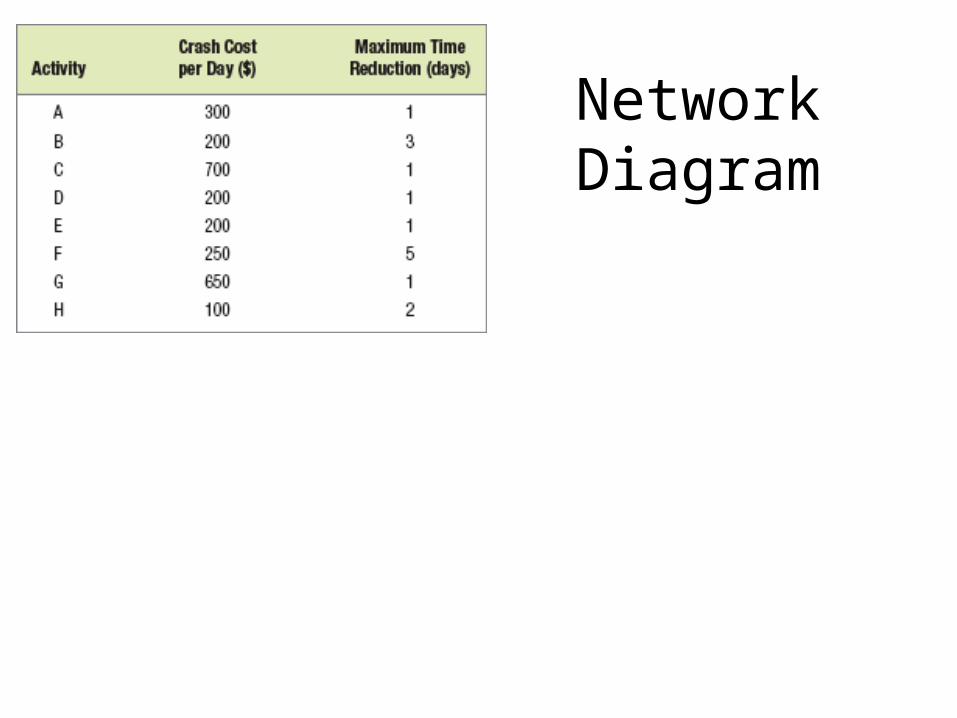
Network Diagram
© 2007 Pearson Education
Total Cost ProblemTotal Cost Problem
Assessing Risks
• Risk is a measure of the probability and consequence of not reaching a defined project goal.
• A major responsibility of the project manager at the start of a project is to develop a risk-management plan.
• A Risk-Management Plan identifies the key risks to a project’s success and prescribes ways to circumvent them.
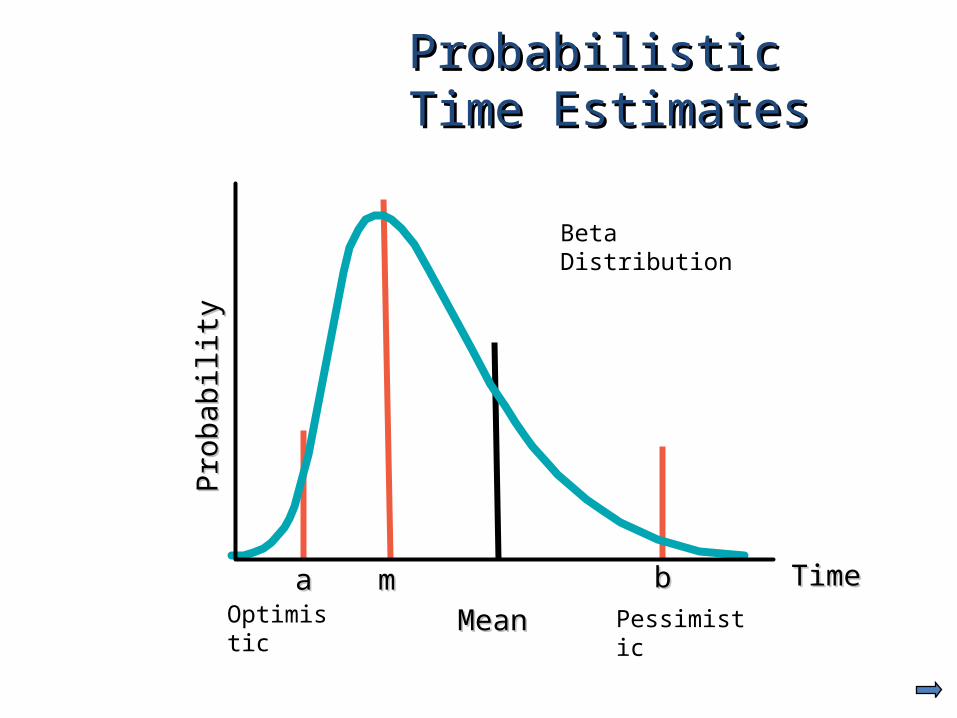
Probabilistic Probabilistic Time EstimatesTime Estimates
MeanMeanmmaa bb TimeTime
Pro
babi
lity
Pro
babi
lity
Beta Distribution
PessimisticOptimistic
TimeTime
Pro
babi
lity
Pro
babi
lity
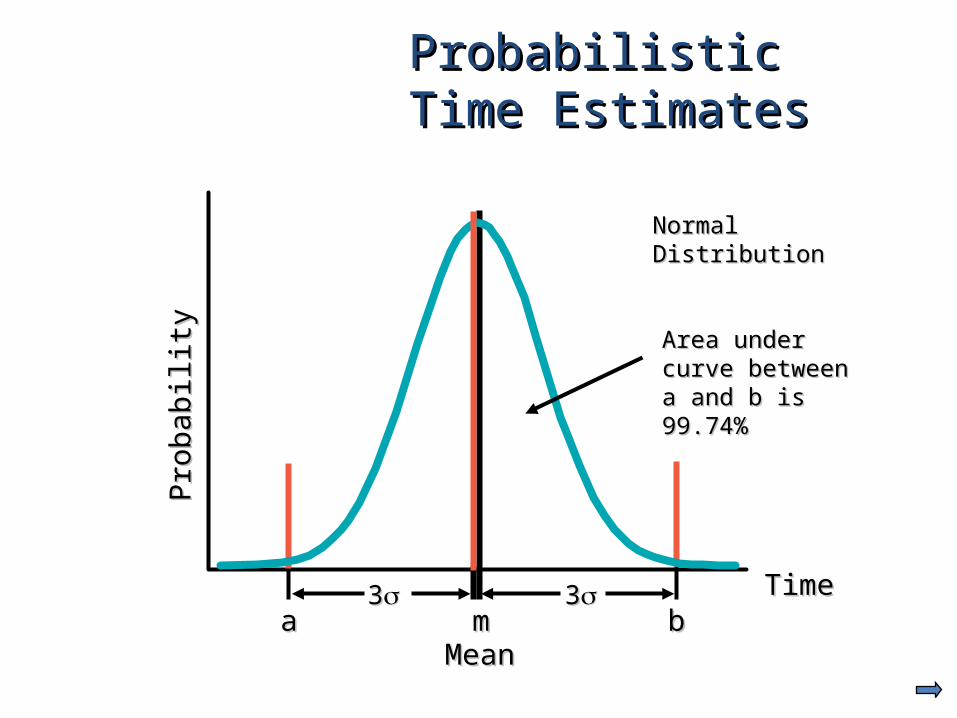
Normal Normal DistributionDistribution
MeanMeanaa bbmm
33 33
Area under curve Area under curve between a and b is between a and b is 99.74%99.74%
Probabilistic Probabilistic Time EstimatesTime Estimates
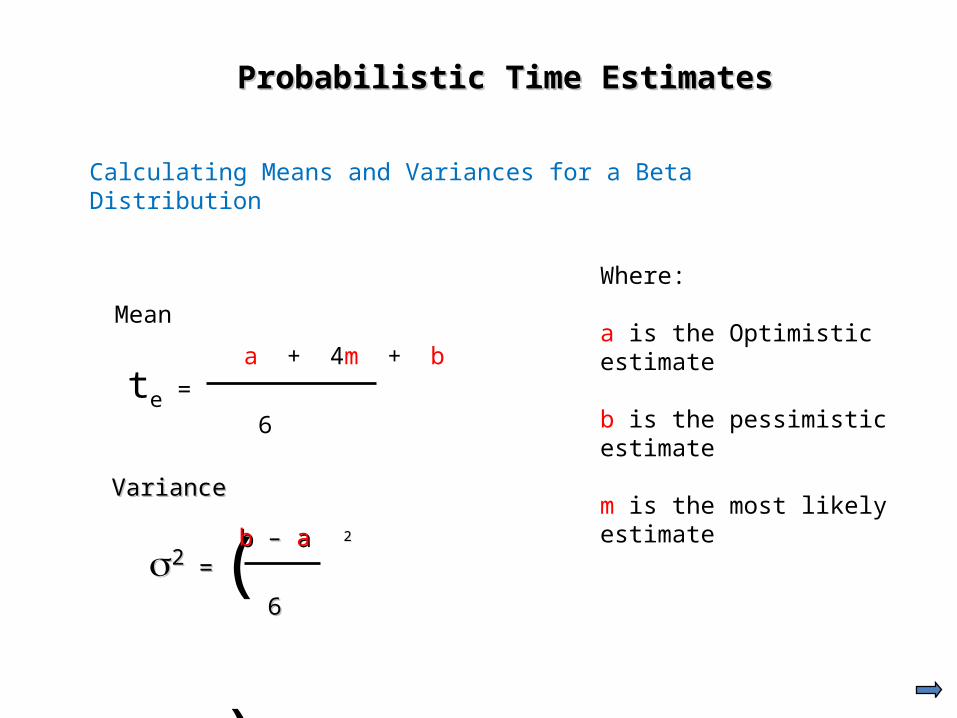
te = a + 4m + b
6
Mean
22 = = ( )
bb – – aa
66
22
VarianceVariance
Probabilistic Time EstimatesProbabilistic Time Estimates
Calculating Means and Variances for a Beta Distribution
Where:
a is the Optimistic estimate
b is the pessimistic estimate
m is the most likely estimate
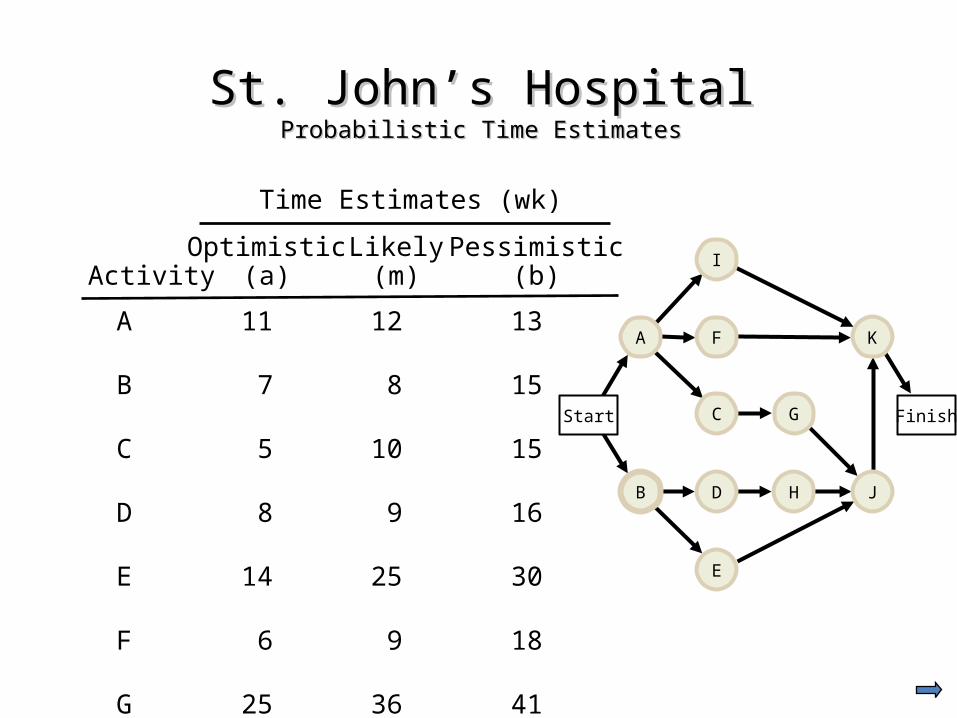
Optimistic Likely PessimisticActivity (a) (m) (b)
Time Estimates (wk)
A 11 12 13
B 7 8 15
C 5 10 15
D 8 9 16
E 14 25 30
F 6 9 18
G 25 36 41
H 35 40 45
I 10 13 28
J 1 2 15
K 5 6 7
St. John’s HospitalSt. John’s HospitalProbabilistic Time EstimatesProbabilistic Time Estimates
A F
I
C G Finish
D
E
HB J
K
Start
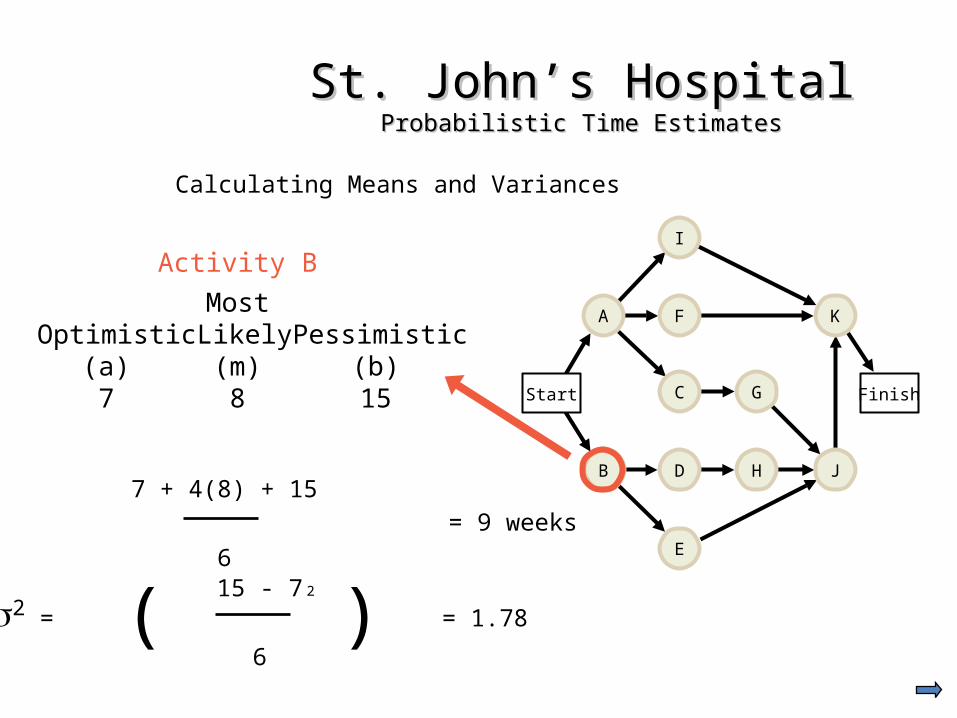
Activity BMost
Optimistic Likely Pessimistic(a) (m) (b)7 8 15
A F
I
C G Finish
D
E
HB J
K
Start
St. John’s HospitalSt. John’s HospitalProbabilistic Time EstimatesProbabilistic Time Estimates
te = = 9 weeks7 + 4(8) + 15
6
2 = = 1.78( )15 - 7
6
2
Calculating Means and Variances
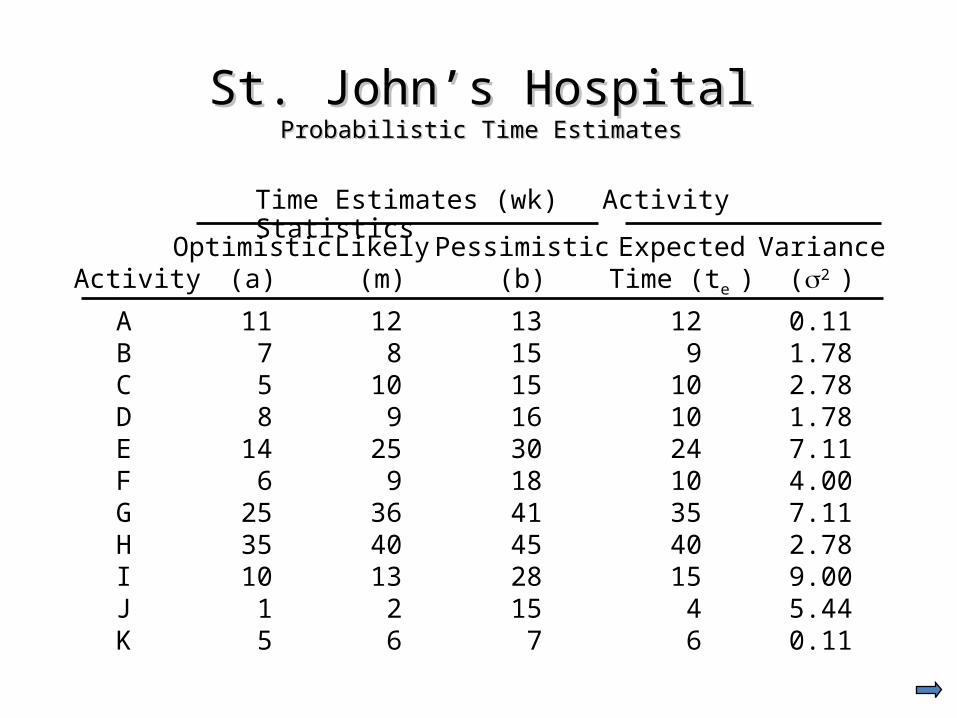
Optimistic Likely Pessimistic Expected VarianceActivity (a) (m) (b) Time (te ) (2 )
Time Estimates (wk) Activity Statistics
A 11 12 13 12 0.11B 7 8 15 9 1.78C 5 10 15 10 2.78D 8 9 16 10 1.78E 14 25 30 24 7.11F 6 9 18 10 4.00G 25 36 41 35 7.11H 35 40 45 40 2.78I 10 13 28 15 9.00J 1 2 15 4 5.44K 5 6 7 6 0.11
St. John’s HospitalSt. John’s HospitalProbabilistic Time EstimatesProbabilistic Time Estimates
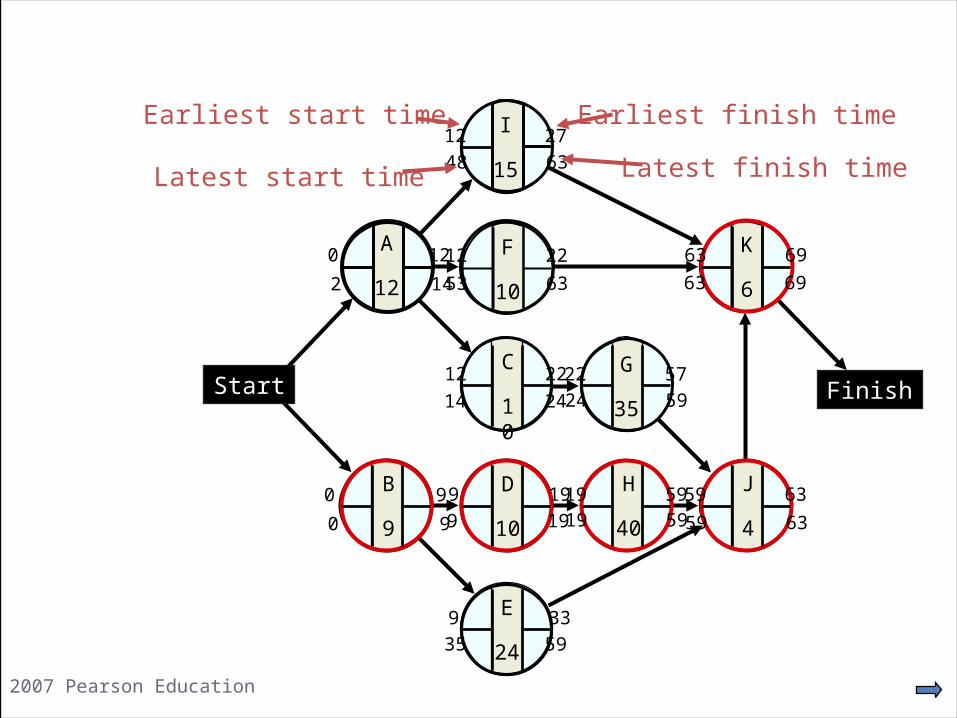
© 2007 Pearson Education
K
6
C
10
G
35
J
4
H
40
B
9
D
10
E
24
I
15
FinishStart
A
12
F
10
0 9
9 33
9 19 19 59
22 5712 22
59 63
12 27
12 22 63 690 12
48 63
53 63
59 63
24 59
19 59
35 59
14 24
9 19
2 14
0 9
63 69
Earliest start time Earliest finish time
Latest start time Latest finish time
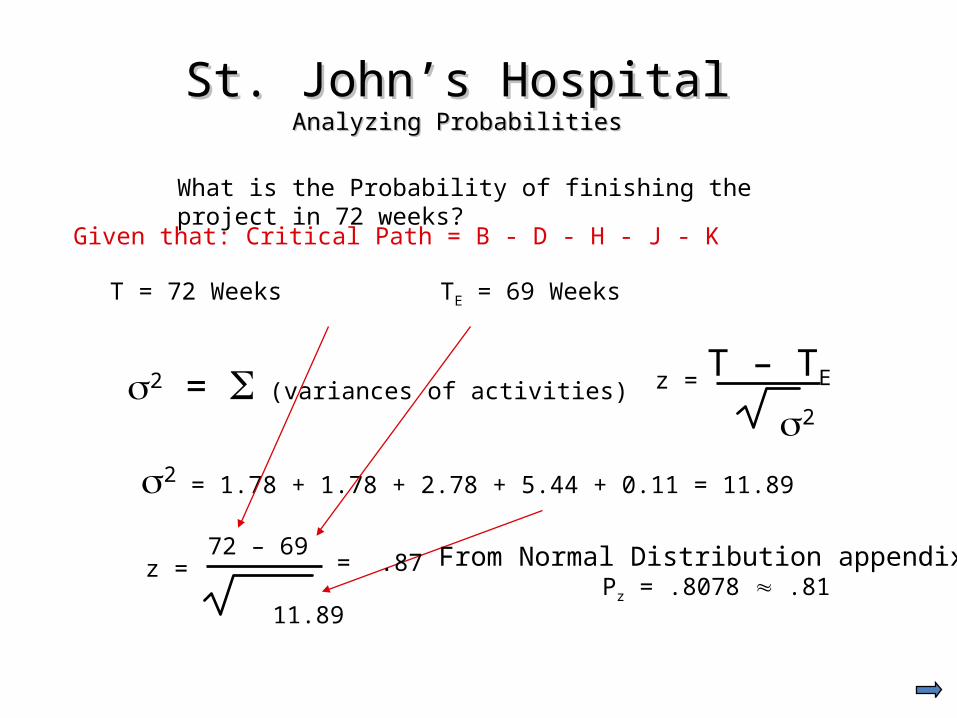
2 = (variances of activities) z = T – TE
2
2 = 1.78 + 1.78 + 2.78 + 5.44 + 0.11 = 11.89
z =72 – 69
11.89
What is the Probability of finishing the project in 72 weeks?
Given that: Critical Path = B - D - H - J - K
T = 72 Weeks TE = 69 Weeks
St. John’s HospitalSt. John’s HospitalAnalyzing ProbabilitiesAnalyzing Probabilities
From Normal Distribution appendix Pz = .8078 .81
= .87
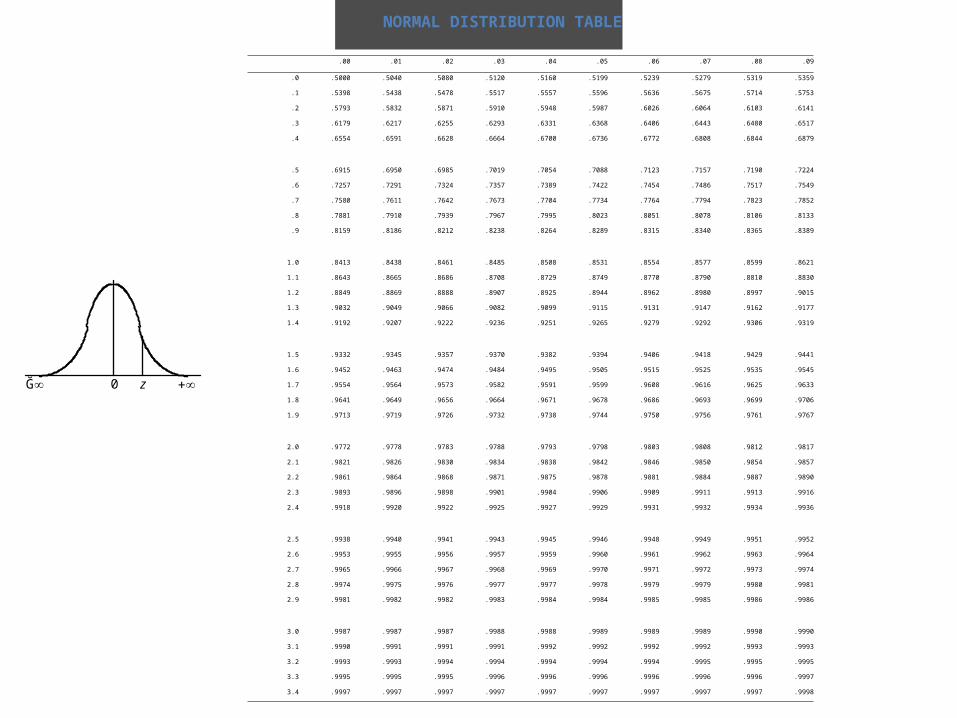
.00 .01 .02 .03 .04 .05 .06 .07 .08 .09
.0 .5000 .5040 .5080 .5120 .5160 .5199 .5239 .5279 .5319 .5359
.1 .5398 .5438 .5478 .5517 .5557 .5596 .5636 .5675 .5714 .5753
.2 .5793 .5832 .5871 .5910 .5948 .5987 .6026 .6064 .6103 .6141
.3 .6179 .6217 .6255 .6293 .6331 .6368 .6406 .6443 .6480 .6517
.4 .6554 .6591 .6628 .6664 .6700 .6736 .6772 .6808 .6844 .6879
.5 .6915 .6950 .6985 .7019 .7054 .7088 .7123 .7157 .7190 .7224
.6 .7257 .7291 .7324 .7357 .7389 .7422 .7454 .7486 .7517 .7549
.7 .7580 .7611 .7642 .7673 .7704 .7734 .7764 .7794 .7823 .7852
.8 .7881 .7910 .7939 .7967 .7995 .8023 .8051 .8078 .8106 .8133
.9 .8159 .8186 .8212 .8238 .8264 .8289 .8315 .8340 .8365 .8389
1.0 .8413 .8438 .8461 .8485 .8508 .8531 .8554 .8577 .8599 .8621
1.1 .8643 .8665 .8686 .8708 .8729 .8749 .8770 .8790 .8810 .8830
1.2 .8849 .8869 .8888 .8907 .8925 .8944 .8962 .8980 .8997 .9015
1.3 .9032 .9049 .9066 .9082 .9099 .9115 .9131 .9147 .9162 .9177
1.4 .9192 .9207 .9222 .9236 .9251 .9265 .9279 .9292 .9306 .9319
1.5 .9332 .9345 .9357 .9370 .9382 .9394 .9406 .9418 .9429 .9441
1.6 .9452 .9463 .9474 .9484 .9495 .9505 .9515 .9525 .9535 .9545
1.7 .9554 .9564 .9573 .9582 .9591 .9599 .9608 .9616 .9625 .9633
1.8 .9641 .9649 .9656 .9664 .9671 .9678 .9686 .9693 .9699 .9706
1.9 .9713 .9719 .9726 .9732 .9738 .9744 .9750 .9756 .9761 .9767
2.0 .9772 .9778 .9783 .9788 .9793 .9798 .9803 .9808 .9812 .9817
2.1 .9821 .9826 .9830 .9834 .9838 .9842 .9846 .9850 .9854 .9857
2.2 .9861 .9864 .9868 .9871 .9875 .9878 .9881 .9884 .9887 .9890
2.3 .9893 .9896 .9898 .9901 .9904 .9906 .9909 .9911 .9913 .9916
2.4 .9918 .9920 .9922 .9925 .9927 .9929 .9931 .9932 .9934 .9936
2.5 .9938 .9940 .9941 .9943 .9945 .9946 .9948 .9949 .9951 .9952
2.6 .9953 .9955 .9956 .9957 .9959 .9960 .9961 .9962 .9963 .9964
2.7 .9965 .9966 .9967 .9968 .9969 .9970 .9971 .9972 .9973 .9974
2.8 .9974 .9975 .9976 .9977 .9977 .9978 .9979 .9979 .9980 .9981
2.9 .9981 .9982 .9982 .9983 .9984 .9984 .9985 .9985 .9986 .9986
3.0 .9987 .9987 .9987 .9988 .9988 .9989 .9989 .9989 .9990 .9990
3.1 .9990 .9991 .9991 .9991 .9992 .9992 .9992 .9992 .9993 .9993
3.2 .9993 .9993 .9994 .9994 .9994 .9994 .9994 .9995 .9995 .9995
3.3 .9995 .9995 .9995 .9996 .9996 .9996 .9996 .9996 .9996 .9997
3.4 .9997 .9997 .9997 .9997 .9997 .9997 .9997 .9997 .9997 .9998
NORMAL DISTRIBUTION TABLE
z0 Ğ
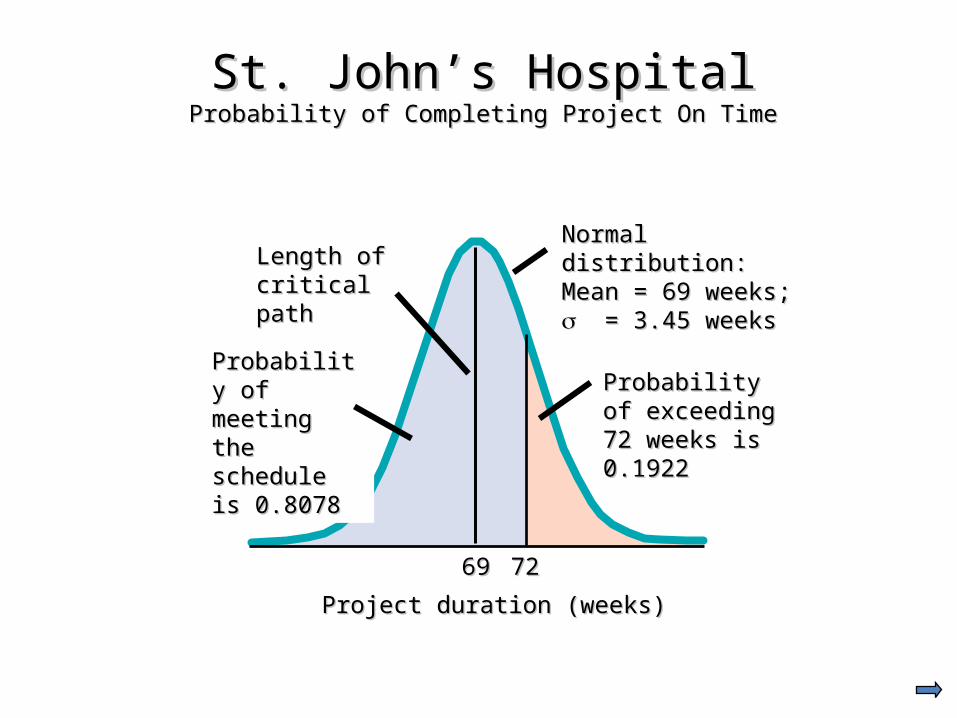
Project duration (weeks)Project duration (weeks)
6969 7272
Normal distribution: Normal distribution: Mean = 69 weeks; Mean = 69 weeks; = 3.45 weeks = 3.45 weeks
Probability of Probability of exceeding 72 exceeding 72 weeks is 0.1922 weeks is 0.1922
St. John’s HospitalSt. John’s HospitalProbability of Completing Project On TimeProbability of Completing Project On Time
Probability of Probability of meeting the meeting the schedule is schedule is 0.80780.8078
Length of Length of critical pathcritical path
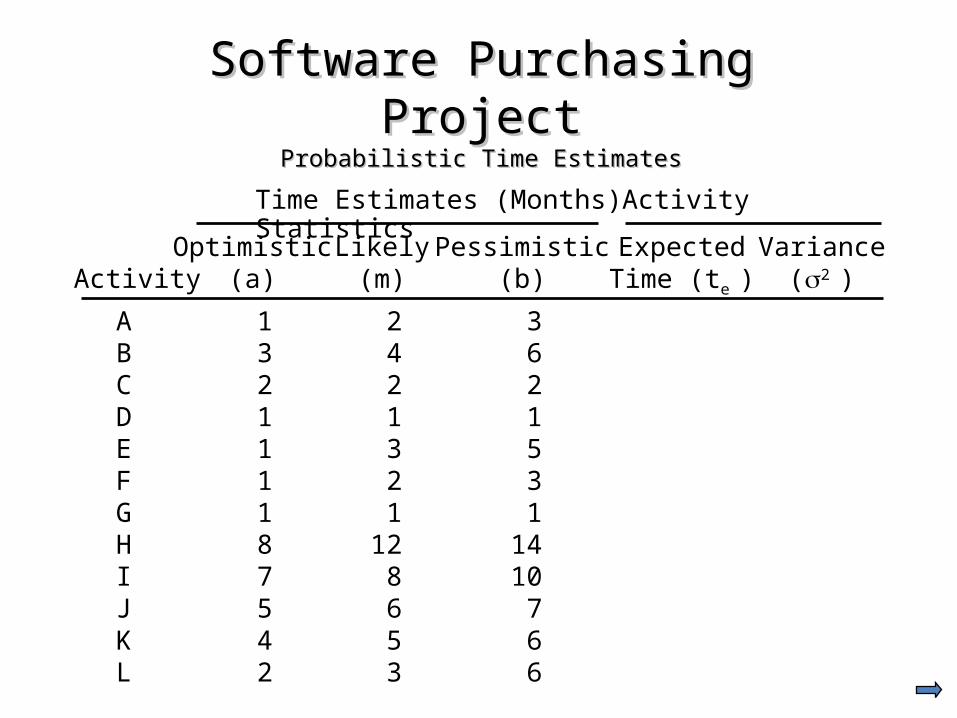
Optimistic Likely Pessimistic Expected VarianceActivity (a) (m) (b) Time (te ) (2 )
Time Estimates (Months) Activity Statistics
A 1 2 3B 3 4 6C 2 2 2D 1 1 1E 1 3 5F 1 2 3G 1 1 1H 8 12 14I 7 8 10J 5 6 7K 4 5 6L 2 3 6
Software Purchasing ProjectSoftware Purchasing ProjectProbabilistic Time EstimatesProbabilistic Time Estimates
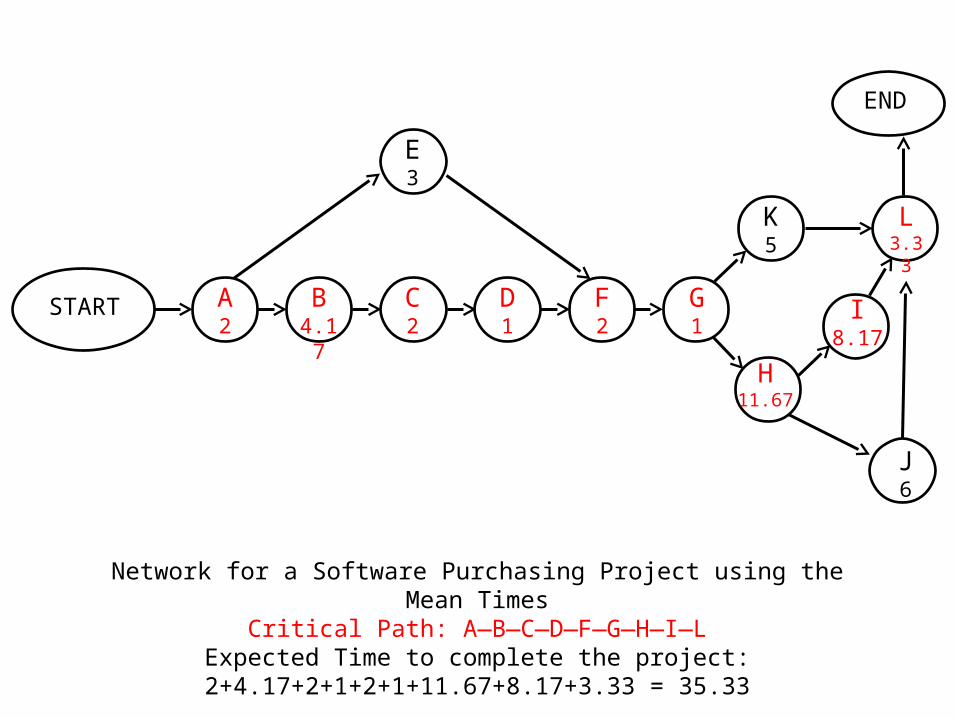
START A2
B 4.17
C2
D1
F2
G1
H11.67
J6
I8.17
K5
L3.33
END
E3
Network for a Software Purchasing Project using the Mean TimesCritical Path: A—B—C—D—F—G—H—I—L
Expected Time to complete the project: 2+4.17+2+1+2+1+11.67+8.17+3.33 = 35.33

What is the probability in finishing in less than 37 months?
What is the probability in finishing in less than 31 months?