Embed Size (px)
Citation preview
Gambit Consulting Ltd Presentation for
Calgary SAS Users Group 08 Nov. 2013
Analyzing Enhanced Oil Recovery using SAS
Multi-Dimensional Analytics and Visualization
of Fluid Communication
Leon Fedenczuk (Ph.D.)
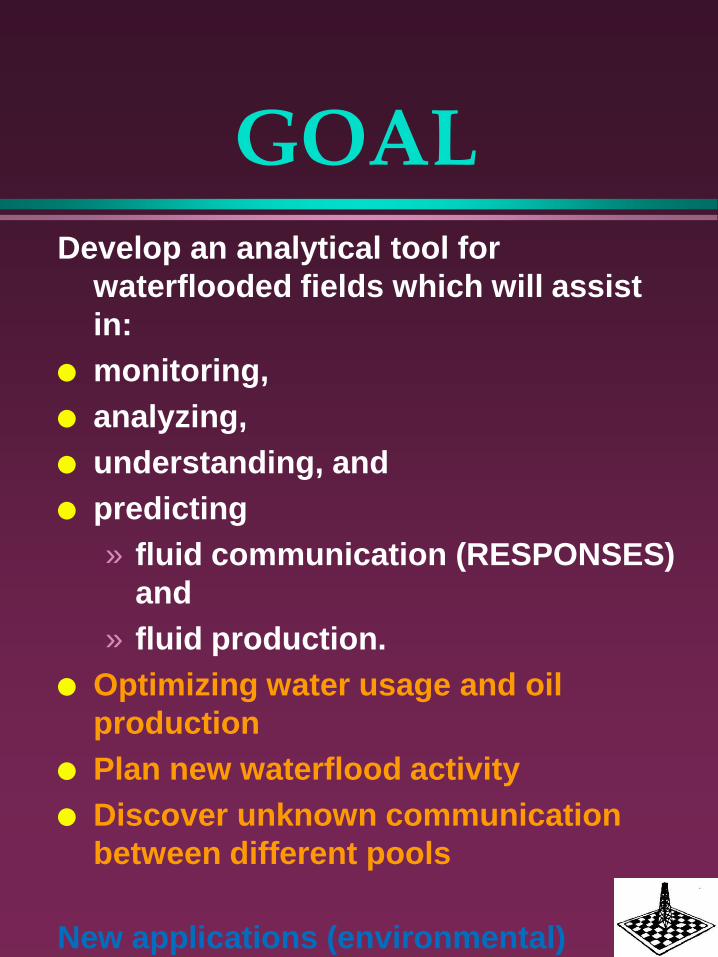
GOAL Develop an analytical tool for
waterflooded fields which will assist
in:
monitoring,
analyzing,
understanding, and
predicting
» fluid communication (RESPONSES)
and
» fluid production.
Optimizing water usage and oil
production
Plan new waterflood activity
Discover unknown communication
between different pools
New applications (environmental)
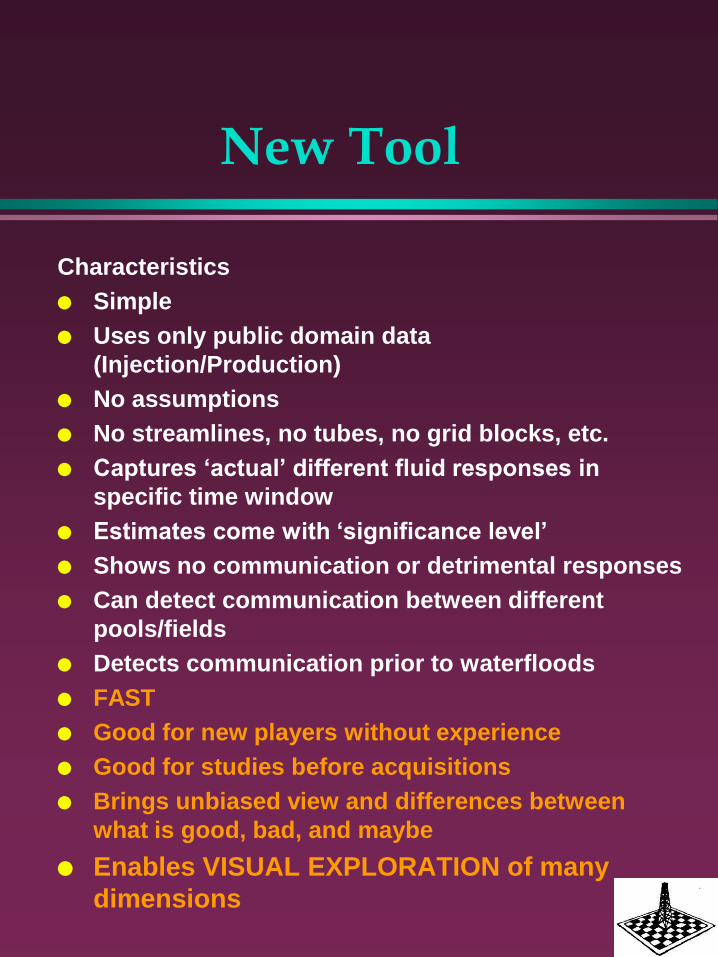
New Tool
Characteristics
Simple
Uses only public domain data
(Injection/Production)
No assumptions
No streamlines, no tubes, no grid blocks, etc.
Captures ‘actual’ different fluid responses in
specific time window
Estimates come with ‘significance level’
Shows no communication or detrimental responses
Can detect communication between different
pools/fields
Detects communication prior to waterfloods
FAST
Good for new players without experience
Good for studies before acquisitions
Brings unbiased view and differences between
what is good, bad, and maybe
Enables VISUAL EXPLORATION of many
dimensions
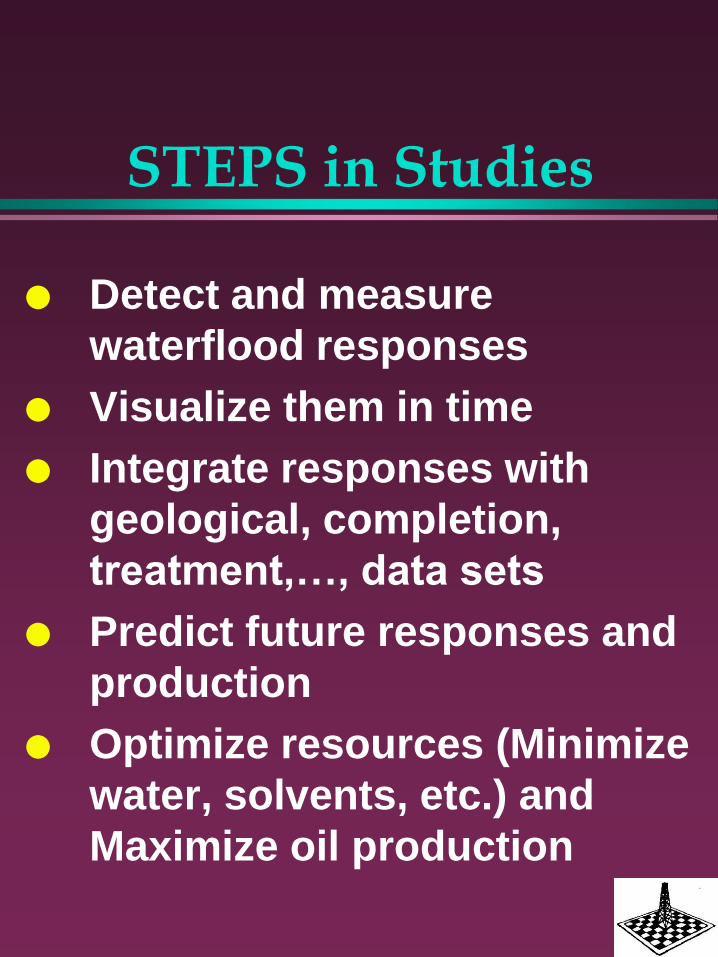
STEPS in Studies
Detect and measure
waterflood responses
Visualize them in time
Integrate responses with
geological, completion,
treatment,…, data sets
Predict future responses and
production
Optimize resources (Minimize
water, solvents, etc.) and
Maximize oil production

Published
Journal of Canadian Petroleum Technology, vol. 40, No. 6
Journal of Canadian Petroleum Technology, No.5, Vol.46 SPE 50430 and more
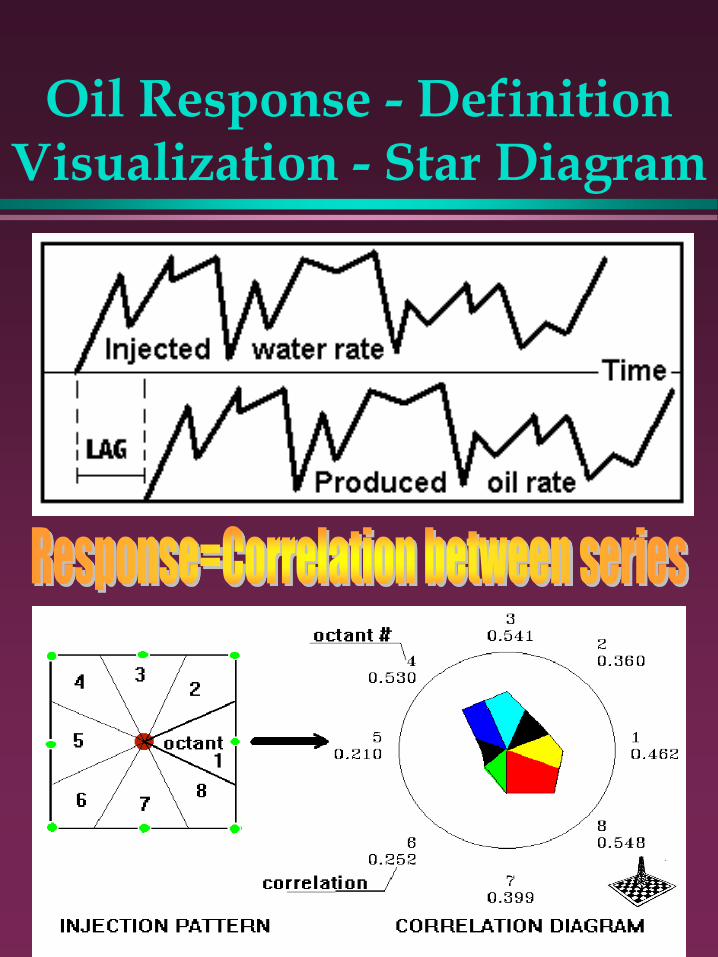
Oil Response - Definition
Visualization - Star Diagram
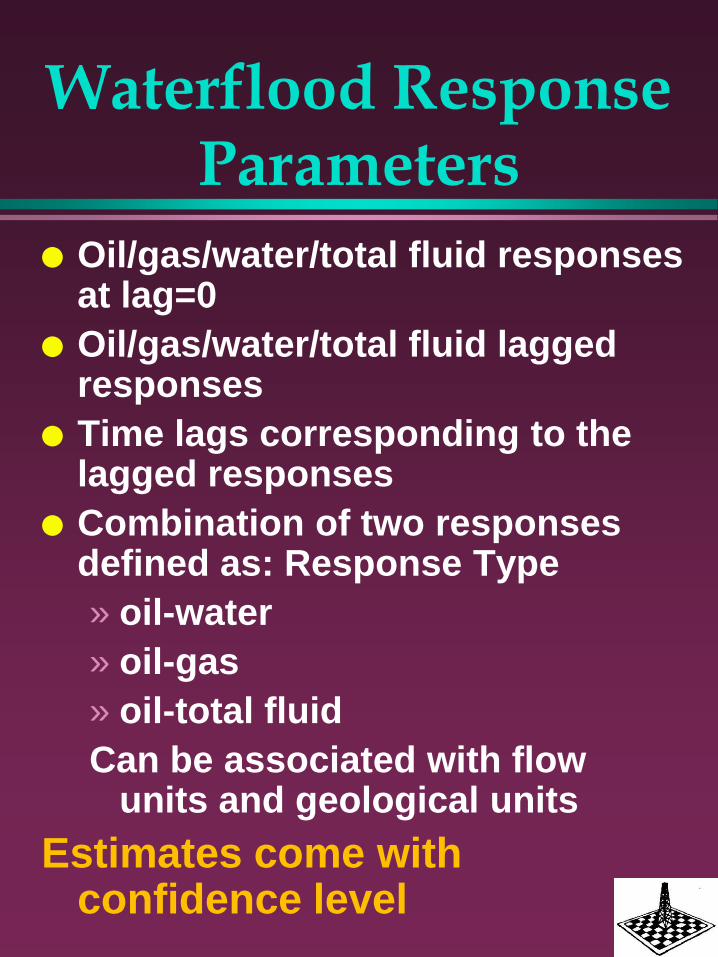
Waterflood Response Parameters
Oil/gas/water/total fluid responses at lag=0
Oil/gas/water/total fluid lagged responses
Time lags corresponding to the lagged responses
Combination of two responses defined as: Response Type
» oil-water
» oil-gas
» oil-total fluid
Can be associated with flow units and geological units
Estimates come with confidence level
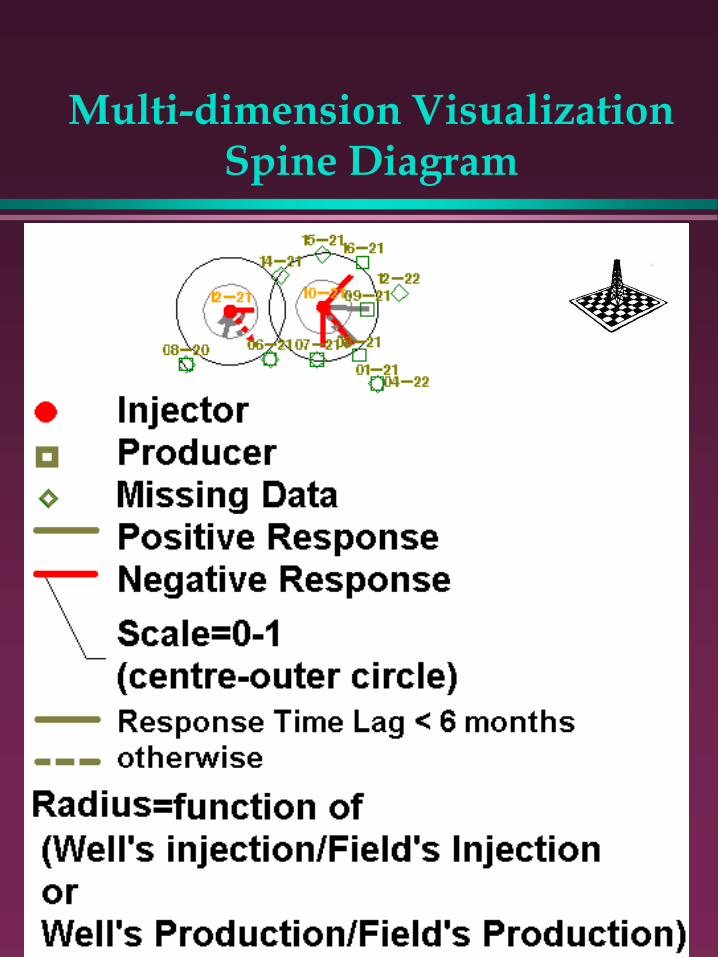
Multi-dimension Visualization Spine Diagram
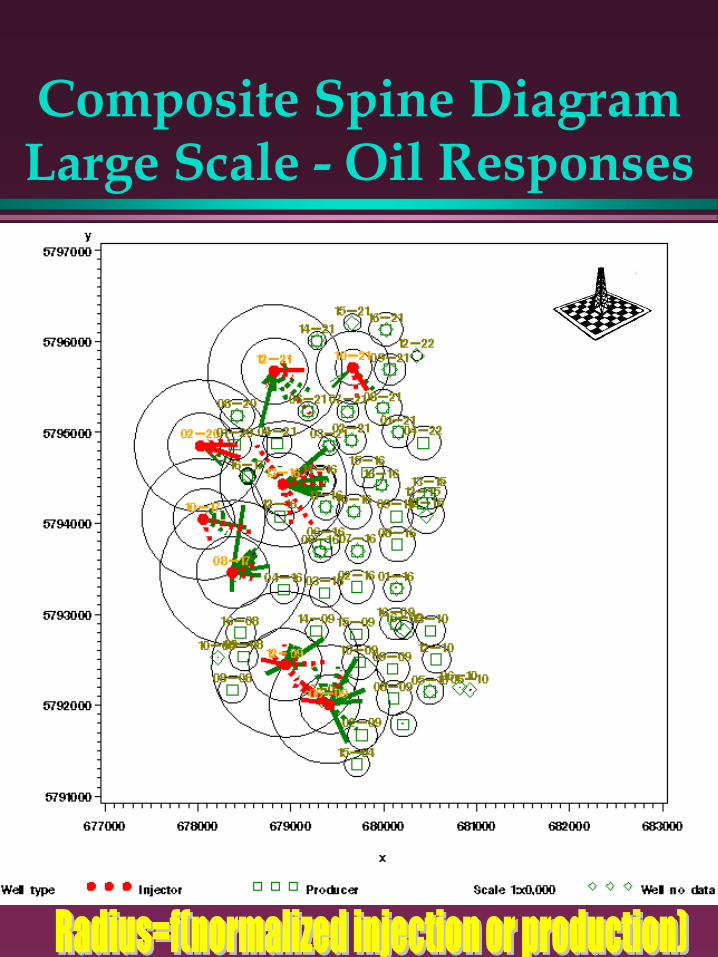
Composite Spine Diagram Large Scale - Oil Responses
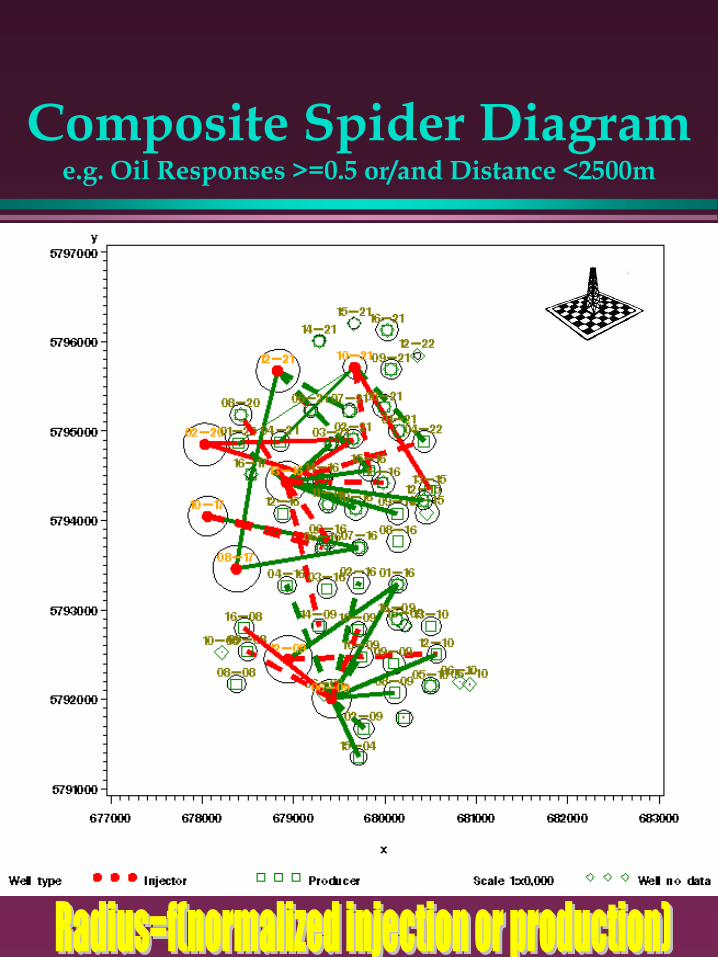
Composite Spider Diagram e.g. Oil Responses >=0.5 or/and Distance <2500m
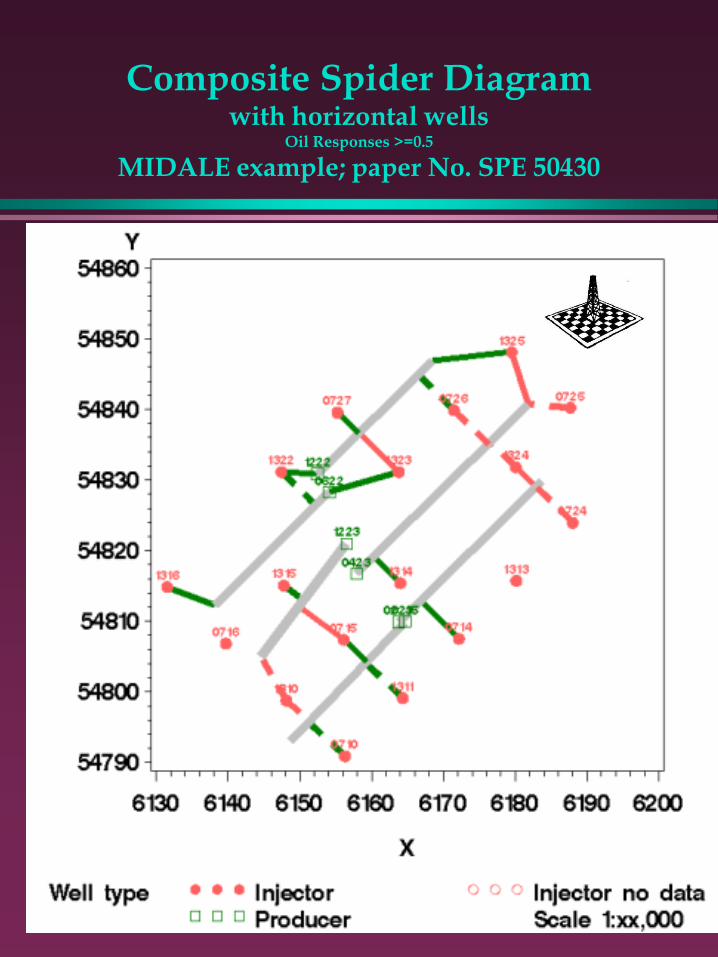
Composite Spider Diagram with horizontal wells
Oil Responses >=0.5
MIDALE example; paper No. SPE 50430
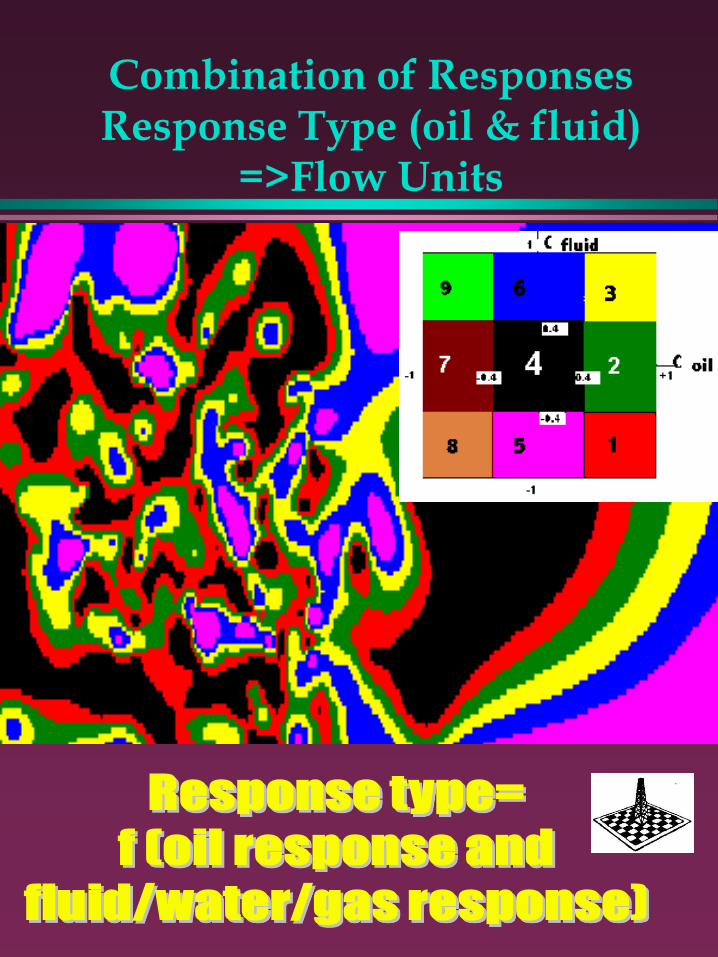
Combination of Responses Response Type (oil & fluid)
=>Flow Units
Application of Responses
Finding communication paths
and boundaries
Mapping flow units
Identifying ineffective injectors
Identifying producers without
support
Improving production allocation
estimates
Identifying areas with fluid loses
Predicting future responses
Developing infill programs
Generating correction maps for
reservoir simulation.
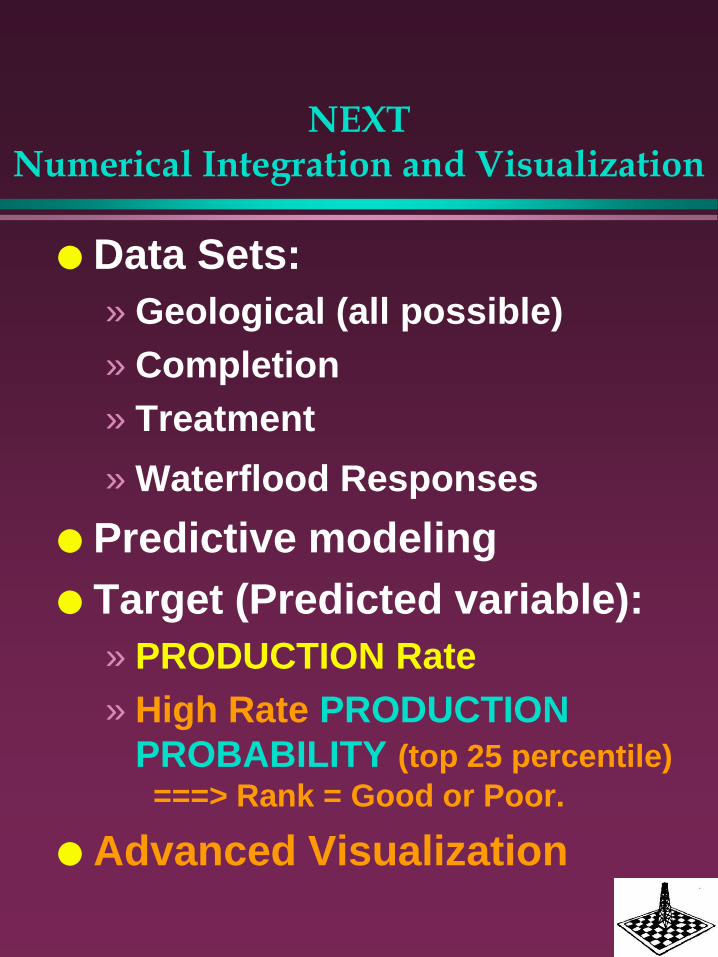
NEXT Numerical Integration and Visualization
Data Sets:
» Geological (all possible)
» Completion
» Treatment
» Waterflood Responses
Predictive modeling
Target (Predicted variable):
» PRODUCTION Rate
» High Rate PRODUCTION
PROBABILITY (top 25 percentile)
===> Rank = Good or Poor.
Advanced Visualization
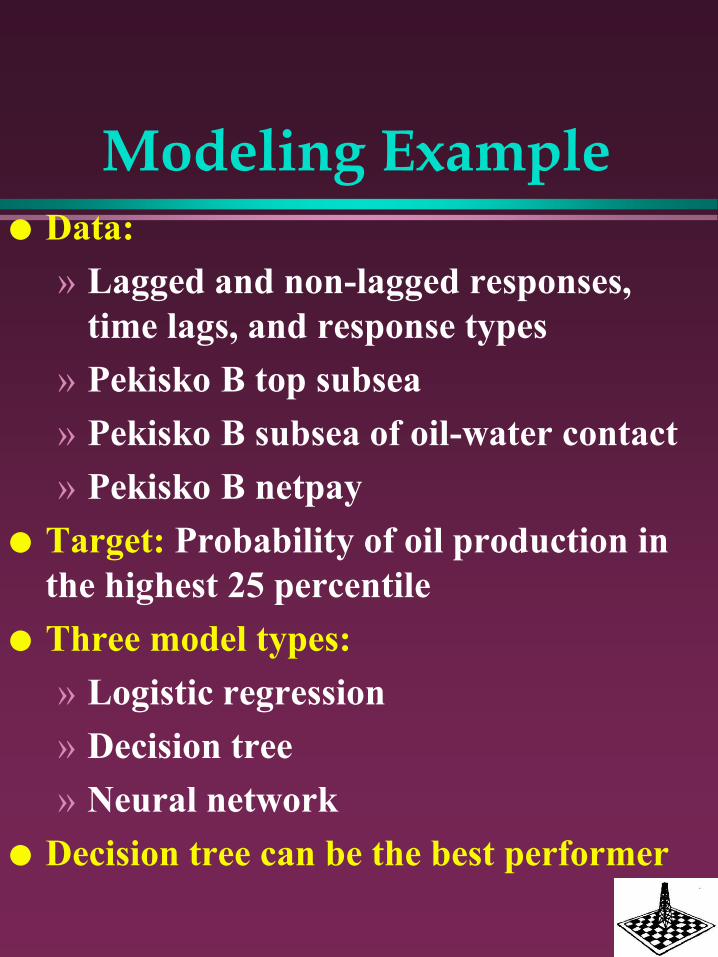
Modeling Example Data:
» Lagged and non-lagged responses,
time lags, and response types
» Pekisko B top subsea
» Pekisko B subsea of oil-water contact
» Pekisko B netpay
Target: Probability of oil production in
the highest 25 percentile
Three model types:
» Logistic regression
» Decision tree
» Neural network
Decision tree can be the best performer
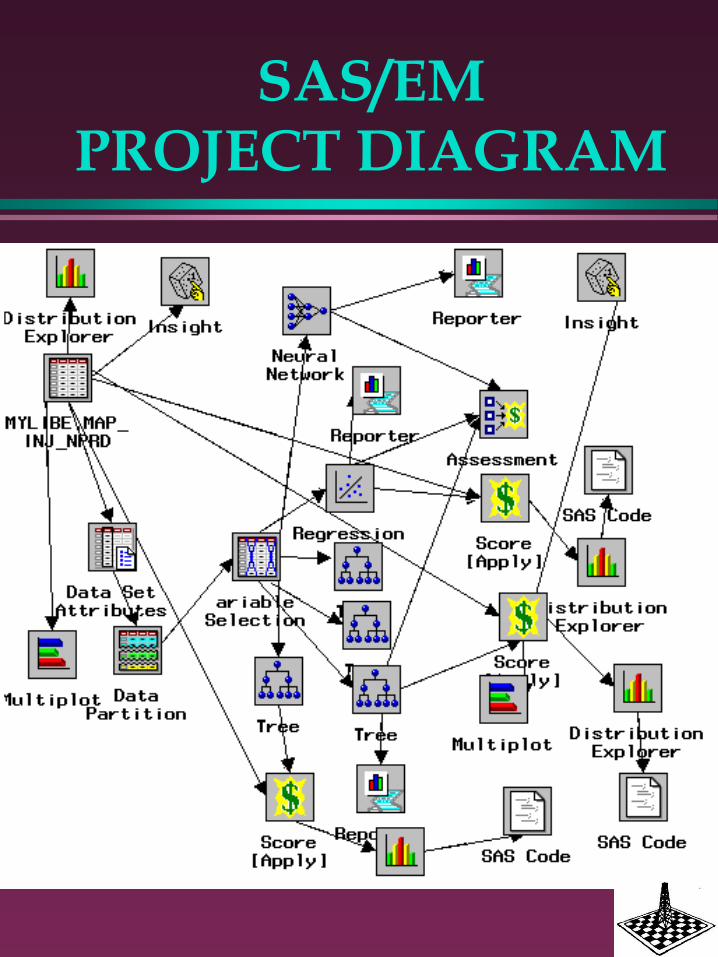
SAS/EM PROJECT DIAGRAM

Decision Tree = Set of English Rules
IF 16.0 <= P_NET_OIL and C_OIL_0 < -0.045 THEN
N : 25 0 : 20.0% 1 : 80.0%
IF 16.0 <= P_NET_OIL and -0.045 <= C_OIL_0 < 0.26 and P_SUB_TOP < -1252.21 THEN
N : 23 1 : 65.2% 0 : 34.8%
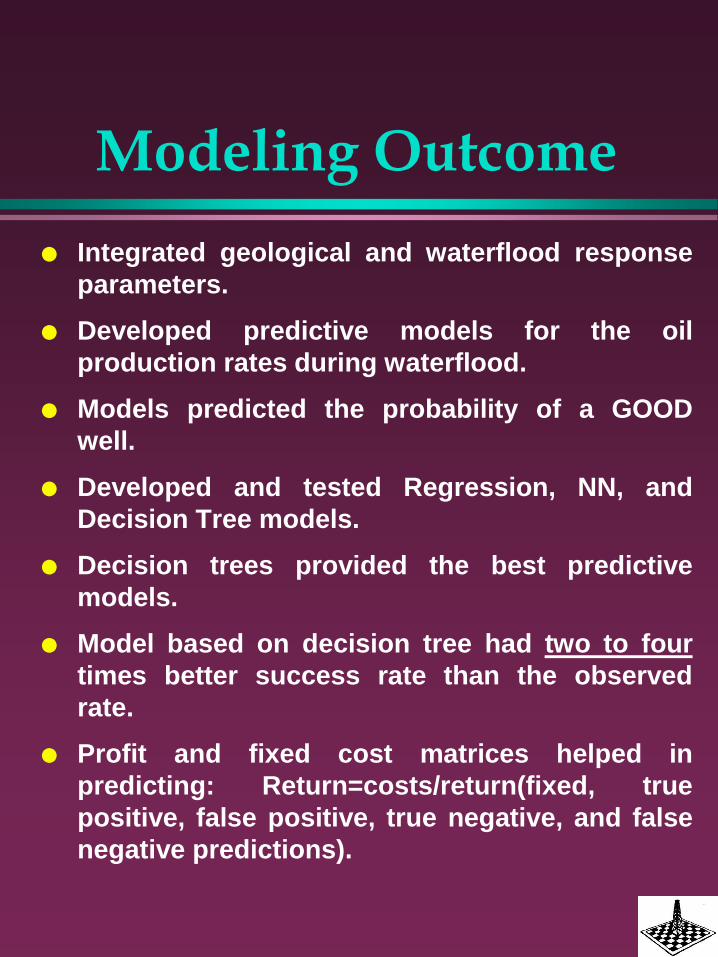
Modeling Outcome
Integrated geological and waterflood response
parameters.
Developed predictive models for the oil
production rates during waterflood.
Models predicted the probability of a GOOD
well.
Developed and tested Regression, NN, and
Decision Tree models.
Decision trees provided the best predictive
models.
Model based on decision tree had two to four
times better success rate than the observed
rate.
Profit and fixed cost matrices helped in
predicting: Return=costs/return(fixed, true
positive, false positive, true negative, and false
negative predictions).
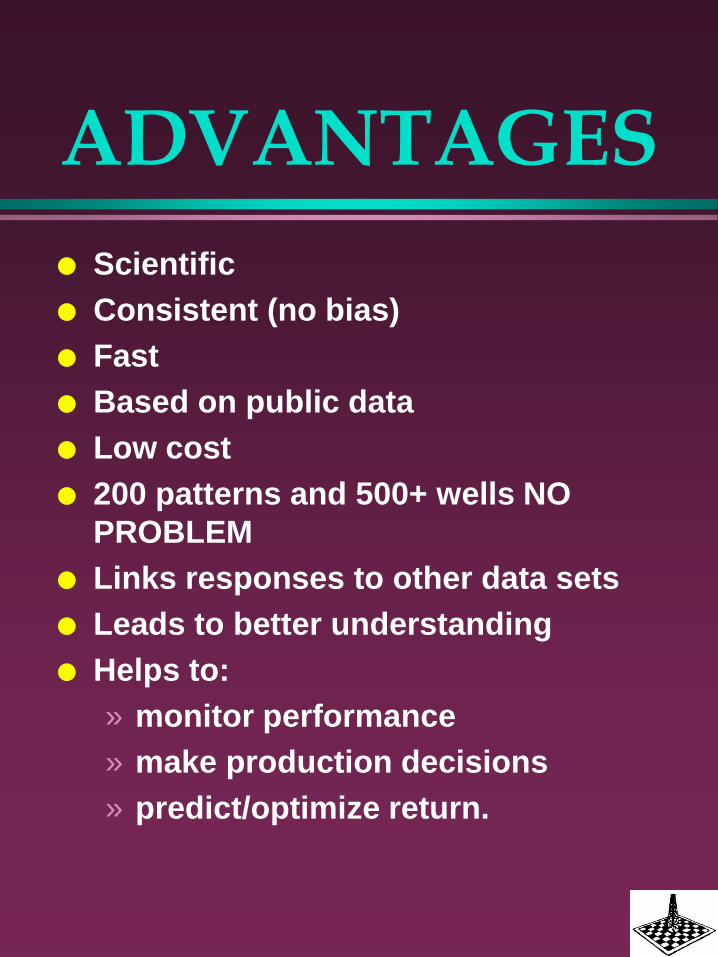
ADVANTAGES
Scientific
Consistent (no bias)
Fast
Based on public data
Low cost
200 patterns and 500+ wells NO
PROBLEM
Links responses to other data sets
Leads to better understanding
Helps to:
» monitor performance
» make production decisions
» predict/optimize return.
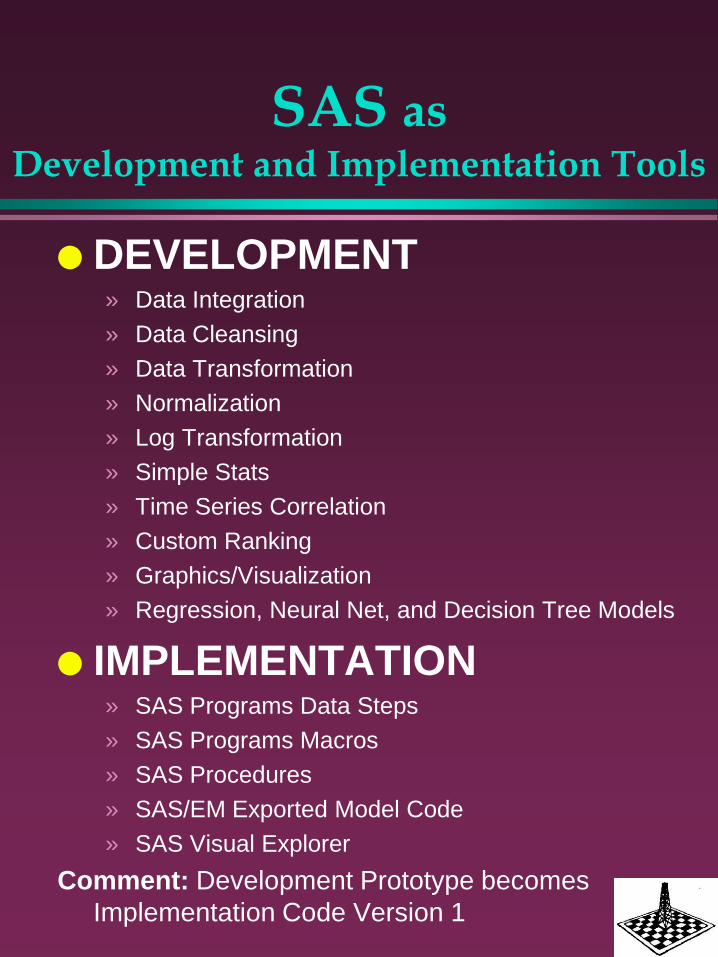
SAS as
Development and Implementation Tools
DEVELOPMENT » Data Integration
» Data Cleansing
» Data Transformation
» Normalization
» Log Transformation
» Simple Stats
» Time Series Correlation
» Custom Ranking
» Graphics/Visualization
» Regression, Neural Net, and Decision Tree Models
IMPLEMENTATION » SAS Programs Data Steps
» SAS Programs Macros
» SAS Procedures
» SAS/EM Exported Model Code
» SAS Visual Explorer
Comment: Development Prototype becomes
Implementation Code Version 1