Embed Size (px)
Citation preview
Analyzing Ionospheric Effects on WWV Timing Signals
Shad Nygren
Datron World Communications
February 7th 2008
My Background
• Senior Software Engineer at Datron• Amateur Radio Extra Class – KD7WMX• MS and BS in Computer Science• Recently accepted to work on my Ph.D. and I am
interested in scientific research• High Speed Data• OFDM / 802.11g / 802.11n / WiMAX• New to HF – I’ve been with Datron for 2 years• Originally thought 10.7MHz IF is in the middle of HF
band so HF is IF but learned HF is NOT IF
Project Description
• Started out as project to measure height of ionosphere
• I learned about the Watterson Model• I learned there was a great deal of interest in the
industry to develop improved ionosphere models, especially wideband models for data
• This project evolved to collect data to support future development of new models
Watterson Model
• Developed in 1970 and has become the standard for HF channel modeling.
• Proposed a stationary model for the HF channel• Performed limited set of on-air measurements to
experimentally validate the model• Experiment showed that the model was valid for
short times (≈ 10 minutes) and for band-limited channels (approximately 10 kHz).
HF Channel Model
• According to Watterson Paper:• HF ionospheric channels are nonstationary
in both frequency and time• If consideration is restricted to band-limited
channels (say, 10 kHz) and sufficiently short times (say, 10 minutes), most channels are nearly stationary and can be adequately represented by a stationary model.

Questions
• How does the ionosphere affect signals that are not within the scope of the Watterson Model?
• What could be done to develop improved models?
• What sources could I use to explore the Ionosphere?
WWV Signal
• WWV operates in the high frequency (HF) portion of the radio spectrum.
• The station radiates 10KW on 5, 10, and 15 MHz; and 2500 W on 2.5 and 20 MHz.
• Each frequency is broadcast from a separate transmitter.
• Each frequency carries the same information
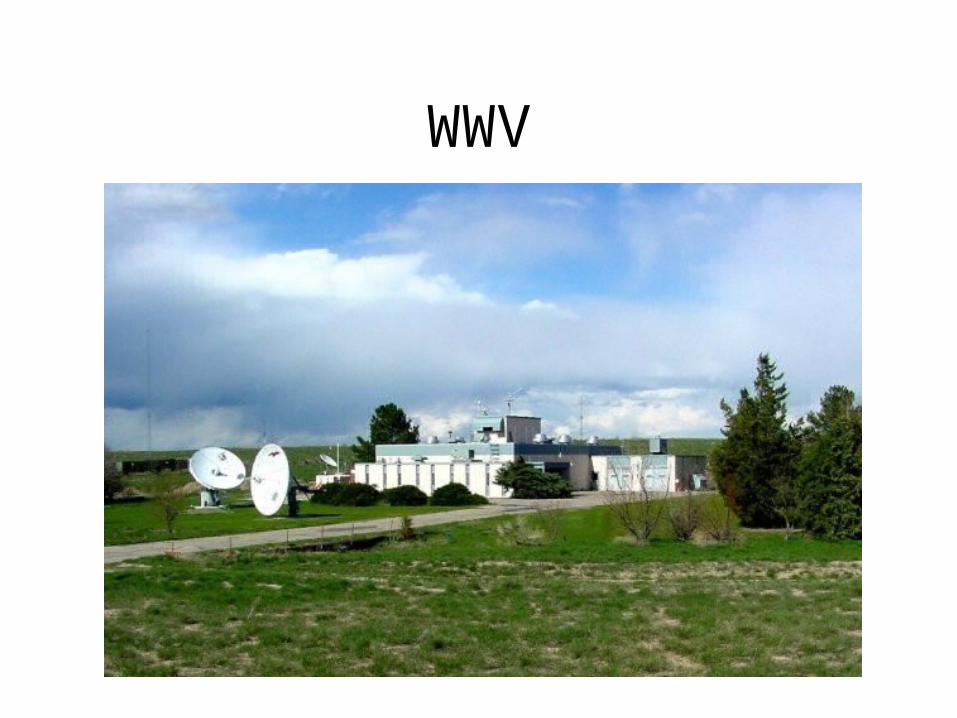
WWV
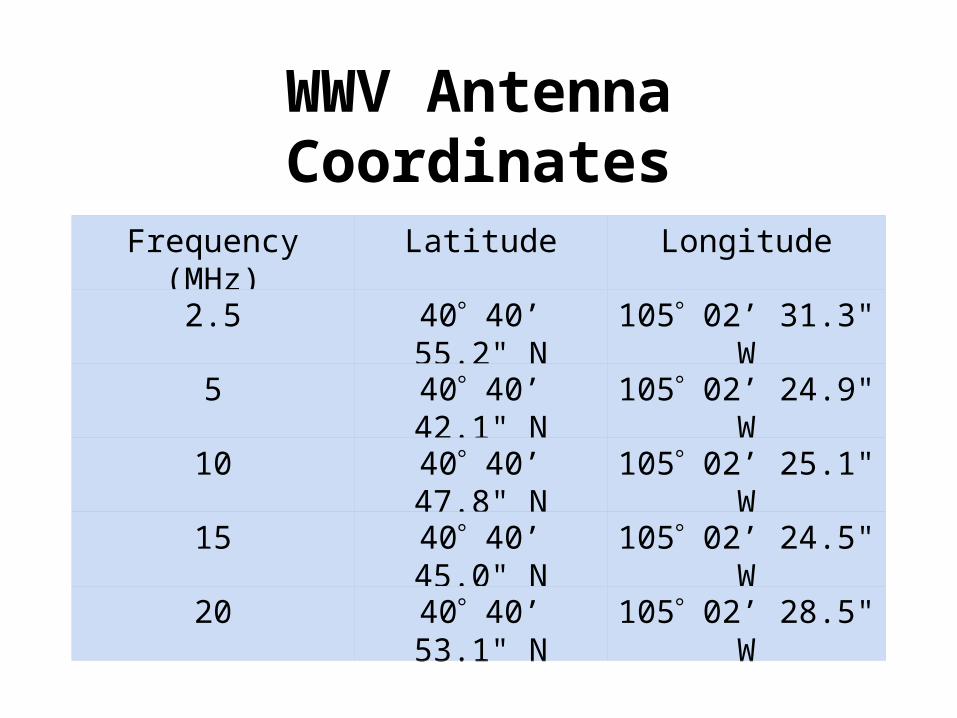
WWV Antenna Coordinates
Frequency (MHz) Latitude Longitude
2.5 40 40’ 55.2" N 105 02’ 31.3" W
5 40 40’ 42.1" N 105 02’ 24.9" W
10 40 40’ 47.8" N 105 02’ 25.1" W
15 40 40’ 45.0" N 105 02’ 24.5" W
20 40 40’ 53.1" N 105 02’ 28.5" W

WWV Signal Format

Experiment Block Diagram
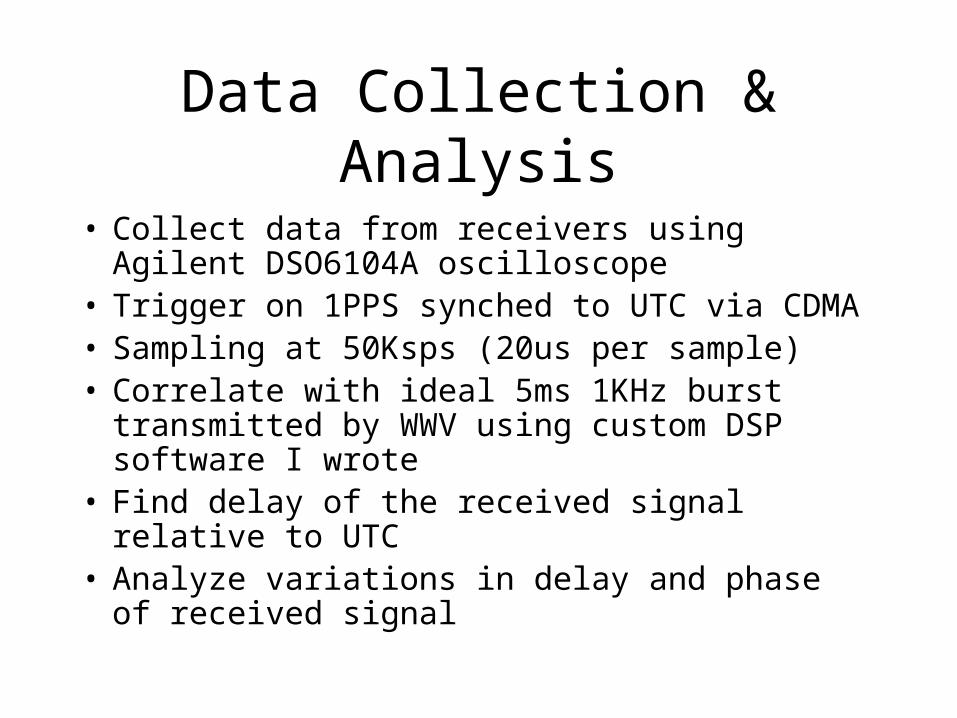
Data Collection & Analysis
• Collect data from receivers using Agilent DSO6104A oscilloscope
• Trigger on 1PPS synched to UTC via CDMA• Sampling at 50Ksps (20us per sample)• Correlate with ideal 5ms 1KHz burst transmitted
by WWV using custom DSP software I wrote• Find delay of the received signal relative to UTC• Analyze variations in delay and phase of received
signal
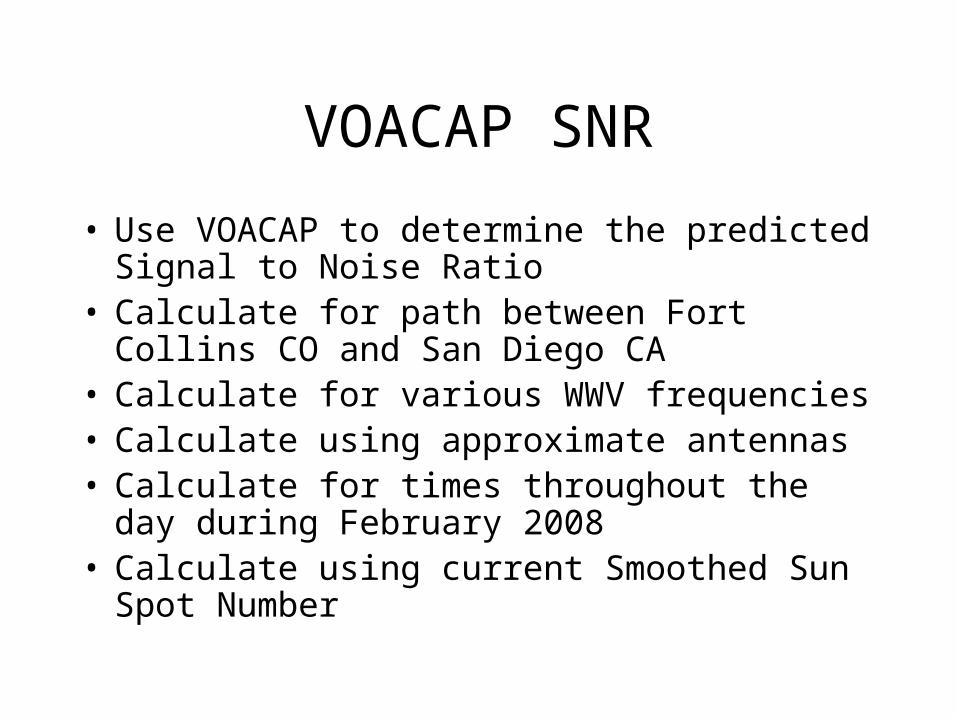
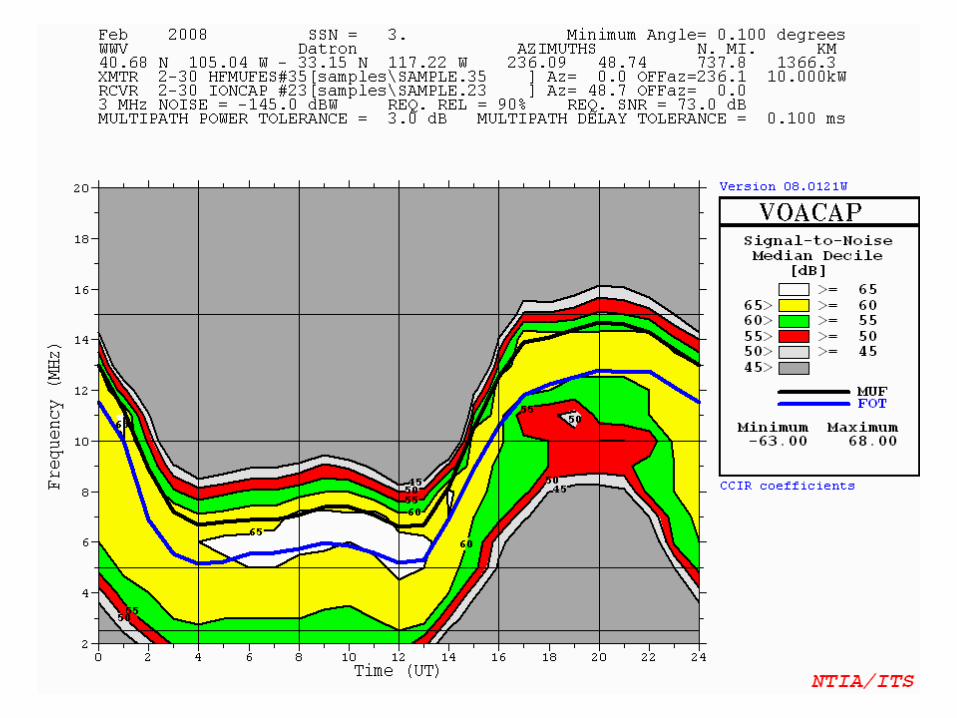
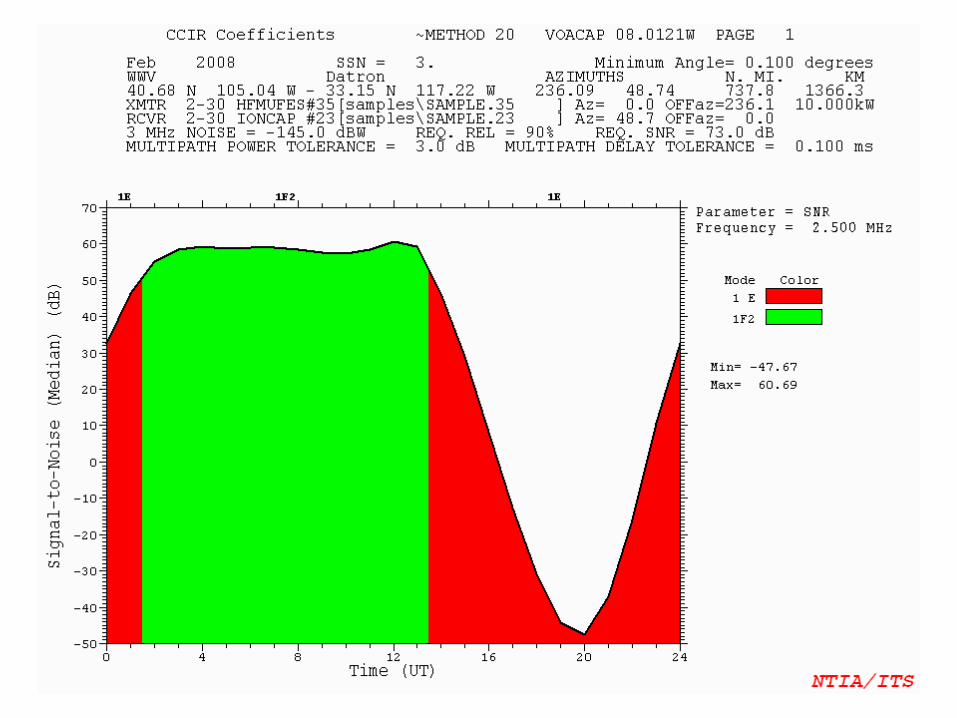
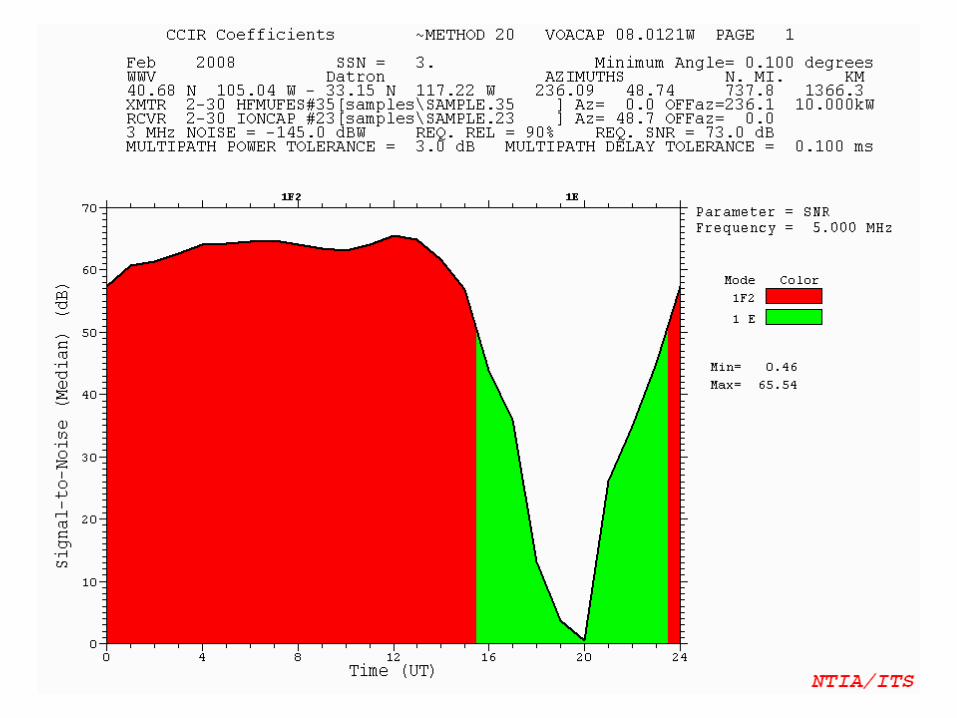
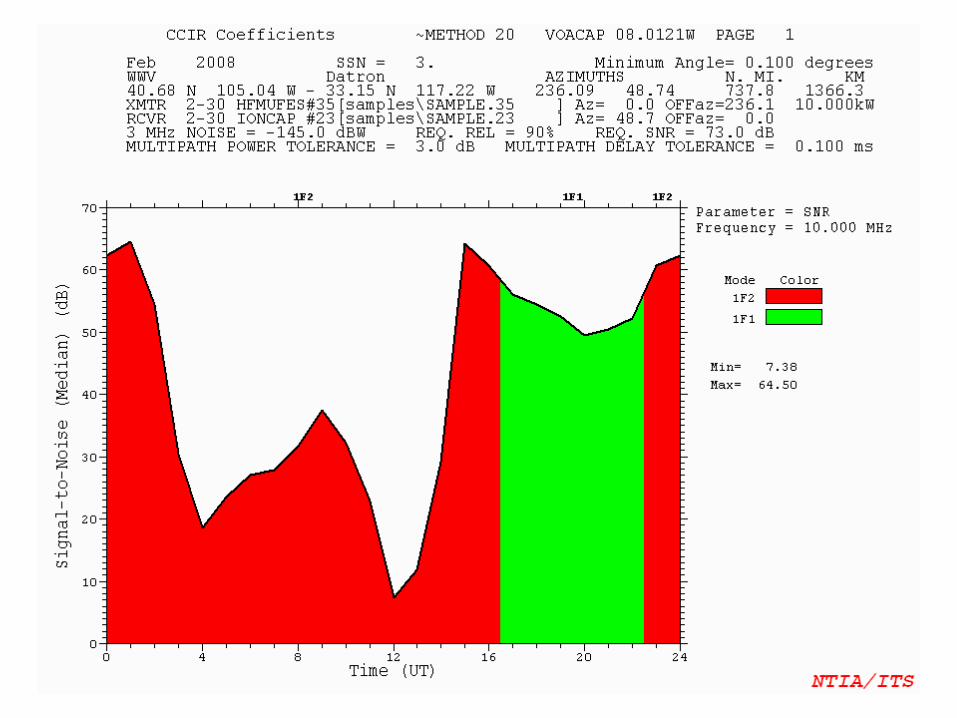
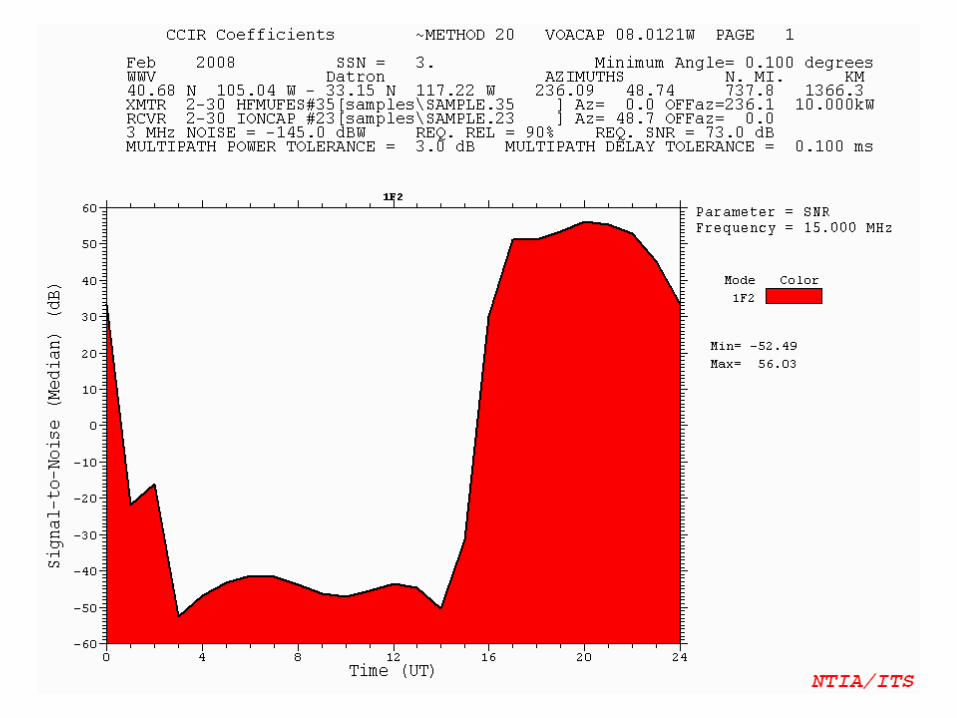
VOACAP SNR
• Use VOACAP to determine the predicted Signal to Noise Ratio
• Calculate for path between Fort Collins CO and San Diego CA
• Calculate for various WWV frequencies• Calculate using approximate antennas• Calculate for times throughout the day during
February 2008• Calculate using current Smoothed Sun Spot Number
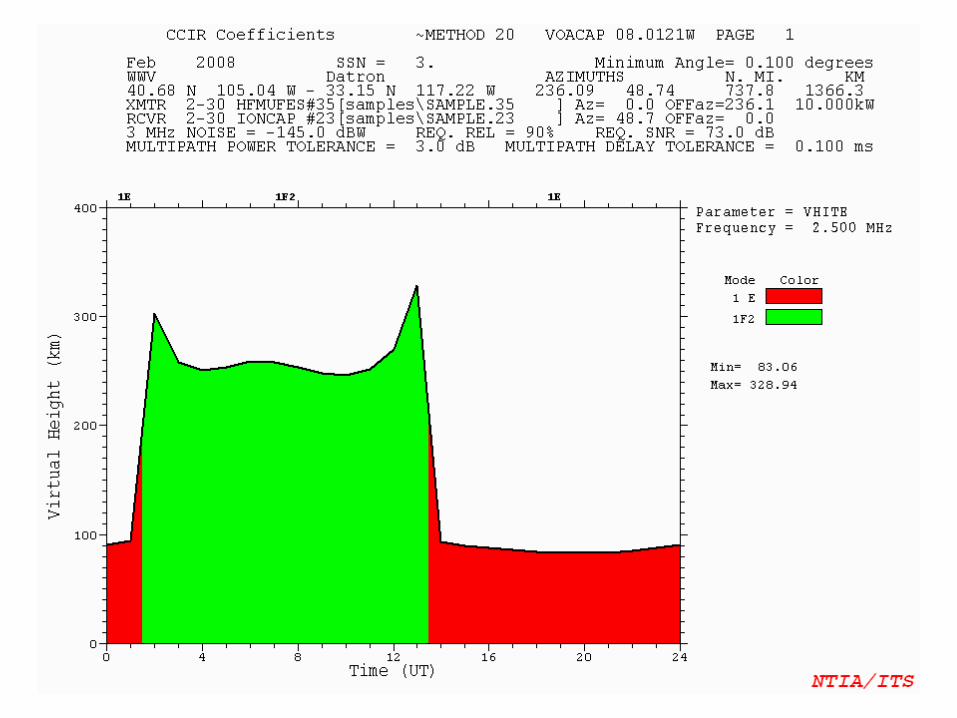
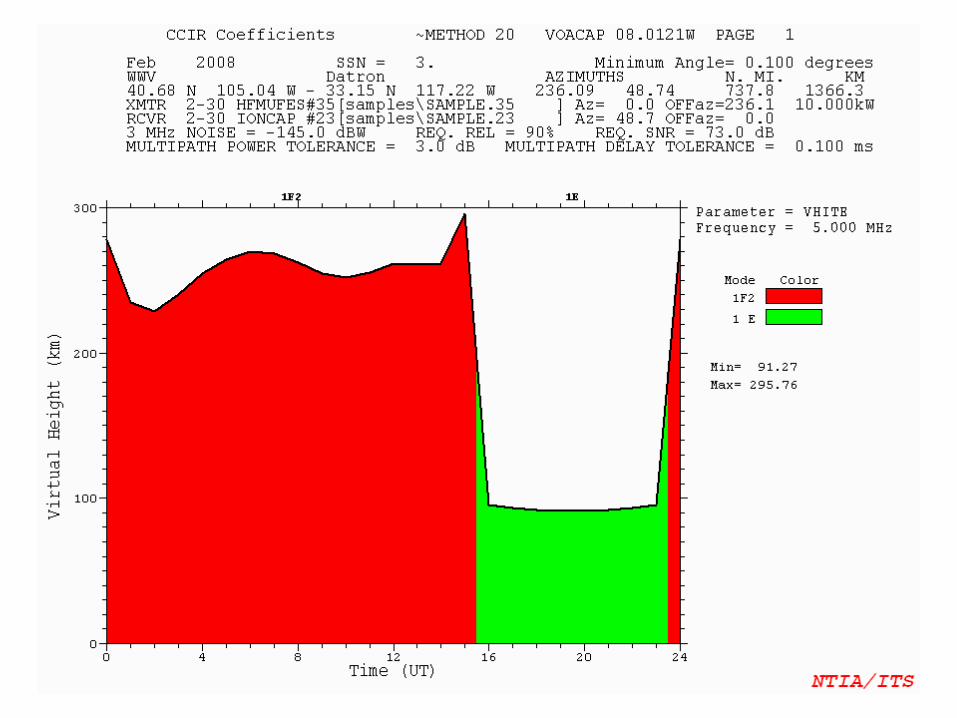
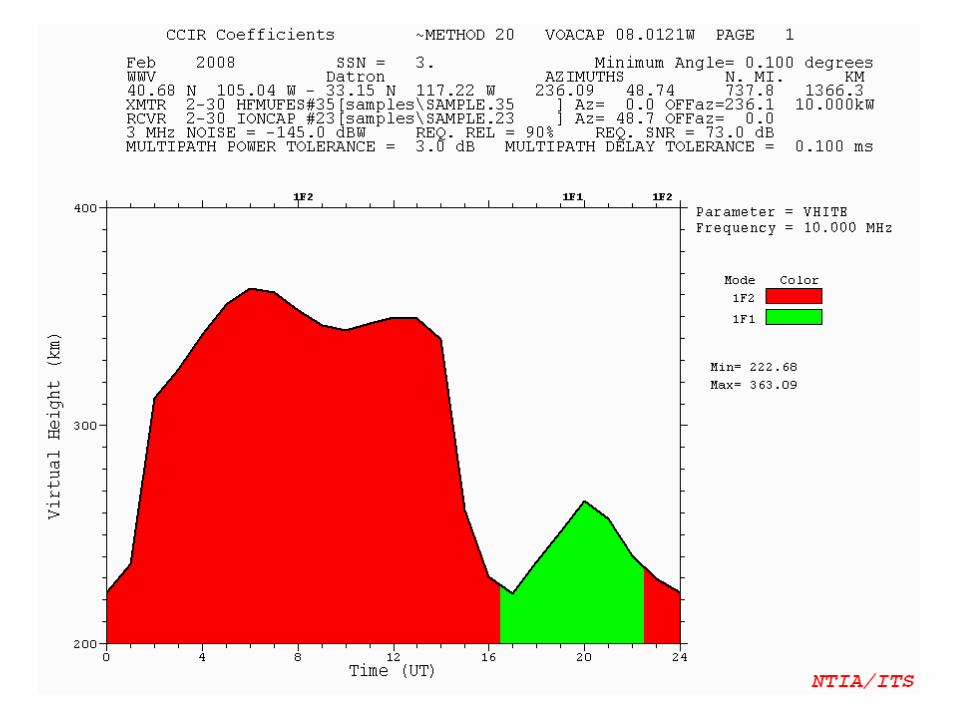
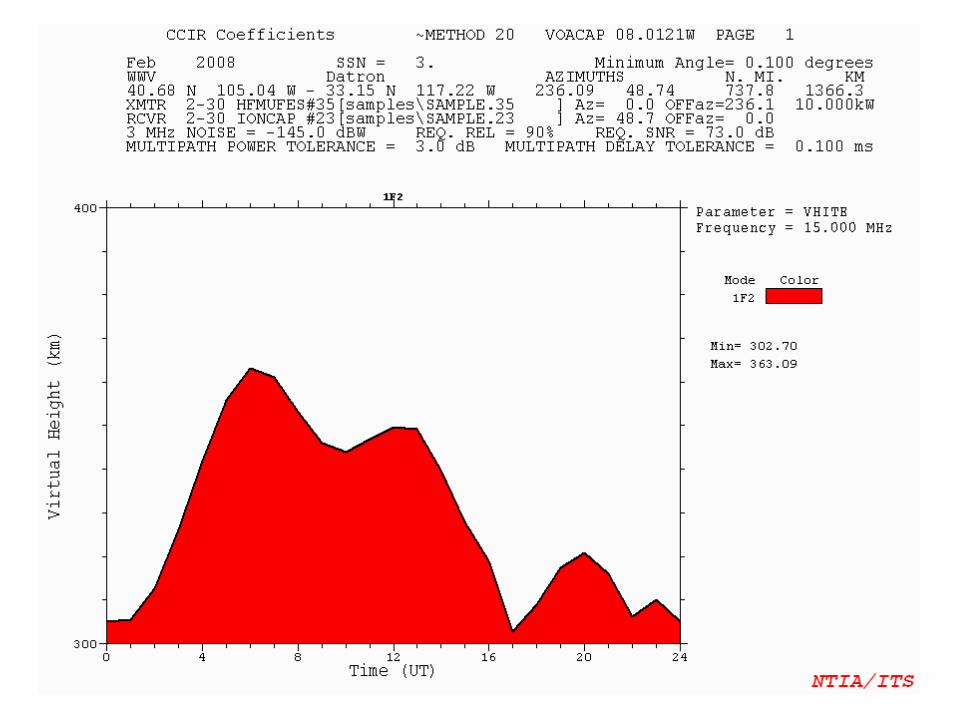
VOACAP Virtual Height
• Use VOACAP to determine the predicted Virtual Height (This was original goal of project)
• Calculate for path between Fort Collins CO and San Diego CA
• Calculate for various WWV frequencies• Calculate using approximate antennas• Calculate for times throughout the day during
February 2008• Calculate using current Smoothed Sun Spot Number
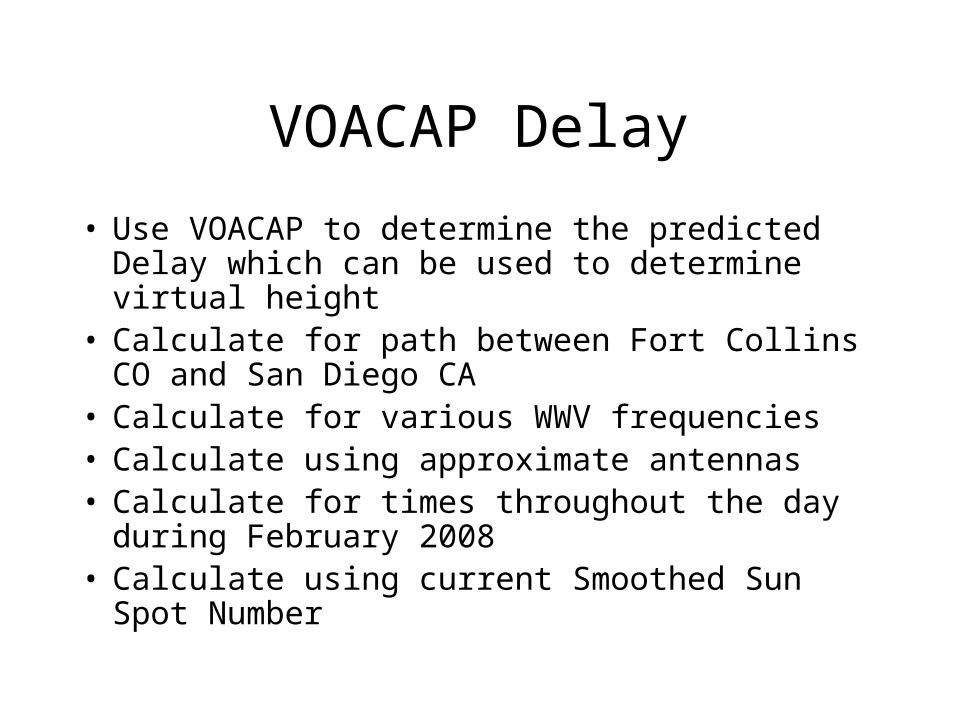
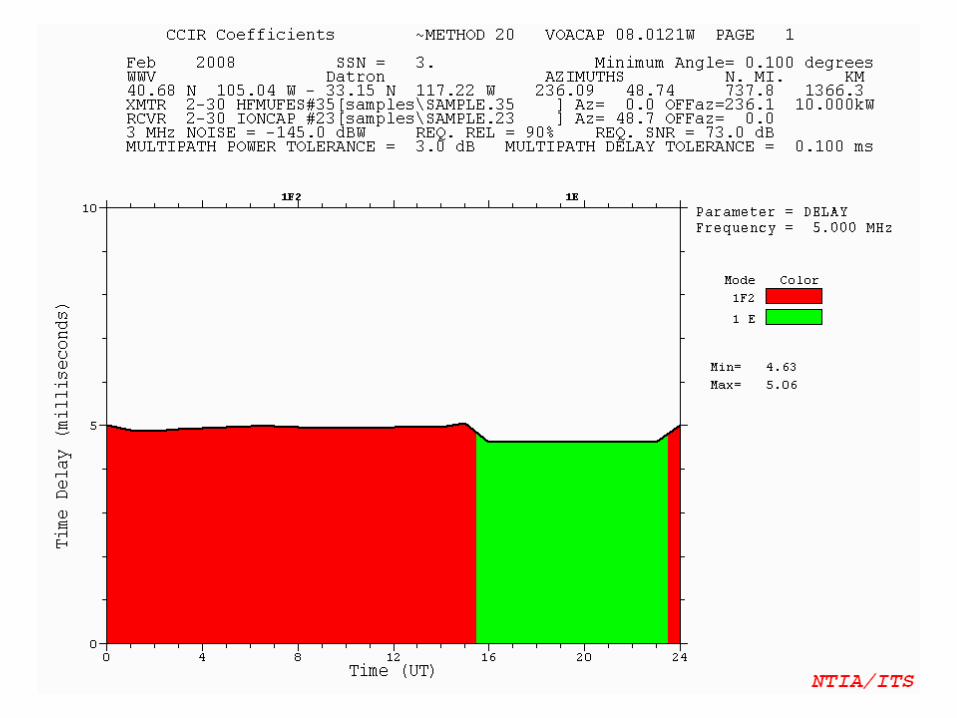
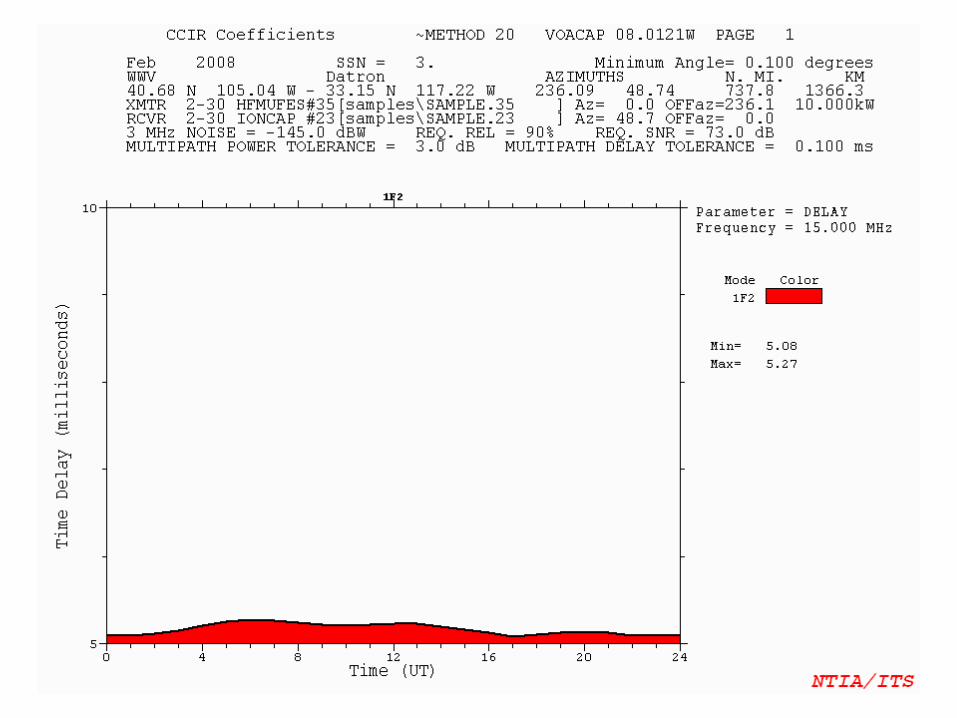
VOACAP Delay
• Use VOACAP to determine the predicted Delay which can be used to determine virtual height
• Calculate for path between Fort Collins CO and San Diego CA
• Calculate for various WWV frequencies• Calculate using approximate antennas• Calculate for times throughout the day during
February 2008• Calculate using current Smoothed Sun Spot Number


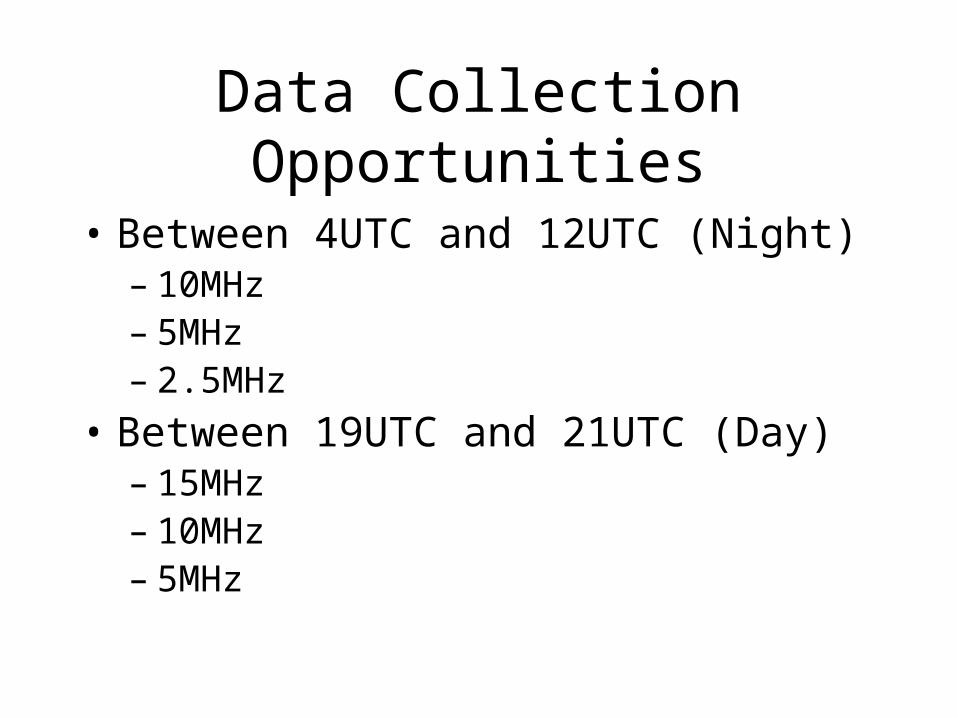
Data Collection Opportunities
• Between 4UTC and 12UTC (Night)– 10MHz– 5MHz– 2.5MHz
• Between 19UTC and 21UTC (Day)– 15MHz– 10MHz– 5MHz

Local Timing Reference
• Praecis Cfr from EndRun Technologies– Provides 1PPS within 10us of UTC– Provides accurate 10MHz reference – Synchronized to CDMA network– CDMA network is synchronized to GPS
Custom Receiver Boxes
• Direct Conversion Receiver• No LO – Constant Predictable Phase
Response• Fixed Gain – No AGC• Based on 10MHz WWV Receiver
Experiment at the Amateur and Short Wave Radio Electronics Experimenter’s Web Site http://www.qrp.pops.net/wwv_receiver.asp
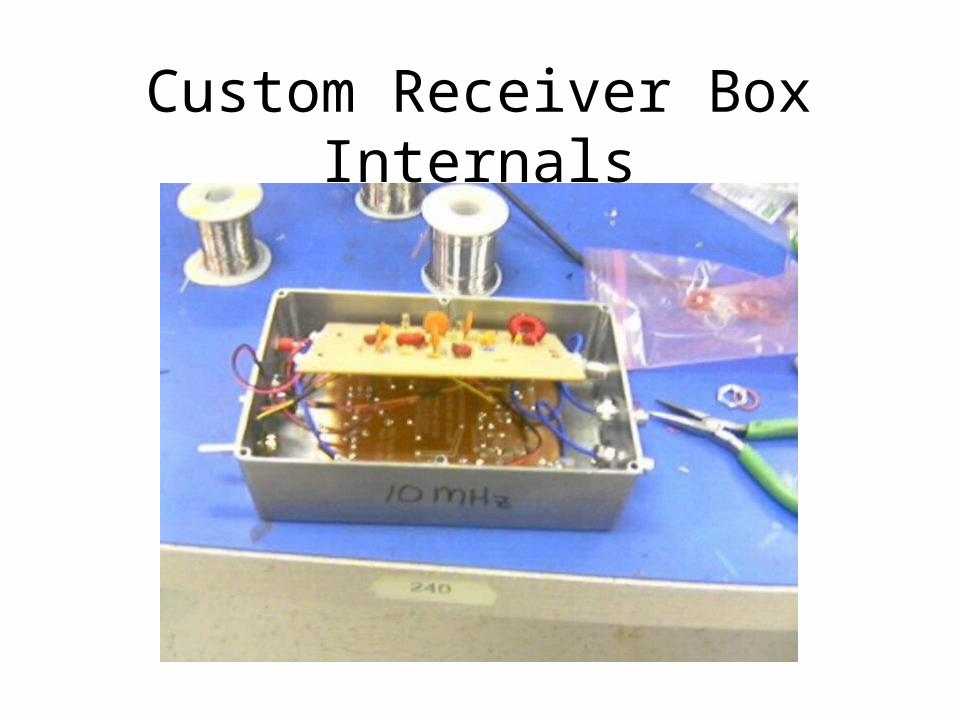
Custom Receiver Box Internals

Receiver Boxes Front and Back
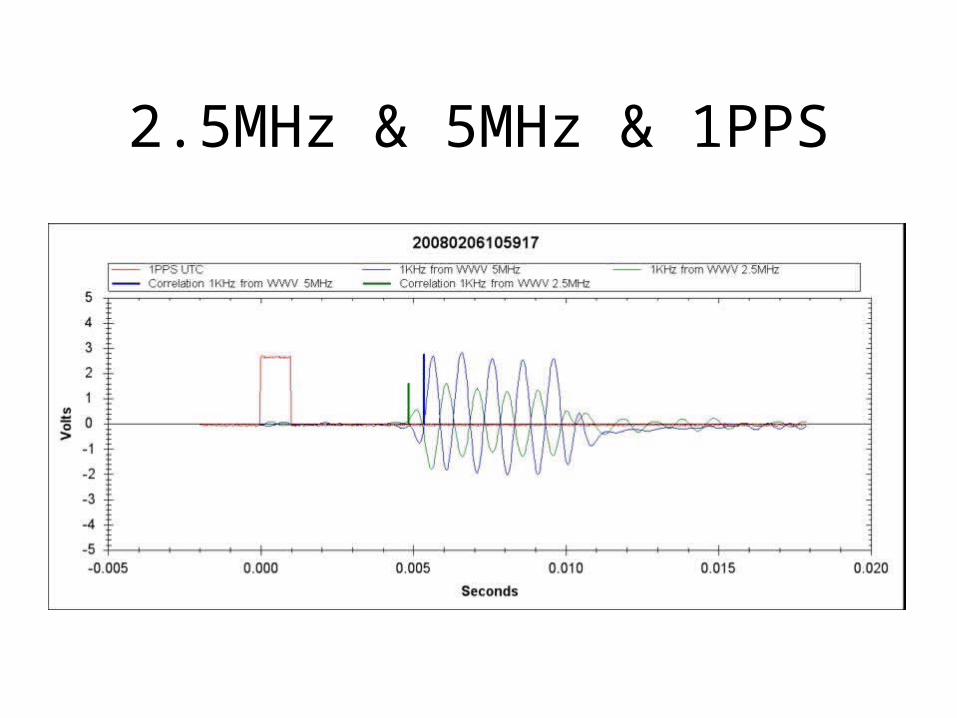
2.5MHz & 5MHz & 1PPS
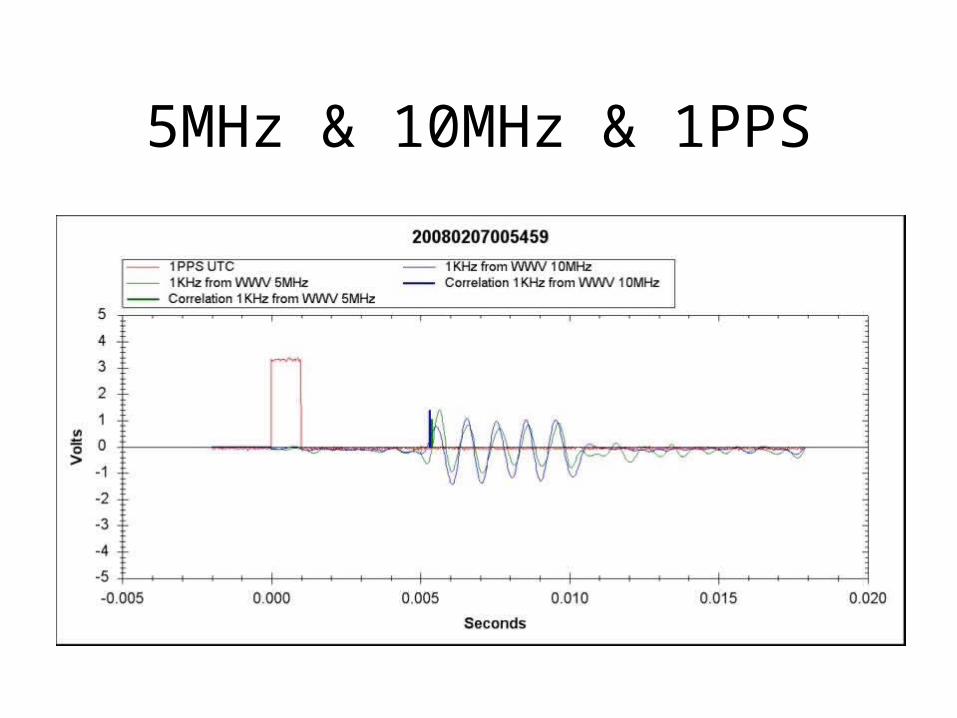
5MHz & 10MHz & 1PPS

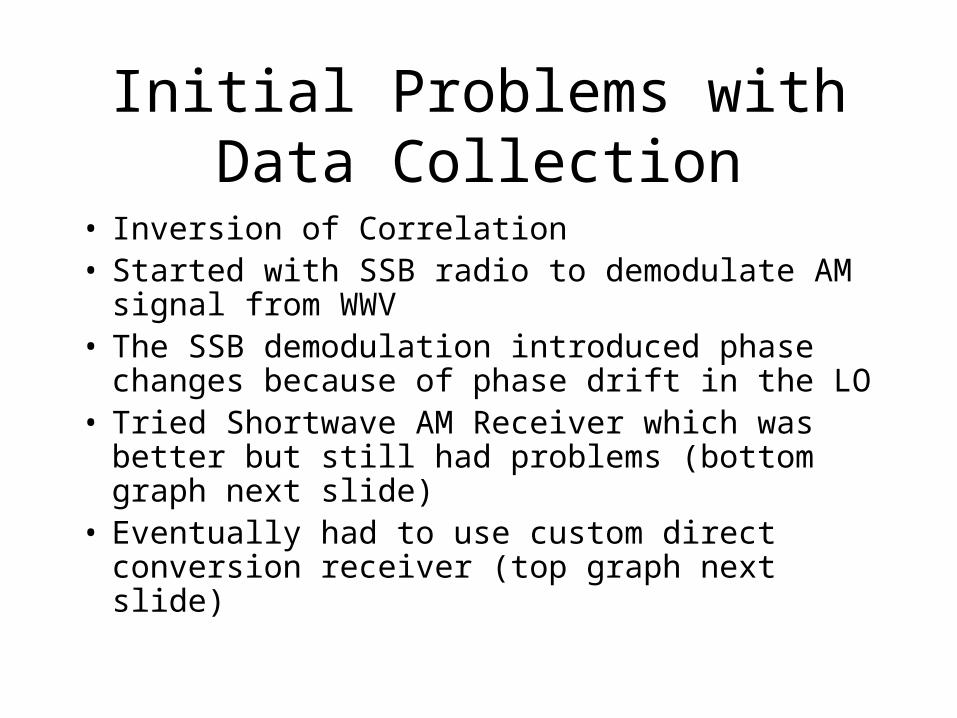
Initial Problems with Data Collection
• Inversion of Correlation• Started with SSB radio to demodulate AM signal
from WWV• The SSB demodulation introduced phase changes
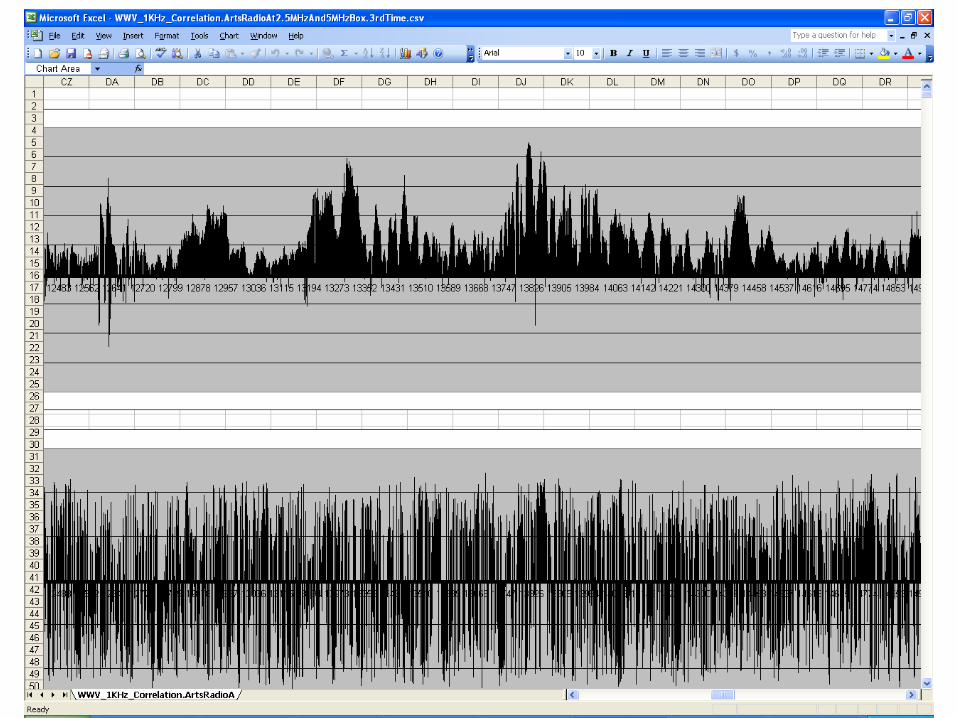
because of phase drift in the LO• Tried Shortwave AM Receiver which was better
but still had problems (bottom graph next slide)• Eventually had to use custom direct conversion
receiver (top graph next slide)

Impact on 110B modem signals
• 110B uses 1800Hz carrier which is similar to the 1KHz used by WWV
• Inversion of correlation would cause severe corruption of the PSK / QAM constellation
• 110B interleaves a continuous sequence of training symbols between every data symbol
• High speed modems do not do this. I’ve never see this before and I didn’t understand why it was done until I did this experiment and realized how much the ionosphere varies and impacts signals
Future Objectives
• Improve Receivers to Collect Better Data• Continue Collection of Data Throughout the Solar
Cycle• Try to correlate my observations with other Solar
and Geophysical measurements. • Support work to develop improved models of the
Ionosphere, both statistical and predictive• Possibly develop a kit or instructions to get other
Ham’s involved to collect data from multiple physical locations

Questions?