Embed Size (px)
DESCRIPTION
Analyzing Metabolomic Datasets. Jack Liu Statistical Science, RTP, GSK 7-14-2005. Overview. Features of Metabolomic datasets Pre-learning procedures Experimental design Data preprocess and sample validation Metabolite selection Unsupervised learning Profile clustering SVD/RSVD - PowerPoint PPT Presentation
Citation preview
Analyzing Metabolomic Datasets
Jack LiuStatistical Science, RTP, GSK
7-14-2005
Overview
Features of Metabolomic datasets Pre-learning procedures
– Experimental design– Data preprocess and sample validation– Metabolite selection
Unsupervised learning– Profile clustering– SVD/RSVD
Supervised learning Software
Why metabolomics? Discover new disease biomarkers for
screening and therapy progression– A small subsets of metabolites can
indicate an early disease stage or predict a therapy efficiency
Associate metobolites (functions) with transcripts (genes)– Metobolites are downstream results of
gene expression
Metabolomics datasets Advantages
– Metabolomics are not organism specific => make cross-platform analysis possible
– Changes are usually large– Closer to phenotype– Metabolites are well known (900-1000)
Disadvantages– Lots of missing data and mismatches (like
Proteomics)– Expensive (about 2-10 more expensive than
Affymetrix)
Experimental design Traditional experimental design still apply
– Blocking– Randomization– Enough replicates
Design the experiment based on the expectation– A two-group design will not lead to a complete
profiling (if samples in groups are homogenous)– A multiple-group design may have difficulty for
supervised learning (if group number is large and data is noisy)
Data preprocessing Perform transformation
– Log-2 transformation is a common choice
Normalization: use simple ones Summarization is needed for technical
replicates Filter variables by missing patterns What to do with the missing data?
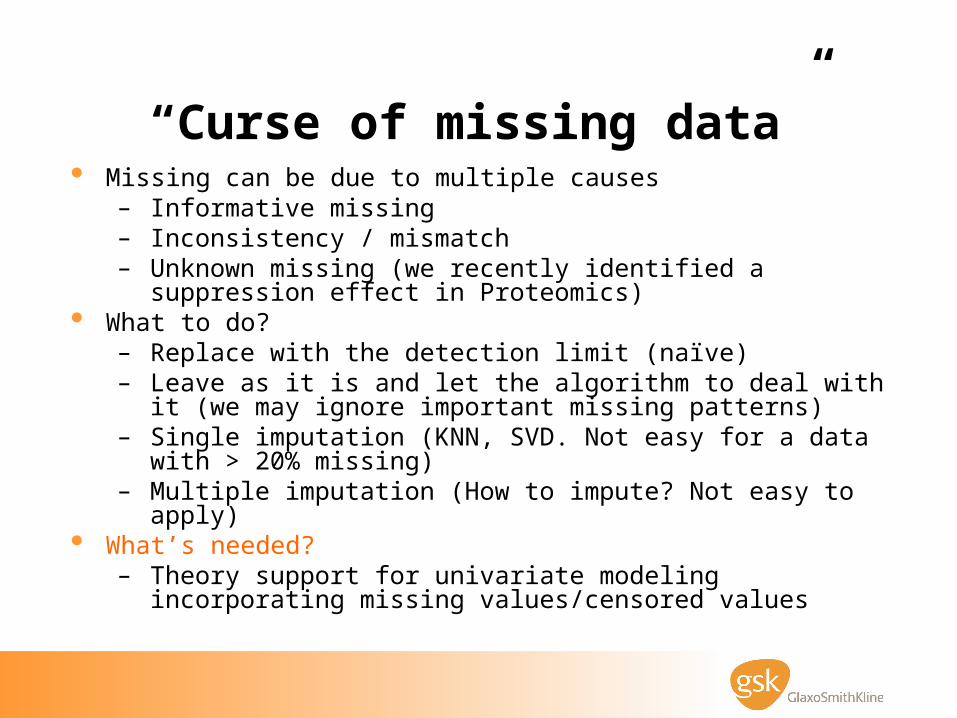
“Curse of missing data” Missing can be due to multiple causes
– Informative missing– Inconsistency / mismatch– Unknown missing (we recently identified a suppression effect
in Proteomics) What to do?
– Replace with the detection limit (naïve)– Leave as it is and let the algorithm to deal with it (we may
ignore important missing patterns)– Single imputation (KNN, SVD. Not easy for a data with > 20%
missing)– Multiple imputation (How to impute? Not easy to apply)
What’s needed?– Theory support for univariate modeling incorporating missing
values/censored values
NCI dataset 58 cells and 300 metabolites, no
replicates These cells are the majorities of the
famous NCI-60 cancer cell lines 27% missing data. Can not replace
missing values with a low value. Why?
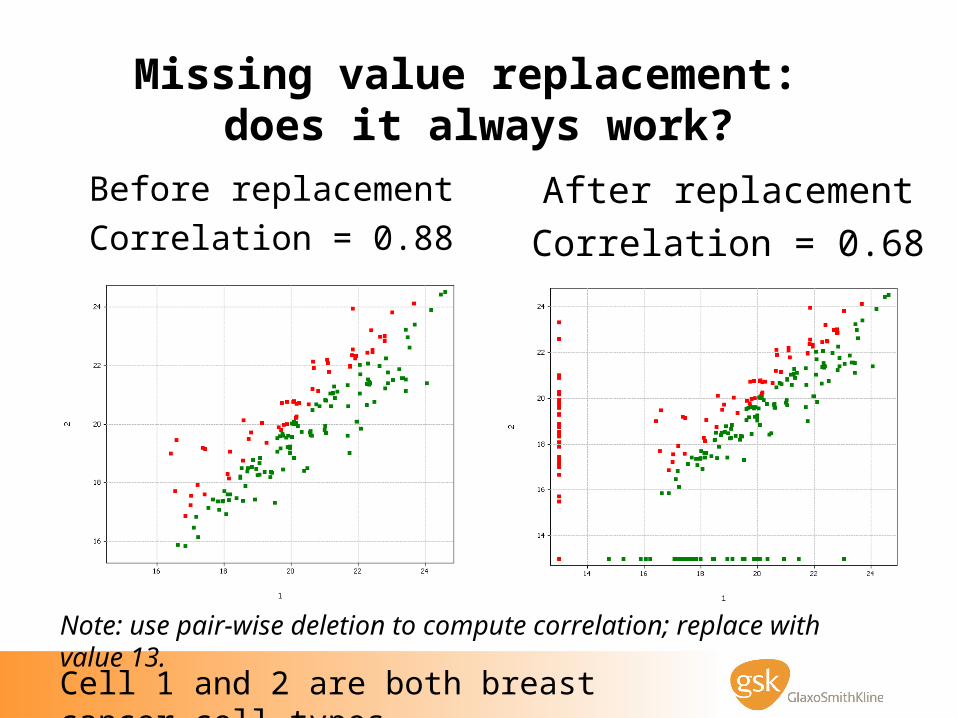
Missing value replacement: does it always work?
Before replacement
Correlation = 0.88
After replacement
Correlation = 0.68
Cell 1 and 2 are both breast cancer cell types
Note: use pair-wise deletion to compute correlation; replace with value 13.
Sample validation Objective
– After we do the experiment, how do we decide if a sample has passed QC and is not an outlier?
Solutions– Technical QC measures– PCA: visual approach. Accepting or not is arbitrary– Correlation-based method: formal and quantitative
approach; based on all the data; has been taken by GSK as the formal procedure
– Sample validation is a cost-saving procedure
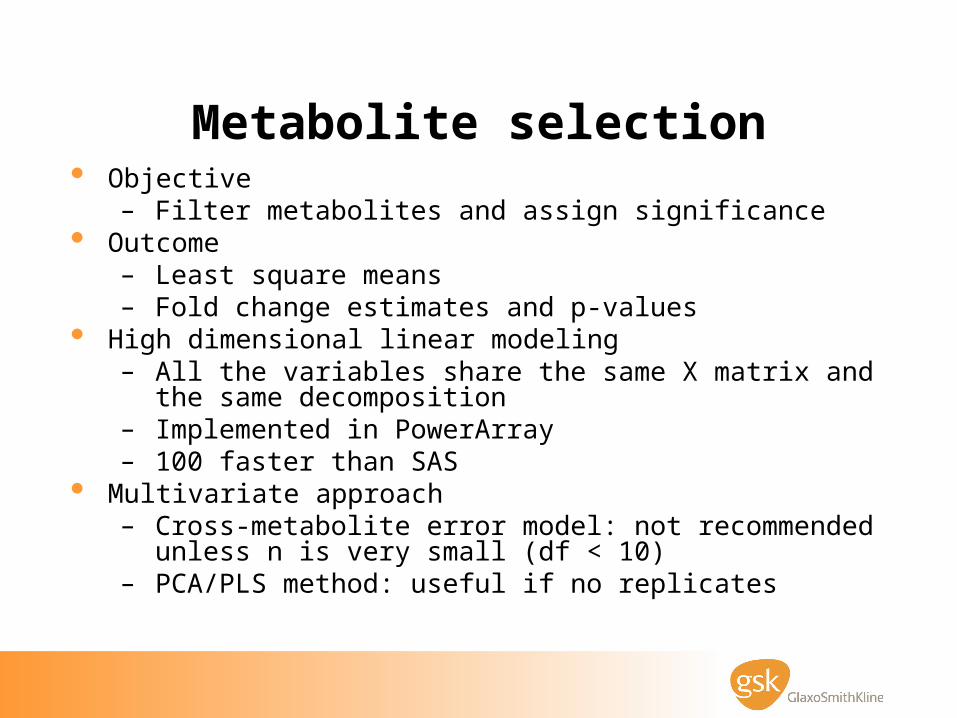
Metabolite selection Objective
– Filter metabolites and assign significance Outcome
– Least square means– Fold change estimates and p-values
High dimensional linear modeling– All the variables share the same X matrix and the same
decomposition– Implemented in PowerArray– 100 faster than SAS
Multivariate approach– Cross-metabolite error model: not recommended unless n is
very small (df < 10)– PCA/PLS method: useful if no replicates
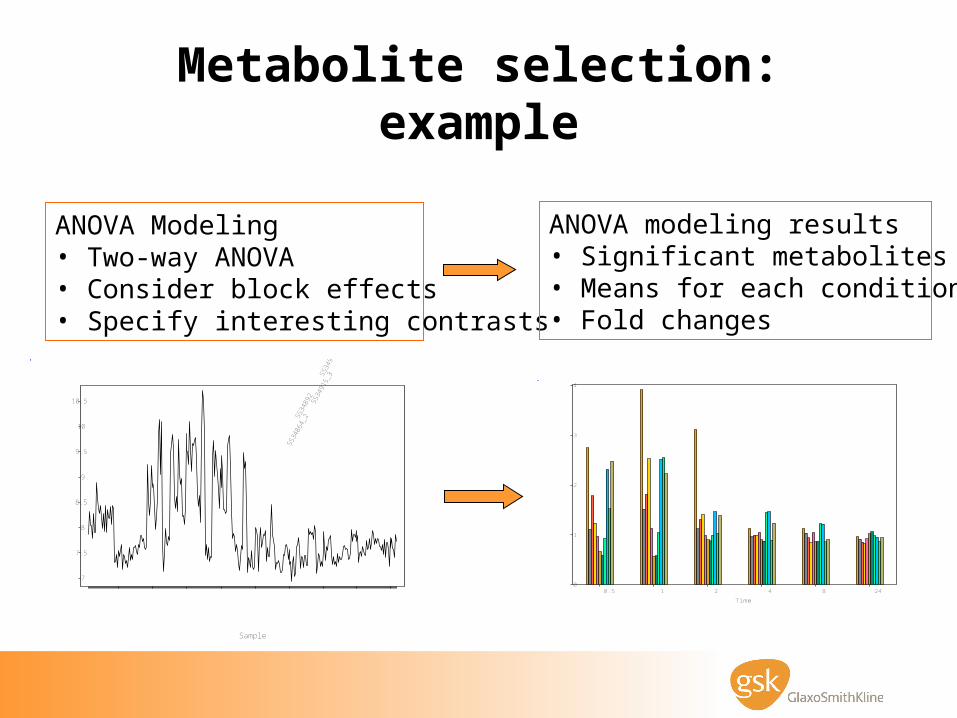
Metabolite selection: example
0.5 1 2 4 8 240
1
2
3
4
Time
Fold
ch
ange
SS34
864_
2SS34
892
SS34
915_
3SS34
944SS
3496
7SS34
991SS
3501
4SS35
037SS
3506
0SS35
084SS
3510
7SS35
130SS
3515
4SS35
179
7
7.5
8
8.5
9
9.5
10
10.5
Sample
Level
ANOVA Modeling• Two-way ANOVA• Consider block effects• Specify interesting contrasts
ANOVA modeling results• Significant metabolites• Means for each conditions• Fold changes
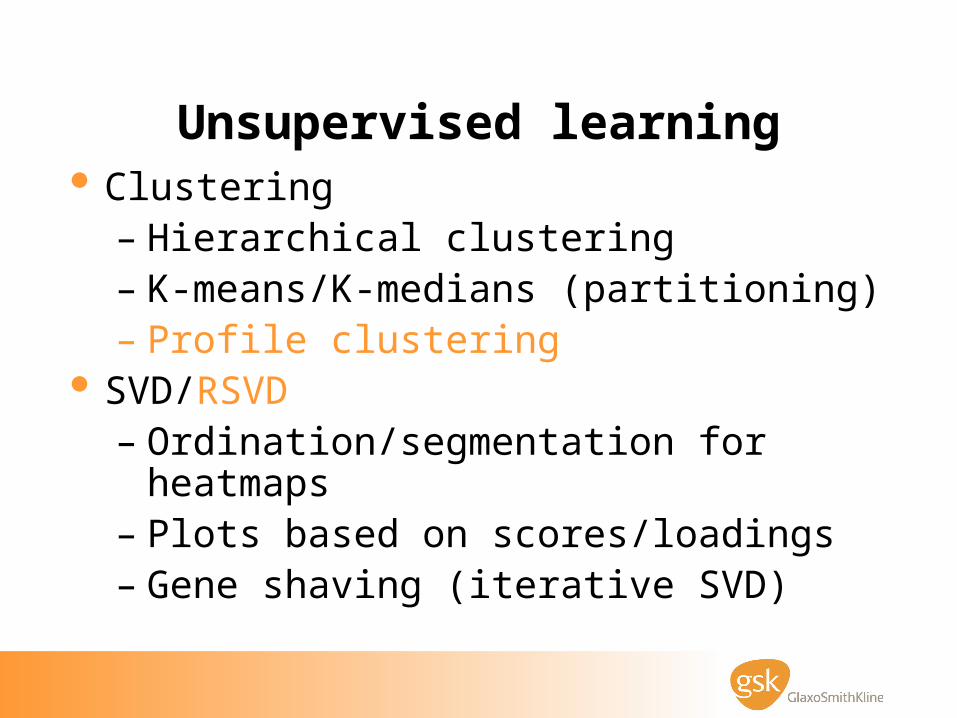
Unsupervised learning Clustering
– Hierarchical clustering– K-means/K-medians (partitioning)– Profile clustering
SVD/RSVD– Ordination/segmentation for heatmaps– Plots based on scores/loadings– Gene shaving (iterative SVD)
Profile clustering Clustering based on profiles Different from K-means or hierarchical
clustering– No need to specify K– Does not cluster all the observations –
only extract those with close neighbors– Guarantee the quality of each cluster– Works on a graph instead of a matrix
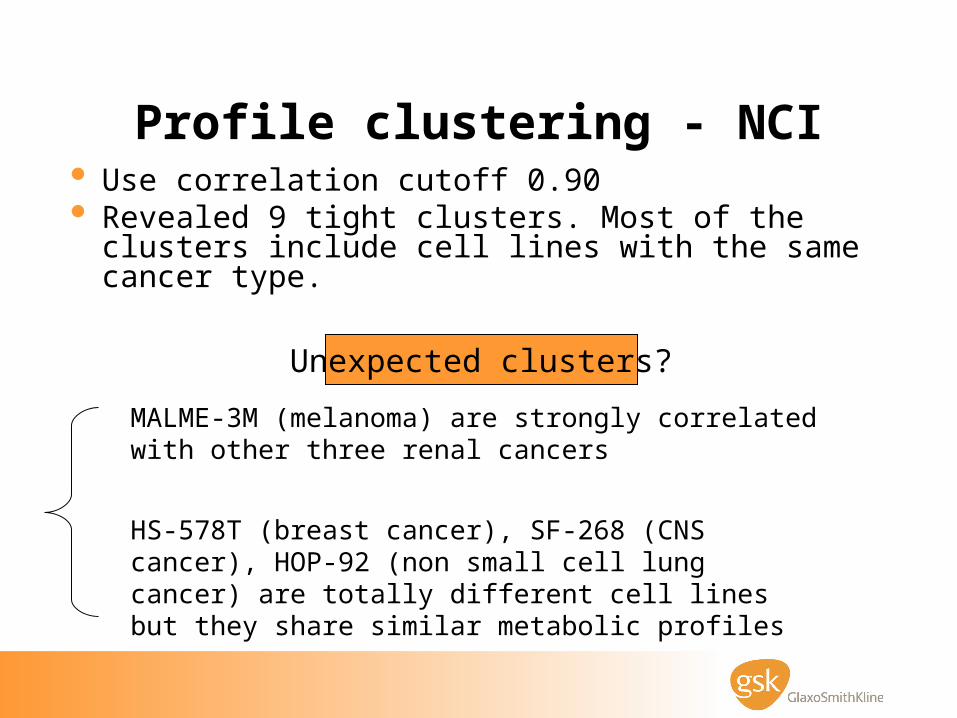
Profile clustering - NCI Use correlation cutoff 0.90 Revealed 9 tight clusters. Most of the clusters
include cell lines with the same cancer type.
Unexpected clusters?
MALME-3M (melanoma) are strongly correlated with other three renal cancers
HS-578T (breast cancer), SF-268 (CNS cancer), HOP-92 (non small cell lung cancer) are totally different cell lines but they share similar metabolic profiles
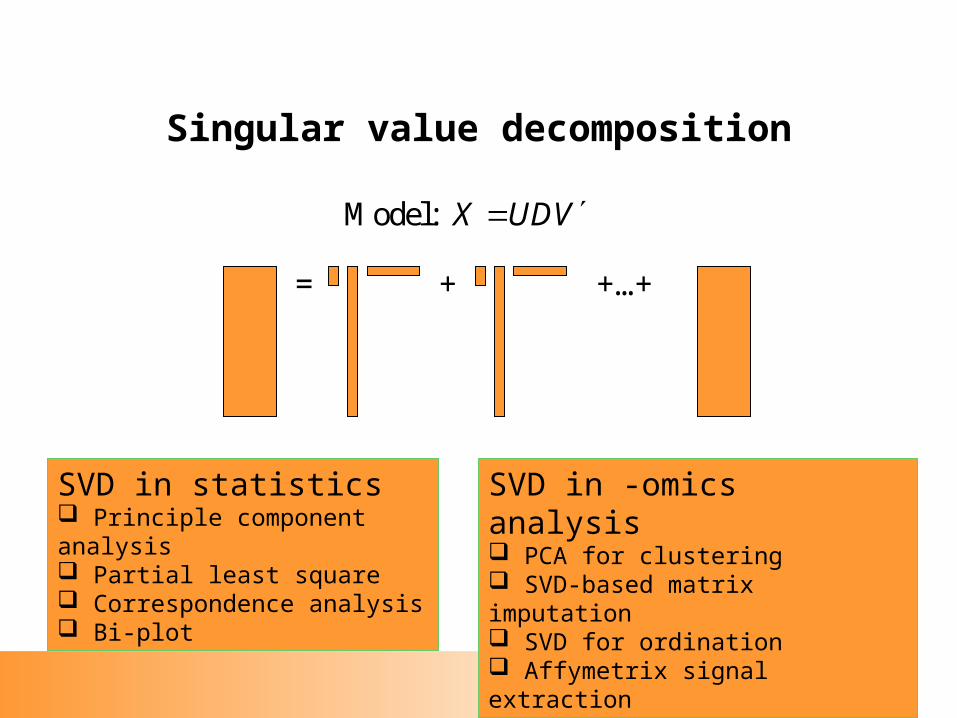
Singular value decomposition
Model: X UDV
= + +…+
SVD in statistics Principle component analysis Partial least square Correspondence analysis Bi-plot
SVD in -omics analysis PCA for clustering SVD-based matrix imputation SVD for ordination Affymetrix signal extraction
Robust singular value decomposition
Advantages:– Robust to outliers– Automatically deals with missing entries
Different versions of approaches– L2-ALS: Gabriel and Zamir (1979)– L1-ALS: Hawkins, Li Liu and Young (2002)– LTS-ALS: Jack Liu and Young (2004)
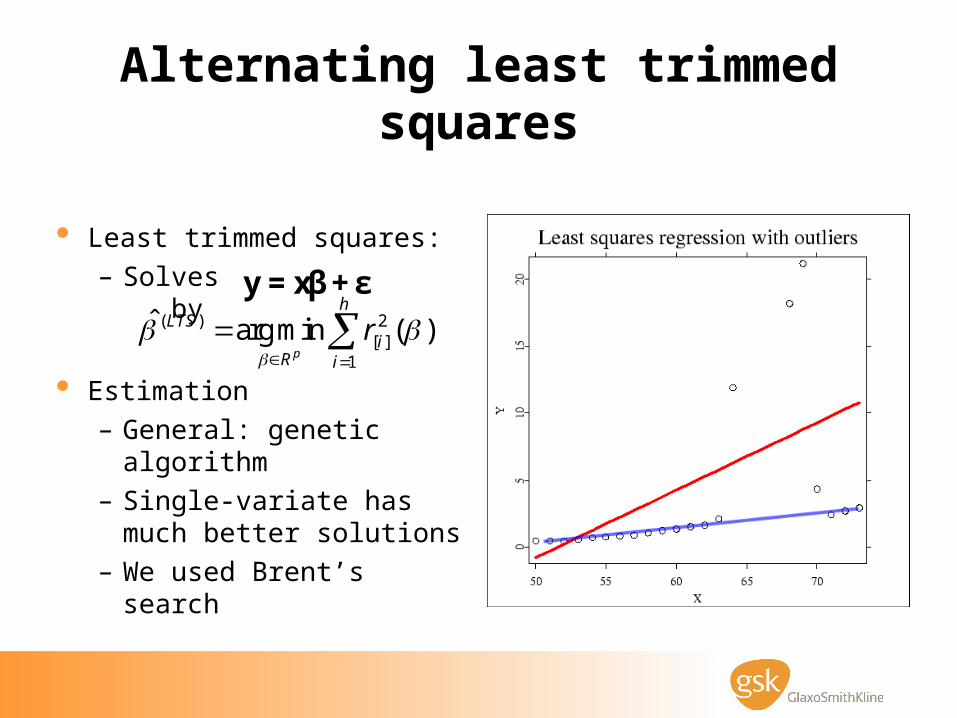
Alternating least trimmed squares
Least trimmed squares:– Solves by
Estimation– General: genetic
algorithm– Single-variate has
much better solutions – We used Brent’s
search
y = xβ + ε( ) 2
[ ]1
ˆ arg min ( )p
hLTS
iR i
r
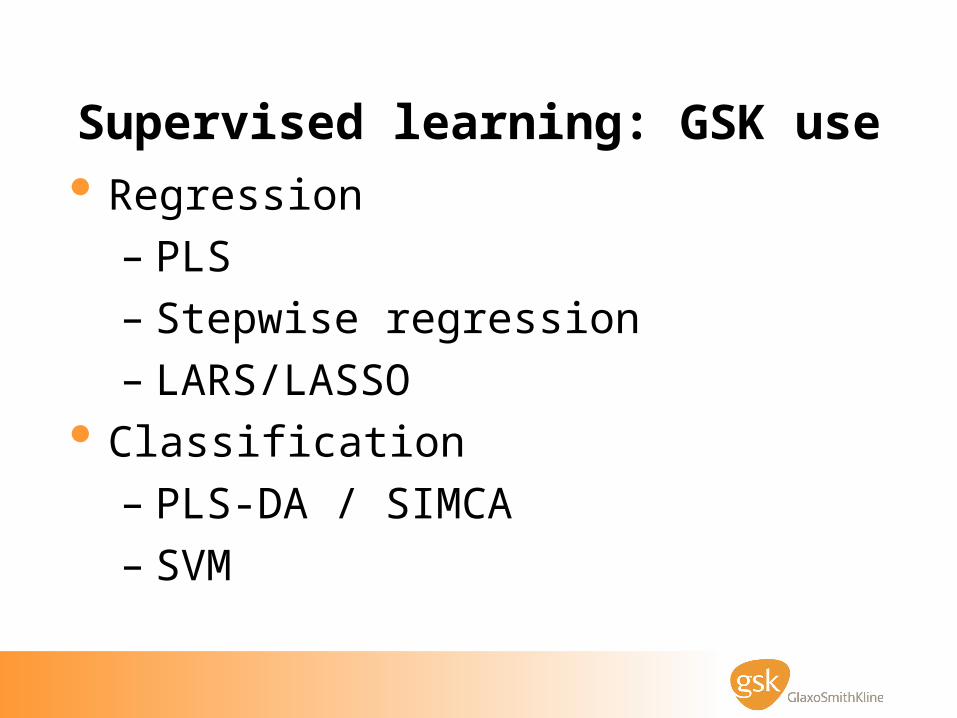
Supervised learning: GSK use Regression
– PLS
– Stepwise regression
– LARS/LASSO Classification
– PLS-DA / SIMCA
– SVM
Supervised learning: what’s useful for drug discovery?
A model will not be particularly useful if it involves thousands of variables
A model will not be useful it is not interpretable Therefore, a model is useful if is
– Easy to interpret– Easy to apply prediction– Better than empirical guess
Variable selection for regression or classification has attracted a lot of interest
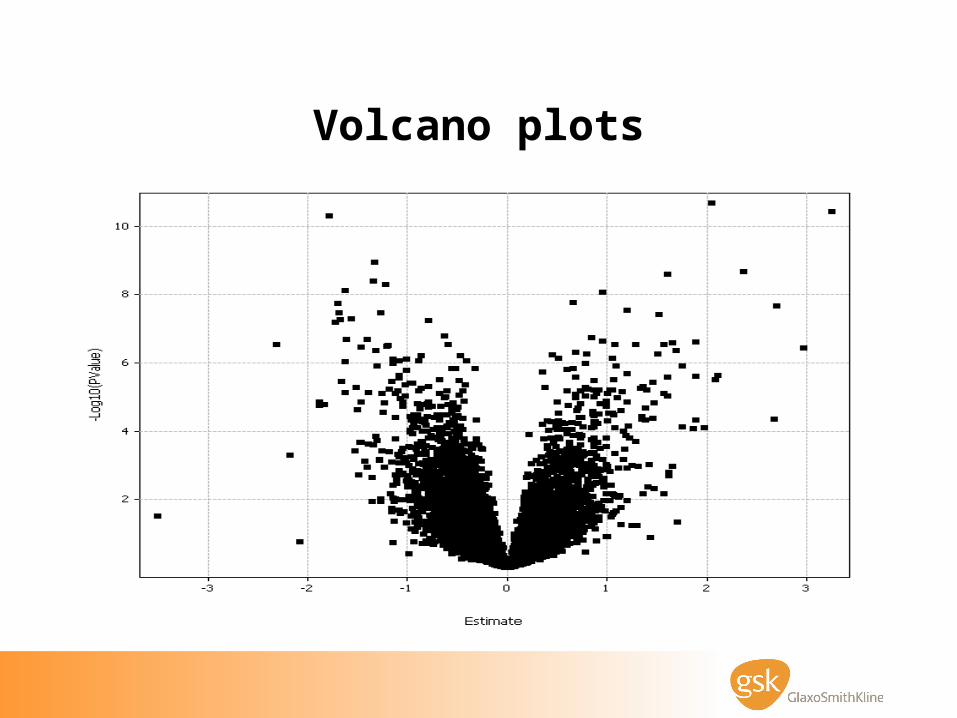
Volcano plots
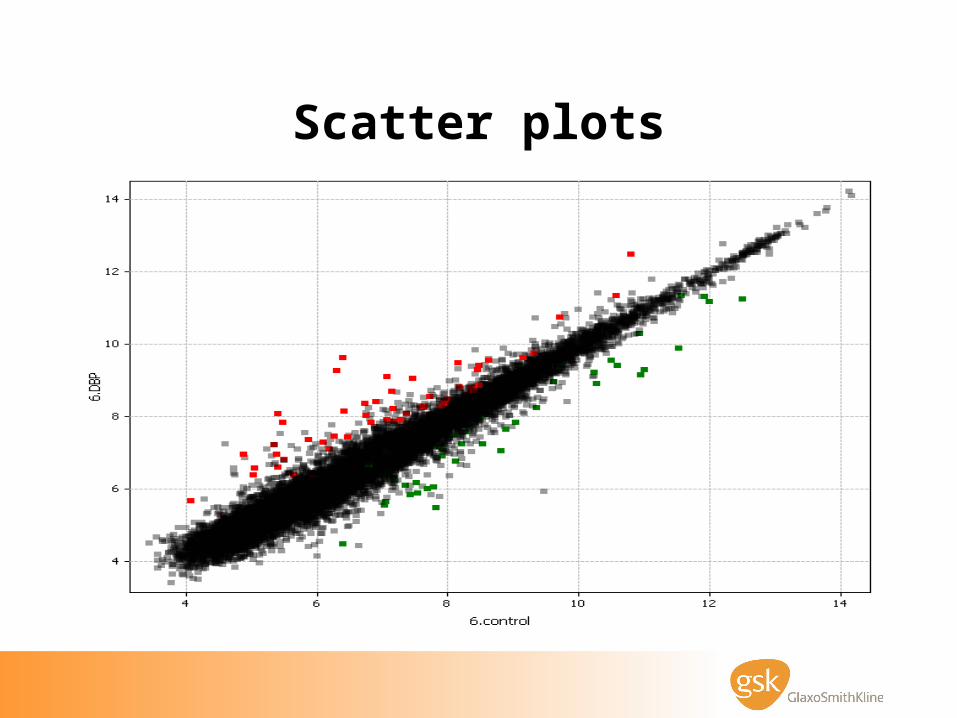
Scatter plots
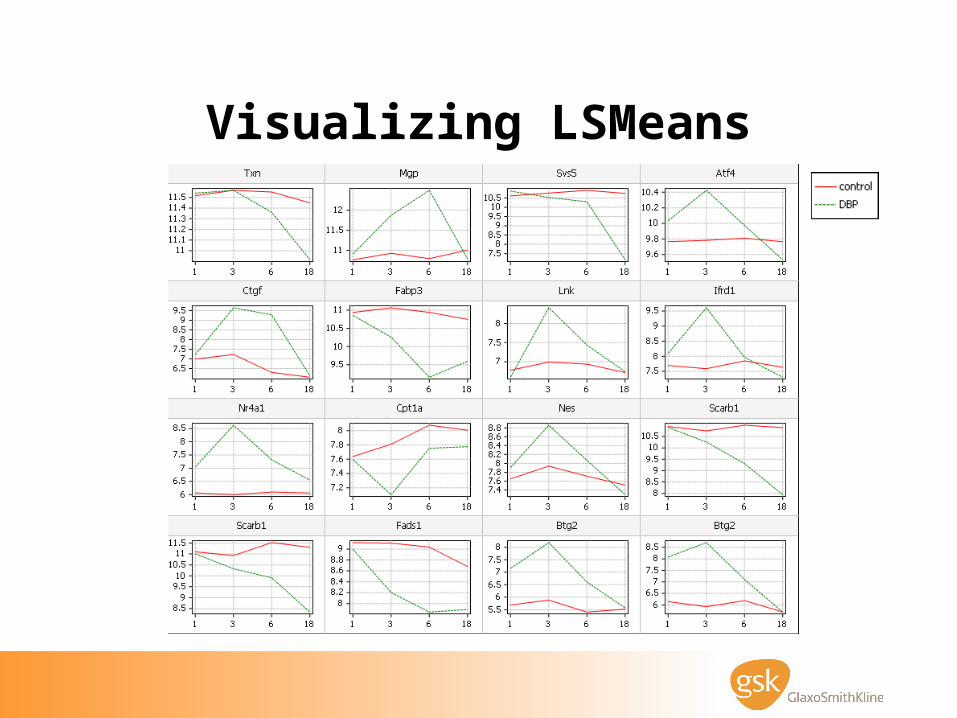
Visualizing LSMeans
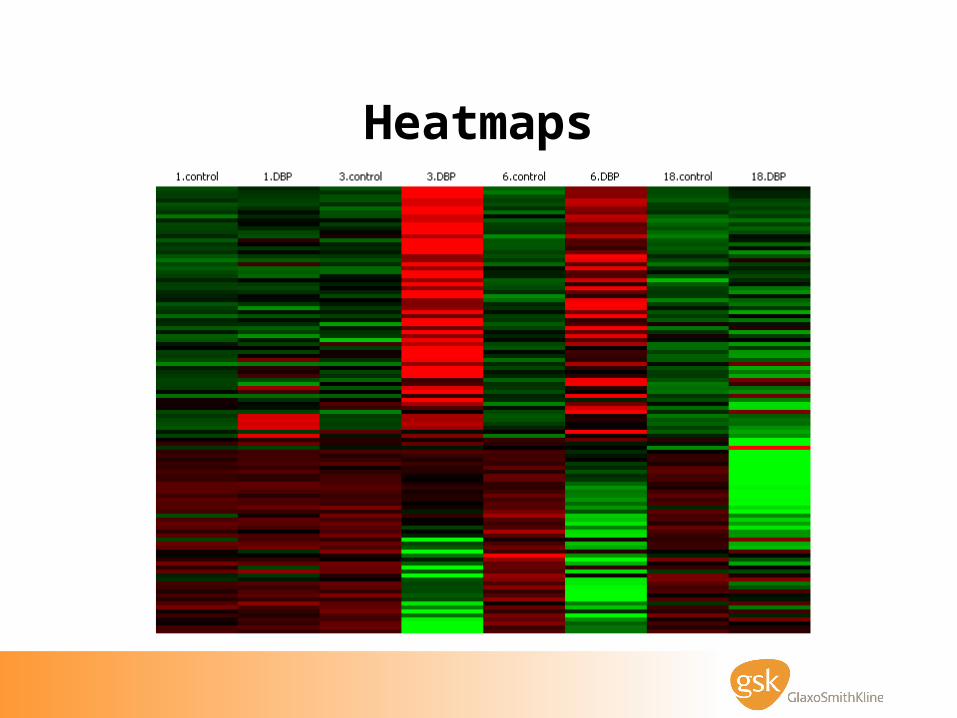
Heatmaps
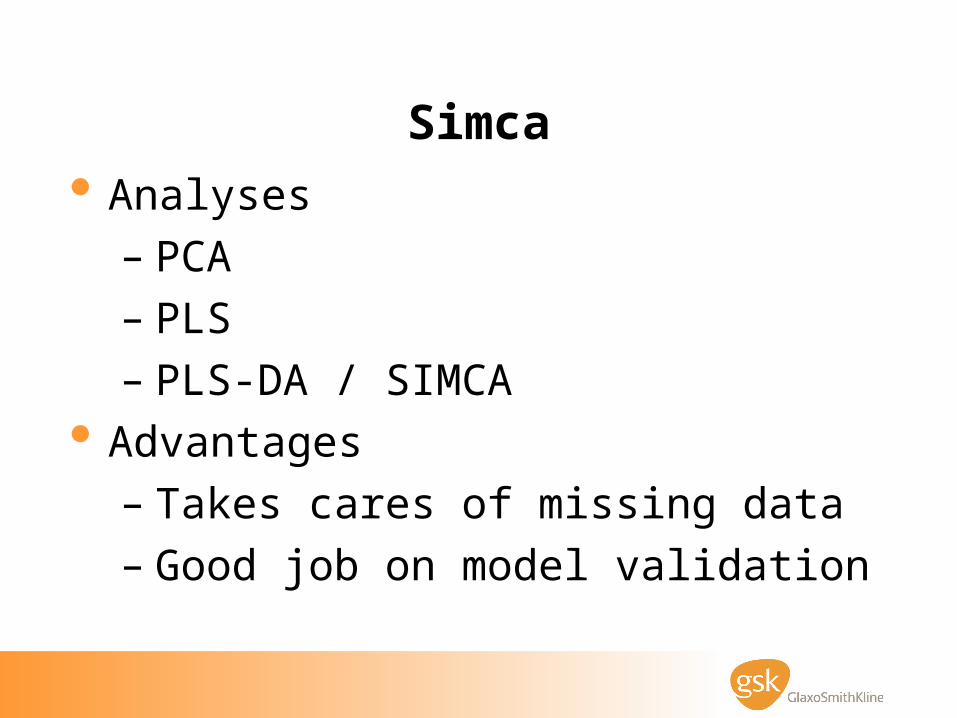
Simca Analyses
– PCA
– PLS
– PLS-DA / SIMCA Advantages
– Takes cares of missing data
– Good job on model validation
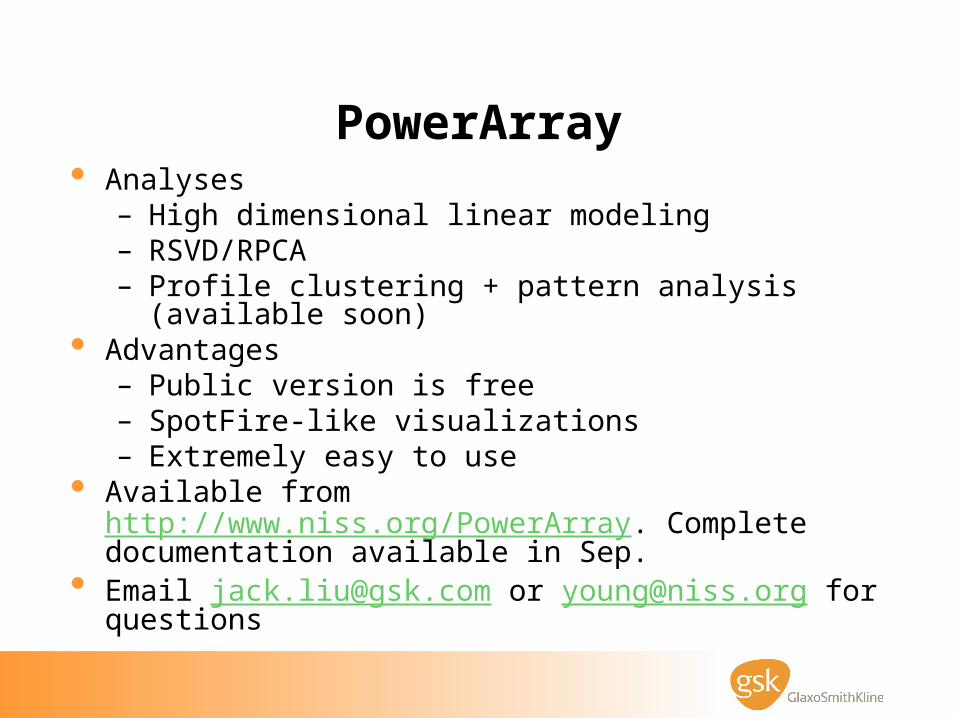
PowerArray Analyses
– High dimensional linear modeling– RSVD/RPCA– Profile clustering + pattern analysis (available soon)
Advantages– Public version is free– SpotFire-like visualizations– Extremely easy to use
Available from http://www.niss.org/PowerArray. Complete documentation available in Sep.
Email [email protected] or [email protected] for questions