Embed Size (px)
Citation preview

Analyzing Students’ Attention in Class Using
Wearable Devices
Xin Zhang1, Cheng-Wei Wu1, Philippe Fournier-Viger2, Lan-Da Van1, Yu-Chee Tseng1,* 1Department of Computer Science, National Chiao Tung University, Hsinchu, Taiwan
2School of Natural Sciences and Humanities, Harbin Institute of Technology, Shenzhen, China
E-mail: [email protected], [email protected], {ldvan, yctseng*}@cs.nctu.edu.tw, [email protected]
Abstract—Detecting students’ attention in class provides key
information to teachers to capture and retain students’ attention.
Traditionally, such information is collected manually by human
observers. Wearable devices, which have received a lot of
attention recently, are rarely discussed in this field. In view of
this, we propose a multimodal system which integrates a head-
motion module, a pen-motion module, and a visual-focus module
to accurately analyze students’ attention levels in class. These
modules collect information via cameras, accelerometers, and
gyroscopes integrated in wearable devices to recognize students’
behaviors. From these behaviors, attention levels are inferred for
various time periods using a rule-based approach and a data-
driven approach. The former infers a student’s attention states
using user-defined rules, while the latter relies on hidden
relationships in the data. Extensive experimental results show
that the proposed system has excellent performance and high
accuracy. To the best of our knowledge, this is the first study on
attention level inference in class using wearable devices. The
outcome of this research has the potential of greatly increasing
teaching and learning efficiency in class.
Keywords—Activity Recognition; Attention Sensing; Body-Area
Network; Machine Learning; Wearable Computing
I. INTRODUCTION
The Internet of Things (IoT) [2] and wearable technologies [16] have rapidly become key research areas in computer sciences, as they have multiple real-life applications in a wide range of domains. A wearable device is a microelectronic computing and sensing system that can be comfortably worn by its users. Its embedded software and sensors allow measuring users’ vital signs and ambient conditions. In contrast to traditional computers, wearable devices are lightweight, small, generally inexpensive, and close to the wearer’s bodies. They are thus highly promising for collecting and analyzing human behavioral data.
In the technology industry, many of the largest companies such as Google, Apple, and Microsoft have recently designed wearable devices. Numerous traditional accessories have been transformed into wearable devices [16], including glasses, watches, clothes and even diapers. As pointed out in a report by the International Data Corporation [10], the worldwide shipment of wearable devices is expected to reach 173.4 million units by 2019. Numerous research studies have been devoted to wearable applications, such as detecting users’ activities [5], social actions [8], falls [24], and users’ browsing behaviors in retails [21].
Although wearable technology has been applied in several domains, it is rarely considered for measuring students’ attention levels in class. Attention can be defined as the behavioral and cognitive process of selectively concentrating on certain pieces of information [1]. In a previous study [23], it was found that selective and sustained attention has a significant impact on learning. Learners’ attention is closely related to their learning efficiency and learning outcomes. Knowing the attention levels of students in class would thus greatly benefit both students and teachers. This information can help students better understand their learning processes and adapt their learning strategy, while teachers can use this feedback to gauge students’ interest and adjust teaching strategies to capture and maintain students’ attention.
Traditional ways of measuring students’ attention levels include filling questionnaires [22], performing experimental tests [13], and direct observation [14]. Although these methods are suitable in some scenarios, they are time-consuming, require human intervention, and most of them cannot be applied in real-time, or to a large group of students. Some studies [3] have used surveillance cameras and face recognition models to automatically measure students’ attention levels. However, the accuracy of these approaches is substantially influenced by factors such as lighting, camera positions, and background interference. Some studies [30] used eye trackers to detect visual attention. However, these devices are quite expensive and prolonged use may cause eye injury [19].
To address these drawbacks of current approaches, this study designs an approach for measuring students’ attention levels in class using low-cost wearable devices. Achieving this goal is however challenging since attention is an internal cognitive process that can only be indirectly observed through its effects on external actions, such as motion changes, visual focus, and physical behaviors. To tackle this challenge, this paper proposes a novel system that captures head-motion, pen-motion, and visual-focus data for attention inference. The major challenges of this research are listed below.
1. Recognizing users’ different activities requires the use of multiple sensors, which generate heterogeneous data. As more types of sensors are used, it becomes increasingly difficult to jointly analyze the heterogeneous data that they generate to build an inference model
2. Identifying the features to be used to build an inference model is also challenging. Human activities are usually complex and can be described using numerous features. When both physical and psychological data are collected, feature selection becomes even more difficult.

3. Collecting accurate and reliable data is often difficult in real-world applications. Data can be noisy. Moreover, in many situations, data are streaming at various speeds and are unbounded. Also, real-time applications require fast processing time.
4. Another challenge is that personal differences may influence the success of attention detection, as different persons may behave differently in the same situation. Moreover, some participants in the experimental evaluation may lie by pretending to have been focused when they were distracted.
To address the above issues, we propose a new system that integrates a Head-Motion module, a Pen-Motion module, a Visual-Focus module, and an Active-App module for attention inference. These modules run on inexpensive hardware, and rely on machine learning techniques to select appropriate features to recognize attention-related activities, such as head motions, hand motions, and visual behaviors. These modules are implemented on the Raspberry Pi [20] platform. In particular, the J48 decision tree learning algorithm [27][28] is used to train the motion classification models using discriminative features of sensor data. The behaviors recognized by these models are then fed to an attention inference engine, which consists of two different attention inference algorithms. One applies a rule-based approach, and the other employs a data-driven approach. Finally, visual reports are generated and presented to the users. Extensive experimental results show that the proposed system is efficient and accurate. The outcome of this research has the potential of greatly increasing teaching and learning efficiency in class.
The remainder of this paper is organized as follows. Related work is reviewed in Section II. Section III presents the proposed system. Section IV evaluates the performance of the proposed system. Finally, Section V draws the conclusion and discusses future work.
II. RELATED WORK
This section first reviews the main studies on attention detection. Then, it takes a broader perspective to review other models of human activity recognition. Traditional methods for measuring attention levels can be generally categorized into three types. The first type consists of asking learners to fill questionnaires [22]. The second type is physiological experiments [13], where experts observe the reactions of learners when performing tasks, to infer their attention levels. The third type is direct observation [14], where experts evaluate the thought process of learners based on data recorded during a set period of time using devices like video and voice recorders. Although traditional methods are commonly used, a major drawback is that they require human intervention.
Various devices have been used for attention inference:
1. Electroencephalography devices [15][17] record the electrical activity of human brains. Although they can measure brain waves of a person, they ignore other aspects such as body movements and visual focus.
2. Eye trackers [29][30] detect eye movement trajectories. However, they can be quite expensive and long term use may cause eye injuries [19].
3. Video cameras [3] have been used to detect facial expressions and body movements. However, their use raises privacy issues, requires more computing power, and their accuracy is influenced by factors such as lighting conditions, camera positions, and background interference.
In terms of human activity recognition, solutions can be categorized into sensor-based and vision-based approaches. Sensor-based approaches rely on body-worn inertial sensors to infer physical activities and lifestyles [11]. Daily routines of wearers have been detected using topic models [9]. In another study, single body-worn accelerometers were utilized to recognize social actions, including speaking, laughing, gesturing, drinking, and stepping [8]. Body-worn accelerometers have also been considered to recognize household activities for context-aware computing [5]. A lot of vision-based solutions have been proposed. A camera-based surveillance system was designed for detecting human movements [18]. Other researchers [3] have explored the relation between head rotation, eye gaze direction and facial features to infer human attention. To reduce the computational cost for image processing, a collaborative model using a depth camera and an inertial measurement sensor was proposed [6]. The model uses ensemble classifiers at both the feature levels and decision levels.
III. ATTENTION INFERENCE SYSTEM
A. Classroom Scenario
This study considers the following scenario (Fig. 1): (1) A teacher shows slides for teaching using a projector. Each slide contains a special mark, such as a school logo, used by our system to check if each student is paying attention to the slides. (2) The teacher has a computer in front of him/her, which acts as a server. It collects sensor data and infers students’ attention levels. (3) Each participating student sits at a desk and wears smart glasses or a smart cap. The wearable device is in either case equipped with a camera, an accelerometer and a gyroscope. (4) Each student uses a smart pen to take notes as usual. A SensorTag [26] embedded with an accelerometer and a gyroscope is attached to each pen. (5) Alternatively, a student may also take notes on his/her notebook. It is then assumed that notes are inserted in a PowerPoint file or using a PDF editor.
Fig. 1. The classroom scenario considered in this work.
(2)server&inferenceengine
(1)projectionimage(withlogo)
(3)smartglasses/cap
(4)smartpen
(5)notebook(PPTorPDF)
(1)
(2)
(5) (4) (3)
(1) Projection image (with logo)
(2) Server & inference engine
(3) Smart glasses/cap
(4) Smart pen with SensorTag
(5) Notebook (or Tablet)

Fig. 2. Hardware components of our prototype system.
B. Prototype Design
This section presents the design of our prototype system, based on commodity hardware and a client-server architecture. On the client side, a wearable device implemented on a Raspberry Pi Model B+ [20] has been designed for sensing motion and the visual focus of users. It integrates a camera and a sensor board MPU 6050 containing a 3-axis accelerometer and a 3-axis gyroscope. The accelerometer and gyroscope of MPU 6050 are used to recognize head motions (e.g. raising/lowering the head), while the camera is used to capture the focused field of the wearer for visual-focus detection. These components can be easily integrated into a cap or glasses (see Fig. 2). A SensorTag is attached to each smart pen, and contains a 3-axis accelerometer and a 3-axis gyroscope. The SensorTag on the smart pen is used to detect hand motions (e.g. writing/still) of the user. The communication between SensorTag and Raspberry Pi relies on Bluetooth Low Energy (BLE) protocol. On the server side, Wi-Fi protocols and Apache Http Server Version 2.4 [25] are used to collect data sent from client side. Then, the pen-motion, head-motion and visual-focus modules are run on server to recognize behaviors of users. The recognized behaviors are then fed to an attention inference engine to calculate users’ attention levels. Finally, visualized reports are generated by the engine to indicate each user’s attention levels for different time periods.
C. Overview of the System Architecture
Fig. 3 shows the Input-Processing-Output (IPO) model of the proposed system for a single user. It handles streaming data using a batch model. During each iteration, it receives a batch of data, which includes: (1) The image of the special logo on slides. (2) The image data captured by the user’s smart glasses/cap. (3) 3-axis accelerometer (abbr. ACC) and 3-axis gyroscope (abbr. GYRO) data generated from MPU 6050 of smart cap. (4) 3-axis ACC and 3-axis GYRO data generated from SensorTag of smart pen. (5) The logs of Apps used by the users. The system outputs an attention level report and an activity report, which indicate the attention level of the user and his/her recognized behavior during each time period, respectively. The “processing” part of the system consists of five modules, namely the Head-Motion, Pen-Motion, Visual-Focus, Active-App and Attention Inference Engine modules. These modules communicate based on a client-server architecture, as depicted in Fig. 4. These modules are explained in the following subsections.
Fig. 3. The IPO model of the proposed system for a single user.
Fig. 4. The architecture of the proposed attention inference system.
D. Head-Motion Module
Head motion is an external behavior that may serve as an important indicator of student attention. During the data preprocessing stage, raw sensor data are sampled and segmented. There are six sensor signal sources (received from a 3-axis ACC and a 3-axis GYRO). The sampling rate is 50Hz. Data are partitioned into uniform non-overlapping three-second segments. Segmented data are sent to the server.
Let S = s1, s2, ..., sn be one of the sensor signal sources,
where si (1 i n) is the i-th sample in S. The proposed system extracts the following six time-domain features related to energy or magnitude from S.
Mean is a measure of central tendency, which is defined as
𝑀𝑒𝑎𝑛 𝑆 = 𝑠 = 𝑠𝑖
𝑛𝑖=1
𝑛. (1)
Variance represents the expected squared deviation from the mean, which is defined as
𝑉𝑎𝑟(𝑆) = (𝑠𝑖−𝑠 )2𝑛𝑖=1
𝑛 . (2)
Head-Motion Module
Visual-Focus Module
Pen-Motion Module
OutputProcess Input
Attention Inference
Engine
Attention Level Report
Activity Report
Time
Att
enti
on
Lev
el
Time
…
…
Head motion = {Still}
Head motion = {Up}Head motion = {Down}
App logs from
notebook and tablet
Logo of slides, provided by the
teacher in advance
Image data captured by the smart cap’s
camera
Active-App Module
ACC and GYRO data generated by the smart
cap’s MPU 6050
ACC and GYRO data generated by the smart
pen’s SensorTag
Clie
nt
Sid
eSe
rve
r Si
de
Visual-FocusModule
Pen-Motion Module
Pen-motion Data Preprocessing
Pen-motion Type Recognition
Accelerometer Data
GyroscopeData
Data Segmentation
Writing Still Other
Pen-motion Feature Extraction
Pen-motion Classifier
Head-Motion Module
Head-motion Data Preprocessing
Head-motion Type Recognition
Accelerometer Data
GyroscopeData
Data Segmentation
Up Still Down
Head-motion Feature Extraction
Pen-motion Classifier
Active-AppModule
Attention Inference Engine
Recognized Behaviors
Attention InferenceAlgorithms
Attention ScoringFunctions
Attention Level Reportand
Activity Report

Root Mean Square (RMS) is the square root of the arithmetic mean of the squares of the values in S, which is defined as
𝑅𝑀𝑆(𝑆) = 𝑠𝑖
2 𝑛𝑖=1
𝑛 . (3)
Average Absolute Difference (AAD) measures the statistical dispersion of consecutive samples in S, which is defined as
𝐴𝐴𝐷(𝑆) = 𝑠𝑖−𝑠𝑖−1
𝑛𝑖=2
𝑛−1 . (4)
Zero Crossing Rate (ZCR) measures the number of sign changes in S, which is defined as
𝑍𝐶𝑅(𝑆) = 𝑠𝑖𝑔𝑛 𝑠𝑖 −𝑠𝑖𝑔𝑛 (𝑠𝑖−1) 𝑛𝑖=2
2 , (5)
where sign(x) is a function which returns -1/+1 if the sign of x is negative/positive (0 is regarded as positive).
Mean Crossing Rate (MCR) measures the number of sign changes using the mean as baseline, which is defined as
𝑀𝐶𝑅(𝑆) = 𝑠𝑖𝑔𝑛 𝑠𝑖−𝑠 −𝑠𝑖𝑔𝑛 (𝑠𝑖−1−𝑠 ) 𝑛𝑖=2
2 . (6)
Since there are two types of sensors (i.e., ACC and GYRO) and each sensor has three axes, calculating the above features
results in (236)=36 features. Moreover, for each type of sensor, the system also measures the covariance and correlation between each pair of its two sensor signal sources.
Let A = a1, a2, ..., an and B = b1, b2, ..., bn be two sensor signal sources in a segment. The covariance and correlation between A and B are measured using the following two formalizations.
Covariance measures how much A and B change together, which is defined as
𝐶𝑜𝑣(𝐴, 𝐵) = 𝑎𝑖−𝑎 (𝑏𝑖−𝑏 ) 𝑛
𝑖=1
𝑛 . (7)
Correlation measures the strength and the direction of the relationship between A and B, which is defined as
𝐶𝑜𝑟𝑟(𝐴, 𝐵) =𝑐𝑜𝑣 (𝐴,𝐵)
𝜎𝐴𝜎𝐵 , (8)
where 𝜎𝐴 and 𝜎𝐵 are the standard deviations of A and B, respectively.
Since there are two types of sensors and each sensor has three axes, measuring the covariance and correlation between each pair of axes results in 12 features. Therefore, the system totally extracts (36+12) = 48 features. Then, the 48 defined features are taken as input by the head-motion module to train a classifier offline, which is then used for online recognition of head motions. Three head motions are considered: {Still, Up (raising the head), Down (lowering the head)}. The J48 decision tree learning algorithm offered in Weka [27] is used for training phase. The training phase is performed in three steps.
Step 1: Head-motion training data are collected and each data is labeled with its class. Let C be the set of classes {Still, Up, Down}. The result is a training set TrainDS
= {(d1, g1), (d2, g2), ..., (dm, gm)}, where di (1 i m)
is the i-th data instance and giC (1 i m) is the label of di.
Step 2: Each training instance di is transformed into a feature vector fi described by the 48 defined features. This results in a transformed dataset FDS = {(f1, g1), (f2, g2), ...., (fm, gm)}.
Step 3: This dataset FDS is fed to the J48 decision tree learning algorithm to train the head-motion classifier, called HM-Classifier(.).
The trained classifier is then used for online recognition. As the server continuously receives segmented head-motion data from clients, it applies the HM-Classifier(.) to recognize the head-motion type of each segment. This is performed in two steps.
Step 1: For each received segment, the 48 features are extracted, denoted as fSD.
Step 2: HM-Classifier(.) is then applied to classify fSD. The output is its class label, denoted as HM-Classifier(fSD).
Note that the number of features can be reduced by using the gain ratio goodness function [27][28] of the J48 classifier while preserving a high accuracy.
E. Pen-Motion Module
Pen motion is another external behavior that can help measure student’s attention. The pen-motion module is designed to detect if a student is writing on a piece of paper. The SensorTag on the smart pen sends raw 3-axis ACC and 3-axis GYRO data at a sampling rate of 50Hz to the smart cap. The smart cap collects and segments the received data and then sends segmented data to the server every three seconds.
The server then extracts the 48 features defined in Section III.D from the sensor data and classifies the student’s pen- motion data using a classifier. This classifier is trained once offline. Three types of pen motions are considered: {Still, Writing, Other}. For the training phase, segments of raw sensor data are manually labeled with these three classes. The training phase is done using the J48 classifier from Weka. The trained classifier is applied to online recognition every three seconds to detect student’s pen motions. As previously explained, the number of classifier’s features can be reduced using the gain ratio goodness function [28]. By applying this technique, the decision tree learning algorithm selects only the most discriminative features for motion recognition. In our implementation, this technique considerably reduces execution time for recognition, while preserving a high accuracy.
F. Visual-Focus Module
The visual focus of a human is also an important indicator of the attention, as humans tend to pay attention to objects appearing in the center of their visual field. In our implementation, a camera is attached to the smart cap. The assumption is that the camera captures what the student sees, and the images can thus reveal what is currently drawing the student’s attention. In our design, the camera is programmed to record image data only when the user’s head is in motion.

Fig. 5. The system architecture of the visual-focus module.
Fig. 6. Examples of slide detection using the SURF algorithm.
Fig. 7. An example of feature point detection using the SURF algorithm.
Considering the size of image data and transmission rate, the Visual-Focus module is run on the Raspberry Pi on the client side’s smart cap. Fig. 5 shows the workflow of this module, which consists of two sub-modules: Slide Detection and Hand Detection.
(a) Slide Detection
If the head-motion type recognized by the Head-Motion module is {Up} (i.e., raising the head), the Slide Detection module will be triggered to identify whether the user is paying attention to the slides. Our system assumes that a school logo is shown on each slide. If the logo is found in an image captured by the camera, it is very likely that the slide is within the student’s field of vision, and that the student is paying attention to its content. To find the logo from the captured image, we use the Speed-Up Robust Feature (SURF) algorithm [4] offered in the OpenCV library. Fig. 6 shows two examples of recognition results using SURF. As depicted in Fig. 7, SURF extracts feature points from the logo image and tries to match these points with the captured image. If the number of matched
points is greater than a minimum matching number threshold , the system assumes that the slide is within the student’s field of vision. Moreover, the system also verifies whether the slide is centered in the student’s field of vision. If the slide is off-center
by a distance greater than a minimum off-center threshold , the system assumes that the student is not looking at the slide.
Fig. 8. An example of skin color mask for hand recognition.
(b) Hand Detection
If the head-motion type recognized by the Head-Motion module is {Down} (i.e., the head is lowered), the Hand Detection module will be triggered to check if the user’s hand appears in the captured image. This information will be further integrated with the recognition results of the pen-motion module to determine if the user is taking notes. The assumption is that a student’s hand should be visible in the images captured by the camera if he/she is taking notes, and that it should not be visible if the student is looking at the slides. To check if a hand appears in a captured image, we apply a method based on skin color masks using the YCbCr color space [7]. This method extracts all the potentially skin-colored pixels from a captured image. If the Cb or Cr values of a pixel are in the [98, 142] or [133, 177] intervals, respectively, the pixel is considered as skin-colored [12]. For example, consider the left part of Fig. 8, which shows an image captured by the camera. The right part of Fig. 8 illustrates the detected skin-colored pixels (represented as white pixels). If the number of skin-colored pixels is no less
than a minimum pixel threshold , the system assumes that the hand of the user is visible in the captured image.
G. Active-App Module
Considering that more and more students take notes on their notebooks and tablets during lectures, we found that identifying active Apps that are currently being used by the students is an efficient way to infer their attention level. In this work, it is assumed that notes are taken on PowerPoint, Word or PDF files. The Active-App module logs the Apps and files currently used on a student’s notebook or tablet, and sends this information to the server. The server uses this data to check if a student is paying attention to the course’s slides.
H. Attention Inference Engine
When user’s behaviors are detected (i.e., head motion, pen-motion, visual focus, and Apps used by user), the proposed attention inference engine will infer the user’s attention level based on these behaviors. Two attention inference algorithms are proposed, called the rule-based approach and the data-driven approach, respectively.
(a) Rule-based Approach
The main characteristic of the rule-based approach is that it infers student’s attention levels based on user-defined decision rules. These rules have the merit of being intuitive, interpretable and to allow fast recognition. Fig. 9 shows the workflow of the rule-based approach. The algorithm is an iterative method. In each iteration, it takes the recognition results of modules as inputs, and outputs an attention state. Two types of attention state are considered: {Focused, Unfocused}.
HandFound
NoHand
Slide Detection
HandDetection
Head-motion Type
Slide Found
No Slide
Visual-Focus Module
Head-motion Type ={Up} Head-motion Type = {Down}

Fig. 9. Workflow of the rule-based approach.
In an iteration, the algorithm proceeds as follows. At the beginning, the algorithm checks whether the user’s head-motion type is {Still} or not. If it is true and the still duration is no less than a threshold, the user is likely in a daze and thus the algorithm outputs {Unfocused}. If the head-motion type is not {Still}, the algorithm then checks whether the user’s head-motion type is {Up} or {Down}.
If the head-motion type is {Up}, the algorithm uses the recognition result of the Slide Detection module to identify whether the slide appears in the user’s visual field. If the slide appears in the user’s visual field, the algorithm outputs {Focused}. On the contrary, it outputs {Unfocused} if the slide does not appear in the user’s visual field. If the head-motion type is {Down}, the algorithm uses the recognition result of hand detection to identify whether the user’s hand appears in the user’s visual field. If the hand appears in the user’s visual field, the algorithm uses the recognition result of the pen-motion module to identify whether the user had written or not. If the recognition result of the pen-motion module is {Writing}, the algorithm outputs {Focused}. If the recognition result is not {Writing} or the hand does not appear in the user’s visual field, the algorithm uses the result of the Active-App module to check whether the user had used class-related Apps. If the result is true, the algorithm outputs {Focused}. Otherwise, {Unfocused} is outputted.
(b) Data-driven Approach
A non-empirical approach is to use a data-driven solution. It uses machine learning methods to find hidden information in the collected data, and utilizes this information for building a decision model for attention inference. If there are more useful training data being used for model building, the inference results will be more accurate. Fig. 10 shows the workflow of the data-driven approach. The algorithm is an iterative method.
In each iteration (also called window), it takes -second recognition results of the Head-Motion, Pen-Motion, Visual-Focus, and Active-App modules as inputs. In our
implementation, is set to 30. Then, the algorithm extracts high-level features from the input data and classifies the student’s attention state (i.e., Focused or Unfocused) using a classifier. The classifier is trained offline. For the training phase, the class of each training instance is manually labeled. The training phase is done using the J48 classifier from Weka.
The trained classifier is applied to online recognition every seconds to detect student’s attention state.
Fig. 10. Workflow of the data-driven approach.
Fig. 11. An example of the input of the data-driven approach.
Next, we introduce the high-level features extracted by the
data-driven approach. Let H1, H2, H3, and H4 denote the -second recognition results of the Head-Motion, Pen-Motion, Visual-Focus, and Active-App modules, respectively. Let Hi =
hi1, hi2, ..., hin, 1 i 4, where hij (1 j n) is the j-th data instance in Hi. Data instances in Hi are also called activities. For example, in Fig. 11, the 30-second recognition results from
the head-motion module is H1 = Still, Still, Down, Up, Down,
Up, Still, Still, Down, Down. Let Ri = {ri1, ri2, ..., r|Ri |} be the set of activities in Hi. For example, H1 has three types of
activities {Still, Up, Down}. Then, for each input Hi (1 i 4), the system extracts the following high-level features.
The number of two adjacent data instances in Hi that are
different activities. For example, in the aforementioned H1,
that number is 6.
The number of activities that are rik (1 k |Ri|) in Hi. For
example, the number of activities that are {Down} in H1 is
4.
The maximum duration of rik (1 k |Ri|) in Hi. For
example, the maximum duration of {Down} in H1 is max{1,
1, 2} = 2.
The minimum duration of rik (1 k |Ri|) in Hi. For
example, the minimum duration of {Down} in H1 is min{1,
1, 2} = 1.
The average duration of rik (1 k |Ri|) in Hi. For example,
the average duration of {Down} in H1 is (1+1+2)/3 = 1.33.
(c) Attention Scoring Function
The attention scoring function is used to indicate the strength of the student’s attention level in a visual manner. Recall that in our proposed attention inference algorithms, in each iteration or window, they will output an attention state
(i.e., {Focused} or {Unfocused}). Therefore, in the -th
iteration, attention states are obtained. Let ST = st1, st2, ...,
st be the ordered set of these attention states. The attention score of ST is defined as
Score(ST) = 1
𝑔(𝑠𝑡𝑖)𝑖=1 , (9)
where 𝑔(si) returns a value 𝑔1 (𝑔1 can be defined as a positive value) if sti is {Focused}, and returns 𝑔2 (𝑔2 can be defined as a negative value or zero) if sti is {Unfocused}.
In addition to the above attention scoring function, teachers can design other interesting scoring functions depending on the requirements of the applications.
Start
Is the user’s head still?
Yes
No
Up
Yes
No Yes
Yes
No
No
Yes
Attention State
Unfocused
Focused
What is the user’s head
motion type?
Use class-related files on notebook or
tablet?
Take notes by smart pen?
Does a handappear in the
user’s visual field?
Still duration > threshold?
Yes
No
Unfocused Unfocused UnfocusedFocused Focused Focused
Does slide appear in the user’s visual field?
Down
Unfocused
Focused
ClassifierHigh-level
Feature Extraction
RecognizedBehaviors
1 Window = 30 Seconds
Down Down Down DownStill Still Still StillUp UpHead Motions
Pen Motions
Visual Focus
Active Apps
Still Still Still StillWrite Other Write OtherOther Other
SlideFound
NoSlide
FoundHand
FoundHand
NoHand
NoHand
PPT
IV. EXPERIMENTS AND PERFORMANCE EVALUATION
Experiments were conducted to assess the performance of the proposed Head-Motion module, Pen-Motion module, Slide Detection module, and the two attention inference algorithms.
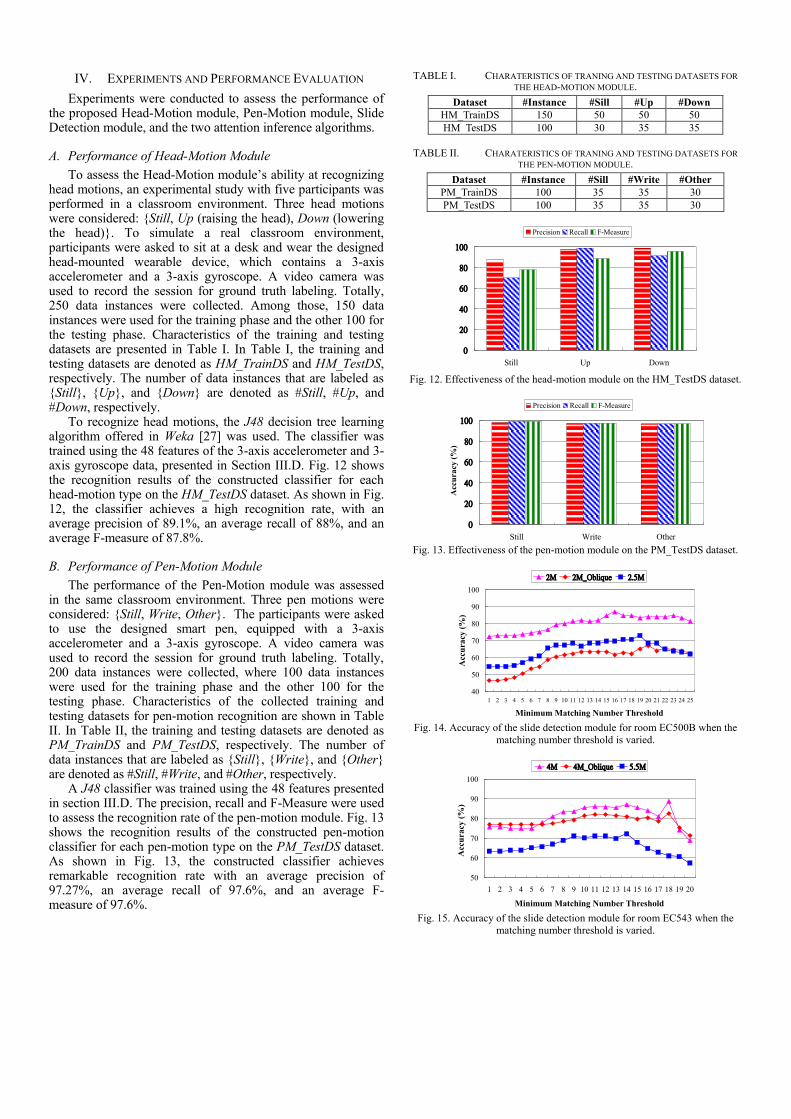
A. Performance of Head-Motion Module
To assess the Head-Motion module’s ability at recognizing head motions, an experimental study with five participants was performed in a classroom environment. Three head motions were considered: {Still, Up (raising the head), Down (lowering the head)}. To simulate a real classroom environment, participants were asked to sit at a desk and wear the designed head-mounted wearable device, which contains a 3-axis accelerometer and a 3-axis gyroscope. A video camera was used to record the session for ground truth labeling. Totally, 250 data instances were collected. Among those, 150 data instances were used for the training phase and the other 100 for the testing phase. Characteristics of the training and testing datasets are presented in Table I. In Table I, the training and testing datasets are denoted as HM_TrainDS and HM_TestDS, respectively. The number of data instances that are labeled as {Still}, {Up}, and {Down} are denoted as #Still, #Up, and #Down, respectively.
To recognize head motions, the J48 decision tree learning algorithm offered in Weka [27] was used. The classifier was trained using the 48 features of the 3-axis accelerometer and 3-axis gyroscope data, presented in Section III.D. Fig. 12 shows the recognition results of the constructed classifier for each head-motion type on the HM_TestDS dataset. As shown in Fig. 12, the classifier achieves a high recognition rate, with an average precision of 89.1%, an average recall of 88%, and an average F-measure of 87.8%.
B. Performance of Pen-Motion Module
The performance of the Pen-Motion module was assessed in the same classroom environment. Three pen motions were considered: {Still, Write, Other}. The participants were asked to use the designed smart pen, equipped with a 3-axis accelerometer and a 3-axis gyroscope. A video camera was used to record the session for ground truth labeling. Totally, 200 data instances were collected, where 100 data instances were used for the training phase and the other 100 for the testing phase. Characteristics of the collected training and testing datasets for pen-motion recognition are shown in Table II. In Table II, the training and testing datasets are denoted as PM_TrainDS and PM_TestDS, respectively. The number of data instances that are labeled as {Still}, {Write}, and {Other} are denoted as #Still, #Write, and #Other, respectively.
A J48 classifier was trained using the 48 features presented in section III.D. The precision, recall and F-Measure were used to assess the recognition rate of the pen-motion module. Fig. 13 shows the recognition results of the constructed pen-motion classifier for each pen-motion type on the PM_TestDS dataset. As shown in Fig. 13, the constructed classifier achieves remarkable recognition rate with an average precision of 97.27%, an average recall of 97.6%, and an average F-measure of 97.6%.
TABLE I. CHARATERISTICS OF TRANING AND TESTING DATASETS FOR
THE HEAD-MOTION MODULE.
Dataset #Instance #Sill #Up #Down
HM_TrainDS 150 50 50 50
HM_TestDS 100 30 35 35
TABLE II. CHARATERISTICS OF TRANING AND TESTING DATASETS FOR
THE PEN-MOTION MODULE.
Dataset #Instance #Sill #Write #Other
PM_TrainDS 100 35 35 30
PM_TestDS 100 35 35 30
Fig. 12. Effectiveness of the head-motion module on the HM_TestDS dataset.
Fig. 13. Effectiveness of the pen-motion module on the PM_TestDS dataset.
Fig. 14. Accuracy of the slide detection module for room EC500B when the
matching number threshold is varied.
Fig. 15. Accuracy of the slide detection module for room EC543 when the
matching number threshold is varied.
0
20
40
60
80
100
Still Up Down
Precision Recall F-Measure
Acc
ura
cy (
%)
0
20
40
60
80
100
Still Write Other
Precision Recall F-Measure
Acc
ura
cy (
%)
40
50
60
70
80
90
100
1 2 3 4 5 6 7 8 9 10 11 12 13 14 15 16 17 18 19 20 21 22 23 24 25
2M 2M_Oblique 2.5M
Acc
ura
cy (
%)
Minimum Matching Number Threshold
50
60
70
80
90
100
1 2 3 4 5 6 7 8 9 10 11 12 13 14 15 16 17 18 19 20
4M 4M_Oblique 5.5M
Acc
ura
cy (
%)
Minimum Matching Number Threshold

C. Performance of Slide Detection Module
The performance of the Slide Detection module was assessed in an experiment conducted in two different locations: a 10-person room (EC500B) and a 20-person room (EC543) at National Chiao Tung University. In this experiment, five participants were asked to attend a lecture and press a button when they were looking at the slides, to collect ground truth labels for the recorded data. The wearable device cameras captured images with a 800×600 resolution. The minimum off-center threshold was set to 300. We evaluated the accuracy of the Slide Detection module under the following three factors: (1) the minimum matching number threshold, (2) the distance between the user and projection screen, and (3) the viewing angle (i.e., oblique or front facing) of the user. Fig. 14 and Fig. 15 show the results. Based on Fig. 14 and 15, we make the following observations. First, we observe that if the minimum matching number threshold is increased, the accuracy increases until it reaches a peak, and then the accuracy decreases afterwards. This is reasonable since a higher threshold means a stricter requirement for image recognition. When the threshold is set too low, noise images may be considered as matching with the slide logo. Second, the accuracy decreases as the distance between the user and the projection screen increases. This is because as the distance increases, the captured image of the logo become smaller and less clear. As a result, the recognition rate of the system decreases. Third, the system is more accurate for front facing participants that for those viewing the projection screen from an oblique perspective.
D. Performance of Attention Inference Engine
The performance of the proposed attention inference
engine, using the rule-based approach or the data-driven
approach, was also evaluated. The experiment was conducted
with ten participants. Each participant attended a distinct 50-
minute lecture in a classroom, seated front facing, at a 2m
distance from the projection screen. A video camera was used
for ground truth labeling. The head-motion and pen-motion
classifiers, introduced in Section IV.A and Section IV.B, were
used for head-motion and pen-motion recognitions,
respectively. For the Slide Detection module, the minimum
matching number threshold and the minimum off-center
threshold θ were set to 18 and 300, respectively. For the Hand
Detection module, the minimum pixel threshold was set to
80,000. Fig. 16 shows results obtained by the rule-based
approach. It was able to correctly identify the attention state of
being focused and unfocused with an average
precision of 78.1%, an average recall of 61%, and an average
F-measure of 69.2%. Fig. 17 shows the accuracy of the data-
driven approach using various machine learning algorithms,
including J48 decision tree, Random Forest [28], and Support
Vector Machine (SVM) [28]. As shown in this figure, different
classifiers have similar accuracy, but the J48 decision tree
achieves the highest accuracy. Fig. 18 shows the performance
of the data-driven approach using J48 in terms of precision,
recall, and F-measure. The proposed data-driven approach
achieves around 80% F-measure values for both the Focused
and Unfocused attention states, which demonstrates that it is
effective at identifying the attention states of students in class.
Fig. 16. The performance of rule-based approach in terms of precision, recall
and F-measure.
Fig. 17. The performance comparision of the data-driven approach using
different classifiers.
Fig. 18. The performance of data-driven approach in terms of precision, recall
and F-measure.
Fig. 19. The performance comparison of two attention inference approaches.
Fig. 19 compares the accuracy of the rule-based approach
and the data-driven approach. It is found that the data-driven
approach is the most accurate. This is because the data-driven
approach uses machine learning methods to find hidden
relationships between extracted high-level features and
attention states for attention inference, while the rule-based
approach uses intuitive decision rules for inference. However,
the rule-based approach can output the recognition result
every three seconds, while the data-driven approach needs to
collect thirty seconds of data to produce a result.
0
20
40
60
80
100
Focused Unfocused
Precision Recall F-measure
0
20
40
60
80
100
J.48 RandomForest SVM
J.48 RandomForest SVM
Acc
ura
cy (
%)
0
20
40
60
80
100
Focused Unfocused
Precision Recall F-measure
0
20
40
60
80
100
Rule-based Approach Data-driven Approach
Acc
ura
cy (
%)

V. CONCLUSIONS AND FUTURE WORKS
Assessing attention levels of students is highly desirable. It can let students understand their own learning behavior so that they can learn more efficiently. For teachers, this information is also very important as it indicates how students react to their teaching. This information is thus crucial for the design of strategies for capturing and maintaining student’s attention.
In this work, we have demonstrated that it is possible to accurately infer the attention levels of students in a classroom based on their external behaviors, using various types of wearable sensors. A new wearable system was designed, consisting of four modules, named the Head-Motion, Pen-Motion, Visual-Focus, and Active-App modules. These modules recognize and track different activities of users, to provide behavioral data to the designed attention inference engine, which calculates users’ attention levels. This engine is equipped with two novel attention inference algorithms, named the rule-based approach and the data-driven approach. The former uses intuitive decision rules to infer the attention state of a student, while the latter relies on machine learning methods. The engine can generate visual reports to indicate each student’s attention levels and class-related activities. Extensive experiments were conducted to evaluate the proposed system. Results have shown that it is highly accurate in various real-life settings. The proposed methodology thus has the potential of greatly increasing learning and teaching efficiency in the classroom.
For future work, other types of activities and sensors will be considered to further refine the attention inference methods presented in this paper. Moreover, a larger scale evaluation of the system is also planned, where full classrooms of students will be equipped with the designed wearable modules.
ACKNOWLEDGEMENT
This work was partially supported by Ministry of Science and Technology, Taiwan, R.O.C. under grant 104-2221-E-009 -113 -MY3.
REFERENCES
[1] J. R. Anderson, “Cognitive Psychology and Its Implications,”, 6th ed. Worth Publishers, 2004.
[2] A. Al-Fuqaha, M. Guizani, M. Mohammadi, M. Aledhari, and M. Ayyash, “Internet of Things: A Survey on Enabling Technologies, Protocols, and Applications,” IEEE Communications Surveys & Tutorials, Vol. 17, No. 4, pp. 2347-2376, 2015.
[3] S. Asteriadis, K. Karpouzis, and S. Kollias, “The Importance of Eye Gaze and Head Pose to Estimating Levels of Attention,” in Proc. of IEEE International Conference on Games and Virtual Worlds for Serious Applications, pp. 186-191, 2011.
[4] H. Bay, A. Ess, T. Tuytelaarsm and L. V. Gool, “Speeded-Up Robust Features (SURF),” Computer Vision and Image Understanding, Vol. 110, Issue 3, pp. 346-359, 2008.
[5] L. Bao and S. S. Intille, “Activity Recognition from User-annotated Acceleration Data,” in Proc. of International Conference on Pervasive, pp. 1-17, 2004.
[6] C. Chen, R. Jafari, and N. Kehtarnavaz, “Improving Human Action Recognition using Fusion of Depth Camera and Inertial Sensors,” IEEE Trans. on Human-Machine Systems, Vol. 45, No. 1, pp. 51-61, 2015.
[7] DOCUMENTATION | OpenCV, http://opencv.org/documentation.html.
[8] H. Hung, G. Englebienne, and J. Kools, “Classifying Social Actions with a Single Sccelerometer,” in Proc. of ACM International Joint Conference on Pervasive and Ubiquitous Computing, pp. 207-210, 2013.
[9] T. Huynh, M. Fritz, and B. Schiele, “Discovery of Activity Patterns using Topic Models,” in Proc. of ACM International Conference on Ubiquitous Computing, pp. 10-19, 2008.
[10] International Data Corporation (IDC), http://www.idc.com.
[11] A. M. Khan, Y.-K. Lee, S. Y. Lee, and T.-S. Kim, “A Triaxial Accelerometer-based Physical-activity Recognition via Augmented-signal Features and a Hierarchical Recognizer,” IEEE Trans. on Information Technology in Biomedicine, Vol. 14, No.5, pp. 1166-1172, 2010.
[12] P. Kakumanu, S. Makrogiannis, and N. Bourbakis, “A Survey of Skin-color Modeling and Detection Methods,” Pattern Recognition, Vol. 40, Issue 3, pp. 1106–1122, 2007.
[13] D. M. Landers, S. H. Boutcher, and M. Q. Wang, “A Psychophysiological Study of Archery Performance,” Research Quarterly for Exercise and Sport, Vol. 57, pp. 236-244, 1986.
[14] G. W. Lauth, B. G. Heubeck, and K. Mackowiak, “Observation of Children with Attention-Deficit Hyperactivity (ADHD) problems in Three Natural Classroom Contexts,” British Journal of Educational Psychology, Vol. 76, pp. 385-404, 2006.
[15] Y. Li, X. Li, M. Ratcliffe, L. Liu, Y. Qi, and Q. Liu, “A Real-time EEG-Based BCI System for Attention Recognition in Ubiquitous Environment,” in Proc. of ACM International Workshop on Ubiquitous Affective Awareness and Intelligent Interaction, pp. 33-40, 2011.
[16] Oscar D. Lara and Miguel A. Labrador, “A Survey on Human Activity Recognition Using Wearable Sensors,” IEEE Communications Surveys & Tutorials, Vol. 15, No. 3, 2013.
[17] D. Ming, Y. Xi, M. Zhang, H. Qi, L. Cheng, B. Wan, and L. Li, “Electroencephalograph (EEG) Signal Processing Method of Motor Imaginary Potential for Attention Level Classification,” in Proc. of IEEE International Conference on Engineering in Medicine and Biology Society, pp. 4347-4351, 2009.
[18] V. D. Nguyen, M. T. Le, A. D. Do, H. H. Duong, T. D. Thai, and D. H. Tran, “An Efficient Camera-based Surveillance for Fall Detection of Elderly People,” in Proc. of IEEE Conference on Industrial Electronics and Applications, pp. 994-997, 2014.
[19] W. R. Pruehsner and J. D. Enderie, “Infrared Radiant Intensity Exposure Safety Study for the Eye Tracker,” Biomed Sci Instrum, Vol. 41, pp. 299-304, 2005.
[20] Raspberry Pi Foundation, https://www.raspberrypi.org.
[21] S. Rallapalli, A. Ganesan, K. K. Chintalapudi, V. N. Padmanabhan, and L. Qiu, “Enabling Physical Analytics in Retail Stores using Smart Glasses,” in Proc. of ACM International Conference on Mobile Computing and Networking, pp. 115-126, 2014.
[22] J. M. Schepers, “The Construction and Evaluation of an Attention Questionnaire,” SA Journal of Industrial Psychology, Vol. 33, pp. 16-24, 2007.
[23] M. M. Sohlberg and C. A. Mateer, “Effectiveness of an Attention Training Program,” Journal of Clinical and Experimental Neuropsychology, Vol. 9, Issue 2, pp. 117-130, 1987.
[24] T. Shany, S. J. Redmond, M. R. Narayanan, and N. H. Lovell, “Sensors-based Wearable Systems for Monitoring of Human Movement and Falls,” IEEE Sensors Journal, Vol. 12, pp. 658-670, 2012.
[25] The Apache Software Foundation, https://httpd.apache.org/.
[26] The SensorTag Story-Texas Instruments, http://www.ti.com/ww/en/wireless_connectivity/sensortag2015/?INTC=SensorTag&HQS=sensortag.
[27] Weka 3: Data Mining Software in Java, http://www.cs.waikato.ac.nz/ml/weka/.
[28] I. Witten, E. Frank, and M. A. Hall, “Data Mining: Practical Machine Learning Tools and Techniques,” 3rd ed. Morgan Kaufmann, 2005.
[29] Y. Xu, N. Stojanovic, L. Stojanovic, and T. Schuchert, “Efficient Human Attention Detection based on Intelligent Complex Event Processing,” in Proc. of ACM International Conference on Distributed Event-Based Systems, pp. 379-380, 2012.
[30] Z. Ye, Y. Li, A. Fathi, Y. Han, A. Rozga, G. D. Abowd and, J. M. Rehg, “Detecting Eye Contact using Wearable Eye-tracking Glasses,” in Proc. of ACM International Conference on Ubiquitous Computing, pp. 699 -704, 2012.