Embed Size (px)
Citation preview
fmicb-08-01784 September 16, 2017 Time: 18:1 # 1
METHODSpublished: 20 September 2017
doi: 10.3389/fmicb.2017.01784
Edited by:Miguel A. Aon,
National Institute on Aging (NIH),United States
Reviewed by:Boris Görke,
University of Vienna, AustriaD. Brian Foster,
Johns Hopkins School of Medicine,United States
*Correspondence:Jacob G. Malone
Specialty section:This article was submitted to
Microbial Physiology and Metabolism,a section of the journal
Frontiers in Microbiology
Received: 14 May 2017Accepted: 04 September 2017Published: 20 September 2017
Citation:Grenga L, Chandra G, Saalbach G,
Galmozzi CV, Kramer G andMalone JG (2017) Analyzing
the Complex Regulatory Landscapeof Hfq – an Integrative, Multi-OmicsApproach. Front. Microbiol. 8:1784.
doi: 10.3389/fmicb.2017.01784
Analyzing the Complex RegulatoryLandscape of Hfq – an Integrative,Multi-Omics ApproachLucia Grenga1,2, Govind Chandra1, Gerhard Saalbach1, Carla V. Galmozzi3,Günter Kramer3,4 and Jacob G. Malone1,2*
1 Department of Molecular Microbiology, John Innes Centre, Norwich, United Kingdom, 2 School of Biological Sciences,University of East Anglia, Norwich, United Kingdom, 3 Center for Molecular Biology of the University of Heidelberg,DKFZ-ZMBH Alliance, Heidelberg, Germany, 4 German Cancer Research Center, Heidelberg, Germany
The ability of bacteria to respond to environmental change is based on the abilityto coordinate, redirect and fine-tune their genetic repertoire as and when required.While we can learn a great deal from reductive analysis of individual pathways andglobal approaches to gene regulation, a deeper understanding of these complexsignaling networks requires the simultaneous consideration of several regulatory layersat the genome scale. To highlight the power of this approach we analyzed the Hfqtranscriptional/translational regulatory network in the model bacterium Pseudomonasfluorescens. We first used extensive ‘omics’ analyses to assess how hfq deletion affectsmRNA abundance, mRNA translation and protein abundance. The subsequent, multi-level integration of these datasets allows us to highlight the discrete contributions by Hfqto gene regulation at different levels. The integrative approach to regulatory analysis wedescribe here has significant potential, for both dissecting individual signaling pathwaysand understanding the strategies bacteria use to cope with external challenges.
Keywords: Pseudomonas, ribosomal profiling, multi-omics analysis, Hfq, integrative approach
INTRODUCTION
The ability to control expression of their genetic repertoire is a key strategy adopted by bacteriato adapt to changing environments, and cope with a range of external challenges (Fong et al.,2005; López-Maury et al., 2008; Silva et al., 2011). However, transcriptional control does notgenerally occur independently of other regulatory mechanisms. While regulation at the level oftranscript abundance represents an important level of control, it is emerging that the extent ofpost-transcriptional regulation of gene expression in bacteria has been relatively underestimated,with recent studies highlighting the central importance of integrated post-transcriptional andpost-translational control mechanisms to the formation of a plastic environmental response(Picard et al., 2009; Jeong et al., 2016). To fully understand how global regulatory responses arecontrolled requires the genome-scale characterization of several layers of regulation, including bothpost-transcriptional and post-translational events, and the integration of multiple ‘omics’ analyses.
To illustrate the relevance of this approach we focused on the protein Hfq in the plantgrowth-promoting bacterium Pseudomonas fluorescens. Hfq is a pleiotropic regulator of bacterialgene expression impacting, in some organisms, the expression of up to 20% of all genes(Chao and Vogel, 2010). The regulatory role of Hfq is ascribed mainly to its function asan RNA-chaperone, facilitating interactions between bacterial non-coding RNAs and theirmRNA targets. Thus, Hfq modulates mRNA stability and translation alongside sRNA-mediatedtranscription antitermination (Sedlyarova et al., 2016). Importantly, Hfq can also regulate
Frontiers in Microbiology | www.frontiersin.org 1 September 2017 | Volume 8 | Article 1784
fmicb-08-01784 September 16, 2017 Time: 18:1 # 2
Grenga et al. Integrated Analysis of Regulatory Datasets
gene expression by acting alone and influencing mRNApolyadenylation or translation (Valentin-Hansen et al., 2004),or by directly interacting with DNA (Cech et al., 2016). In P.fluorescens, Hfq is not essential for survival but plays a criticalrole during niche adaptation, with reduced Hfq levels resultingin pronounced proteomic changes and phenotypes includingincreased surface attachment, reduced motility and severelycompromised wheat rhizosphere colonization (Little et al., 2016).
Several studies have been performed to characterize potentialroles for Hfq in different bacteria by phenotypic, transcriptomicand proteomic analyses of deletion mutants (Sonnleitner et al.,2006; Torres-Quesada et al., 2010; Cui et al., 2013; Wilf et al.,2013; Bilusic et al., 2014; Boudry et al., 2014; Deng et al., 2014;Hämmerle et al., 2014; Holmqvist et al., 2016). However, theexistence of different, interacting regulatory layers markedlyreduces the predictive power of individual transcriptomicand proteomic studies (Arraiano and Maquat, 2003). Forexample, a purely transcriptomic approach to characterizeHfq-based regulation is likely to miss many important post-transcriptional interactions. Although measuring changes inprotein abundance will capture translational impacts thatoccur without corresponding changes at the transcriptionallevel, such proteomic experiments are unable to distinguishbetween different levels of regulation. In addition, comprehensiveproteomic analysis relies on state-of-the-art MS combined withaccurate quantification methods.
Recently, RNomics and deep sequencing-led approaches todetect transcriptome-wide binding sites of Hfq in differentbacteria have enabled researchers to examine the specificityof Hfq interactions with its RNA ligands (Feng et al., 2015;Papenfort et al., 2015; Holmqvist et al., 2016). Nonetheless, anddespite these ground breaking analyses, many aspects of Hfqregulation remain unknown. Moreover, none of these studiesshed light on the Hfq translatome, despite the importance ofHfq (alongside CsrA/RsmA and ProQ (Holmqvist et al., 2016;Smirnov et al., 2016) as a global regulator of post-transcriptionalgene expression.
To address the complex role of Hfq in P. fluorescens and builda comprehensive model of its regulon, we carried out an extensivemulti-omics (mRNA abundance, translatome and proteome)analysis of the P. fluorescens 1hfq mutant. By combining datasetsfrom three distinct experimental approaches, we are able toidentify and dissect the effect of hfq deletion on gene regulationat different levels. Our analysis also provides evidence suggestinga novel role for Hfq as a non-specific regulator of ribosomal-RNA interaction. The workflow we describe here has enabledus to produce a highly comprehensive picture of bacterial generegulation.
RESULTS
Parallel Global Analyses of theP. fluorescens 1hfq MutantTo detect Hfq-regulated genes in P. fluorescens SBW25, wedetermined the transcriptomic, translatomic and proteomicprofiles of the wild type and 1hfq mutant strains (Supplementary
Figure S1). First, to confirm that the 1hfq mutant (Littleet al., 2016) was non-polar we conducted qRT-PCR analysis onthe downstream gene (hflX), whose expression was unaffectedby hfq deletion. In addition, we were able to complementthe hfq deletion phenotype with a plasmid-borne copy of hfq(Supplementary Figure S2). In each case, the experiments werecarried out in identical conditions, with cells grown to lateexponential phase in defined M9 medium supplemented with0.4% pyruvate and 0.4% casamino acids. In this medium,compared to LB, the hfq mutant exhibited a reduced growthrate and entered stationary phase at a slightly lower cell densitythan wild type SBW25 (Supplementary Figure S2). This suggeststhat while hfq is not essential, it is required for optimal bacterialgrowth in P. fluorescens. Appropriate cell densities were thenchosen to ensure that samples were taken from wild type and1hfq at comparable growth phases. We decided to characterizeHfq-mediated regulation in the late exponential phase, as thisallowed us to avoid the drastic changes in gene expressionpatterns (both transcriptional and translational) that are oftenassociated with entry into stationary phase. qRT-PCR performedon late exponential and stationary phase SBW25 culturesdemonstrated that hfq transcription remains stable during thisgrowth period (Supplementary Figure S2). Similarly, Westernblotting with a C-terminal flag-tagged protein showed that Hfqabundance does not change substantially during this part of theSBW25 growth cycle (Supplementary Figure S2). Two biologicalreplicates of each strain were analyzed for each dataset.
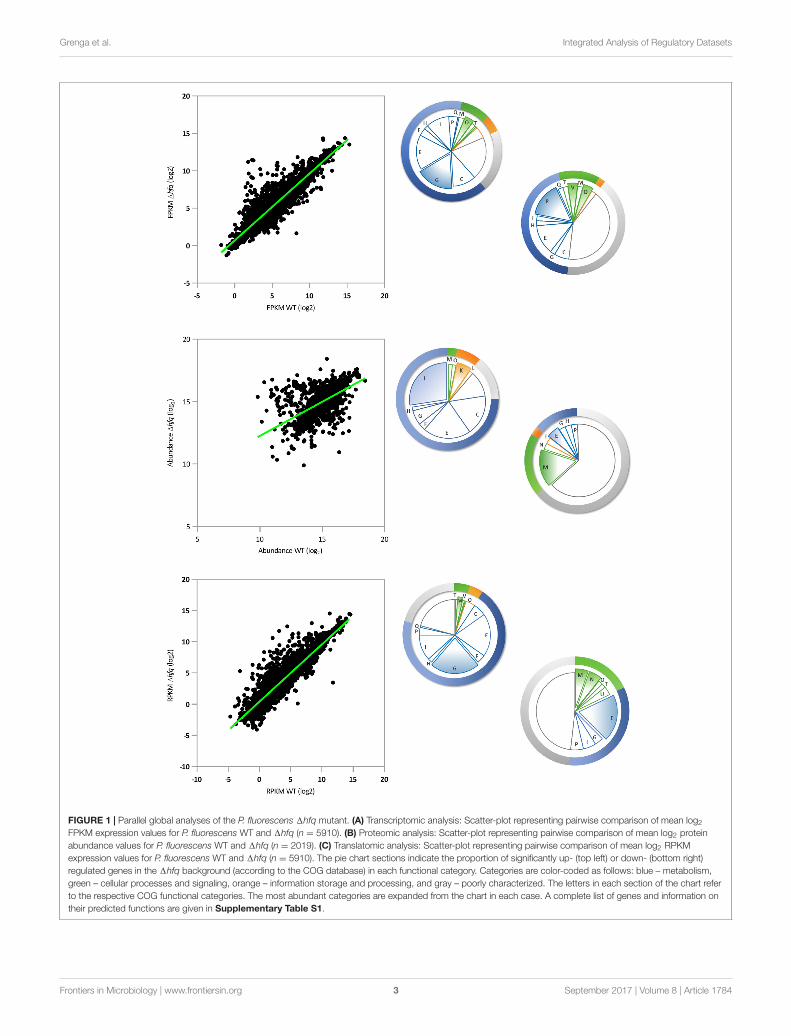
In our RNA-Seq analysis, 212 mRNAs (out of 5910;p-value ≤ 0.01) were identified that showed statisticallysignificant changes (log2FC = 2) between SBW25 WT and1hfq. A scatter plot of these loci comparing FPKM (FragmentsPer Kilobase Million) expression values for WT and 1hfqsuggests that Hfq exerts a predominantly negative regulatoryeffect on transcript levels. Under the conditions tested, 46 mRNAwere down regulated and 166 were up regulated comparedto wild type, equivalent to 3.6% of all P. fluorescens genes(Figure 1A). Classification of Hfq-controlled mRNA accordingto COG database searches revealed that the deletion of hfqdisproportionately affects the steady state transcript levels ofgenes involved in bacterial metabolism, with 128 mRNAsmisregulated in the hfq mutant (60.3% of regulated mRNAs) asopposed to 10 involved in information storage and processing,22 in cell processes and signaling, and 52 poorly characterizedloci. Further subdivision of these categories revealed that themost abundant functional classes up regulated in the 1hfqbackground (i.e., negatively affected by Hfq) are involvedin amino acid and carbohydrate transport and metabolism(Figure 1A). Conversely, the transcripts downregulated in the1hfq mutant were most frequently associated with inorganicion transport and metabolism (Figure 1A). These findings weresupported by GO enrichment analysis of the RNA-Seq data(Supplementary Table S4).
We then purified the soluble proteomes of both strains underthe same experimental conditions, and quantitatively analyzedthem using isobaric labeling (iTRAQ). Following the iTRAQanalysis, we focussed our attention on the 1874 proteins identifiedin both WT and 1hfq lysates (with at least 3 abundance
Frontiers in Microbiology | www.frontiersin.org 2 September 2017 | Volume 8 | Article 1784
fmicb-08-01784 September 16, 2017 Time: 18:1 # 3
Grenga et al. Integrated Analysis of Regulatory Datasets
FIGURE 1 | Parallel global analyses of the P. fluorescens 1hfq mutant. (A) Transcriptomic analysis: Scatter-plot representing pairwise comparison of mean log2
FPKM expression values for P. fluorescens WT and 1hfq (n = 5910). (B) Proteomic analysis: Scatter-plot representing pairwise comparison of mean log2 proteinabundance values for P. fluorescens WT and 1hfq (n = 2019). (C) Translatomic analysis: Scatter-plot representing pairwise comparison of mean log2 RPKMexpression values for P. fluorescens WT and 1hfq (n = 5910). The pie chart sections indicate the proportion of significantly up- (top left) or down- (bottom right)regulated genes in the 1hfq background (according to the COG database) in each functional category. Categories are color-coded as follows: blue – metabolism,green – cellular processes and signaling, orange – information storage and processing, and gray – poorly characterized. The letters in each section of the chart referto the respective COG functional categories. The most abundant categories are expanded from the chart in each case. A complete list of genes and information ontheir predicted functions are given in Supplementary Table S1.
Frontiers in Microbiology | www.frontiersin.org 3 September 2017 | Volume 8 | Article 1784
fmicb-08-01784 September 16, 2017 Time: 18:1 # 4
Grenga et al. Integrated Analysis of Regulatory Datasets
counts, p-value ≤ 0.01, and FDR 1%) and representing 66%of the total predicted non-membrane-associated proteome.(This sample represents a substantial fraction of the totalcellular proteome, albeit one missing most membrane-associatedproteins.) A scatter plot comparing the proteomic profiles ofWT and 1hfq (Figure 1B) revealed that 99 proteins (5.3%of the total identified proteome) were differentially presentin the hfq null mutant compared to the WT (64 proteinswith log2FC ≥ 2 and 35 with log2FC ≤ −2). Strikingly,the distributions of predicted biological functions were heavilyskewed for both the up- and down-regulated samples. GOenrichment analysis (Supplementary Table S4) showed thatthe most enriched group of 1hfq up-regulated proteins wereinvolved in bacterial metabolism, predominantly of amino acidsand lipids (Figure 1B and Supplementary Table S4). Whilesome amino acid metabolic genes were down-regulated in 1hfq,poorly characterized proteins (mainly putative lipoproteins)represented the predominant down-regulated group (Figure 1Band Supplementary Table S4).
To explore the translational dynamics of Hfq in P. fluorescens,we next conducted a ribosome profiling experiment comparingthe SBW25 WT and 1hfq mutant strains. Our analysisrevealed that Hfq controls translation of 5.7% (311 out of5910; p-value ≤ 0.01 logCPM ≥ 1) of total cellular mRNAs(Figure 1C). Of these, 255 messengers (4.7% of all genes, 82%of the mistranslated genes) were significantly more translatedin 1hfq than in the WT while 56 (1% of all genes) weredownregulated, consistent with a predominant function forHfq as a translational repressor in SBW25. This findingis in agreement with both the transcript abundance data(Figure 1A), and with its published mechanism as an RNAchaperone that interacts with small regulatory RNAs, whichmainly act to downregulate gene expression (Fröhlich andVogel, 2009). The largest class of differentially translated geneswere those involved in bacterial metabolism, with 197 loci(63.3% of the total misregulated mRNAs) as opposed to 11in information storage and processing, 23 in cell processesand signaling and 80 genes with poorly characterized function(Figure 1C). The GO enrichment analyses of these genesrevealed that the absence of Hfq mainly results in an increasedtranslation of genes involved in membrane transport andoxidation-reduction processes (Figure 1C and SupplementaryTable S4). Regulation of the dipeptide (dpp) transport operonis of particular interest, because of its involvement in thetransport not only of dipeptide containing compounds, butalso aminolaevulinic acid, haem and single amino acids (Kielyet al., 2008). Conversely, translation of genes belonging tothe functional categories of extracellular transport and proteintransporter activity were downregulated in 1hfq (Figure 1C andSupplementary Table S4).
Intriguingly, a set of 11 genes showed strong differences intheir expression between the two replicates in both the RNA-Seq and Ribo-Seq experiments (Supplementary Table S1) andwere excluded from subsequent analyses. This is unlikely to becoincidental or related to the quality of the datasets, as the overallreproducibility between biological replicates was very high(R ≥ 0.9, Supplementary Figures S3, S4) for both experiments,
and apart from gene PFLU2997, the differentially expressed genesclustered in three operons. This stochastic variation betweensamples is currently unexplained, but may be linked to specificRNA structural features that dictate RNA levels and partiallycontrol relative levels of gene expression, or possibly to protein-mediated feedback mechanisms of transcriptional regulation(Singh, 2011). In both cases the variability is not suppressed at thetranslational level. It is also possible that the expression of thesegenes is critically affected by the random variation exploited bygenetically identical cell populations (Norman et al., 2015; Soltaniet al., 2016).
To interrogate our Ribo-Seq dataset for evidence of morewidespread Hfq influences, we calculated the ribosomaloccupancy rate for every SBW25 mRNA, and plotted WTand 1hfq values against each other (Supplementary FigureS5). The slope of the resulting scatter-plot (0.726 ± 0.009)indicated that the ribosomal-mRNA occupancy rate of 1hfqwas less than 73% of WT. This value only modestly increased(to 0.761 ± 0.009, Supplementary Figure S5) upon the removalof all Hfq-regulated genes from the analysis, and could notbe explained by a reduction in ribosomal abundance in themutant, as qRT-PCR of 16S rRNA abundance showed nosignificant difference between WT and 1hfq (1.15 ± 0.20 ofWT). In addition, we did not detect any substantial changein abundance for the ribosomal proteins and key translationfactors detected in our proteomic dataset. This suggests a rolefor Hfq as a non-specific chaperone of the ribosome-mRNAinteraction. The biological relevance of this remains unclear,as the change in ribosomal-mRNA occupancy in the 1hfqstrain has no effect on translation for the vast majority ofmRNAs.
Although Hfq has been shown to bind directly to A-richsequences in mRNAs, the predominant mode of action of Hfqin vivo is the regulation of targets in conjunction with non-coding RNAs (ncRNA) (Vogel and Luisi, 2011). To test if theabsence of Hfq affects ncRNA abundance, we identified thencRNA sequences in SBW25 using the database Rfam, thencompared their levels in the 1hfq and WT transcriptomes. Outof 87 ncRNAs identified (Supplementary Table S2), only 4 werepresent at altered levels in the mutant, suggesting that Hfq haslittle overall effect on ncRNA expression or abundance. For the4 Hfq-affected ncRNAs, the biological functions of P15 and P6,the two ncRNAs overexpressed upon Hfq deletion are currentlyunknown. The two 1hfq down-regulated ncRNAs belong to thecrcZ subfamily of the Crc ncRNA family. CrcZ members arecommon throughout the Pseudomonas genus, and act as globalregulators of carbon catabolite repression (CCR) by sequesteringthe RNA-binding protein Crc (Sonnleitner et al., 2009; Morenoet al., 2012; Filiatrault et al., 2013).
Validation of the Global DatasetsTo validate our global regulatory data, we next conducted aseries of conventional molecular biology experiments to measuremRNA and protein abundance for selected, Hfq-regulated loci.We chose a set of targets that were up- and down-regulated,or unaffected in our RNA-Seq, Ribo-Seq and iTRAQ datasets,and examined their abundance in samples grown under identical
Frontiers in Microbiology | www.frontiersin.org 4 September 2017 | Volume 8 | Article 1784
fmicb-08-01784 September 16, 2017 Time: 18:1 # 5
Grenga et al. Integrated Analysis of Regulatory Datasets
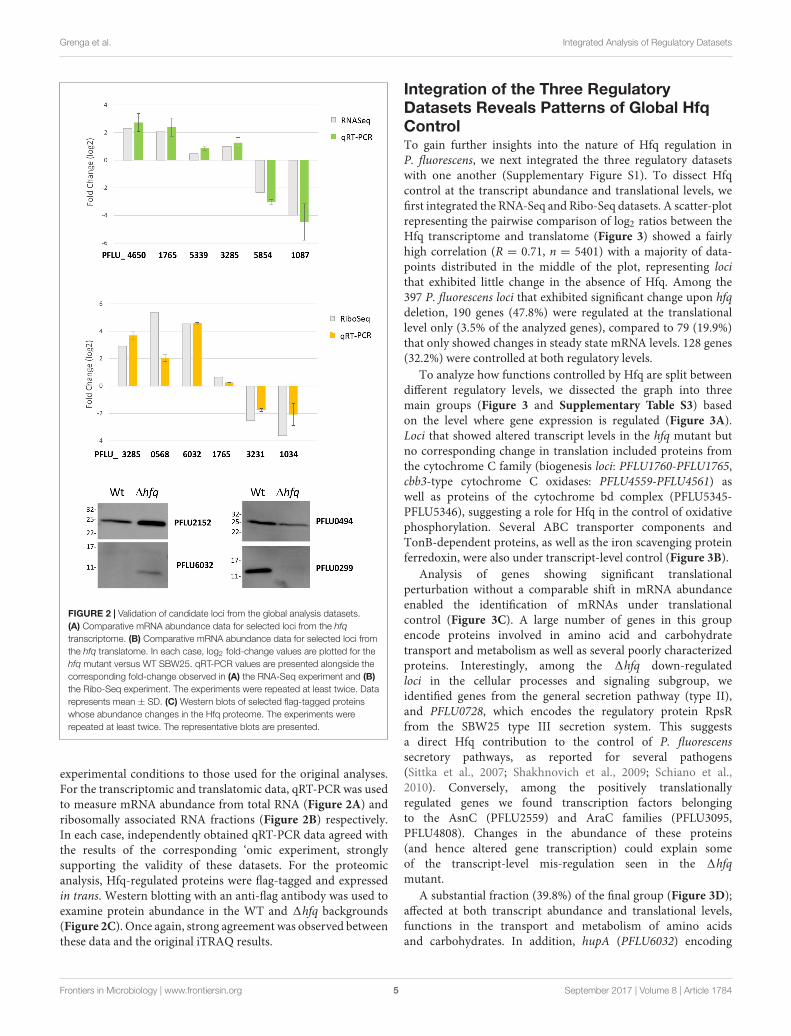
FIGURE 2 | Validation of candidate loci from the global analysis datasets.(A) Comparative mRNA abundance data for selected loci from the hfqtranscriptome. (B) Comparative mRNA abundance data for selected loci fromthe hfq translatome. In each case, log2 fold-change values are plotted for thehfq mutant versus WT SBW25. qRT-PCR values are presented alongside thecorresponding fold-change observed in (A) the RNA-Seq experiment and (B)the Ribo-Seq experiment. The experiments were repeated at least twice. Datarepresents mean ± SD. (C) Western blots of selected flag-tagged proteinswhose abundance changes in the Hfq proteome. The experiments wererepeated at least twice. The representative blots are presented.
experimental conditions to those used for the original analyses.For the transcriptomic and translatomic data, qRT-PCR was usedto measure mRNA abundance from total RNA (Figure 2A) andribosomally associated RNA fractions (Figure 2B) respectively.In each case, independently obtained qRT-PCR data agreed withthe results of the corresponding ‘omic experiment, stronglysupporting the validity of these datasets. For the proteomicanalysis, Hfq-regulated proteins were flag-tagged and expressedin trans. Western blotting with an anti-flag antibody was used toexamine protein abundance in the WT and 1hfq backgrounds(Figure 2C). Once again, strong agreement was observed betweenthese data and the original iTRAQ results.
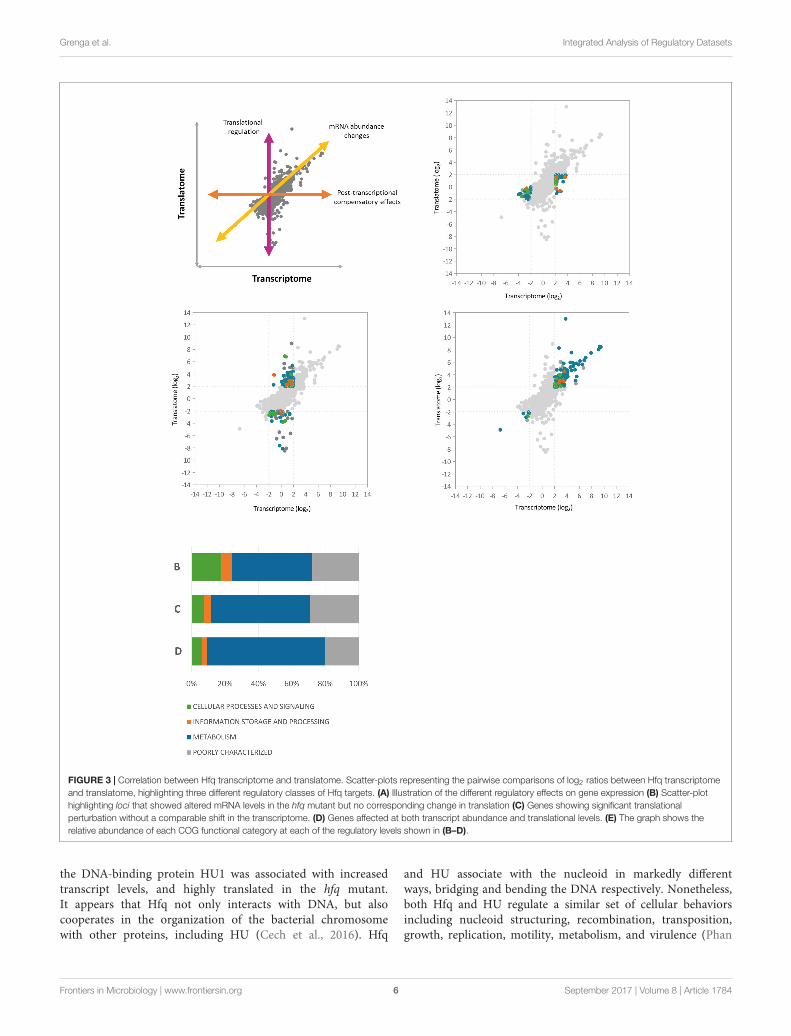
Integration of the Three RegulatoryDatasets Reveals Patterns of Global HfqControlTo gain further insights into the nature of Hfq regulation inP. fluorescens, we next integrated the three regulatory datasetswith one another (Supplementary Figure S1). To dissect Hfqcontrol at the transcript abundance and translational levels, wefirst integrated the RNA-Seq and Ribo-Seq datasets. A scatter-plotrepresenting the pairwise comparison of log2 ratios between theHfq transcriptome and translatome (Figure 3) showed a fairlyhigh correlation (R = 0.71, n = 5401) with a majority of data-points distributed in the middle of the plot, representing locithat exhibited little change in the absence of Hfq. Among the397 P. fluorescens loci that exhibited significant change upon hfqdeletion, 190 genes (47.8%) were regulated at the translationallevel only (3.5% of the analyzed genes), compared to 79 (19.9%)that only showed changes in steady state mRNA levels. 128 genes(32.2%) were controlled at both regulatory levels.
To analyze how functions controlled by Hfq are split betweendifferent regulatory levels, we dissected the graph into threemain groups (Figure 3 and Supplementary Table S3) basedon the level where gene expression is regulated (Figure 3A).Loci that showed altered transcript levels in the hfq mutant butno corresponding change in translation included proteins fromthe cytochrome C family (biogenesis loci: PFLU1760-PFLU1765,cbb3-type cytochrome C oxidases: PFLU4559-PFLU4561) aswell as proteins of the cytochrome bd complex (PFLU5345-PFLU5346), suggesting a role for Hfq in the control of oxidativephosphorylation. Several ABC transporter components andTonB-dependent proteins, as well as the iron scavenging proteinferredoxin, were also under transcript-level control (Figure 3B).
Analysis of genes showing significant translationalperturbation without a comparable shift in mRNA abundanceenabled the identification of mRNAs under translationalcontrol (Figure 3C). A large number of genes in this groupencode proteins involved in amino acid and carbohydratetransport and metabolism as well as several poorly characterizedproteins. Interestingly, among the 1hfq down-regulatedloci in the cellular processes and signaling subgroup, weidentified genes from the general secretion pathway (type II),and PFLU0728, which encodes the regulatory protein RpsRfrom the SBW25 type III secretion system. This suggestsa direct Hfq contribution to the control of P. fluorescenssecretory pathways, as reported for several pathogens(Sittka et al., 2007; Shakhnovich et al., 2009; Schiano et al.,2010). Conversely, among the positively translationallyregulated genes we found transcription factors belongingto the AsnC (PFLU2559) and AraC families (PFLU3095,PFLU4808). Changes in the abundance of these proteins(and hence altered gene transcription) could explain someof the transcript-level mis-regulation seen in the 1hfqmutant.
A substantial fraction (39.8%) of the final group (Figure 3D);affected at both transcript abundance and translational levels,functions in the transport and metabolism of amino acidsand carbohydrates. In addition, hupA (PFLU6032) encoding
Frontiers in Microbiology | www.frontiersin.org 5 September 2017 | Volume 8 | Article 1784
fmicb-08-01784 September 16, 2017 Time: 18:1 # 6
Grenga et al. Integrated Analysis of Regulatory Datasets
FIGURE 3 | Correlation between Hfq transcriptome and translatome. Scatter-plots representing the pairwise comparisons of log2 ratios between Hfq transcriptomeand translatome, highlighting three different regulatory classes of Hfq targets. (A) Illustration of the different regulatory effects on gene expression (B) Scatter-plothighlighting loci that showed altered mRNA levels in the hfq mutant but no corresponding change in translation (C) Genes showing significant translationalperturbation without a comparable shift in the transcriptome. (D) Genes affected at both transcript abundance and translational levels. (E) The graph shows therelative abundance of each COG functional category at each of the regulatory levels shown in (B–D).
the DNA-binding protein HU1 was associated with increasedtranscript levels, and highly translated in the hfq mutant.It appears that Hfq not only interacts with DNA, but alsocooperates in the organization of the bacterial chromosomewith other proteins, including HU (Cech et al., 2016). Hfq
and HU associate with the nucleoid in markedly differentways, bridging and bending the DNA respectively. Nonetheless,both Hfq and HU regulate a similar set of cellular behaviorsincluding nucleoid structuring, recombination, transposition,growth, replication, motility, metabolism, and virulence (Phan
Frontiers in Microbiology | www.frontiersin.org 6 September 2017 | Volume 8 | Article 1784
fmicb-08-01784 September 16, 2017 Time: 18:1 # 7
Grenga et al. Integrated Analysis of Regulatory Datasets
et al., 2015). The increased abundance of HU1 may thereforerepresent a compensatory response to the absence of Hfq.
We next integrated the proteomic data into the pairwisecomparison between the Hfq transcriptome and translatome.Three-dimensional representations of this data proveduninformative, so instead loci were colored according tothe effect of hfq deletion on protein abundance (Figure 4A). Wesaw a strong agreement in the general direction of regulationbetween the proteomic and genetic datasets. Interestingly,most of the proteins detected in our experiment lay close tothe diagonal regression line corresponding to transcript-levelregulation (Figure 3D), with the vast majority lying within atwo-fold ratio of differential expression on either side of theregression line.
To examine the impact of post-translational regulatorymechanisms on the Hfq proteome, we next integrated thetranslatomic and proteomic datasets (Figures 4B,C). Once again,a regression line was calculated and added to the analysis. Whilethe majority of loci lay within a two-fold differential ratio ofthis line (i.e., translation and protein abundance are directlycorrelated), two substantial groups of outliers were identified.The first of these (green in Figure 4C and Supplementary TableS4) showed little translational regulation but substantially alteredprotein abundance, while for the second (blue in Figure 4C andSupplementary Table S4) translation significantly changes onhfq deletion but is not accompanied by a corresponding shift inprotein abundance. In both cases, post-translational control (i.e.,altered protein stability, protease activity etc.) is apparently takingplace, either as a specific means of post-translational regulationor to compensate for higher-level perturbations, as we saw noevidence for increased ribosome stalling on these transcripts(Supplementary Figure S6).
DISCUSSION
Analyzing transcript-level regulation in isolation fails to explainmuch of the observed flexibility of bacterial adaptation (Arraianoet al., 2010). While there is undoubtedly a connection betweenprotein and mRNA levels, adaptive mechanisms at the post-transcriptional and post-translational levels are also highlyimportant, and must be accounted for if we are to produce anaccurate assessment of bacterial regulation. As a core componentof the global post-transcriptional networks of many bacterialspecies, Hfq represents a model protein to highlight the powerof a multi-omics approach to gain a more accurate pictureof complex regulatory pathways. By facilitating the pairing ofsmall RNAs with their target mRNAs, Hfq affects the translationand turnover rates of specific transcripts and contributes tocomplex post-transcriptional networks (Vogel and Luisi, 2011).In Pseudomonas spp., Hfq plays a critical role during nicheadaptation, with its deletion affecting phenotypes importantfor rhizosphere colonization of the soil-dwelling P. fluorescensSBW25 as well as host interactions by the related pathogensP. aeruginosa and P. syringae (Little et al., 2016).
The data we present here describe changes that arise as aconsequence of hfq deletion in P. fluorescens at three different
regulatory levels; mRNA abundance, protein abundance, andanalysis of actively translated mRNA. Transcriptome profilingrevealed that Hfq influences 212 genes, affecting in particularthe transcript levels of loci involved in bacterial metabolism.This finding supports a major role for Hfq in the control ofP. fluorescens metabolic versatility, in agreement with studies inother bacteria (Sonnleitner et al., 2006; Sittka et al., 2009; Torres-Quesada et al., 2010). To identify and dissect Hfq-mediatedregulation at the transcript abundance and translational levels,we next performed ribosome profiling experiments. Ribo-Seqprovides measurements of protein synthesis activity, reflectingboth the translational status of an mRNA, and its underlyingabundance (Ingolia, 2016). Our experiment revealed that Hfqnegatively controls translation of 311 mRNAs. These Hfq targetsmainly encode transporters and enzymes involved in aminoacid and carbohydrate metabolism, as well as secretory pathwaycomponents (Type II and III), siderophore utilization andchemotaxis loci, and the DNA binding protein HU1. Finally,we complemented our analysis of Hfq mRNA regulation byexamining the soluble 1hfq proteome. Intriguingly, while thisdataset confirmed the substantial Hfq regulation of amino acidand lipid metabolism seen in our RNA-based analyses, wealso saw evidence of a second, Hfq up-regulated group ofpoorly characterized putative lipoproteins. It is currently unclearwhether Hfq directly controls these proteins, or if they changeabundance as an indirect response to other phenotypic changesin 1hfq, perhaps as an adaptation to a sessile, aggregativemorphology. The Ribo-Seq dataset also provided evidence forsubstantial non-regulatory chaperone activity for P. fluorescensHfq, with a significantly lower level of ribosomal occupancy formRNAs in the 1hfq mutant than in WT, even once regulatorytargets are excluded.
To gain further insights into the nature of Hfq regulationin P. fluorescens and to dissect Hfq translational regulationfrom transcriptional/post-transcriptional effects on mRNAabundance, we integrated the RNA-Seq and ribosome profilingdatasets with one another. A direct correlation betweentranscript levels and translation emerged for 51% of allmRNA (R2 0.51). For the Hfq-regulated loci in this group,increased/decreased mRNA abundance was matched by acorresponding increase/decrease in translational activity, withmRNA translated at a constant rate and regulation occurring atthe level of transcript abundance. A second set of genes showedno change in mRNA levels but significantly altered translation.Alongside other loci (Supplementary Table S3), translationalchanges were seen for several amino acid uptake systems (i.e., dppoperon, gltJ-I and livJ1). This is supported by previous research(Pulvermacher et al., 2008; Sharma et al., 2011) that links therepression of these pathways to the Hfq-associated sRNA GcvB.Likewise, oligopeptide and dipeptide transport systems are alsotargets of ribo-regulatory networks in several α-proteobacteria(Torres-Quesada et al., 2010).
The methodology we present here does have certainlimitations, primarily the inability to distinguish between directcontrol of specific genes by a target protein (in this case Hfq) fromindirectly affected loci that are controlled on the same regulatorylevel. Nonetheless, integrating data from different global datasets
Frontiers in Microbiology | www.frontiersin.org 7 September 2017 | Volume 8 | Article 1784

fmicb-08-01784 September 16, 2017 Time: 18:1 # 8
Grenga et al. Integrated Analysis of Regulatory Datasets
FIGURE 4 | Integration of the regulatory datasets. (A) Color-coded integration of proteomic data into the pairwise comparison between the Hfq transcriptome andtranslatome (n = 5910). Red and yellow dots indicate loci that show up- and down-regulated protein abundance, respectively, in the 1hfq mutant. Loci exhibiting nosignificant change in protein abundance are indicated in gray (Supplementary Table S4). (B) Illustration of the effects of post-translational control on proteinabundance. (C) Scatter-plot showing the pairwise comparisons of log2 ratios between the 1hfq translatome and proteome (n = 1867). Post-translationally regulatedloci are marked in green, while loci displaying compensatory post-translational effects are marked in blue (Supplementary Table S4). In both cases, dashed linesindicate two-fold ratios of differential expression from the regression line (in black).
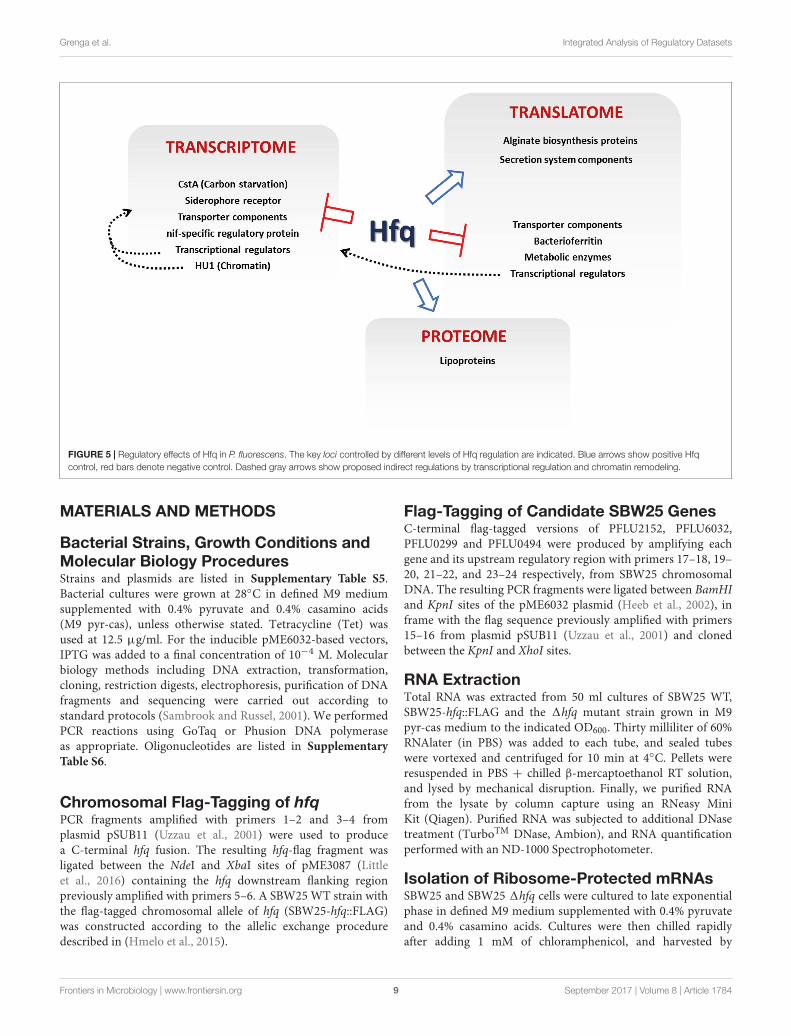
as described here allows us to dissect out individual elements ofcomplex regulatory networks (e.g., altered translational activityfrom transcriptional/post-transcriptional effects), and in this casereveals the influence of Hfq on a variety of cellular functions(Figure 5). Our integrated analysis also enables us to identifyregulatory mechanisms that could otherwise be missed, ormisinterpreted. For example, a third set of genes identified inthe integrated analysis were those where altered transcript levelswere not accompanied by a corresponding increase/decrease intranslational activity. Instead, altered mRNA levels for these lociappear to be compensated for at the translational level, resultingin little overall translational perturbation compared to WT.
Strikingly, integration of the three datasets revealed thatthe variance in protein levels observed for the 1hfq mutantclosely mapped to changes in mRNA abundance (rather thantranslational activity). This suggests that many of the mostpronounced 1hfq translational targets, identified here by Ribo-Seq, are likely to have remained undetected in earlier studies.These genes code for enzymes involved in primary metabolism,transporters (i.e., porins and ABC transporter components),katB (PFLU 5339), and iron-uptake loci or targets previously
not associated with Hfq-mediated regulation like PYRase(PFLU4174; a regulator of protein and peptide catabolism; Awadéet al., 1994). The reason for this discrepancy is likely to bemethodological – quantitative proteomics is limited primarily toabundant proteins, and cannot currently attain the same level ofcoverage as global transcriptome studies. The integrative analysisalso highlighted the presence of substantial post-translationaleffects upon hfq deletion, and allowed us to assign these effects totwo broad regulatory groups. In the first, compensatory effects onprotein abundance temper increased (or occasionally decreased)translational activity in the 1hfq mutant. For the second group,altered mRNA translation cannot explain the substantial impactson protein abundance we see upon hfq deletion. This suggests anexplicit, albeit possibly indirect, Hfq effect on protein stability orproduction.
By integrating multiple regulatory datasets, we have been ableto dissect and examine individual elements of this complex webof intracellular signaling, and to obtain several new insights intoHfq regulation in P. fluorescens. This integrated approach to dataanalysis has substantial promise for future research into bacterialadaptation to external challenges.
Frontiers in Microbiology | www.frontiersin.org 8 September 2017 | Volume 8 | Article 1784
fmicb-08-01784 September 16, 2017 Time: 18:1 # 9
Grenga et al. Integrated Analysis of Regulatory Datasets
FIGURE 5 | Regulatory effects of Hfq in P. fluorescens. The key loci controlled by different levels of Hfq regulation are indicated. Blue arrows show positive Hfqcontrol, red bars denote negative control. Dashed gray arrows show proposed indirect regulations by transcriptional regulation and chromatin remodeling.
MATERIALS AND METHODS
Bacterial Strains, Growth Conditions andMolecular Biology ProceduresStrains and plasmids are listed in Supplementary Table S5.Bacterial cultures were grown at 28◦C in defined M9 mediumsupplemented with 0.4% pyruvate and 0.4% casamino acids(M9 pyr-cas), unless otherwise stated. Tetracycline (Tet) wasused at 12.5 µg/ml. For the inducible pME6032-based vectors,IPTG was added to a final concentration of 10−4 M. Molecularbiology methods including DNA extraction, transformation,cloning, restriction digests, electrophoresis, purification of DNAfragments and sequencing were carried out according tostandard protocols (Sambrook and Russel, 2001). We performedPCR reactions using GoTaq or Phusion DNA polymeraseas appropriate. Oligonucleotides are listed in SupplementaryTable S6.
Chromosomal Flag-Tagging of hfqPCR fragments amplified with primers 1–2 and 3–4 fromplasmid pSUB11 (Uzzau et al., 2001) were used to producea C-terminal hfq fusion. The resulting hfq-flag fragment wasligated between the NdeI and XbaI sites of pME3087 (Littleet al., 2016) containing the hfq downstream flanking regionpreviously amplified with primers 5–6. A SBW25 WT strain withthe flag-tagged chromosomal allele of hfq (SBW25-hfq::FLAG)was constructed according to the allelic exchange proceduredescribed in (Hmelo et al., 2015).
Flag-Tagging of Candidate SBW25 GenesC-terminal flag-tagged versions of PFLU2152, PFLU6032,PFLU0299 and PFLU0494 were produced by amplifying eachgene and its upstream regulatory region with primers 17–18, 19–20, 21–22, and 23–24 respectively, from SBW25 chromosomalDNA. The resulting PCR fragments were ligated between BamHIand KpnI sites of the pME6032 plasmid (Heeb et al., 2002), inframe with the flag sequence previously amplified with primers15–16 from plasmid pSUB11 (Uzzau et al., 2001) and clonedbetween the KpnI and XhoI sites.
RNA ExtractionTotal RNA was extracted from 50 ml cultures of SBW25 WT,SBW25-hfq::FLAG and the 1hfq mutant strain grown in M9pyr-cas medium to the indicated OD600. Thirty milliliter of 60%RNAlater (in PBS) was added to each tube, and sealed tubeswere vortexed and centrifuged for 10 min at 4◦C. Pellets wereresuspended in PBS + chilled β-mercaptoethanol RT solution,and lysed by mechanical disruption. Finally, we purified RNAfrom the lysate by column capture using an RNeasy MiniKit (Qiagen). Purified RNA was subjected to additional DNasetreatment (TurboTM DNase, Ambion), and RNA quantificationperformed with an ND-1000 Spectrophotometer.
Isolation of Ribosome-Protected mRNAsSBW25 and SBW25 1hfq cells were cultured to late exponentialphase in defined M9 medium supplemented with 0.4% pyruvateand 0.4% casamino acids. Cultures were then chilled rapidlyafter adding 1 mM of chloramphenicol, and harvested by
Frontiers in Microbiology | www.frontiersin.org 9 September 2017 | Volume 8 | Article 1784
fmicb-08-01784 September 16, 2017 Time: 18:1 # 10
Grenga et al. Integrated Analysis of Regulatory Datasets
centrifugation (20 min, 4000 g, 4◦C). After resuspension of thepellets in 2 ml of lysis buffer [20 mM Hepes pH 7.8, 6 mMMgCl2, 100 mM NaCl, 1 mM PMSF, 16% (w/v) sucrose], cellswere disrupted in a French press at 13,800 psi and the supernatantwas recovered by centrifugation at 30,000 g for 30 min. Thecrude lysate was gently layered over a 35% sucrose cushion andcentrifuged (2 h, 50000 RCF, 4◦C). All non-ribosomal debris wereremoved by layering the re-suspended pellet over a second 35%sucrose cushion. RNA isolation with TRI Reagent (Sigma, T9424)was followed by DNase I treatment.
Quantitative Real-Time PCR (qRT-PCR)cDNA synthesis was performed as previously described (Littleet al., 2016). We performed qRT- PCR using a 20 µl reactionmix containing 1 µl cDNA. At least three wells were runfor each sample. Relative quantification was used to comparethe abundance of candidate mRNAs in equivalent WT andSBW25-hfq::FLAG or SBW25 1hfq samples. In each case, theabundance of each gene transcript was normalized to theWT reference sample. For the 2−11Ct method (Livak andSchmittgen, 2001; Bustin et al., 2009), results were presented asn-fold increase relative to the reference sample. The 1Ct-valueswere examined using the Student’s t test to determine whetherdatasets for relative gene expression were significantly differentfrom those in a chosen calibrator. Primers were experimentallyvalidated for suitability to the 2−11Ct method, and are listedin Supplementary Table S6. We used melting curve analysisto confirm the production of a specific single product fromeach primer pair. Each experiment was repeated at least twiceindependently.
Immunoblot AnalysisProtein concentrations of lysate supernatants were estimatedvia an A280 measurement, and gels/blots were normalizedby loading equal amounts of total protein per well (thiswas subsequently validated by Coomassie Blue staining).In the case of the C-terminal flag tagged Hfq protein,samples were normalized following comparison of opticaldensity for the initial cell samples. Samples were separatedon 15% Tris-HCl gels, then blotted onto polyvinylidenedifluoride (PVDF) membranes (Millipore). Membrane wasincubated overnight in blocking solution (1X PBS pH 7.4,0.01% Tween20, 5% milk powder), then protein was detectedwith 1/5000 ANTI-FLAG antibody (Sigma) and 1/6,000 anti-rabbit secondary antibody (Sigma). Bound antibody wasvisualized using ECL chemiluminescent detection reagent (GEHealthcare).
RNA-SeqSBW25 WT and 1hfq cultures were grown at 28◦C in M9 pyr-casmedium to the late exponential phase. RNA was then extractedas reported in the ‘RNA extraction’ section, and treated with theRibo-Zero rRNA Removal Kit (Bacteria) (Illumina) to removeribosomal RNA. RNA libraries were prepared using the TruSeqStranded mRNA Library Prep Kit (Illumina), and deep sequencedby Illumina NextSeq500 Sequencing.
RNA-Seq Data AnalysisPaired end reads were aligned to the P. fluorescens SBW25reference genome (Genbank accession number NC_012660)using Bowtie2 version 2.2.9 (Langmead and Salzberg, 2012). Alllibraries had an overall alignment rate of over 98 percent. Theresulting SAM files were processed using Perl scripts to calculatecoverage at each nucleotide position of the genome and to arriveat two column text files containing counts of reads mapping toeach gene in the SBW25 genome. These files were used for thecalculation of FPKM values for each gene and also as input fordifferential gene expression analysis using Bioconductor packageedgeR, according to the procedure described in the edgeR userguide. Briefly, the data was read in using the readDGE functionand after the estimation of common and tagwise dispersions, thefunction exactTest was used to carry out pair-wise comparisons(Robinson and Smyth, 2008). Finally, the function topTags(Benjamini and Hochberg method) was used to output a table ofgenes with their log fold-changes and associated false discoveryrates. The limma function plotMDS was used to make the PCAplots.
Searching for ncRNAs in the SBW25GenomeThe Rfam database version 12.1 was downloaded from the EBIFTP site. The program cmscan from the Infernal package wasused to search the SBW25 genome for the covariance models inthe Rfam database. The output produced by cmscan was used tomake a bed file for viewing in IGV/IGB.
Ribosomal ProfilingSBW25 WT and 1hfq cultures were grown at 28◦C in M9 pyr-cas medium to the late exponential phase. Cells were harvestedby rapid filtration as described in Oh et al. (2011). Collectedcells were flash frozen in liquid nitrogen and cryogenicallypulverized by mixer milling (Retsch). Pulverized cells werethawed and clarified by centrifugation. Resulting lysates weredigested with MNase, quenched with EGTA and resolved bysucrose density gradient ultracentrifugation. Ribosome-protectedmRNA footprints were processed as previously described (Ohet al., 2011; Becker et al., 2013) and sequenced by IlluminaHiSeq2000.
Ribo-Seq Data AnalysisReads in fastq files received from the sequencing contractor wereadaptor trimmed using a Perl script which implemented theprocedure described in (Becker et al., 2013). Ribosomal RNAsequences were filtered out of the trimmed reads by aligning themagainst a Bowtie2 index containing only the ribosomal RNAs ofSBW25. Reads not aligning to the ribosomal RNAs were thenaligned to the genomic sequence of SBW25 to get SAM files.The SAM files were then used to calculate the center-weightedcoverage for at each nucleotide position of the genome. For this,a Perl script was used to select alignments that were between23 and 41 nucleotides in length and counted for nucleotidepositions after trimming 11 nucleotide positions from either endof the alignment. This was done separately for reads aligning to
Frontiers in Microbiology | www.frontiersin.org 10 September 2017 | Volume 8 | Article 1784
fmicb-08-01784 September 16, 2017 Time: 18:1 # 11
Grenga et al. Integrated Analysis of Regulatory Datasets
the forward and reverse strands of the genome and the center-weighted coverage was stored in separate files for the two strands.Another Perl script was used to calculate the RPKM values foreach gene based on the strand specific center-weighted coveragesalong the genome. The limma function plotMDS was used tomake the PCA plots.
Translation EfficiencyRead counts for each gene were normalized to gene lengths forboth the Ribo-Seq and RNA-Seq data and then scaled to thesame totals between the WT and Hfq. Translation efficiency wascalculated as Ribo-Seq read counts divided by the RNA-Seq readcounts. Finally, the fold change in translation efficiency of eachgene was calculated between the WT and Hfq.
Ribosome StallingCoverage at each nucleotide position for both RNA-Seq andRibo-Seq were normalized for their sequencing depths. ThenRibo-Seq coverage for each gene was normalized to the medianof the RNA-Seq coverage for the corresponding genes. Then, themaximum and average Ribo-Seq coverage, and the ratio betweenthe maximum and average were calculated. These ratios werecompared between the WT and 1hfq to see if any genes showedaltered stalling.
Quantitative Analysis Using IsobaricLabeling (iTRAQ)50 ml SBW25 WT and 1hfq cultures were grown in M9pyr-cas medium to late exponential phase at 28◦C. Cellularactivity was then frozen by addition of 30 ml of RNAlater[saturated (NH4)2SO4, 16.7 mM Na-Citrate, 13.3 mM EDTA,pH 5.2] containing protease inhibitors. Cells were pelleted bycentrifugation and washed three times with 10 mM HEPESpH 8.0 + protease inhibitors, before re-suspension to afinal volume of 200 µL. Seven hundred microliter pre-cooledRLT + β-mercaptoethanol buffer (RNeasy Mini Kit, QIAGEN)was added and samples lysed with two 30 s Ribolyser pulses atspeed 6.5. Supernatant was removed, and the soluble fractionseparated by ultracentrifugation (279,000 g, 30 min, 4◦C). Afterdetermination of protein concentration, the soluble proteinswere precipitated with chloroform-methanol. Two biologicalreplicates of wildtype and mutant samples were analyzed inone iTRAQ 4-plex experiment. Specifically, aliquots of 100 µgof protein were dissolved in 5% sodium deoxycholate (SDC),20 mM sodium phosphate buffer pH 8, reduced and alkylated,and trypsin digested with 1% SDC final concentration. AfterSDC removal and concentration, the samples were labeledwith iTRAQ tags according to the manufacturer’s instructions(AB Sciex, Framingham, MA, United States). Labeled sampleswere mixed, desalted on a C18 SepPak column (Waters Ltd,Manchester, United Kingdom) and fractionated by high-pHreversed phase chromatography on an XBridgeTM Peptide BEHC18 column, 4.6 × 250 mm (Waters) generating 14 fractions.The fractions were then analyzed by nanoLC-MS/MS on anOrbitrap FusionTM TribridTM Mass Spectrometer coupled to anUltiMate R© 3000 RSLCnano LC system (Thermo Fisher, Waltham,
MA, United States). Aliquots of the re-dissolved peptides wereloaded and trapped using a pre-column which was then switchedin-line to an analytical column (Acclaim PepMap C18, 2 µm,75 µm × 250 mm, Thermo) for separation. Peptides were elutedwith a main gradient of 6–36% acetonitrile in water/0.1% formicacid in 74 min at a flow rate of 0.3 µl min-1. The columnwas connected to a 10 µm SilicaTipTM nanospray emitter (NewObjective, Woburn, MA, United States) for infusion into the massspectrometer. The acquisition was performed using a multi-notchMS3 reporter ion method (McAlister et al., 2014). The followingacquisition parameters were used: MS1 (precursor): orbitrapresolution 60k, Scan Range (m/z) = 400-1600 (quadrupole),AGC Target = 2e5, DataType = Profile; MS2 with CID in IT:Top 10, threshold 2e4, AGC Target = 5e3, Collision Energy(%) = 30, dynamic exclusion 60 s, DataType = Centroid;MS3 Multi-notch Isolation (SPS): Number of Notches = 10,ActivationType = HCD, Collision Energy (%) = 55, MS2Isolation Window = 2.5, Orbitrap Resolution = 30K, AGCTarget= 7e4.
Protein Quantification and StatisticalAnalysisThe set of 14 raw files was processed for reporter ionquantification using Proteome Discoverer 2.1.1.21 (Thermo)with Mascot 2.4.1 (Matrixscience, London, United Kingdom)as the search engine. The database search was performedon the protein sequences of Pseudomonas fluorescens SBW25downloaded from Uniprot.org (6388 sequences) and theMaxQuant contaminants database (249 sequences1) with trypsinas protease, 2 missed cleavages, 6 ppm precursor and 0.6 Dafragment tolerance and a minimum peptide length of 6 aminoacids. Carbamidomethylation of cysteine was used as staticmodification, oxidation (M) and deamidation (N,Q), as variablemodifications. Strict FDR was set to 0.01 in Percolator. Reporterion intensities were calculated as intensities from the MS3spectra with 20 ppm tolerance using the most confident centroid.Reporter ion values were corrected for isotopic impurities usingthe manufacturer provided factors. Missing values were replacedwith the minimum value. The PSM table was exported fromProtein Discoverer and filtered for peptides unique to proteingroups with a co-isolation threshold of ≤ 30%, an average S/Nratio of≥ 3 and a q-value of≤ 0.01. The values were transformedto log2 and quantile normalized using the normalizeQuantilesfunction in the BioConductor package limma (Ritchie et al.,2015). Log2 ratios were calculated for reporter ion values 116and 114 (bioreplicate 1) and 117 and 115 values (bioreplicate2). The mean of the PSM reporter ion abundances ratio wascalculated for each protein (minimum 3 abundance counts).The resultant two sets of ratios calculated for all peptidesof a given protein were subjected to a paired Wilcox test.The same procedure was applied to all proteins to obtain thecorresponding P-values. P-values were adjusted for multipletesting by applying the Bonferroni method in the p.adjustfunction in R (Signal P-values in Supplementary Table S1).
1www.coxdocs.org
Frontiers in Microbiology | www.frontiersin.org 11 September 2017 | Volume 8 | Article 1784
fmicb-08-01784 September 16, 2017 Time: 18:1 # 12
Grenga et al. Integrated Analysis of Regulatory Datasets
After filtering proteins for signal quality, the variability betweenthe samples was taken into account to identify the significantlyregulated protein. A biological sample P-value was calculatedby making a dataframe in R, in which the rows correspondto proteins filtered on the basis of the signal P-value and twocolumns corresponding to ratio 116/114 and ratio 117/115. Thelimma function lmFit was used to fit a linear model to eachgene treating the two columns as biological replicates. Thelimma function ebayes was used to get P-values which werethen adjusted by the function p.adjust using the Benjamini andHochberg method (Biological sample P-values in SupplementaryTable S1). Finally, to apply a protein level identification filter tothe data, the FDR was calculated by the Protein FDR ValidatorNode in Proteome Discoverer and considered to select only thoseproteins with high confidence (1% FDR).
Integrative Data AnalysisRNA-Seq, Ribo-Seq and iTRAQ data sets were combined andviewed in as described in the manuscript, using bespoke Perl andR scripts and by using R interactively.
DATA AVAILABILITY
Sequencing data is available in the ArrayExpress database(www.ebi.ac.uk/arrayexpress) under accession numbersE-MTAB-5396 (RNA-Seq) and E-MTAB-5408 (Ribo-Seq). Themass spectrometry proteomics data have been deposited to theProteomeXchange Consortium via the PRIDE (Vizcaíno et al.,2016) partner repository with the dataset identifier PXD005621.
AUTHOR CONTRIBUTIONS
Experiments were conceived and designed by LG and JM. LGperformed the experiments and together with GC carried out
the computational data analysis. GS performed the iTRAQquantitative mass spectrometry. CG and GK contributedexpertise/materials/analysis tool and critically reviewed themanuscript. LG and JM wrote the manuscript. All authors: finalapproval; agreement for accountability.
FUNDING
This work was supported by the BBSRC Responsive Mode grantBB/M002586/1 to JM, and the BBSRC ISPG grant BB/J004553/1,to the John Innes Centre.
ACKNOWLEDGMENTS
The authors would like to thank Giuseppe Facchetti for valuableadvice on data analysis, Ray Dixon and the members of theMalone group for helpful comments on the manuscript.
SUPPLEMENTARY MATERIAL
The Supplementary Material for this article can be foundonline at: http://journal.frontiersin.org/article/10.3389/fmicb.2017.01784/full#supplementary-material
TABLE S1 | Parallel global analyses of the P. fluorescens hfq null mutant.
TABLE S2 | ncRNAs analysis.
TABLE S3 | Correlation between Hfq transcriptome and translatome.
TABLE S4 | Integration of the regulatory datasets.
TABLE S5 | Strains and plasmids.
TABLE S6 | Oligonucleotides.
REFERENCESArraiano, C. M., Andrade, J. M., Domingues, S., Guinote, I. B., Malecki, M., Matos,
R. G., et al. (2010). The critical role of RNA processing and degradation in thecontrol of gene expression. FEMS Microbiol. Rev. 34, 883–923. doi: 10.1111/j.1574-6976.2010.00242.x
Arraiano, C. M., and Maquat, L. E. (2003). Post-transcriptional control of geneexpression: effectors of mRNA decay. Mol. Microbiol. 49, 267–276. doi: 10.1046/j.1365-2958.2003.03545.x
Awadé, A. C., Cleuziat, P., Gonzalès, T., and Robert-Baudouy, J. (1994).Pyrrolidone carboxyl peptidase (Pcp): an enzyme that removes pyroglutamicacid (pGlu) from pGlu-peptides and pGlu-proteins. Proteins 20, 34–51.doi: 10.1002/prot.340200106
Becker, A. H., Oh, E., Becker, A. H., Weissman, J. S., Kramer, G., and Bukau, B.(2013). Selective ribosome profiling as a tool for studying the interactionof chaperones and targeting factors with nascent polypeptide chains andribosomes. Nat. Protoc. 8, 2212–2239. doi: 10.1038/nprot.2013.133
Bilusic, I., Popitsch, N., Rescheneder, P., Schroeder, R., and Lybecker, M. (2014).Revisiting the coding potential of the E. coli genome through Hfq co-immunoprecipitation. RNA Biol. 11, 641–654. doi: 10.4161/rna.29299
Boudry, P., Gracia, C., Monot, M., Caillet, J., Saujet, L., Hajnsdorf, E., et al. (2014).Pleiotropic role of the RNA chaperone protein Hfq in the human pathogenClostridium difficile. J. Bacteriol. 196, 3234–3248. doi: 10.1128/JB.01923-14
Bustin, S. A., Benes, V., Garson, J. A., Hellemans, J., Huggett, J., Kubista, M.,et al. (2009). The MIQE guidelines: minimum information for publication ofquantitative real-time PCR experiments. Clin. Chem. 55, 611–622. doi: 10.1373/clinchem.2008.112797
Cech, G. M., Szalewska-Pałasz, A., Kubiak, K., Malabirade, A., Grange, W.,Arluison, V., et al. (2016). The Escherichia Coli Hfq protein: an unattendedDNA-transactions regulator. Front. Mol. Biosci. 3:36. doi: 10.3389/fmolb.2016.00036
Chao, Y., and Vogel, J. (2010). The role of Hfq in bacterial pathogens. Curr. Opin.Microbiol. 13, 24–33. doi: 10.1016/j.mib.2010.01.001
Cui, M., Wang, T., Xu, J., Ke, Y., Du, X., Yuan, X., et al. (2013). Impact of Hfq onglobal gene expression and intracellular survival in Brucella melitensis. PLOSONE 8:e71933. doi: 10.1371/journal.pone.0071933
Deng, Z., Liu, Z., Bi, Y., Wang, X., Zhou, D., Yang, R., et al. (2014). Rapiddegradation of Hfq-free RyhB in Yersinia pestis by PNPase independent ofputative ribonucleolytic complexes. Biomed. Res. Int. 2014:798918. doi: 10.1155/2014/798918
Feng, L., Rutherford, S. T., Papenfort, K., Bagert, J. D., van Kessel, J. C., Tirrell,D. A., et al. (2015). A qrr noncoding RNA deploys four different regulatorymechanisms to optimize quorum-sensing dynamics. Cell 160, 228–240.doi: 10.1016/j.cell.2014.11.051
Filiatrault, M. J., Stodghill, P. V., Wilson, J., Butcher, B. G., Chen, H., Myers, C. R.,et al. (2013). CrcZ and CrcX regulate carbon source utilization in Pseudomonas
Frontiers in Microbiology | www.frontiersin.org 12 September 2017 | Volume 8 | Article 1784
fmicb-08-01784 September 16, 2017 Time: 18:1 # 13
Grenga et al. Integrated Analysis of Regulatory Datasets
syringae pathovar tomato strain DC3000. RNA Biol. 10, 245–255. doi: 10.4161/rna.23019
Fong, S. S., Joyce, A. R., and Palsson, B. O. (2005). Parallel adaptive evolutioncultures of Escherichia coli lead to convergent growth phenotypes withdifferent gene expression states. Genome Res. 15, 1365–1372. doi: 10.1101/gr.3832305
Fröhlich, K. S., and Vogel, J. (2009). Activation of gene expression by small RNA.Curr. Opin. Microbiol. 12, 674–682. doi: 10.1016/j.mib.2009.09.009
Hämmerle, H., Amman, F., Vecerek, B., Stülke, J., Hofacker, I., and Bläsi, U. (2014).Impact of Hfq on the Bacillus subtilis transcriptome. PLOS ONE 9:e98661.doi: 10.1371/journal.pone.0098661
Heeb, S., Blumer, C., and Haas, D. (2002). Regulatory RNA as mediatorin GacA/RsmA-dependent global control of exoproduct formation inPseudomonas fluorescens CHA0. J. Bacteriol. 184, 1046–1056. doi: 10.1128/jb.184.4.1046-1056.2002
Hmelo, L. R., Borlee, B. R., Almblad, H., Love, M. E., Randall, T. E., Tseng,B. S., et al. (2015). Precision-engineering the Pseudomonas aeruginosa genomewith two-step allelic exchange. Nat. Protoc. 10, 1820–1841. doi: 10.1038/nprot.2015.115
Holmqvist, E., Wright, P. R., Li, L., Bischler, T., Barquist, L., Reinhardt, R., et al.(2016). Global RNA recognition patterns of post-transcriptional regulatorsHfq and CsrA revealed by UV crosslinking in vivo. EMBO J. 35, 991–1011.doi: 10.15252/embj.201593360
Ingolia, N. T. (2016). Ribosome footprint profiling of translation throughout theGenome. Cell 165, 22–33. doi: 10.1016/j.cell.2016.02.066
Jeong, Y., Kim, J. N., Kim, M. W., Bucca, G., Cho, S., Yoon, Y. J., et al. (2016).The dynamic transcriptional and translational landscape of the model antibioticproducer Streptomyces coelicolor A3(2). Nat. Commun. 7:11605. doi: 10.1038/ncomms11605
Kiely, P. D., O’Callaghan, J., Abbas, A., and O’Gara, F. (2008). Genetic analysisof genes involved in dipeptide metabolism and cytotoxicity in Pseudomonasaeruginosa PAO1. Microbiology 154, 2209–2218. doi: 10.1099/mic.0.2007/015032-0
Langmead, B., and Salzberg, S. L. (2012). Fast gapped-read alignment with Bowtie2. Nat. Methods 9, 357–359. doi: 10.1038/nmeth.1923
Little, R. H., Grenga, L., Saalbach, G., Howat, A. M., Pfeilmeier, S., Trampari, E.,et al. (2016). Adaptive remodeling of the bacterial proteome by specificribosomal modification regulates Pseudomonas infection and nichecolonisation. PLOS Genet. 12:e1005837. doi: 10.1371/journal.pgen.1005837
Livak, K. J., and Schmittgen, T. D. (2001). Analysis of relative gene expression datausing real-time quantitative PCR and the 2(T)(-Delta Delta C) method. Methods25, 404–408. doi: 10.1006/meth.2001.1262
López-Maury, L., Marguerat, S., and Bähler, J. (2008). Tuning gene expression tochanging environments: from rapid responses to evolutionary adaptation. Nat.Rev. Genet. 9, 583–593. doi: 10.1038/nrg2398
McAlister, G., Nusinow, D., Jedrychowski, M., Wuhr, M., Huttlin, E. L., Erickson,B. K., et al. (2014). MultiNotch MS3 enables accurate, sensitive, and multiplexeddetection of differential expression across cancer cell line proteomes. Anal.Chem. 86, 7150–7158. doi: 10.1021/ac502040v
Moreno, R., Fonseca, P., and Rojo, F. (2012). Two small RNAs, CrcY and CrcZ,act in concert to sequester the Crc global regulator in Pseudomonas putida,modulating catabolite repression. Mol. Microbiol. 83, 24–40. doi: 10.1111/j.1365-2958.2011.07912.x
Norman, T. M., Lord, N. D., Paulsson, J., and Losick, R. (2015). Stochastic switchingof cell fate in microbes. Annu. Rev. Microbiol. 69, 381–403. doi: 10.1146/annurev-micro-091213-112852
Oh, E., Becker, A. H., Sandikci, A., Huber, D., Chaba, R., Gloge, F., et al.(2011). Selective ribosome profiling reveals the cotranslational chaperoneaction of trigger factor in vivo. Cell 147, 1295–1308. doi: 10.1016/j.cell.2011.10.044
Papenfort, K., Forstner, K. U., Cong, J. P., Sharma, C. M., and Bassler, B. L. (2015).Differential RNA-seq of Vibrio cholerae identifies the VqmR small RNA as aregulator of biofilm formation. Proc. Natl. Acad. Sci. U.S.A. 112, E766–E775.doi: 10.1073/pnas.1500203112
Phan, N. Q., Uebanso, T., Shimohata, T., Nakahashi, M., Mawatari, K., andTakahashi, A. (2015). DNA-binding protein HU coordinates pathogenicity inVibrio parahaemolyticus. J. Bacteriol. 197, 2958–2964. doi: 10.1128/JB.00306-15
Picard, F., Dressaire, C., Girbal, L., and Cocaign-Bousquet, M. (2009). Examinationof post-transcriptional regulations in prokaryotes by integrative biology. C RBiol. 332, 958–973. doi: 10.1016/j.crvi.2009.09.005
Pulvermacher, S. C., Stauffer, L., and Stauffer, G. V. (2008). The role of the smallregulatory RNA GcvB in GcvB/mRNA posttranscriptional regulation of oppAand dppA in Escherichia coli. FEMS Microbiol. Lett. 28, 42–50. doi: 10.1111/j.1574-6968.2008.01068.x
Rainey, P. B., and Bailey, M. J. (1996). Physical and genetic map of the Pseudomonasfluorescens SBW25 chromosome. Mol. Microbiol. 19, 521–533. doi: 10.1046/j.1365-2958.1996.391926.x
Ritchie, M. E., Phipson, B., Wu, D., Hu, Y., Law, C. W., Shi, W., et al. (2015). limmapowers differential expression analyses forn RNA-sequencing and microarraystudies. Nucleic Acids Res. 43, e47. doi: 10.1093/nar/gkv007
Robinson, M. D., and Smyth, G. K. (2008). Small-sample estimation of negativebinomial dispersion, with applications to SAGE data. Biostatistics 9, 321–332.doi: 10.1093/biostatistics/kxm030
Sambrook, J., and Russel, D. W. (2001). Molecular Cloning. A Laboratory Manual,3rd Edn. Cold Spring Harbor, NY: Cold Spring Harbor Laboratory Press.
Schiano, C. A., Bellows, L. E., and Lathem, W. W. (2010). The small RNAchaperone Hfq is required for the virulence of Yersinia pseudotuberculosis.Infect. Immun. 78, 2034–2044. doi: 10.1128/IAI.01046-09
Sedlyarova, N., Shamovsky, I., Bharati, B. K., Epshtein, V., Chen, J., Gottesman, S.,et al. (2016). sRNA-mediated control of transcription termination in E. coli. Cell167, 111–121. doi: 10.1016/j.cell.2016.09.004
Shakhnovich, E. A., Davis, B. M., and Waldor, M. K. (2009). Hfq negativelyregulates type III secretion in EHEC and several other pathogens. Mol.Microbiol. 74, 347–363. doi: 10.1111/j.1365-2958.2009.06856.x
Sharma, C. M., Papenfort, K., Pernitzsch, S. R., Mollenkopf, H. J., Hinton, J. C.,and Vogel, J. (2011). Pervasive post-transcriptional control of genes involved inamino acid metabolism by the Hfq-dependent GcvB small RNA. Mol. Microbiol.81, 1144–1165. doi: 10.1111/j.1365-2958.2011.07751.x
Silva, I. J., Saramago, M., Dressaire, C., Domingues, S., Viegas, S. C., and Arraiano,C. M. (2011). Importance and key events of prokaryotic RNA decay: theultimate fate of an RNA molecule. Wiley Interdiscip. Rev. RNA 2, 818–836.doi: 10.1002/wrna.94
Singh, A. (2011). Negative feedback through mRNA provides the best control ofgene-expression noise. IEEE Trans. Nanobioscience 10, 194–200. doi: 10.1109/TNB.2011.2168826
Sittka, A., Pfeiffer, V., Tedin, K., and Vogel, J. (2007). The RNA chaperone Hfqis essential for the virulence of Salmonella typhimurium. Mol. Microbiol. 63,193–217. doi: 10.1111/j.1365-2958.2006.05489.x
Sittka, A., Sharma, C. M., Rolle, K., and Vogel, J. (2009). Deep sequencing ofSalmonella RNA associated with heterologous Hfq proteins in vivo reveals smallRNAs as a major target class and identifies RNA processing phenotypes. RNABiol. 6, 266–275. doi: 10.4161/rna.6.3.8332
Smirnov, A., Förstner, K. U., Holmqvist, E., Otto, A., Günster, R., Becher, D.,et al. (2016). Grad-seq guides the discovery of ProQ as a major small RNA-binding protein. Proc. Natl. Acad. Sci. U.S.A. 113, 11591–11596. doi: 10.1073/pnas.1609981113
Soltani, M., Vargas-Garcia, C. A., Antunes, D., and Singh, A. (2016). Intercellularvariability in protein levels from stochastic expression and noisy cellcycle processes. PLOS Comput. Biol. 12:e1004972. doi: 10.1371/journal.pcbi.1004972
Sonnleitner, E., Abdou, L., and Haas, D. (2009). Small RNA as global regulator ofcarbon catabolite repression in Pseudomonas aeruginosa. Proc. Natl. Acad. Sci.U.S.A. 106, 21866–21871. doi: 10.1073/pnas.pnas.0910308106
Sonnleitner, E., Schuster, M., Sorger-Domenigg, T., Greenberg, E. P., and Blasi, U.(2006). Hfq-dependent alterations of the transcriptome profile and effects onquorum sensing in Pseudomonas aeruginosa. Mol. Microbiol. 59, 1542–1558.doi: 10.1111/j.1365-2958.2006.05032.x
Torres-Quesada, O., Oruezabal, R. I., Peregrina, A., Jofre, E., Lloret, J., Rivilla, R.,et al. (2010). The Sinorhizobium meliloti RNA chaperone Hfq influences centralcarbon metabolism and the symbiotic interaction with alfalfa. BMC Microbiol.10:71. doi: 10.1186/1471-2180-10-71
Uzzau, S., Figueroa-Bossi, N., Rubino, S., and Bossi, L. (2001). Epitope taggingof chromosomal genes in Salmonella. Proc. Natl. Acad. Sci. U.S.A. 98, 15264–15269. doi: 10.1073/pnas.261348198
Frontiers in Microbiology | www.frontiersin.org 13 September 2017 | Volume 8 | Article 1784
fmicb-08-01784 September 16, 2017 Time: 18:1 # 14
Grenga et al. Integrated Analysis of Regulatory Datasets
Valentin-Hansen, P., Eriksen, M., and Udesen, C. (2004). The bacterial Sm-likeprotein Hfq: a key player in RNA transactions. Mol. Microbiol. 51, 1525–1533.doi: 10.1111/j.1365-2958.2003.03935.x
Vizcaíno, J. A., Csordas, A., del-Toro, N., Dianes, J. A., Griss, J., Lavidas, I., et al.(2016). 2016 update of the PRIDE database and related tools. Nucleic Acids Res.44, D447–D456. doi: 10.1093/nar/gkv1145
Vogel, J., and Luisi, B. F. (2011). Hfq and its constellation of RNA. Nat. Rev.Microbiol. 9, 578–589. doi: 10.1038/nrmicro2615
Voisard, C., Bull, C. T., Keel, C., Laville, J., Maurhofer, M., Schnider, U., et al.(1994). “Biocontrol of root diseases by Pseudomonas fluorescens CHA0: currentconcepts and experimental approaches,” in Molecular Ecology of RhizosphereMicroorganisms, eds F. O’Gara, D. N. Dowling, and B. Boesten (Weinheim:VCH Publishers), 67–89.
Wilf, N. M., Reid, A. J., Ramsay, J. P., Williamson, N. R., Croucher, N. J., Gatto, L.,et al. (2013). RNA-seq reveals the RNA binding proteins, Hfq and RsmA, playvarious roles in virulence, antibiotic production and genomic flux in Serratia sp.ATCC 39006. BMC Genomics 14:822. doi: 10.1186/1471-2164-14-822
Woodcock, D. M., Crowther, P. J., Doherty, J., Jefferson, S., DeCruz, E.,Noyer-Weidner, M., et al. (1989). Quantitative evaluation of Escherichiacoli host strains for tolerance to cytosine methylation in plasmid andphage recombinants. Nucleic Acids Res. 17, 3469–3478. doi: 10.1093/nar/17.9.3469
Conflict of Interest Statement: The authors declare that the research wasconducted in the absence of any commercial or financial relationships that couldbe construed as a potential conflict of interest.
Copyright © 2017 Grenga, Chandra, Saalbach, Galmozzi, Kramer and Malone.This is an open-access article distributed under the terms of the Creative CommonsAttribution License (CC BY). The use, distribution or reproduction in other forumsis permitted, provided the original author(s) or licensor are credited and that theoriginal publication in this journal is cited, in accordance with accepted academicpractice. No use, distribution or reproduction is permitted which does not complywith these terms.
Frontiers in Microbiology | www.frontiersin.org 14 September 2017 | Volume 8 | Article 1784