Embed Size (px)
Citation preview

lable at ScienceDirect
Journal of Air Transport Management 57 (2016) 89e100
Contents lists avai
Journal of Air Transport Management
journal homepage: www.elsevier .com/locate/ ja ir t raman
Analyzing the effect of aviation infrastructure over aviation fuelconsumption reduction
Deepjyoti Das a, *, Somesh Kumar Sharma b, Raman Parti a, Jagroop Singh b
a Civil Engineering Department, National Institute of Technology (NIT), Hamirpur, H.P., 177005, Indiab Mechanical Engineering Department, National Institute of Technology (NIT), Hamirpur, H.P., 177005, India
a r t i c l e i n f o
Article history:Received 22 February 2016Received in revised form19 July 2016Accepted 20 July 2016
Keywords:Aviation industryInfrastructureFuel consumptionEmissionRevenue
* Corresponding author.E-mail addresses: [email protected],
[email protected] (S.K. Sharma), [email protected] (J. Singh).
http://dx.doi.org/10.1016/j.jairtraman.2016.07.0130969-6997/© 2016 Elsevier Ltd. All rights reserved.
a b s t r a c t
The purpose of this paper is to examine the effect of various aviation infrastructure dimensions overaviation fuel consumption reduction (AFCR) performance. This study is an effort that considers the role ofdimensions collectively from all aspects belonging to aviation infrastructure. The relevance of di-mensions and constructs for hypothesis development are based on extensive literature review. Explor-atory factor analysis (EFA) and Confirmatory Factor Analysis (CFA) were performed in the consecutivepurification processes. Also, hypothesis testing was conducted using Structural Equation Modeling (SEM).A customized questionnaire was developed for collecting data from both kinds of respondents: Aviationindustry experts and academic experts. Out of 382 approaches through mail survey, a total of 194 validresponses were collected. Analysis of the results shows the positive and significant impact of variousfactors such as: airport design, airspace management and air traffic control over the aviation fuel con-sumption reduction. Maximum importance is adjudged on air traffic control (ATC) and airspace routeflexibility. The results of this study will encourage airlines and airport development authorities to in-crease their insight over aviation infrastructure, also to perform deeper analysis and find out precisevalues for real life implications.
© 2016 Elsevier Ltd. All rights reserved.
1. Introduction
There was a time when aircraft fuel availability and extractioncost had almost no effect over aviation industry growth. Today,however, the aviation industry is facing a lot of challenges whichdemands the need for conservation of aviation fuel. Commercialairliners are facing aviation fuel cost as a major expenditure out oftheir total operational cost. Airline fuel bills have crossed thepreviously highest labor cost to become 34% of the total operatingcost (Lawrence, 2009). The early 1970s made it clear that the timeof abundance and cheap fossil fuels was facing its end. Economiesof aviation sector started to get affected significantly by fuel prices.After 1973 Arab oil embargo, market prices of fuel spiked, resultedin a prompt 400% increase in fuel price (ICAO, 2009). Over the nextfew decades, prices of aircraft fuel fluctuated a lot, raising concernsover aviation industry's profitability and sustainability. The
[email protected] (D. Das),n (R. Parti), erjagroop.me@
increase in the cost of fuel forces airlines to go for higher ticketprices, resulting in pressure on the customer's wallet. Again in2011, fuel prices severely spiked and reached an all-time high of140 dollars per barrel in March 2011. Between March 2011, andMarch 2016, huge instability in aircraft fuel prices was seen in theglobal market as fuel prices shrunk to almost three times. Though,prices of aircraft fuel dropped from the level of 140 dollars in 2011to today's level, which is close to 40 dollars per barrel (IATA, 2016).Airbus (2015) suggested prices of fuel will swell to a much higherlevel considering mid-to-long-term effects. After many consistentefforts by airliners, they are still facing huge difficulties to producean increase in efficiency and revenue matching instability of fuelprice. Top producers of fuel are oversupplying and oil demand ofworld aviation increased from 1.18 MB/day in 1971 to 4.9 MB/dayin 2006 and it's about 11.2% of worldwide overall fuel demand(Mazraati, 2010). Additionally, CO2 emissions are directly propor-tional to aviation fuel burning (Airbus, 2015). Concerns related toenvironmental degradation have increased over rapid escalation inthe growth of air traffic. All initiatives and policies have failed tocontrol a net increase of fuel utilization, and this leads to an in-crease in emissions with environmental impacts (Lee et al., 2001).A saving of 0.3 kg of aviation fuel can save almost a kg of CO2

D. Das et al. / Journal of Air Transport Management 57 (2016) 89e10090
emission, which in return also saves about 1.1 dollars (Tsai et al.,2014). Moreover, fuel reserves are depleting and there is direneed to look into the sustainability of the aviation industry.Supply-demand curves are showing an exponential gap. Tensionbetween Middle East nations and huge demand of fuel from Chinais making the gap worse (Abdelghany et al., 2005). With this, air-liners are confronting a challenge over maintaining their com-mercial viability, requiring a balance between increased fuelconsumption and aircraft fuel cost. Furthermore, passengersmostly like to opt for airlines which have greater environmentalconsciousness (Hagmann et al., 2015). All these situations haveencouraged airliners to explore efficient ways for aviation's fuelconsumption reduction (AFCR).
Studies by (Drake, 1974; Linz, 2012; Barros and Wanke, 2015)suggest that the key steps towards this goal would be throughsocio-economic and political changes, improving alternative fuels(Alonso et al., 2014), improvising technological innovations andchange in designs of aircraft (Dray, 2013). But, surprisingly previ-ous studies have always subdued a key element like aviationinfrastructure and its detailed impact on aviation fuel consump-tion. Lack of infrastructure and its operational efficiency leads todelays with congestions (this also works vice-versa). These delaysand congestions increase fuel consumption and emissions. Ac-cording to Eurocontrol (2013) delays at airports will rise from1 min in 2012 to 5e6 min per flight by 2035, and this is considereda substantial increase and needs to be controlled. ICC (1992)strongly urged airport authorities and governments to make atimely and adequate amount of investment in airports, which is aportion of aviation infrastructure. Failing to do so would result insevere airspace and airport congestions. Large investments bydeveloping nations in aviation infrastructures portray the impor-tance of aviation infrastructure. Sarkar (2012) suggested that byimproving the efficiency of aviation infrastructure, we can addi-tionally reduce 4% emissions globally by 2020. This reductioncould also be close to 10% for certain regions. Previous studiesalways lagged behind the precise solo collective effort of all thefactors and sub-factors of aviation infrastructure over AFCR. Thisstudy attempts to touch almost all the sub-areas of aviationinfrastructure in detail. In this article effort had been invested toconnect all research gaps for a definitive conclusion regarding theoptions in the field of aviation infrastructure for aviation fuelconsumption reduction.
2. Literature base for constructs and hypothesis development
Studies show that implementation of technologies and design isway behind schedule and fully depends on the wish of carriers,whether to invest on costly equipment's or not. Just as aircraftdesign, alternative fuels are also constrained by technological de-velopments' timeline. Thus, investing time and money over themmay not yield the required results in time. Moreover, there is a needfor immediate action. Development and implementation of tech-nology are constrained by its technology life cycle (TLC), whichinvolves rigorous safety testings and also require engineeringexcellence. All this significantly increases the development cost anddecreases implementation rate of technology (Ribeiro et al., 2007).So, the infrastructures emanate out to be the most predictable, andinvesting over it will produce predictable and satisfactory resultswith immediate effect. But investing in infrastructure to fill the gapbetween current and required is a huge one-time investment, sowemust go for increasing asset utilization (Adler and Gellman, 2012)by investing in certain parts of infrastructure which will yield themost reduction in fuel consumption. With it comes the need toidentify parts of aviation infrastructure which can assist themost inasset utilization.
While going through literature, we have to take into accountpropagation of delay i.e.; delay because of any reason transferredfrom one area to other areas (like a ripple effect) (Evans andSch€afer, 2011). Construct formation is based on the literaturestudy. The research model of the current study is displayed in Fig. 1and the development of the hypotheses are described in detailbelow.
2.1. Taxiway (TWY)
Development in the aviation industry is increasing ground op-erations complexity and causing problems throughout airportresource distribution. To increase the operational efficiency, wehave to pre-plan taxiway paths (Zhou and Jiang, 2015). Researchtowards simulating a flight movement on taxi routes are going onso that one can predict aircraft movements step by step leading tominimizing conflicts. Conflict leads to delay and fuel burn. Jianget al. (2013) studied taxiway safety separation for optimizing apath to be conflict free, by allowing one point of taxiway to permitonly one aircraft pass at a time. In the case of peak hours, aircraftwait in departure queues for as much as 30 min. Practices break-away thrusts to proceed, causing unnecessary fuel burn andemissions. Minimizing the taxing distance (Kazda and Caves, 2007)and incorporating rapid taxiways facilitate faster turnaround(Bradley, 2010) in airports; a significant amount of reduction inaircraft fuel burns can be achieved. Geometric component of ataxiway like number of turns and number of stops increases fuelconsumption, because of differential thrust and throttle adjust-ments use in respective cases (Khadilkar and Balakrishnan, 2012). Astudy by Nikoleris et al. (2011) concludes 18% of fuel consumption isbecause of stop and go situations. Based on the above arguments,the following hypothesis is made:
H1: Taxiways have significantly positive impact on AFCRperformance.
2.2. Terminal area (TMA)
As air transport is highly prone to changes for its efficiencyimprovement, Baltazar et al. (2014) took indicators, out of whichpassenger terminal area and cargo terminal area were efficiencyindicators. FAA (2013) predicted an increase of 105% in passengerdemand and 50% in flight operations for terminals areas from 2005to 2040. This alarming data projects, how important terminal areainfrastructure is for the efficiency of airports. Operations efficiencycan greatly reduce fuel use, and what is the operational capacity ofthat airport will decide an airport's fuel saving capacity. Accordingto Upham et al. (2003), operational capacity of an airport will beinfluenced by number of terminals and size of terminals in theairport. An increase in taxiing distance and terminal distance fromrunway lead to more distance to cover, causing more fuel con-sumption. Schlumberger (2012) found, location of terminal de-termines the extra greenhouse gas (GHG) emissions and similarlyhave an influence on fuel consumption. Based on the above argu-ments, the following hypothesis is made:
H2: Terminal areas have significantly positive impact on AFCRperformance.
2.3. Apron (APRN)
According to Bradley (2010) MARS (Multi-aircraft ramping sys-tem) centerline and single centerline are very efficient. But, theyhave their own advantages and disadvantages and depend on the

Fig. 1. Research model.
D. Das et al. / Journal of Air Transport Management 57 (2016) 89e100 91
layout of an apron to increase efficiency. To make ground move-ment work more effective and efficient, apron location from otherelements is a deciding element towardsminimization of congestionand taxing (ACRP, 2013) Aprons' size is found to be a critical matchtowards how many aircraft it can accommodate (ACRP, 2013;Hamzah and Adisasmita, 2015), and that will lead to a decrease incongestion by reducing number of aircraft inwaiting, i.e; in runwayand airspace. Use of push back control reduces departure queuesizes, leading to a substantial amount of fuel saving of 12,250 to14,500 Kg, CO2 emissions of 38,700 to 45,800 Kg and a total savingof 8800 to 10,400 dollars. Use of Ground power units than auxiliarypower units can save fuel in the range of 11,940 to 14,190 Kg(Simaiakis et al., 2014). ACRP (2013) suggested amount and type ofapron markings can drop visual confusion's occurring both to pilotsas well as the ground crews and results increase in apron area ef-ficiency. Based on the above arguments, the following hypothesis ismade:
H3: Aprons have significantly positive impact on AFCRperformance.
2.4. Runway (RWY)
Aircraft consumes a large amount of fuel while running on arunway, during its takeoff and landing. Ball et al. (2007) foundrunway condition's to be an important parameter for aircraftperformance. Smooth and a hard surface will decrease roll distancefuel consumption, as it reduces resistance and hence increases themomentum of the aircraft. Additional parallel runways candecrease fuel consumption significantly, but its construction issuitable for airports with ample area. Baltazar et al. (2014)considered numbers of runway to an important efficiency indica-tor. Santos and Antunes (2015) conclude an addition of runway canincrease the capacity of runways by 200e300 departures per day.Where there is an area constraint involved, one should prefer crossrunways over parallel runways to operate independently. But, howmuch or whether will it save fuel doesn't entirely depend on thecross runway. Rao et al. (2009) found runway slopes can decreaserunway length by 15e20% then level runways. Runway length isconsidered to be an important parameter for deciding the aircraftsize that will be in use (Hamzah and Adisasmita, 2015). As biggerthe aircraft in use per passenger or per unit cargo fuel consump-tion will be lesser. Poret et al. (2015) report that big aircraft likeBoeing 787-8 can tackle instability of fuel prices because of its
range/seat/payload capabilities. Balicki et al. (2014) state thataltitude change of runways cause variations in air density, whichresult into variations in lift, drag, length of runway and fuel con-sumption. Based on the above arguments, the following hypoth-esis is made:
H4: Runways have significantly positive impact on AFCRperformance.
2.5. Airspace routes and flexibility (AR_F)
Single European Sky ATM research (SESAR) initiates aperformance-based approach, which introduced flexibility overFunctional Airspace Blocks (FBA) of Portugal and Spain. Inclusionsof free route airspace of direct routes save 2e3% of flight distance,producing around 100,000 Euros of saving per day and tons ofemissions and fuel (Nava-Gaxiola and Barrado, 2016). Pham et al.(2010) suggest rerouting flights can be useful in congested flightpaths and waypoints can help in reducing emissions from fuelconsumption. Redesigning routes will allow choosingmost efficientroutes followed by a fall in fuel consumption (Sarkar, 2012). Ac-cording to Vaaben and Larsen (2015) an integration of flexibility inflight trajectories can cause a saving of several million USD forseverely impacted airspace congestions. Airspace is mainly dividedinto two areas i.e.; civil airspace and military airspace. Access tomilitary airspace by civil aircraft can sufficiently decrease conges-tions. According to Gianazza et al. (2009) number of aircraft andsector volume are a decisive parameter in airspace configuration.Lewis (2013) stated that in a mixed airspace risk of conflicts arehigh because of the cross and converge routes. This will lead tocongestion, forcing aircraft to choose non-efficient routes, resultingin extra fuel burn. An extra airspace access can provide an extraparallel route for avoiding conflicts. Based on the above arguments,the following hypothesis is made:
H5: Airspace routes and flexibility have significantly positiveimpact on AFCR performance.
2.6. Weather conditions (WR_C)
Efficiency and capacity of air transport are highly affected bysevere weather conditions. Concerns pertain about the severity ofweather conditions hampering operations of air transport. Zillieset al. (2014) concludes wind optimized routing increases 4.3% of

D. Das et al. / Journal of Air Transport Management 57 (2016) 89e10092
overall efficiency. Savings on a lower wind day will be consider-ably lower. Icing imposes extra weight to an aircraft leading todecrease in lift and increase in drag resulting extra fuel burn(Bedard, 2003). Bedard (2003) categorized thunderstorm as anaviation hazard, which can cause controls to go haywire andcausing delays. Zanni and Ryley (2015) conclude snow as the mostdisruptive one causing 30% trips to face long delays and over 25%being canceled. Hurricanes affect 40% trips and volcanic ash cau-ses 75% cancellations. Balicki et al. (2014) suggested dust as a keyelement which will increase fuel burn because of loss of thrust anddeposition in cavities and engines, thus reducing speed, deterio-rating engine efficiency. Rerouting, ground holding and cancella-tion of flights, only for 1-h closure of London Heathrow airportcosts around 700,000 to 1,250,000 Euros (Pejovic et al., 2009).Yoder (2007) used temperature as a fuel reduction modelingparameter and Balicki et al. (2014) found an increase in temper-ature affects turbine engines causing more fuel burn. Fog produceslow visibility and increases arriving aircraft spacing, enforcingthem to lower landing rates. Ball et al. (2007) suggests fog is highlydisturbing in the case of operations and control, causing highdelays. Based on the above arguments, the following hypothesis ismade:
H6: Weather conditions have significantly positive impact onAFCR performance.
2.7. Air traffic control (ATC)
The core purpose of ATC is to maintain a safe separation andefficient control over concerned aircraft. As airports are a bottleneckfor air transport,managing operations of the airport can successivelyreduce congestions and delays. According to Marks and Rietsema(2014) and Roosens (2008), VHF radio communication is one keyelement for efficient movement and adding more VHF frequencieswill increase ease of communication, causing fewer delays (Marksand Rietsema, 2014; Roosens, 2008). Radar is for smooth flow oftraffic, FAA spending's on radar facilities decreases costs of delays.Navigational system is for efficient movement of traffic, as thedevelopment of satellite navigation system make flights to go moredirect and to choose efficient ones. An introduction of 4D trajectorybased operations is researched by SESAR in Europe and NEXTGen inthe USA. Operations using 4D trajectories can solve the issues oftraffic predictability, optimal route, capacity, ATC workload, delay,fuel consumption and emissions (Enea and Porretta, 2012). Impor-tance of ATC skilled personnel's in increasing capacities and effec-tiveness of a system has been suggested by (Ball et al., 2007). Thus,we proposed the following hypothesis:
H7: Air traffic control has significantly positive impact on AFCRperformance.
2.8. Fuel handling (FL_H)
Lack of fuel handling expertise can cause more fuel consump-tion leading to wastage. Chauhan et al. (2015) suggested pumpingequipments should be maintained regularly to get more efficiency,minimizing delays and leakage waste. Chauhan et al. (2015) andFAA (1974) suggests filters to be an important part of refueling asclogging or rust in it can reach turbines through fuel and clog it,causing even more decrease in efficiency. FAA (1974) suggestsstorage tanks can contaminate fuel causing detrition of aviationfuel quality. Condensed water should be checked and removed ona regular basis. Another type of contamination occurs because of
FAME (Fatty Acid Methyl Ester) from biofuel. FAME has an ability tobe absorbed by the surface of storage tanks. A joint transportationsystem of jet fuel and biofuel mixed diesel make a possibility ofFAME to mix with jet fuel. FAME's acceptable limit is 5 ppmwhichis very low and such low amount of the same categorizes fuel ascontaminated and unsuitable for use as aviation turbine fuel (JointInspection Group, 2008). Thus, we proposed the followinghypothesis:
H8: Fuel handling has a significantly positive impact on AFCRperformance.
2.9. AFCR performance (PRFM)
AFCR performance is not a singular identity, but comprises ofsub-areas which will also be directly influenced by impacting pa-rameters. Simi�c and Babi�c (2015) considered fuel consumptionreduction and emission reduction as dominant objectives whileassessing infrastructure utility. As reduction in fuel consumptionwilldecrease emissions and produce energy savings, we also have tomeasure revenue savings. Virtual Frontier Benevolent DEA CrossEfficiency model (VFB-DEA) introduced by Cui and Li (2015) studiedthe energy efficiency over a time-period of 2008e2012 for 11 air-lines. Results indicated energy efficiency is greatly driven by capitalefficiency, mainly revenue generated. The unit cost of per landingand takeoff (LTO) air pollution depends on the severity of their globalimpact and are divided into short, medium and long haul. The unitcosts are 81, 145 and 700 Euros respectively (Eurocontrol., 2015).
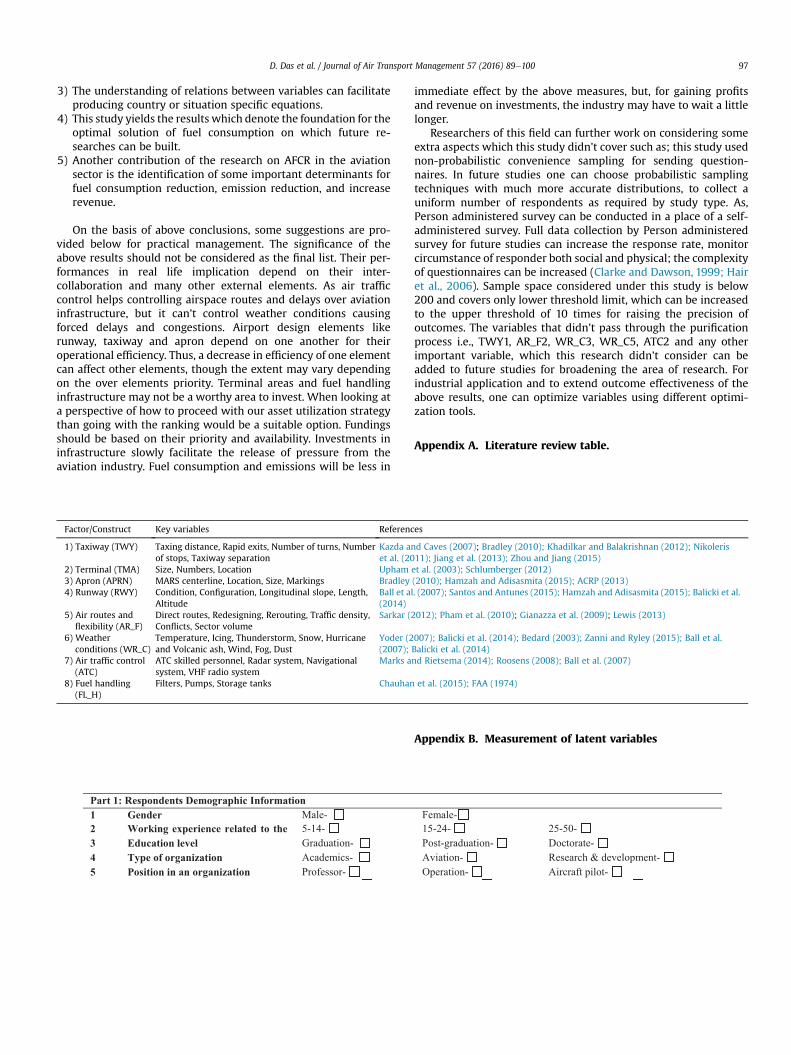
The overall idea about all factors and sub-variables has beenprovided in Appendix A. Literature review table.
3. Research methodology
3.1. Measurement instrument and sampling technique
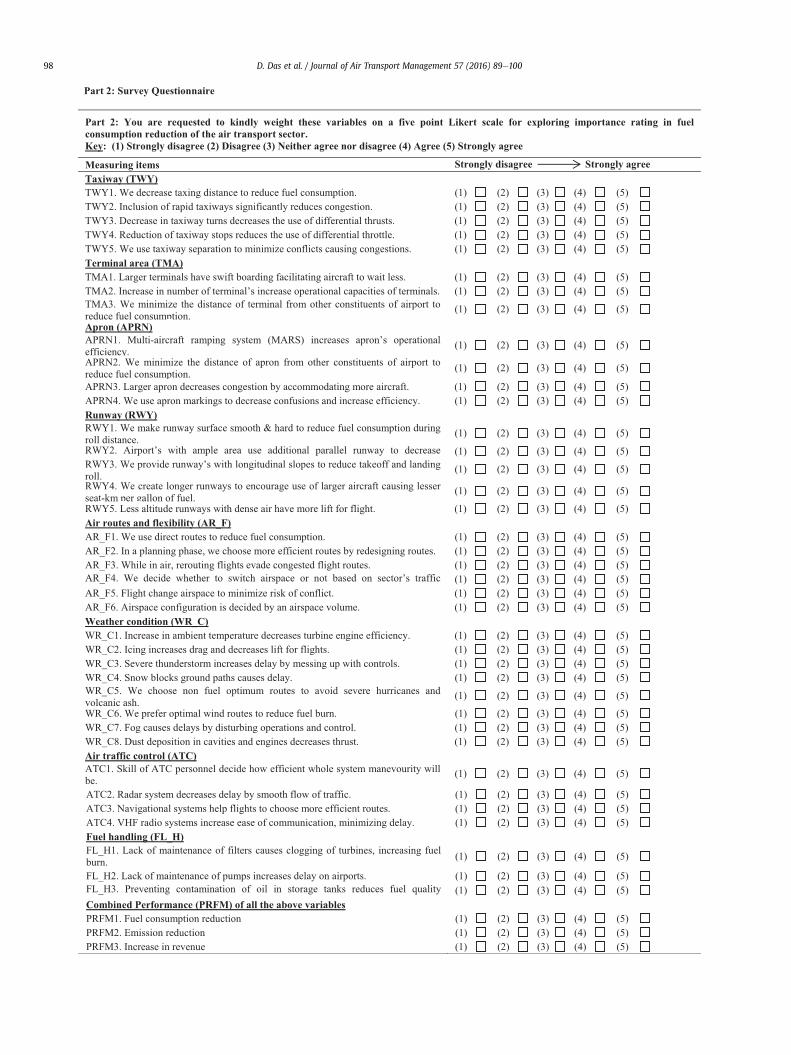
All the questions were proposed on the basis of extensiveresearch of more than 140 articles of previous studies. Questions inquestionnaire were tested for their validity. For its bettermentacademicians and experts in the field of aviation gave theirinvaluable suggestions, towards its refinement and testing. Assuggested by Sekaran (2006) both pre-test and pilot study wasconducted to decrease questionnaire's inexactness and validateinstrument through feedbacks. A five-point Likert scale had beenused. In the scale, 1 represent strongly disagree and 5 representstrongly agree. The data's from Likert scale should not be treated asordinal data but intervals. In the study, the questionnaire wasconveyed by a covering letter, which described the goal and sig-nificance of the research study, then ensured confidentiality forthe filled data. Respondents were described that the study wasbeing conducted to investigate their opinion on fuel consumptionthrough aviation infrastructure, and that the involvement in thestudy was voluntary. They were additionally informed that anytime they have the right to withdraw from the study and there is anecessity of at least 5 years of experience to contribute in thestudy. Furthermore, the respondents were provided with thecontact info of the researcher (i.e., Name, designation, contactnumber and contact address) so that they can do related inquiriesand if they wish, they can obtain the results of the study. Ques-tionnaires were of 2 parts, first, to measure demographic charac-teristics using a nominal scale and second to measure constructsusing the ordinal scale i.e., Likert scale. A sample copy of thequestionnaire is given in Appendix B. Orders of the questions ofthe questionnaire were varied with each respondent to counter

D. Das et al. / Journal of Air Transport Management 57 (2016) 89e100 93
possible order bias.For distribution of the questionnaire, we used a non-probalistic
method of convenience sampling (as the cost of the survey was lowand easy to approach to the responders). Gathering of a substantialshare of datawas accomplished through self-administeredmethod.The self-administered survey has many advantages such as: ampletime for respondent to provide well thought out responses;conveniently approachable respondents, a lesser amount of inter-viewer bias and low cost. Central Industrial Security Force (CISF)and Airport authorities of Agartala Airport (IXA), Indira GandhiInternational Airport (DEL), Netaji Subhas Chandra Bose Interna-tional Airport (CCU), Raja Bhoj Airport (BHO) and Jaipur Interna-tional Airport (JAI) helped in reaching marked personnel's and tocollect completed survey data. We targeted senior academiciansand experts as they have greater knowledge in the field. Thequestionnaire had 8 factors consisting a total of 38 measures forAFCR performance evaluation. The questionnaires were distributedto 382 respondents through mails and hand to hand. After oneweek we sent another copy with some follow up only to those whodidn't respond via mail to increase chances of a reply. Every stephad been taken to make the respondents comfortable withreplying.
A response rate of less than 20% stands to be highly objection-able (Yu and Cooper, 1983). Out of 382 respondents, we got 122responses within 21 days as early wave and 83 responses after 21days regarded as late wave, totaling to 205 responses. Out of them,11 responses were incomplete, andwere discarded.We are now leftwith 194 valid responses, with a response rate of 50.78 percent. Thenumber of responses is above the lower threshold (prescribed to be5 times of the number of items) (Hair et al., 2006). The responserate is much above the objectionable and prescribed level. So it'ssatisfactory to proceed with the current number of responses. Outof 194, 137 were from aviation industries and 57 from academics.The data collection was conducted from 10th October 2015 to 24thNovember 2015 i.e.; 55 days. Respondent's detail is provided inTable 1. However, the recognized categories only differ significantlyin working experience and in position between research scientistsand pilots. This suggests that with experience, views on certainissues change and there is a perception difference between personswith theoretical knowledge and with practical on-field knowledge.This furthermore puts forward that other socio-demographic in-dividualities, including gender, education level, type of workingorganization don't significantly influence perceptions,
Table 1Respondent's profile (Sample description: N ¼ 194).
Samples Category
Gender MaleFemale
Working experience related to aviation field (years) 5e1415e2425e50
Education level DoctoratePost-graduatGraduation
Type of organizations AcademicsAviationResearch & d
Position in an organization ProfessorsResearch scieOperationsMaintenanceAircraft pilotsEngineer
underpinning the study. However, working positions may some-what vary individual perceptions.
The kurtosis and skewness values are �1.337 to 1.187 respec-tively, which is between the acceptable limit of �2 to þ2 (Georgeand Mallery, 2012). To check for the non-response bias, weconsidered the study of Narasimhan (2001). Here, we consideredthe late wave as non-respondents and the early wave as re-spondents. We calculated mean, using t-test of randomly selected20 questions from both groups. In comparison, we found they had anon-significant difference. The results confirmed the absence ofresponse bias.
To counter commonmethod bias, the best way is to use CFA andcompare the non-centrality index of two different models (Lowryand Gaskin, 2014). We used Harman's one-factor-test (Podsakoffet al., 2003). One was proposed model with 9 factors and anotherwas 1-factor model having all observed variables loading on it. Thevalues without rotation came as 0.735 for proposed 9-factor modeland 0.314 for the 1-factor model. The value of the 1-factor model isbelow 50% of the 9-factor model. Thus, confirms no commonmethod bias. Other than CFA we also gave consideration to studyprocedure. By cautiously constructing constructs and confirmingresponders anonymity for excluding a possible bandwagon effect(Linz, 2012) we minimized chances of common method bias. Assuggested by Nowack et al. (2011) we made sure that comment ofone respondent reaches other respondents for better responsequality.
3.2. Research procedure
In this study, we will use quantitative research approach.Quantitative approach simplifies complex study problems bybreaking them into simpler elements. It offers statistical proof forrelations among endogenous and exogenous constructs. In addi-tion, the quantitative approach also gives solid validity and reli-ability. Lastly, it provides prospect aimed at cost-effective datacollection and approves clear theoretical focus with easily compa-rable data. (Amaratunga et al., 2002).
Research steps for this study comprise of three step improve-ment procedure. Firstly, EFA then CFA and at last structural model'sanalysis. Many other studies successfully applied factor analysisand SEM modeling for their detailed research in various fields ofair transport industry. For example, in the field of relationalmanagement of air transport industry, Chao et al. (2015)
N Approx. percentage (%)
163 8431 1687 4561 3146 2489 46
ion 79 4126 1357 29126 65
evelopment 11 647 24
ntists 11 647 2428 1419 1042 22

D. Das et al. / Journal of Air Transport Management 57 (2016) 89e10094
conducted a study between Taiwan's airlines and travel agencies.They validated their relationship marketing model using CFA thenSEM. Similarly, Wang (2014) leads a similar research procedure forhis study over perceived relationship investment and relationshipbonds. Incorporating study on the field of behavioral science forthe air transport industry, Davison et al. (2014) conducted a studyover household behavioral intentions and air travel behavior. In it,EFA was used to cluster psychological constructs into attitude-based segments. Then, SEM was used for analyzing their path ofaction. In another study, Wang and Ngamsiriudom (2015) con-ducted a study on worshipping of celebrity over constructs ofpurchase intentions and Theory of Planned Behavior's (TPB is aprincipal staple of behavioral study). In it researchers employedEFA to check any notable deviation from the adapted constructstructure, then, CFA was used to evaluate validity. Then, pathanalysis using SEM was conducted to examine research hypothe-ses. A study of Ku and Chen (2013) was focused on the use of self-service technology (SST). The investigation was to show how ser-vice processes fit facilitates customer's behavior to use SSTs. In theresearch, CFA was used to check the validity of the constructs andafter that SEM for hypothesis testing. In the field of service,Nameghi and Ariffin (2013) conducted their study over full-servicecarriers of Malaysian airline industry to propose airline hospitalitydimensions and their measuring scales. In it firstly, EFA wasemployed to identify underlying construct structure and then, CFAto verify the structure of factors. Similarly, in the same field ofresearch Hussain et al. (2015) used CFA then SEM for path analysis.Their study was on UAE-based airlines, to investigate linkageamong customer satisfaction and service quality. Liedtka (2002)conducted a study to measure airline industries non-financialperformance. In here, required factors emerged using EFA andthen to scrutinize the factor structure CFA was employed.Jenatabadi and Ismail (2014) used the same procedure of CFA thenSEM. The study was on estimating airline companies financial andnon-finacial performance. In another study, Evans et al. (2007)used the same procedure of EFA followed by CFA to develop ascale for aviation safety climate, which include initial developmentof scale using EFA and then used CFA to check posted prior modelto fit the data. In brief, EFA will help us to propose a model or tocheck the structure of any literature model. Mainly, EFA is used fordata reduction. CFA facilitates verifying the model given by EFAand to check the fitness of the model for proceeding to SEM. SEM isan empirical technique to test relations between constructs. As thetechnique is multivariate (Hair et al., 2006) in nature, it can workwith multiple equations at a time. Above examples works as afoundation for the research procedure, we are going to follow andportray the appropriateness of our study procedure.
4. Results and discussions
4.1. EFA results
The values of Barlett test (BT) and Kaiser-Meyer-Olkin (KMO)showed all constructs were homogenous and adequate. Barlett'stest (BT) of sphericity value indicated statistical significance and itsvalue was less than 0.05. Kaiser-Meyer-Olkin (KMO) indicatedsampling adequacy and for that, it should be more than 0.5.Therefore, suitable for performing principal component analysisusing varimax rotation. Factor loading for each item should begreater than 0.5 (Nameghi and Ariffin, 2013). At first run, wechecked pattern matrix, we found the loading of TWY1, AR_F2,WR_C3, WR_C5, ATC2 and performance measuring items were notclean and faced cross loadings. But, considering the literature
importance of the performancemeasures and insignificance of thisstudy without considering them, we proceeded to other checkswithout deleting the performance measures. TWY1, AR_F2,WR_C3, WR_C5, ATC2 were removed from the pre-developedmodel. For each construct, we checked Eigen-values and foundthem to be greater than 1 (Lu, 2014). All cumulative percentages ofvariance were more than 60% as suggested by Hair et al. (2006).Then we opted for a reliability check with Cronbach alpha value(a), which should be greater than 0.7 (Hussain et al., 2015). Allvalues for constructs were more than 0.7, thus showed their reli-ability. Finally, we were left with an instrument having 33 itemsand 3 AFCR performance indicators. The results in detail are shownin Table 2.
4.2. CFA results
CFA was used after EFA as a second-degree refinement. Themodel used was the resulting model after applying EFA. Wechecked for construct validity and then unidimensionality. As EFAchecks only theoretical basis, on the other hand, CFA can checkfactor correlations, common variable loading on multiple factors.
4.2.1. Construct validityConstruct validity involves fulfilling both convergent and
divergent validity.
4.2.1.1. Convergent validity. Convergent validity indicates theextent towhich items attempts to measure a single construct. Ahireet al. (1996) suggested the use of CFA to assess convergent validity.If the values of average variance extracted (AVE) are greater than0.5 and composite reliability (CR) greater than 0.7 indicate thevalidity of the model (Fornell and Larcker, 1981).
Detailed results are shown in Table 3.
4.2.1.2. Discriminant validity. Discriminant validity measures thediscrete characteristic of construct's measures. It is desirable thateach measure should not correlate too much with a measure fromanother construct to maintain personal distinct identity. To sup-port the validity, the square root of AVE should be greater than allthe correlation between constructs. In another conditionmaximum shared squared variance (MSV) and average sharedsquared variance (ASV) should be less than AVE (Fornell andLarcker, 1981). From Table 3 we can see the model fulfillingdiscriminant validity.
4.2.2. UnidimensionalityUnidimensionality indicates whether a set of items represents
one or more than one factors. Multiple indicators weaken unidi-mensionality which is not preferred. For the study, we followed thestudy of Chong et al. (2011). We checked measure of fit using c2/df ¼ 1.248, which should be less than 3 indicating a good model fit.For unidimensionality, we considered the study of Hart (1994) andKatos (2010), who suggested that if CFI and GFI are above 0.8, thefactors are considered to be unidimensional. Fit indices values forthe measurement model are GFI¼ 0.840, CFI¼ 0.969, RMR¼ 0.031,SRMR ¼ 0.048, RMSEA ¼ 0.036, TLI ¼ 0.964. For an additionalassurance to proceed, we considered the additional parameters ofthe study Bollen (1989). This included SRMR, RMSEA, and RMR.Values were below 0.1. The value of TLI is above 0.9 (Erkmen andHancer, 2015). So the proposed model was acceptable and pro-ceeds to SEM analysis.

Table 2EFA results.
Items Factor loadings SMC KMO Eigen-value Variance explained (%) Cronbach a Mean SD
H1. Taxiway (TWY) 0.775 2.746 68.661 0.844 3.869 0.721TWY2 0.792 0.467TWY3 0.781 0.522TWY4 0.901 0.839TWY5 0.834 0.539H2. Terminal area (TMA) 0.735 2.368 78.926 0.866 3.811 0.901TMA1 0.880 0.658TMA2 0.902 0.731TMA3 0.884 0.666H3. Apron (APRN) 0.831 2.951 73.775 0.880 3.709 0.818APRN1 0.850 0.604APRN2 0.821 0.537APRN3 0.885 0.760APRN4 0.879 0.706H4. Runway (RWY) 0.852 3.317 66.339 0.869 3.944 0.723RWY1 0.741 0.403RWY2 0.880 0.779RWY3 0.856 0.684RWY4 0.764 0.452RWY5 0.822 0.601H5. Air routes & flexibility (AR_F) 0.854 3.346 66.916 0.875 4.087 0.719AR_F1 0.889 0.747AR_F3 0.830 0.601AR_F4 0.797 0.540AR_F5 0.802 0.543AR_F6 0.777 0.518H6. Weather conditions (WR_C) 0.925 4.529 75.484 0.934 3.898 0.967WR_C1 0.826 0.602WR_C2 0.879 0.732WR_C4 0.848 0.642WR_C6 0.900 0.788WR_C7 0.872 0.714WR_C8 0.886 0.758H7. ATC (ATC) 0.746 2.465 82.182 0.891 4.122 0.779ATC1 0.902 0.716ATC3 0.899 0.681ATC4 0.919 0.802H8. Fuel handling (FL_H) 0.742 2.437 81.235 0.884 3.514 0.963FL_H1 0.904 0.704FL_H2 0.887 0.645FL_H3 0.913 0.806AFCR Performance (PEFM) 0.710 2.297 76.554 0.846 3.942 0.784PRFM1 0.900 0.706PRFM2 0.890 0.701PRFM3 0.833 0.563
Table 3Convergent, discriminant validity.
CR AVE MSV ASV FL_H TMA TWY APRN RWY AR_F WR_C ATC PRFM
FL_H 0.884 0.718 0.151 0.074 0.848TMA 0.867 0.685 0.246 0.121 0.273 0.828TWY 0.851 0.592 0.240 0.083 0.088 0.179 0.769APRN 0.882 0.652 0.298 0.144 0.388 0.270 0.211 0.807RWY 0.874 0.584 0.450 0.170 0.253 0.359 0.239 0.422 0.764AR_F 0.878 0.590 0.588 0.223 0.250 0.390 0.285 0.440 0.454 0.768WR_C 0.935 0.706 0.329 0.150 0.373 0.317 0.224 0.352 0.405 0.409 0.840ATC 0.891 0.732 0.546 0.191 0.087 0.399 0.393 0.299 0.337 0.576 0.350 0.856PRFM 0.851 0.656 0.588 0.348 0.298 0.496 0.490 0.546 0.671 0.767 0.574 0.739 0.810
Note: Diagonal elements (in bold) denote the square root of the average variance extracted (AVE).
D. Das et al. / Journal of Air Transport Management 57 (2016) 89e100 95
4.2.3. Coefficient estimates in the measurement modelFor the measurement model, all the standardized factor load-
ings are significant and above 0.5 and squaredmultiple correlations(SMC) were above 0.4 (Choi and Park, 2015). Their t-values aregreater than acceptable limit of 1.96 (Lowry and Gaskin, 2014),representing coefficient estimates to be reasonable. For TWY, ‘stopsin taxiway’ have the highest standardized factor loading of 0.916,
representing greatest describing power. For TMA, ‘number of ter-minals’ has the highest standardized factor loading of 0.855, rep-resenting greatest describing power. For APRN, ‘size of apron’ hasthe highest standardized factor loading of 0.872, representinggreatest describing power. For RWY, ‘runway configuration’ has thehighest standardized factor loading of 0.883, representing greatestdescribing power. For AR_F, ‘direct routes’ has the highest

Table 4Results of SEM analysis.
Hypothesis SPC t-value Results
H1: TWY / PRFM 0.244*** 3.630 SupportedH2: TMA / PRFM 0.112 1.746 Not supportedH3: APRN / PRFM 0.187** 2.883 SupportedH4: RWY / PRFM 0.408*** 5.881 SupportedH5: AR_F / PRFM 0.444*** 6.272 SupportedH6: WR_C / PRFM 0.236*** 3.713 SupportedH7: ATC / PRFM 0.480*** 6.699 SupportedH8: FL_H / PRFM 0.014 0.217 Not supported
Note: ** denotes p < 0.01; *** denotes p < 0.001; SPC e Standardized pathcoefficient.
D. Das et al. / Journal of Air Transport Management 57 (2016) 89e10096
standardized factor loading of 0.865, representing greatestdescribing power. For WR_C, ‘wind direction’ has the higheststandardized factor loading of 0.888, representing greatestdescribing power. For ATC, ‘skill of personnel has the higheststandardized factor loading of 0.895, representing greatestdescribing power. For FL_H, ‘storage tanks’ has the highest stan-dardized factor loading of 0.898, representing greatest describingpower. For PRFM, ‘Fuel consumption reduction’ has the higheststandardized factor loading of 0.840, representing greatestdescribing power.
4.3. Hypothesis testing using SEM
Path coefficients of SEM shown in Fig. 2 indicate the ranking ofimpact by infrastructure dimensions. The rankings are in the orderATC (b ¼ 0.480, p < 0.001), AR_F (b ¼ 0.444, p < 0.001), RWY(b ¼ 0.408, p < 0.001), TWY (b ¼ 0.244, p < 0.001), WR_C(b ¼ 0.236, p < 0.001), APRN (b ¼ 0.187, p < 0.01), TMA (b ¼ 0.112,p > 0.05) and FL_H (b ¼ 0.014, p > 0.05). Table 4 shows the pathcoefficient of ATC, AR_F, RWY, TWY, WR_C are positive as well assignificant at a level smaller than 0.001. The path coefficient ofAPRN is positive as well as significant at a level smaller than 0.01.The path coefficient of TMA and FL_H is positive but non-significant at a level greater than 0.05. Above results representthat if authorities and experts exert their focus majorly towardsdevelopment and synergy between ATC, AR_F, RWY and TWYrespectively, then, a significant amount of reduction in aviationfuel consumption can be achieved. For further benefits, experts canfocus on other areas like WR_C, APRN respectively. Investment onTMA and FL_H may produce some positive results, but it may notbe as worthy as other parts of aviation infrastructure. In PRFMmeasure, fuel consumption reduction leads the pack with a valueof 0.734 signifying maximum benefit on the reduction of fuel
Fig. 2. SEM analysis p
consumption. The increase in revenue was lowest on performanceground. A model proposed by Daniel (2002) can be used to esti-mate benefits of different parts of airport infrastructure based ontraffic pattern changes.
5. Conclusion and suggestions
The contribution of this study can be listed as follows:
1) The study emphasizes on the importance of aviation infra-structure elements in fuel consumption.
2) The aviation infrastructure literature shows the scarcity ofempirical research on the determinants of AFCR performance inthe aviation sector. This study examined the viability of themodel, and thus, the results of the present research contributeby filling the important gaps, by taking on a theory-basedempirical investigation of the determinants of AFCR perfor-mance in the context of aviation infrastructure.
ath coefficients.
D. Das et al. / Journal of Air Transport Management 57 (2016) 89e100 97
3) The understanding of relations between variables can facilitateproducing country or situation specific equations.
4) This study yields the results which denote the foundation for theoptimal solution of fuel consumption on which future re-searches can be built.
5) Another contribution of the research on AFCR in the aviationsector is the identification of some important determinants forfuel consumption reduction, emission reduction, and increaserevenue.
On the basis of above conclusions, some suggestions are pro-vided below for practical management. The significance of theabove results should not be considered as the final list. Their per-formances in real life implication depend on their inter-collaboration and many other external elements. As air trafficcontrol helps controlling airspace routes and delays over aviationinfrastructure, but it can't control weather conditions causingforced delays and congestions. Airport design elements likerunway, taxiway and apron depend on one another for theiroperational efficiency. Thus, a decrease in efficiency of one elementcan affect other elements, though the extent may vary dependingon the over elements priority. Terminal areas and fuel handlinginfrastructure may not be a worthy area to invest. When looking ata perspective of how to proceed with our asset utilization strategythan going with the ranking would be a suitable option. Fundingsshould be based on their priority and availability. Investments ininfrastructure slowly facilitate the release of pressure from theaviation industry. Fuel consumption and emissions will be less in
Factor/Construct Key variables Referenc
1) Taxiway (TWY) Taxing distance, Rapid exits, Number of turns, Numberof stops, Taxiway separation
Kazda anet al. (20
2) Terminal (TMA) Size, Numbers, Location Upham3) Apron (APRN) MARS centerline, Location, Size, Markings Bradley4) Runway (RWY) Condition, Configuration, Longitudinal slope, Length,
AltitudeBall et al(2014)
5) Air routes andflexibility (AR_F)
Direct routes, Redesigning, Rerouting, Traffic density,Conflicts, Sector volume
Sarkar (2
6) Weatherconditions (WR_C)
Temperature, Icing, Thunderstorm, Snow, Hurricaneand Volcanic ash, Wind, Fog, Dust
Yoder (2(2007);
7) Air traffic control(ATC)
ATC skilled personnel, Radar system, Navigationalsystem, VHF radio system
Marks a
8) Fuel handling(FL_H)
Filters, Pumps, Storage tanks Chauhan
immediate effect by the above measures, but, for gaining profitsand revenue on investments, the industry may have to wait a littlelonger.
Researchers of this field can further work on considering someextra aspects which this study didn't cover such as; this study usednon-probabilistic convenience sampling for sending question-naires. In future studies one can choose probabilistic samplingtechniques with much more accurate distributions, to collect auniform number of respondents as required by study type. As,Person administered survey can be conducted in a place of a self-administered survey. Full data collection by Person administeredsurvey for future studies can increase the response rate, monitorcircumstance of responder both social and physical; the complexityof questionnaires can be increased (Clarke and Dawson, 1999; Hairet al., 2006). Sample space considered under this study is below200 and covers only lower threshold limit, which can be increasedto the upper threshold of 10 times for raising the precision ofoutcomes. The variables that didn't pass through the purificationprocess i.e., TWY1, AR_F2, WR_C3, WR_C5, ATC2 and any otherimportant variable, which this research didn't consider can beadded to future studies for broadening the area of research. Forindustrial application and to extend outcome effectiveness of theabove results, one can optimize variables using different optimi-zation tools.
Appendix A. Literature review table.
es
d Caves (2007); Bradley (2010); Khadilkar and Balakrishnan (2012); Nikoleris11); Jiang et al. (2013); Zhou and Jiang (2015)et al. (2003); Schlumberger (2012)(2010); Hamzah and Adisasmita (2015); ACRP (2013). (2007); Santos and Antunes (2015); Hamzah and Adisasmita (2015); Balicki et al.
012); Pham et al. (2010); Gianazza et al. (2009); Lewis (2013)
007); Balicki et al. (2014); Bedard (2003); Zanni and Ryley (2015); Ball et al.Balicki et al. (2014)nd Rietsema (2014); Roosens (2008); Ball et al. (2007)
et al. (2015); FAA (1974)
Appendix B. Measurement of latent variables
D. Das et al. / Journal of Air Transport Management 57 (2016) 89e10098

D. Das et al. / Journal of Air Transport Management 57 (2016) 89e100 99
References
Abdelghany, K., Abdelghany, A., Raina, S., 2005. A model for the airlines' fuelmanagement strategies. J. Air Transp. Manag. 11 (4), 199e206. http://dx.doi.org/10.1016/j.jairtraman.2004.10.002.
ACRP, 2013. Apron Planning Administration and Design Guidebook, 96. Trans-portation research board, Washington, D.C. Retrieved from. http://www.onlinepubs.trb.org/acrp/acrp_rpt_096.pdf. Last accessed: 20-Feb-16.
Adler, N., Gellman, A., 2012. Strategies for managing risk in a changing aviationenvironment. J. Air Transp. Manag. 21, 24e35. http://dx.doi.org/10.1016/j.jairtraman.2011.12.014.
Ahire, S., Golhar, D., Waller, M., 1996. Development and validation of TQM imple-mentation constructs. Decis. Sci. 27 (1), 23e56. http://dx.doi.org/10.1111/j.1540-5915.1996.tb00842.x.
Airbus, 2015. Global Market Forecast 2015-2034. http://www.airbus.com/company/market/forecast/?eID¼maglisting_push&tx_maglisting_pi1%5BdocID%5D¼86756.
Alonso, G., Benito, A., Lonza, L., Kousoulidou, M., 2014. Investigations on the distri-bution of air transport traffic and CO2 emissions within the European Union. J. AirTransp. Manag. 36, 85e93. http://dx.doi.org/10.1016/j.jairtraman.2013.12.019.
Amaratunga, D., Baldry, D., Sarshar, M., Newton, R., 2002. Quantitative and quali-tative research in the built environment: application of “mixed” researchapproach. Work Study 51 (1), 17e31. http://dx.doi.org/10.1108/00438020210415488.
Balicki, W., Głowacki, P., Szczecinski, S., Chachurski, R., Szczeci�nski, J., 2014. Effect ofthe atmosphere on the performances of aviation turbine engines. Acta Mech.Automatica 8 (2). http://dx.doi.org/10.2478/ama-2014-0012.
Ball, M., Barnhart, C., Nemhauser, G., Odoni, A., 2007. Chapter 1 Air Transportation:Irregular Operations and Control. Transportation, pp. 1e67. http://dx.doi.org/10.1016/s0927-0507(06)14001-3.
Baltazar, M., Jardim, J., Alves, P., Silva, J., 2014. Air transport performance and Effi-ciency: MCDA vs. DEA approaches. Procedia Soc. Behav. Sci. 111, 790e799.http://dx.doi.org/10.1016/j.sbspro.2014.01.113.
Barros, C., Wanke, P., 2015. An analysis of African airlines efficiency with two-stageTOPSIS and neural networks. J. Air Transp. Manag. 44e45, 90e102. http://dx.doi.org/10.1016/j.jairtraman.2015.03.002.
Bedard, A., 2003. Aviation meteorology j aviation weather hazards. Encycl. Atmos.Sci. 1, 166e176. http://dx.doi.org/10.1016/b978-0-12-382225-3.00075-x.
Bollen, K., 1989. Structural Equations with Latent Variables. Wiley, New York.Bradley, A., 2010. Airport apron, runway and taxiway design. Indep. Airpt. Plan.
Man. 81e100. http://dx.doi.org/10.1533/9780857090355.81.Chao, C., Chen, H., Yeh, T., 2015. A comprehensive relationship marketing model
between airlines and travel agencies: the case of Taiwan. J. Air Transp. Manag.47, 20e31. http://dx.doi.org/10.1016/j.jairtraman.2015.03.015.
Chauhan, S., Bose, A., Singh, B., Manivannan, S., Thikekar, R., Roy, U., 2015. Storage,handling, refuelling and firefighting at aviation fuelling stations. OISD-STD-235,pp. 1e103. Retrieved from. http://oisd.gov.in/publicComment235.html. Lastaccessed: 20-Feb-16.
Choi, J., Park, J., 2015. A study on factors influencing ‘CyberAirport’ usage intention:an Incheon International Airport case study. J. Air Transp. Manag. 42, 21e26.http://dx.doi.org/10.1016/j.jairtraman.2014.07.010.
Chong, A., Chan, F., Ooi, K., Sim, J., 2011. Can Malaysian firms improve organiza-tional/innovation performance via SCM? Industr Mngmnt Data Syst. 111 (3),410e431. http://dx.doi.org/10.1108/02635571111118288.
Clarke, A., Dawson, R., 1999. Evaluation Research. SAGE, London.Cui, Q., Li, Y., 2015. Evaluating energy efficiency for airlines: an application of VFB-
DEA. J. Air Transp. Manag. 44e45, 34e41. http://dx.doi.org/10.1016/j.jairtraman.2015.02.008.
Davison, L., Littleford, C., Ryley, T., 2014. Air travel attitudes and behaviours: thedevelopment of environment-based segments. J. Air Transp. Manag. 36, 13e22.http://dx.doi.org/10.1016/j.jairtraman.2013.12.007.
Daniel, J., 2002. Benefit-cost analysis of airport infrastructure: the case of taxiways.J. Air Transp. Manag. 8 (3), 149e164. http://dx.doi.org/10.1016/s0969-6997(01)00051-5.
Drake, J., 1974. Social, political and economic constraints on airline fuel optimiza-tion. Transp. Res. 8 (4e5), 443e449. http://dx.doi.org/10.1016/0041-1647(74)90064-1.
Dray, L., 2013. An analysis of the impact of aircraft lifecycles on aviation emissionsmitigation policies. J. Air Transp. Manag. 28, 62e69. http://dx.doi.org/10.1016/j.jairtraman.2012.12.012.
Enea, G., Porretta, M., 2012. A comparison of 4d-trajectory operations envisioned fornextgen and sesar, some preliminary findings. In: Brisbane, Australia: 28thInternational Congress of the Aeronautical Sciences.
Erkmen, E., Hancer, M., 2015. Linking brand commitment and brand citizenshipbehaviors of airline employees: “The role of trust”. J. Air Transp. Manag. 42,47e54. http://dx.doi.org/10.1016/j.jairtraman.2014.08.001.
Eurocontrol, 2013. Challanges of Growth 2013: Summary Report, pp. 1e36.Retrieved from. http://www.eurocontrol.int/articles/challenges-growth. Lastaccessed: 20-Feb-16.
Eurocontrol, 2015. Standard Inputs for EUROCONTROL Cost-benefit Analyses.Retrieved from. http://www.eurocontrol.int/sites/default/files/publication/files/standard-input-for-eurocontrol-cost-benefit-analyses-2015.pdf. Last accessed:20-Feb-16.
Evans, B., Glendon, A., Creed, P., 2007. Development and initial validation of an
aviation safety climate scale. J. Saf. Res. 38 (6), 675e682. http://dx.doi.org/10.1016/j.jsr.2007.09.005.
Evans, A., Sch€afer, A., 2011. The impact of airport capacity constraints on futuregrowth in the US air transportation system. J. Air Transp. Manag. 17 (5),288e295. http://dx.doi.org/10.1016/j.jairtraman.2011.03.004.
FAA, 1974. Aircraft Ground Handling and Servicing. Advisory Circular. Retrievedfrom. http://www.faa.gov/documentLibrary/media/Advisory_Circular/AC00-34A.pdf. Last accessed: 20-Feb-16.
FAA, 2013. Terminal Area Forecast Summary. Retrieved from. https://www.faa.gov/about/office_org/headquarters_offices/apl/aviation_forecasts/taf_reports/media/TAF_Summary_Report_FY2013-2040.pdf. Last accessed: 20-Feb-16.
Fornell, C., Larcker, D., 1981. Evaluating structural equation models with unob-servable variables and measurement error. J. Mark. Res. 18 (1), 39. http://dx.doi.org/10.2307/3151312.
George, D., Mallery, P., 2012. IBM SPSS Statistics 19 Step by Step. Pearson, Boston.Gianazza, D., Allignol, C., Saporito, N., 2009. An efficient airspace configuration
forecast. In: In 8th USA/Europe Air Traffic Management Research and Devel-opment Seminar. Napa, United States: HAL-01020720.
Hagmann, C., Semeijn, J., Vellenga, D., 2015. Exploring the green image of airlines:passenger perceptions and airline choice. J. Air Transp. Manag. 43, 37e45.http://dx.doi.org/10.1016/j.jairtraman.2015.01.003.
Hair, J., Black, W., Babin, B., Anderson, R., Tatham, R., 2006. Multivariate DataAnalysis, sixth ed. Prentice Hall, Upper Saddle River, NJ.
Hamzah, S., Adisasmita, S., 2015. Aircraft parking stands: proposed model forindonesian airports. Procedia Environ. Sci. 28, 324e329. http://dx.doi.org/10.1016/j.proenv.2015.07.041.
Hart, P., 1994. Teacher quality of work life: integrating work experiences, psycho-logical distress and morale. J. Occup. Organ. Psychol. 67 (2), 109e132. http://dx.doi.org/10.1111/j.2044-8325.1994.tb00555.x.
Hussain, R., Nasser, A.A., Hussain, Y., 2015. Service quality and customer satisfactionof a UAE-based airline: an empirical investigation. J. Air Transp. Manag. 42,167e175. http://dx.doi.org/10.1016/j.jairtraman.2014.10.001.
IATA, 2016. Jet fuel price development. http://www.iata.org/publications/economics/fuel-monitor/Pages/price-development.aspx.
ICAO, 2009. Fuel efficiency and ICAO role during previous crisis. http://www.icao.int/environmental-protection/GIACC/Giacc-4/Presentation_EAD.pdf.
ICC, 1992. Commission on Air Transport-slot Allocation. Document No. 310/391 Rev.2-10Th July 1992. Retrieved from. http://www.iccwbo.org/Advocacy-Codes-and-Rules/Document-centre/1992/Slot-allocation/. Last accessed: 20-Feb-16.
Jenatabadi, H., Ismail, N., 2014. Application of structural equation modelling forestimating airline performance. J. Air Transp. Manag. 40, 25e33. http://dx.doi.org/10.1016/j.jairtraman.2014.05.005.
Jiang, Y., Liao, Z., Zhang, H., 2013. A collaborative optimization model for ground taxibased on aircraft priority. Math. Problems Eng. 2013, 1e9. http://dx.doi.org/10.1155/2013/854364.
Joint Inspection Group, 2008. Product Quality. Bulletin No. 20, pp. 1e4. October2008 Retrieved from. http://www.jigonline.com/wp-content/uploads/2012/03/JIG-Bulletin-20-EI-FAME-update-Oct08.pdf-Public.pdf. Last accessed: 20-Feb-16.
Katos, A., 2010. The influence of information and communication technologies onenabling trade: a cross-country investigation. J. Inf. Technol. Impact 10 (1),15e24.
Kazda, A., Caves, R., 2007. Airport Design and Operation. Elsevier, Amsterdam.Khadilkar, H., Balakrishnan, H., 2012. Estimation of aircraft taxi fuel burn using
flight data recorder archives. Transp. Res. Part D Transp. Environ. 17 (7),532e537. http://dx.doi.org/10.1016/j.trd.2012.06.005.
Ku, E., Chen, C., 2013. Fitting facilities to self-service technology usage: evidencefrom kiosks in Taiwan airport. J. Air Transp. Manag. 32, 87e94. http://dx.doi.org/10.1016/j.jairtraman.2013.07.001.
Lawrence, P., 2009. Meeting the challenge of aviation emissions: an aircraft industryperspective. Technol. Analysis Strategic Manag. 21 (1), 79e92. http://dx.doi.org/10.1080/09537320802557327.
Lee, J., Lukachko, S., Waitz, I., Schafer, A., 2001. Historical and future trends inaircraft performance, cost, and emissions. Annu. Rev. Of Energy Environ. 26 (1),167e200. http://dx.doi.org/10.1146/annurev.energy.26.1.167.
Lewis, T., 2013. Analysis of traffic conflicts in a mixed-airspace evaluation ofairborne separation assurance. In: 2013 aviation technology, integration, andoperations conference. http://dx.doi.org/10.2514/6.2013-4334.
Liedtka, S., 2002. The information content of nonfinancial performance measures inthe airline industry. J Bus Fin Acc 29 (7&8), 1105e1121. http://dx.doi.org/10.1111/1468-5957.00463.
Linz, M., 2012. Scenarios for the aviation industry: a Delphi-based analysis for 2025.J. Air Transp.Manag.22, 28e35. http://dx.doi.org/10.1016/j.jairtraman.2012.01.006.
Lowry, P., Gaskin, J., 2014. Partial least squares (PLS) structural equation modeling(SEM) for building and testing behavioral causal theory: when to choose it andhow to use it. IEEE Trans. Profess. Commun. 57 (2), 123e146. http://dx.doi.org/10.1109/tpc.2014.2312452.
Lu, J., 2014. Investigating factors that influence passengers' shopping intentions atairports e evidence from Taiwan. J. Air Transp. Manag. 35, 72e77. http://dx.doi.org/10.1016/j.jairtraman.2013.11.009.
Marks, A., Rietsema, K., 2014. Airport information SystemsdAirside managementinformation systems. IIM 06 (03), 149e156. http://dx.doi.org/10.4236/iim.2014.63016.
Mazraati, M., 2010. World aviation fuel demand outlook. OPEC Energy Rev. 34 (1),42e72. http://dx.doi.org/10.1111/j.1753-0237.2010.00174.x.

D. Das et al. / Journal of Air Transport Management 57 (2016) 89e100100
Nameghi, E., Ariffin, A., 2013. The measurement scale for airline hospitality: Cabincrew's performance perspective. J. Air Transp. Manag. 30, 1e9. http://dx.doi.org/10.1016/j.jairtraman.2013.03.001.
Narasimhan, R., 2001. The impact of purchasing integration and practices onmanufacturing performance. J. Operations Manag. 19 (5), 593e609. http://dx.doi.org/10.1016/s0272-6963(01)00055-9.
Nava-Gaxiola, C., Barrado, C., 2016. Performance measures of the SESAR Southwestfunctional airspace block. J. Air Transp. Manag. 50, 21e29. http://dx.doi.org/10.1016/j.jairtraman.2015.09.003.
Nikoleris, T., Gupta, G., Kistler, M., 2011. Detailed estimation of fuel consumptionand emissions during aircraft taxi operations at Dallas/Fort Worth InternationalAirport. Transp. Res. Part D Transp. Environ. 16 (4), 302e308. http://dx.doi.org/10.1016/j.trd.2011.01.007.
Nowack, M., Endrikat, J., Guenther, E., 2011. Review of Delphi-based scenariostudies: quality and design considerations. Technol. Forecast. Soc. Change 78(9), 1603e1615. http://dx.doi.org/10.1016/j.techfore.2011.03.006.
Pejovic, T., Noland, R., Williams, V., Toumi, R., 2009. A tentative analysis of theimpacts of an airport closure. J. Of Air Transp. Manag. 15, 241e248. http://dx.doi.org/10.1016/j.jairtraman.2009.02.004.
Pham, V., Tang, J., Alam, S., Lokan, C., Abbass, H., 2010. Aviation emission inventorydevelopment and analysis. Environ. Model. Softw. 25 (12), 1738e1753. http://dx.doi.org/10.1016/j.envsoft.2010.04.004.
Podsakoff, P., MacKenzie, S., Lee, J., Podsakoff, N., 2003. Common method biases inbehavioral research: a critical review of the literature and recommendedremedies. J. Appl. Psychol. 88 (5), 879e903. http://dx.doi.org/10.1037/0021-9010.88.5.879.
Poret, M.D., O'Connell, J., Warnock-Smith, D., 2015. The economic viability of long-haul low cost operations: evidence from the transatlantic market. J. Air Transp.Manag. 42, 272e281. http://dx.doi.org/10.1016/j.jairtraman.2014.11.007.
Rao, K., Selladurai, V., Saravanan, R., 2009. TRIZ tool for optimization of airportrunway. IFIP Adv. Inf. Commun. Technol. 304, 80e88. http://dx.doi.org/10.1007/978-3-642-03346-9_9.
Ribeiro, S.K., Kobayashi, S., Beuthe, M., Gasca, J., Greene, D., Lee, D.S., Muromachi, Y.,Newton, P.J., Plotkin, S., Sperling, D., Wit, R., Zhou, P.J., 2007. Transport and itsinfrastructure. In: Metz, O.R., Davidson, P.R., Bosch, R., Dave Meyer, L.A. (Eds.),Climate Change 2007: Mitigation. Contribution of Working Group III to theFourth Assessment Report of the Intergovernmental Panel on Climate Change[B. Cambridge University Press, Cambridge, United Kingdom and New York, NY,USA.
Roosens, P., 2008. Congestion and air transport: a challenging phenomenon. Eur. J.Transp. Infrastructure Res. 8 (2), 137e146.
Santos, M., Antunes, A., 2015. Long-term evolution of airport networks: optimiza-tion model and its application to the United States. Transp. Res. Part E Logist.Transp. Rev. 73, 17e46. http://dx.doi.org/10.1016/j.tre.2014.10.016.
Sarkar, A., 2012. Evolving green aviation transport system: a hoilistic approah tosustainable green market development. AJCC 01 (03), 164e180. http://dx.doi.org/10.4236/ajcc.2012.13014.
Schlumberger, C., 2012. Air transport and energy efficiency, 38. Transport Papers -World Bank Group. Retrieved from. http://documents.worldbank.org/curated/en/2012/02/16226814/air-transport-energy-efficiency. Last accessed: 20-Feb-16.
Sekaran, U., 2006. Research Methods for Business: a Skill Building Approach (,fourth ed. Wiley, New York.
Simaiakis, I., Khadilkar, H., Balakrishnan, H., Reynolds, T., Hansman, R., 2014.Demonstration of reduced airport congestion through pushback rate control.Transp. Res. Part A Policy Pract. 66, 251e267. http://dx.doi.org/10.1016/j.tra.2014.05.014.
Simi�c, T., Babi�c, O., 2015. Airport traffic complexity and environment efficiencymetrics for evaluation of ATM measures. J. Of Air Transp. Manag. 42, 260e271.http://dx.doi.org/10.1016/j.jairtraman.2014.11.008.
Tsai, W., Chang, Y., Lin, S., Chen, H., Chu, P., 2014. A green approach to the weightreduction of aircraft cabins. J. Air Transp. Manag. 40, 65e77. http://dx.doi.org/10.1016/j.jairtraman.2014.06.004.
Upham, P., Thomas, C., Gillingwater, D., Raper, D., 2003. Environmental capacity andairport operations: current issues and future prospects. J. Air Transp. Manag. 9(3), 145e151. http://dx.doi.org/10.1016/s0969-6997(02)00078-9.
Vaaben, B., Larsen, J., 2015. Mitigation of airspace congestion impact on airlinenetworks. J. Air Transp. Manag. 47, 54e65. http://dx.doi.org/10.1016/j.jairtraman.2015.04.002.
Wang, S., 2014. The moderating effects of involvement with respect to customerrelationship management of the airline sector. J. Air Transp. Manag. 35, 57e63.http://dx.doi.org/10.1016/j.jairtraman.2013.11.006.
Wang, S., Ngamsiriudom, W., 2015. Celebrity livery featured aircraft, the MonekiNeko (fortune cat) of airlines. J. Air Transp. Manag. 42, 110e117. http://dx.doi.org/10.1016/j.jairtraman.2014.09.005.
Yoder, T., 2007. Development of Aircraft Fuel Burn Modeling Techniques with Ap-plications to Global Emissions Modeling and Assessment of the Benefits ofReduced Vertical Separation Minimums. Master's thesis. Massachusetts Insti-tute of Technology.
Yu, J., Cooper, H., 1983. A quantitative review of research design effects on responserates to questionnaires. J. Mark. Res. 20 (1), 36. http://dx.doi.org/10.2307/3151410.
Zanni, A., Ryley, T., 2015. The impact of extreme weather conditions on long dis-tance travel behaviour. Transp. Res. Part A Policy Pract. 77, 305e319. http://dx.doi.org/10.1016/j.tra.2015.04.025.
Zhou, H., Jiang, X., 2015. Research on taxiway path optimization based on conflictdetection. PLOS ONE 10 (7), e0134522. http://dx.doi.org/10.1371/journal.pone.0134522.
Zillies, J., Kuenz, A., Schmitt, A., Schwoch, G., Mollwitz, V., Edinger, C., 2014. Windoptimized routing: an opportunity to improve european flight efficiency?. 2014Integrated Communications. In: Navigation and Surveillance Conference (ICNS)Conference Proceedings, X3-1-X3-9. http://dx.doi.org/10.1109/icnsurv.2014.6820029.