Embed Size (px)
Citation preview
IOSR Journal Of Humanities And Social Science (IOSR-JHSS)
Volume 19, Issue 9, Ver. VI (Sep. 2014), PP 01-13 e-ISSN: 2279-0837, p-ISSN: 2279-0845.
www.iosrjournals.org
www.iosrjournals.org 1 | Page
Analyzing the Effects of Sectoral Public Spending On Human
Development in Nigeria: Evidence from Panel Data
Richardson Kojo Edeme Department of Economics, University of Nigeria, Nsukka
Abstract: This paper analyzed the effects sectoral public spending on human development in Nigeria using
data from 20 states for the period1999-2012. Data on each state were generated from various issues of the
Accountant-Generals’ Reports, Central Bank of Nigeria Annual Report and Statement of Accounts and United
Nations Development Programme Reports. For robustness of the analysis, total, recurrent and capital public
spending on education, health, agriculture, rural development, energy, housing, environmental protection and
portable water resources are employed as predictors of human development. The result depicted that there is a
positive functional relationship between education, health, agriculture, rural development, energy, housing,
environmental protection and portable water resources expenditure and human development; an indication that
expenditure on these sectors fosters human development. Beside, the efficacy of education, health, agriculture, rural development and portable water in improving human development is greater than that of energy, housing
and environmental protection. A further analysis of recurrent and capital expenditures reveals that recurrent
and capital expenditure has both positive and negative effects on human development across states and period
under consideration. However, the relative effect of capital expenditure in improving human development was
greater than that of recurrent expenditure.
Keywords: Public spending, Human development, Panel data, least square method
I. Introduction
One of the basic challenges facing most developing countries is how to accentuate human development. It in recognition of the importance that international community decided on a target year of 2015,
when all countries should achieve specific targets in health, poverty and inequality reduction, education, water
and sustainable environment, housing as well as food security. Towards the attainment of these goals
governments in both developed and developing countries have been carrying out expenditure on different
sectors. In Nigeria, government at the federal and state levels have been playing prominent roles in improving
human development to such an extent that one should expect a positive correlation between progress in
expenditure in these sectors and human development expenditure. This optimism may, however, be suspected
because despite growth in public spending on different sectors, the pace of human development has been slow
and so far its growth has been rather unstable and erratic. For instance, human development index (HDI) grew
positively by 0.3 percent in 1987 but declined to 0.1 percent in 1988. In 1992 and 1996 it grew negatively by -
0.2 percent and -2.7 percent respectively. For these years, government expenditure grew by 4.7, 8.4 and 5.8
percent respectively. Although, there was an increase in per capita income, but this increase did not manifest in improvement in the quality of life of the citizens as there is high incidence of poverty, unemployment and low
literacy rate and life expectancy (CBN 2010). This is more pronounced across zones in Nigeria where human
profile shows that a great disparity exist in human development and compares with data on inequality measure,
gender empowerment measure, gender empowerment measure, gender development measure, human poverty
index and human development index as shown in Table 1 below.
Table 1: Human Development Summary Statistics in Nigeria, by Zones Zones Human
Development Index
Value
Human Poverty
Index
Gender
Development
Measure
Gender Empowerment
Measure
Inequality
Measure
South South 0.573 26.61 0.575 0.251 0.41
South East 0.471 26.07 0.455 0.315 0.38
South West 0.523 21.50 0.507 0.285 0.48
North East 0.332 48.90 0.250 0.118 0.42
North West 0.420 44.15 0.376 0.117 0.44
North Central 0.490 34.65 0.478 0.244 0.49
Source: Nigeria Human Development Report (NHDR) 2008-2009
Analyzing the Effects of Sectoral Public Spending On Human Development in Nigeria: Evidence from
www.iosrjournals.org 2 | Page
Human development which is broadly viewed as a process of expanding people‟s choice and
opportunities open to people is to improve living standard as well as the welfare of the citizens. These choices
can be infinite and changes over time and space. However, the three most important critical and socially
valuable from among these choices are the choice to lead a long and healthy life, the choice to acquire
knowledge and be educated and have access to resources needed for a decent level of living as a nation develops
(UNDP 2001).In essence, human development should improve the availability and widen the distribution of
basic life sustaining needs such as decent living, longer life, personal protection; improved living standard and environmental sustainability which ultimately improve well-being through the provision of more jobs, better
education and other humanistic values (Goulet 1991, UNSRID 1992 Todaro and Smith 2011). It could be
argued from the above therefore that per capita income is a necessary but not a sufficient measure of human
development, but enhanced quality life as manifested in higher educational attainment, easier access to
employment and healthier life, food security and access to portable water, affordable housing, sustainable
environment and greater life expectancy. In attaining all these, public spending has a great role to play (Sen
1985; 2000, Seers 1989, Anand and Ravallion 2003). Although empirical findings have shown that there is a
contemporaneous transformation of social, economic and environmental sectors that impacts on human
development, studies differ on which services sectors and components are most influential in human
development. Beside Easterly and Levine (1997) opine that human development efforts in a country should
reflect a country‟s specific conditions especially if such a country possesses large federating units and are heterogeneous and where the various efforts to improve the well-being of the citizens or accentuate poverty may
differ according to expenditure ability and priority, environmental, ethnic and political influences. Therefore, if
human development efforts of a country are to be encompassing and useful for the purpose of internal policies
aimed at achieving sustainable development, the impact of public spending on human development at the sub-
national levels should be assessed. And even though aggregate analysis is a useful tool, it offers little help in
policy initiatives. Yet there have not been such study at the state level in Nigeria. Moreover, the traditional
approaches to the measurement of human development have been outcome of attentions employed in defining
the development process. Traditionally, development was conceived as the capacity of a national economy
whose initial economic condition has been more or less static for a long time, to generate and sustain increases
in its national product (Todaro and Smith 2011). Adopting this approach, it was discovered that a significant
number of developing countries did not attain enviable improvement in human development. As for those that
recorded significant increase, it was also observed that the well-being of majority of the citizens remained for the most part, remain unchanged, and in some cases actually worsened (CBN 2000; World Bank 2000, Hagha
2001, Alayande 2003, Orubu 2003). In view of this, there has been resurgence of interest in the relationship
between public spending and human development for there can be little doubt about the value of higher real
income in opening up possibilities of living decent lives and improved well-being that are not available at lower
levels of income.
In light of the above, this paper presents a spatial analysis of the effects of sectoral public spending and
how much they have translated into improving human development in Nigeria. This study contributes to the
pool of literature in several ways. First we use a new data set that significantly extends the coverage of sectors,
spending components and states. This is because we employed total, recurrent and capital expenditure on
education, health, agriculture, rural development, energy, housing, environmental protection and portable water
resources as predictors of human development. Beside, previous specific, cross–sectional and panel studies used different countries and they have been limited in depth or in breadth. By taking into consideration many sectors
and expenditure components in our analysis, we offer additional depth and robustness to the analysis.
Second, this study used panel data. The use of panel avails us the opportunity of exploring both cross–
sectional and time–series variation in sectoral public spending and its impact on human development over the
13-year period. We therefore control for the effects of the variables in our regression with both the fixed effects
and random effects model. Beside, our estimates are based on pool (panel) least squares (PLS) regression model
applied to and calibrated for 20 states in Nigeria. Thirdly, we adopt a new measure of human development, the
human development index (HDI) because of its reflection of the inadequacy of other measures. A study at the
state level is crucial not only because it is necessary to substantiate the contributions or efforts of the state
governments in human development but also because such a study is apt to provide policy guides relating to
prioritization and review of the pattern and distribution of public spending in human development in Nigeria. The outcome of this study therefore, will help design strategies and draw inferences that could form policies,
strategies and interventions for improving human development throughout the country.
II. Theoretical Framework Human development finds its theoretical underpinnings in Sen (1985) capabilities theory. This theory
considers a person‟s capability to have varying functioning vectors and to enjoy the corresponding well-being
inherent in the growth process. This perspective have shifted the analysis of development to the vector of not
Analyzing the Effects of Sectoral Public Spending On Human Development in Nigeria: Evidence from
www.iosrjournals.org 3 | Page
only attributes (as in the more traditional utilitarian) or even the original basic needs view of human welfare, for
instance, income, education, health, to the vector of possible opportunities available to individuals in a particular
country. Naturally, there is a link between the two and these opportunities are affected by certain attributes of
the individual. For example, a starving or uneducated person would have fewer choices to economic
opportunities and benefits than a healthy and educated person. Yet the capability approach goes far beyond
assessing individual efforts to acquire these benefits. Rather, it considers the efforts of government in enhancing
or influencing individual‟s ability to acquire more opportunities which the development process provides. Infact, Anand and Kanbur (1993) found that the most effective means of human development flows through
government budgetary expenditure, central or local. However, the strengths of this effect depend on the nature
of expenditure, sector and component. In this regard, the government must identify priority sectors that have the
highest potential for human development improvement. For instance, as education and health improve and
become more broadly based, low income people are better able to seek out economic opportunities. Therefore,
public spending on human development should be distributed predominantly to low income groups and areas
since it is here that the highest marginal impact will be had (Ranis and Stewart 2003). The development
literature has highlighted the importance of human well-being in the development process. In essence, the
benefits of a sustained growth process are expected to trickle down to the people in form of longer life, more
jobs and other numerous economic and non-economic opportunities. Therefore, access of the people to basic
amenities such as portable water, health care facilities, quality education, affordable and decent housing and sustainable environment are fundamental to an enhanced quality of life which is a manifestation of human
development. At policy level, in view of the low level of human development and because of the critical role of
human development in the growth process of an economy, much responsibility is often placed on the
government to spend on some sectors to promote human development. The major sectors or areas which
spending is often necessity are education, health, agriculture, rural development, energy, housing, environmental
protection, portable water resources, transport and communication (UNDP 2006). Public spending represents a
form of government intervention designed to stimulate the economy through correction of market failure so as
to redistribute resources equitably, promote economic growth and improve human welfare. The essence of
public expenditure therefore stems from the fact that the functioning of the market, by itself activate the
signaling, response and mobility of economic agents to achieve efficiency in both static (allocative efficiency)
and dynamic (shift in production frontiers) terms ( Musgrave and Musgrave 1984, Arndt 1998). For any Pareto-
efficient allocation, there exist a set of prices that support that allocation as market equilibrium, but each with a different distribution of welfare. The issue is to decide which Pareto-efficient allocation conforms to societal
notion of distributive justice. Apparently, the market cannot do it because the social welfare function is
obviously not a market construct. Therefore, it must evolve from government intervention efforts (Rao 1998,
Bathia 2004). The theorem of welfare economics is further supported by the government-led growth or so-called
demand-led growth theory. The government-led growth theory argues that government spending is used, both as
a stimulant for capital investments and a source of needed social welfare in the society. Hence, the theory
supports government spending in public goods where such expenditure further supports investment in public
goods, which in turn enhances productivity growth along with the supply side improvement. The theory,
however, argues that demand for goods and services must be sustained at high levels, and this requires public
expenditure (Robert 2001). It is also important to note that there have been government failures due to
intervention. Infact, Neo-classicists such as Bos (1986) Veron (1987), Swansan and Worlde – Semait 1989, Van de Walle (1989) opine that government involvement in socio-economic activities constitutes a barrier to the
economic development process. On the contrary, there is evidence that government intervention has been
growth-enhancing in many Sub-Saharan Africa countries. Much of the economic growth of the past generation
in these countries have depended on and benefited from high levels of public spending on some services,
including high technology and education. It should be noted that public expenditure is equally needed to provide
an enabling environment for the private sector to strive. Much of the impact of public expenditure on the
economy can be viewed as a means of providing infrastructure for economic growth; in the broadest sense–
social infrastructure like education and health and physical environment like roads, energy, water resources,
environmental protection and rural development. For the market to operate smoothly to create growth and
improve well-being these services and infrastructure are required and yet in most cases, it is beyond the capacity
of the private sector to provide. Hence, it is usually the government who provides for these so as to guarantee well-being in the society. This is the crucial link between public expenditure and human development.
Theoretically, public expenditure should promote human development for a variety of reasons. First, human
development is an end itself; a means to achieving freedom for all and opening people‟s capabilities and makes
life more abundant. It is also a means of improving productivity, reducing reproduction and lowering the desired
family size. Besides, it reduces poverty and contributes to a healthy civil society, political participation and
reduces civil disturbances. Indeed, it is good for the social, economic and physical environment development of
the economy (Streeten, 1994). Of the various effects of expenditure in these areas however, those relating to
Analyzing the Effects of Sectoral Public Spending On Human Development in Nigeria: Evidence from
www.iosrjournals.org 4 | Page
capital expenditure appear to be most paramount. However, growth in recurrent expenditure has effect on
human development since they are capable of reducing access to improved human development (Emini and
Fofack 2004).
2.2 Existing Literature
The nature of impact of public spending on human development is a recurring study in literature. The
traditional analysis in Nigeria focuses on capital spending while both capital and recurrent expenditure is carried out on different sectors of the economy to engender human development. But in recent years, following the rise
in recurrent spending at the detriment of capital spending components, theoretical research has turned to the
analysis of recurrent-capital effects on human development especially when such spending is carried out by the
federal, state and local government. Chakraborthy (2003) explore the relationship between capital health and
education spending and human development in panel data involving 14 developed and developing countries.
Not surprising this author find that capital spending has a positive impact on human development. Shantayanan,
Vinaya and Zon (2004) used data from 15 developing countries for 6 years to show that an increase in the share
of current expenditure has positive and statistically significant growth effect on human development.
Conversely, the relationship between the capital component of expenditure and human development is negative.
Thus, seemingly productive expenditure could become unproductive. Diamond (1990) based on the study of 38
developing countries found that capital expenditure on education have positive impact on human development and exerted its influence on poverty reduction. Bigsten and Levin (2000) posit that the compositions of
government expenditure are critical determinants in human development. They are also of the view that if
government is undertaking fiscal reforms, three types of impact should be considered. First, when relative prices
and factor income change, income distribution and poverty will change. Second, the composition of government
expenditures affects sectoral productivity and hence human development. Third, change in public expenditure
on services such as education and health have an impact on household‟s well-being. In line with this and based
on simulations with econometric model of the Swedish thirteen different public expenditure, Dahlberg and
Jakobsson (1997) shows that the effects of an increase in capital education, agriculture and rural development
spending on human development are found to differ considerably depending on which sector expenditure is
expanded. In similar vein, Dorosh (1996) found that change in relative prices and factor incomes following
reduced government current expenditures hurt mainly urban households, due to the bias of government
employment. While protecting urban households from a short-term income loss, this incidentally has a long-term negative impact on human development. Diamond (1990) study focused on public education capital
expenditure in developed countries for 1989-1991. The study was based on a 1990/1991 survey of 38 countries
and employed planned budget data reported directly by the countries. A cross-sectional approach was used to
explain the effect of public expenditure on human development. A study of the Indonesian economy and
applying SAM, four classes of government recurrent expenditure on respectively education and health wages
and salaries on other goods and services, and household transfer; and nine classes of government capital
expenditure on agriculture, industry and mining, energy, transport and tourism, education, health, housing and
water works, general services and other activities have been identified (Keunig and Thorbecke 1999). Schultz
(1980) asserts that capital spending on education has a significant effect on human development. Reinikka and
Collier (2001) used data from a series of household surveys in Uganda from 1992-1999 and found that
education, rural development and agriculture have a major positive impact on human productivity and improving rural poverty, which are connected to human development. In the same vein, Fan, Zhang and Rao
(2003), adopting different methods and different country data for 1992, 1995 and 1999, analyzed the effect of
capital public spending on agriculture and rural development on human development in Uganda. They found
that expenditure on agriculture and rural development impacts positively on human development. Dao (1995),
using cross-section of countries estimated the effect of disaggregated government expenditure on human
development and conclude capital spending is hampered where which make government spending less efficient.
Also Feyzioglu, Swaroop and Zhu (2000) presented result based on disaggregated government expenditure
variables using panel data and asserts that when resources are transferred for recurrent purposes, there may be a
slowdown in the improvement of human development in the society, from distributional perspective. Another
strand in the literature examines the relationship between public spending and human development. At the
International Food Policy Research Institute some studies have been conducted along this theme for different countries. These studies are Fan, Hazelland and Thorat (2000) on India; Hao and Fan (2001) on Vietnam; Fan,
Zhang and Zhang (2002) on China and Jitsachon; Methakunavut (2003) on Thailand; Jaff (2003) on Cameroon;
Wildlife (2006) for Cuba. Studies have assessed the impact of public expenditure on economic and
environmental sectors variables on human development. For instance, using rural areas in Indian, Fan, Zhang
and Zhang (2000) found government expenditure on rural infrastructure and health to have a visible impact on
human development. For their study in China in 2002, they found expenditure on education to have the largest
impact on human development and poverty reduction. A major profound agreement of these studies is that
Analyzing the Effects of Sectoral Public Spending On Human Development in Nigeria: Evidence from
www.iosrjournals.org 5 | Page
public expenditure has influenced human development of these countries. These studies along with some others
harp on the need for the government to play greater role in fostering human development through public
expenditure However, the extent of influence differs from country to country. In Nigeria, studies on the effect of
capital and recurrent expenditure and human development have been conducted with varying outcomes. For
instance Okojie (1995) asserts that capital spending education and health raises per capita GNP and reduces
poverty. Specifically, public expenditure on health results in tremendous savings due to less illness, longer life
expectancy and increased vitality. Similarly, Grammy and Assane (1996) showed that capital spending on education promotes growth in per capita income. The outcome of the studies reveals that education substantially
increases the potentials of women and their productivity. Ekpo (1996) using data for the period 1960-1992
found that expenditure on certain components of the economy is low while expenditure on well-being enhancing
variables is minimal. Aggregating capital and recurrent expenditure, the study conclude that the model of
development, which emphasize balanced growth, redistribution with growth and the provision of basic needs be
adopted in government spending. In a review of the trends of public expenditure pattern in Nigeria, the
International Monetary Fund (IMF) (2006) identify directions and instrument of restructuring government
expenditure patterns at both macro and sectoral levels and assesses the impact of government reform efforts
since 2001. The outcome of the study is that states‟ capital budgets are often unrealistic. In addition, states face
an acute shortage of technical and human capacity to design and implement reforms. While empirical evidence
here is spottier, theory however suggests that a decentralized locally accountable government system may have advantage in resource allocation and service delivery.
III. Data And Methodology The study use variables from20 states systematically selected from the 6 geo-political zones in Nigeria.
The states are: Bayelsa, Delta, Edo and Cross River (South-South Zone) Osun, Ondo, Ogun and Ekiti (South-
West Zone) Kano, Jigawa and Kaduna (North-West Zone); Taraba, Gombe and Bauchi (North-East Zone);
kwara, Plateau and Benue (North-Central Zone); Abia, Ebonyi and Enugu (South-East Zone). The data used
in this study are secondary data obtained from the selected states and various other official sources. The data
extends from 1999 to 2012. Actual total, recurrent and capital expenditure on education, health, agriculture, rural development, energy, housing, environmental protection and water resources are employed. The choice of
these sectors is borne out of the fact that they represent services which are essential in promoting healthier
living, high literacy rate, food security and decent housing, combat inequality, reduce poverty, create jobs and
improve human welfare. Beside, empirical literature primarily supports the choice of these sectors because they
are key expenditures that can be used to transfer the benefits of economic development to the economically
deprived individuals in the society and improve human capabilities (Anand and Ravallion 1993, Jorgenson
1998, Romer and Romer, 1999, Jha 2000, Chakraborty 2003, Rana 2003, Liman 2004, UNDP 2004, NISER
2005, Anderson, de Ranzio and Levy 2006, Montanaso 2006, World Bank 2007). Human development is
proxied by human development index (HDI). The choice of HDI is borne out of the fact that it represents the
average condition of living of all people in a country, zone or state irrespective of sex. It comprises a wider
definition of well-being beyond gross domestic product (GDP) per capita or per capita income and other
measures of human development and gives a less skewed picture of distribution than that presented by GNP per capita. Data for the study were generated from various Accountant Generals‟ Report of the selected States,
Various Years. Central Bank of Nigeria Annual Report and Statement of Accounts and United Nations
Development Programme (UNDP) Human Development Reports (Nigeria), Various Years.
3.1 Model Specification
The model for this study follows Chakraborty (2003) with an extension to reflect the nature of data
used in our analysis. The functional relationship between government expenditure, recurrent and capital
expenditure can be stated separately as:
HDX = f(ED, HT, AG, RD, EN, HS, EP, WR) ---------------------------------- (1)
HDX = f (RE, RH, RA, RR, RN, RH, RP, RW) ---------------- -------------- (2)
HDX = f (CE, CH, CA, CR, CN, CH, CP, CW) ------------------------------- (3)
In panel form, the above relationships can be re-estimated linearly as:
HDXit = α1 + α2 ED2it + α3 HT3it + α4 AG4it + α5 RD5it + α6EN6it + α7HS7it + α8EP8it +α9WR9it + Uit
…………………………………………………………………………………. (4)
HDXit = β1 + β2RE2it + β3RH3it + β4RA4it + β5 RR5it + β6RN6it + β7RS7it + β8RP8it + β9RW9it + Uit
……………………………………………… (5)
HDXit= φ1 + φ2CE2it + φ3CH3it + φ4CA4it + φ5 CR5it +φ6CN6it + φ7CS7it + φ8CP8it + φ9CW9it + Uit
--------------------------------------------------------- (6)
A- priori, α’s and φ’s are parameters > 0; while β’s ≥ 0
Analyzing the Effects of Sectoral Public Spending On Human Development in Nigeria: Evidence from
www.iosrjournals.org 6 | Page
Taking into consideration the time and space dimension of our data, the pooled OLS models are
estimated using the principal alternatives: Fixed effects model (FEM) and Random effects model (REM). In
FEM, the individuality of each state or each cross-sectional unit is taken into consideration. Thus, we allow the
intercept vary for each state and still assume that the slope coefficients are constant across states. For the fixed
effect therefore, we employ dummies to re-estimate equations (4), (5) and (6) to obtain their corresponding
LSDV model as:
HDXit= λ1 + λ2D2i + λ3 D3i + --- + λ19D19 + α2 ED2it + α3HT3it + α4 AG4it + α5 RD5it + α6EN6it + α7HS7it + α8EP8it
+ α9WR9it + Uit ……………………….. (7)
HDXit = δ1 + δ2D2t + δ3D3i + ---- + δ19D19 + β2RE2it + β3RH3it + β4RA4it + β5RR5it + β6RN6it + β7RH7it + β8RP8it +
β9RW9it + Uit …………………………………….. (8)
HDXit = 1 + 2D2i + 3D3it + ---+19D19 + φ2CE2it + φ3CH3it + φ4CA4it + φ5CR5it + φ6CN6it + φ7CH7it + φ8CP8it + φ9CW9it + Uit ……………………………………... (9)
By implication, λ1 is the intercept of each state while α2, α3, α4 --- α19, the differential intercept coefficients. On
the contrary, the random effects model can be estimated by assuming the intercept of the model to be a random
variable. Therefore, rather than treating α1i, β1i and φ1i as fixed in equation (4), (5) and (6); they are assumed to
have a mean value of α1, β1 and φ1 respectively. The intercept value for each state can therefore be written as:
αii = α1 + e1 --------------------------------------------------- (10)
βii = β1 + e1 --------------------------------------------------- (11)
φii= φ1 + e1 --------------------------------------------------- (12)
where ei is the random error term with a mean value of zero and variance of δ2e. Substituting equations (10),
(11) and (12) into equations (4), (5) and (6) respectively gives:
HDXit = α1 + α2 ED2it + α3 HT3it + α4 AG4it + α5 RD5it + α6EN6it + α7HS7it + α8EP8it +α9WR9it + ƒit
……………………………………………………… (13)
HDXit = β1 + β2RE2it + β3RH3it + β4RA4it + β5RR5it + β6RN6it +β7RS7it + β8RP8it + β9RW9it + ƒit
……………………………………………….. (14)
HDXit = φ1 + φ2CE2it + φ3CH3it + φ4CA4it + φ5CR5itt + φ6CN6it + φ7CS7it + φ8CP8it + φ9CW9it + ƒi
…………………………………… (15)
with ƒit = ei + Uit; ei as the cross-section or individual-specific error component and Uit combined
time series and cross-section error component
where i = 1, 2, 3, --- 20 (ith cross-sectional unit) t = 1, 2, 3, --- 13 (ith period)
i denotes cross-sections and t denotes the time-periods.
If the null hypothesis of no fixed-effects is rejected by the data, we can estimate the null hypothesis of fixed
effects. To further test for the appropriateness of the fixed-or random-effects model, we performed the Hausman
Specification Test. If the models are however, specified correctly and if εi is uncorrelated with the explanatory
variables, then the two estimates should not differ significantly. In this study, however, we produce estimates of
the two methods as well as the specification test. In classical regression analysis, R2 is employed as a popular
measure of goodness of fit. Since fixed-effects model can be estimated by OLS using dummy variables, we can
evaluate the goodness of fit by reporting its R2. However, similar measure cannot be derived for the random
effects model. Rather, we report another measure calculated as the correlation squared of the predicted
dependent variable. If it is calculated from the predictions of the dependent variable in equations (4) - (6), it is referred to as R
2 (Overall). If it is calculated from the predictions of the deviations of the dependent variable as
in equations (7) – (9), it is known as R2 (within). For the fixed effects model, R2 (within) is also referred to as
ordinary R2. The empirical results of this study have been obtained with the use of E- Views (10.0 versions)
computer packages of econometric data analysis and estimation.
IV. Empirical Results And Interpretation Although, in some estimates, there are no systematic difference between the two models in terms of
goodness of fit, the R2 overall is consistently higher for the fixed effects model in comparism with the OLS
models. Based on the model specification tests it is evident that the assumption of no individual effects, whether
fixed or random, is not supported in the data. In addition, it is clear that ignoring the panel nature of the data, as in OLS will result in appropriate estimates. For comparative purpose, the results of the fixed effects and OLS
models were presented.
Analyzing the Effects of Sectoral Public Spending On Human Development in Nigeria: Evidence from
www.iosrjournals.org 7 | Page
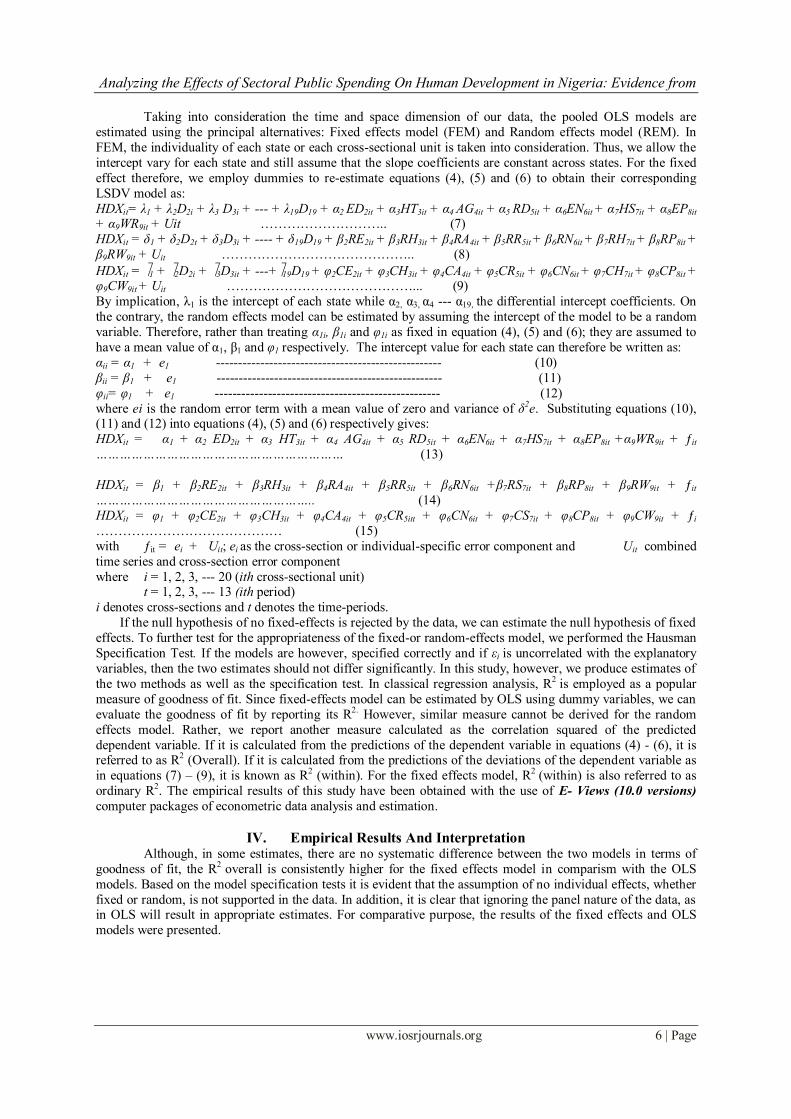
Table 1: The impact of public spending on Human Development State Year Variable
Fixed OLS Fixed OLS Fixed OLS
Constant 0.238
(1.68)
0.225
(0.14)
Kaduna -0.015 -0.022 1999 ED 0.034
(2.54)**
0.030
(1.04)*
Kebbi 0.026 0.019 2000 HT 0.025
(1.48)*
0.009
(0.61)*
Jigawa 0.213 0.201 2001 AG 0.021
(1.10)
0.005
(0.06)
Adamawa 0.216 0.215 2002 RD 0.018
(1.02)*
0.000
(0.19)
Bauchi 0.187 0.049 2003 EN 0.010
(0.24)
0.002
(0.19)
Borno 0.141 0.140 2004 HS 0.003
(0.02)
0.002
(0.01)
Niger 0.236 0.284 2005 EP 0.009
(1.02)*
0.007
(0.68)*
Kogi 0.207 0.203 2006 WR 0.0013
(1.02)*
0.001
(0.48)
Plateau 0.109 0.100 2007
Anambra 0.156 0.147 2008
Imo 0.205 0.208 2009
Enugu 0.426 0.424 2010
Delta 0.195 0.188 2011
Akwa-Ibom 0.296 0.289 2012
Cross River 0.466 1.440
Edo 0.458 0.404
Oyo 0.329 0.311
Lagos 0.287 0.217
Ondo 0.205 0.200
Ekiti 0.198 0.192
R2 (Ordinary) 0.79
R2 (Overall) 0.72 0.66
Note: The figure in parenthesis denotes t-statistic; *Significant at 1 percent level**Significant at 5 percent level
Source: Authors‟ Calculations.
The result in Table 1 indicates that variation in human development across states and period can be
explained by sectoral public spending. The coefficient of the each of the explanatory variables shows that public
spending on education, health, agriculture, rural development, energy, housing, environmental protection and
portable water resources have positive functional relationship with human development. In relative terms, an
increase of N1 million per education spending will increase human development by 0.034 percentage point.
Similarly, a unit (that is N1 million) increase in health expenditure can lead to a significant improvement in
human development equally 0.025 percentage point. The coefficient of agriculture expenditure portrays that if expenditure increases by N1 million, human development increases by 0.021 percentage point; an increase in
rural development expenditure by N1 million increases human development by 0.018 percentage point. Also, an
increase in energy, housing, environmental protection and water resources increases human development by
0.10, 0.003, 0.009 and 0.001 percentage points respectively. In terms of magnitude, education has the highest
impact. A proportionate increase in expenditure in other sectors may help improve human development, though
to a much smaller magnitude as compared to education that has the loudest impact, although the coefficient is
not statistically significant. In all, the positive relationship between education, health, agriculture, rural
development, energy, housing, environmental protection and water resources expenditure and human
development is suggestive that public expenditure encourages human development, although public expenditure
has not contributed significantly to human development over time. This is evidence in the low coefficients of the
explanatory variables. The low coefficients may be due to multicollinearity problem. Therefore, to overcome
this, we estimated a panel least square with white hetroskadascity-standard errors in which we regressed between human development and combined education, health, agriculture, rural development, energy, housing,
environmental protection and water resources expenditure.
Analyzing the Effects of Sectoral Public Spending On Human Development in Nigeria: Evidence from
www.iosrjournals.org 8 | Page
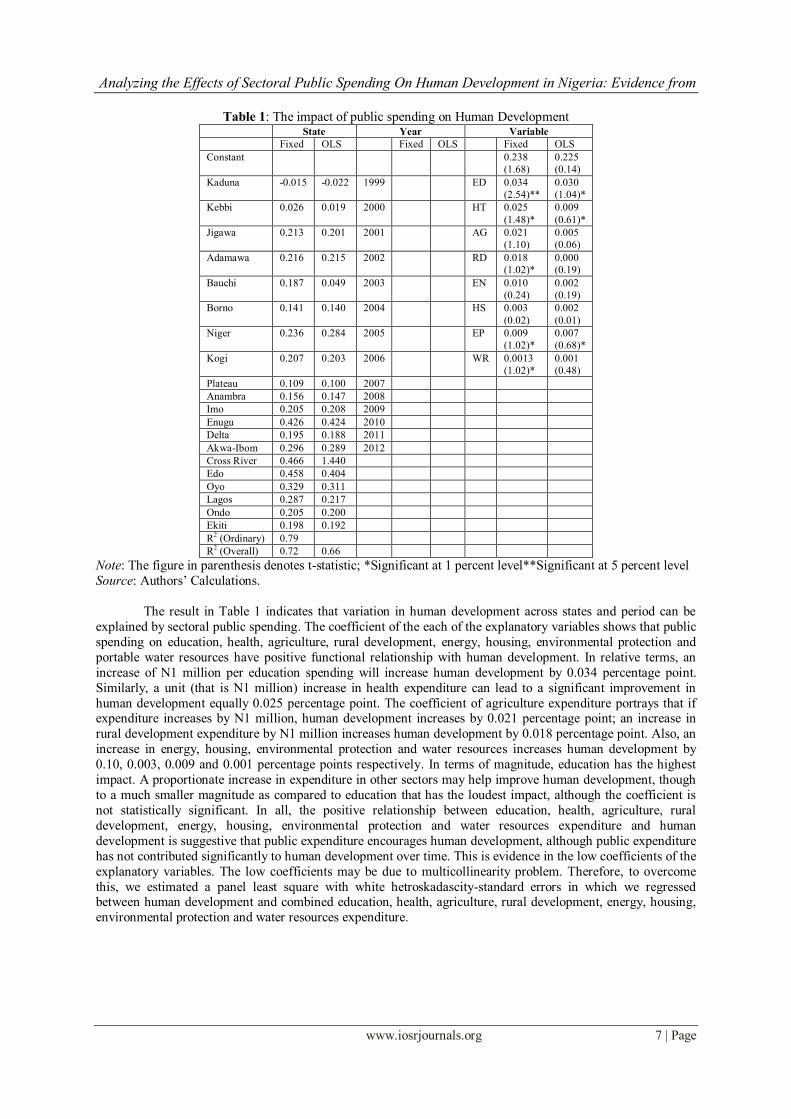
Table 2: The impact of combined Education, Health, Agriculture and Rural Development, Energy, Housing,
Environmental Protection and Water Resources spending on Human Development State Year Variable
Fixed OLS Fixed OLS Fixed OLS
Constant Combined ED, 0.246
(9.72)**
0.177
(2.06)*
Kaduna -0.058 -0.085 1996 0.039 0.033 HT, AG, RD,
Kebbi -0.030 -0.042 1997 -0.245 -0.256 EN, HS, EP 0.175
(1.95)*
0.067
(0.48)
Jigawa -0.039 -0.036 1998 -0.063 -0.092 And WR
Adamawa -0.017 -0.029 1999 -0.018 -0.088 expenditure
Bauchi -0.146 -0.156 2000 0.002 0.002
Borno -0.262 -0.261 2001 0.092 0.088
Niger -0.246 -0.258 2002 0.178 0.172
Kogi 0.027 0.012 2003 -0.045 -0.056
Plateau -0.066 -0.092 2004 0.014 0.019
Anambra -0.269 -0.300 2005 -0.111 -0.087
Imo 0.068 0.055 2006 -0.103 -0.114
Enugu -0.195 -0.222 2007 -0.009 -0.008
Delta 0.207 0.200 2008 0.090 0.082
Akwa-Ibom 0.262 0.256
Cross River 0.205 0.204
Edo 0.193 0.193
Oyo -0.096 -0.111
Lagos 0.041 0.026
Ondo 0.062 0.055
Ekiti 0.101 0.099
R2 (Ordinary) 0.72
R2 (Overall) 0.65 0.62
Note: The figure in parenthesis denotes t- statistic; *Significant at 1 percent level;
**Significant at 5 percent level
Source: Authors‟ calculations
The result in Table 2 further shows that there exist a positive relationship between public expenditure
and human development but did not differ significantly when we employed each of the expenditure variables (see table 4). The outcome confirms other studies such as World Bank (1993), Jose (2005), Keuning and
Thorbecke (1999), Fan, et al (2003). However, the cross-section and period specification reveals that public
spending has negative effect on human development in some states and period under consideration. This could
be attributable to low spending on some sectors like education and rural development in relation to other sectors
that do not have direct positive effect on human development. On the recurrent spending, two estimates was
conducted using an instrumental variables regression in which we instrumented education, health, agriculture,
energy, housing, environmental protection and water resources since it has been discovered earlier that
expenditure on rural development is most states was capital in nature. In the first analysis, recurrent expenditure
has both positive and negative effects on human development. Recurrent spending on education, energy,
environmental protection and water resources have positive effect on human development while recurrent
health, agriculture and housing expenditure have negative effect on human development. Interestingly, we also find recurrent spending to have negative effect on human development in some states while it has positive effect
in other states. This is also true for some period under consideration (see Table 3). In the second estimate where
the sample is restricted to states involved in recurrent expenditure on rural development, the result confirms that
education, rural development, and housing recurrent spending have negative effect on human development
while health, agriculture, energy, environmental protection and water resources recurrent expenditure has
positive growth effect on human development. In essence, recurrent spending on rural development has positive
effect on human development in Kaduna, Kebbi, Jigawa, Bauchi, Kogi, Anambra, Imo, Enugu, Delta, Cross-
River, Lagos, Ondo and Ekiti states while its effect is negative in Niger and Plateau states (Table 4).
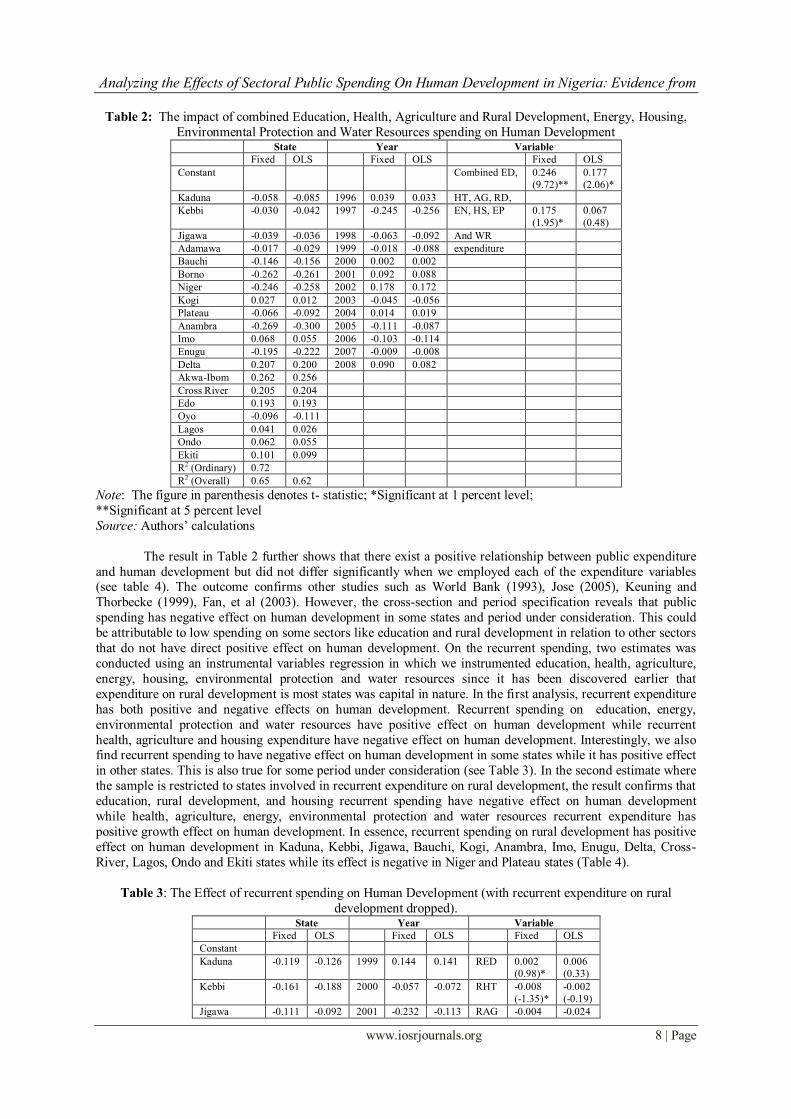
Table 3: The Effect of recurrent spending on Human Development (with recurrent expenditure on rural
development dropped). State Year Variable
Fixed OLS Fixed OLS Fixed OLS
Constant
Kaduna -0.119 -0.126 1999 0.144 0.141 RED 0.002
(0.98)*
0.006
(0.33)
Kebbi -0.161 -0.188 2000 -0.057 -0.072 RHT -0.008
(-1.35)*
-0.002
(-0.19)
Jigawa -0.111 -0.092 2001 -0.232 -0.113 RAG -0.004 -0.024
Analyzing the Effects of Sectoral Public Spending On Human Development in Nigeria: Evidence from
www.iosrjournals.org 9 | Page
(-0.49) (-0.37)
Adamawa -0.102 -0.077 2002 -0.017 -0.007 RRD
Bauchi -0.187 -0.181 2003 -0.101 -0.091 REN 0.004
(1.36)*
0.001
(0.49)
Borno -0.141 -0.092 2004 0.112 0.099 RHS -0.002
(-0.02)
-0.009
(-0.01)
Niger -0.106 -0.128 2005 0.146 0.128 REP 0.013
(0.88)*
0.007
(0.41)
Kogi -0.109 -0.007 2006 0.108 0.103 RWR 0.012
(1.34)
0.010
(0.89)
Plateau -0.104 -0.068 2007 -0.030 -0.087
Anambra -0.105 -0.127 2008 0.138 0.136
Imo -0.190 -0.195 2009 0.246 0.242
Enugu 0.191 0.204 2010 -0.019 -0.012
Delta 0.302 0.301 2011 0.047 0.041
Akwa-Ibom 0.266 0.267 2012
Cross River 0.209 0.211
Edo 0.202 0.200
Oyo 0.121 0.111
Lagos 0.131 0.125
Ondo 0.012 0.012
Ekiti 0.008 0.008
R2 (Ordinary) 0.79
R2 (Overall) 0.75 0.58
Note: The figure in parenthesis denotes t- statistic; *Significant at 1 percent;**Significant at 5 percent
Source: Authors‟ calculations
Table 4: The effect of recurrent spending on Human Development (cross-section with recurrent expenditure on
Rural Development). State Year Variable
Fixed OLS Fixed OLS Fixed OLS
Constant 0.247
(0.14)
0.360
(0.33)
Kaduna 0.002 -0.002 1999 RED -0.003
(-0.14)
-0.016
(0.05)
Kebbi 0.002 0.002 2000 RHT 0.020
(0.52)*
0.018
(0.49)
Jigawa 0.121 0.108 2001 RAG 0.006
(0.13)
0.002
(0.01)
Adamawa 2002 RRD -0.232
(-0.07)
-0.245
(-0.14)
Bauchi 0.002 0.002 2003 REN 0.005
(1.13)*
0.002
(0.97)*
Borno 0.188 0.176 2004 RHS -0.009
(-0.14)
-0.002
(0.33)
Niger -0.039 -0.055 2005 REP 0.021
(0.12)
0.000
(0.83)
Kogi 0.208 0.205 2006 RWR 0.069
(0.10)
0.063
(0.12)
Plateau 0.012 0.246 2007
Anambra 0.002 0.002 2008
Imo 0.002 0.002 2009
Enugu 0.039 0.03 2010
Delta 0.557 0.692 2011
Akwa-Ibom 2012
Cross River 0.018 0.014
Edo
Oyo
Lagos 0.561 0.448
Ondo 0.063 0.03
Ekiti 0.002 0.000
R2 (Ordinary) 0.76
R2 (Overall) 0.63 0.50
Note: The figure in parenthesis denotes t- statistic, *Significant at 1 percent; **Significant at 5 percent
Source: Authors‟ calculations
In the two analyses therefore, recurrent health, environmental protection and water resources
expenditure has positive effect and housing recurrent spending negative effect on human development. Thus,
only recurrent health, housing, environmental and water resources expenditure has consistent effect on human
Analyzing the Effects of Sectoral Public Spending On Human Development in Nigeria: Evidence from
www.iosrjournals.org 10 | Page
development in both analyses. Relative to recurrent spending on education, health, rural development, energy
and housing, recurrent expenditure on health, environmental protection and water resources tends to improve
human development. This may be attributable to the dominance of recurrent spending in some sectors and years
covered by the study. This finding does not however contradict our theoretical expectations of an ambiguous
relationship between recurrent expenditure and human development that increase in recurrent expenditure may
or may not improve human development.
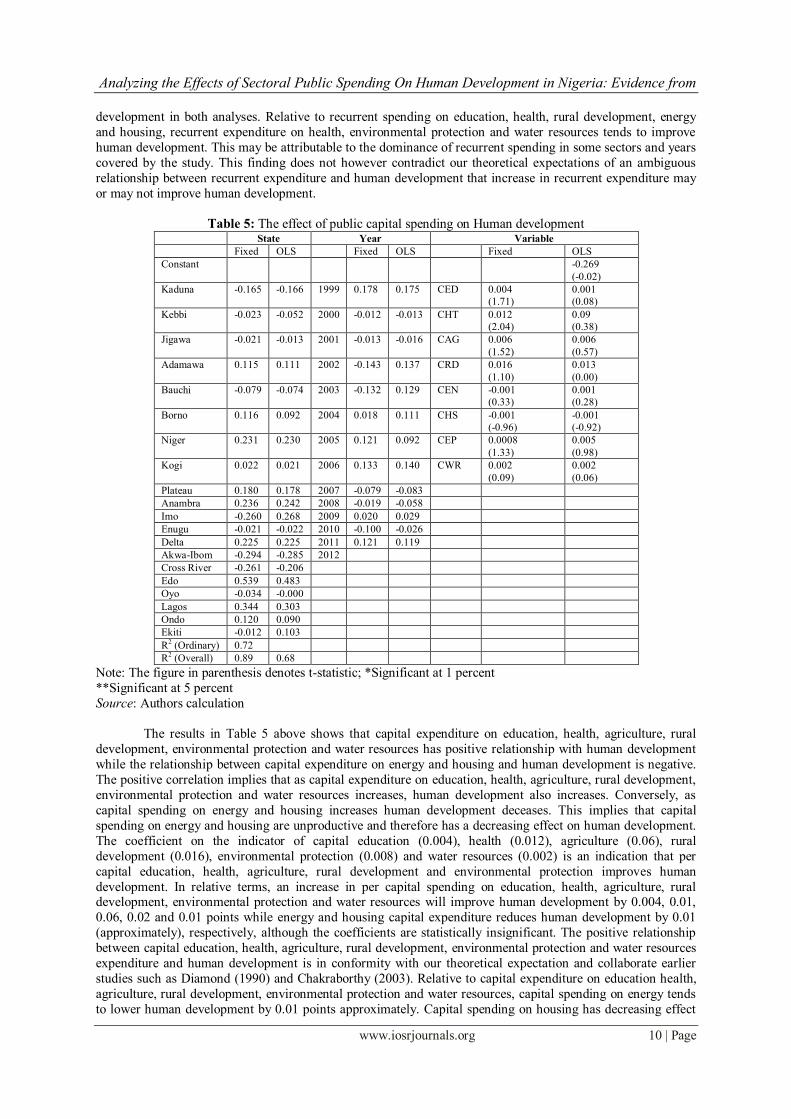
Table 5: The effect of public capital spending on Human development
State Year Variable
Fixed OLS Fixed OLS Fixed OLS
Constant -0.269
(-0.02)
Kaduna -0.165 -0.166 1999 0.178 0.175 CED 0.004
(1.71)
0.001
(0.08)
Kebbi -0.023 -0.052 2000 -0.012 -0.013 CHT 0.012
(2.04)
0.09
(0.38)
Jigawa -0.021 -0.013 2001 -0.013 -0.016 CAG 0.006
(1.52)
0.006
(0.57)
Adamawa 0.115 0.111 2002 -0.143 0.137 CRD 0.016
(1.10)
0.013
(0.00)
Bauchi -0.079 -0.074 2003 -0.132 0.129 CEN -0.001
(0.33)
0.001
(0.28)
Borno 0.116 0.092 2004 0.018 0.111 CHS -0.001
(-0.96)
-0.001
(-0.92)
Niger 0.231 0.230 2005 0.121 0.092 CEP 0.0008
(1.33)
0.005
(0.98)
Kogi 0.022 0.021 2006 0.133 0.140 CWR 0.002
(0.09)
0.002
(0.06)
Plateau 0.180 0.178 2007 -0.079 -0.083
Anambra 0.236 0.242 2008 -0.019 -0.058
Imo -0.260 0.268 2009 0.020 0.029
Enugu -0.021 -0.022 2010 -0.100 -0.026
Delta 0.225 0.225 2011 0.121 0.119
Akwa-Ibom -0.294 -0.285 2012
Cross River -0.261 -0.206
Edo 0.539 0.483
Oyo -0.034 -0.000
Lagos 0.344 0.303
Ondo 0.120 0.090
Ekiti -0.012 0.103
R2 (Ordinary) 0.72
R2 (Overall) 0.89 0.68
Note: The figure in parenthesis denotes t-statistic; *Significant at 1 percent
**Significant at 5 percent
Source: Authors calculation
The results in Table 5 above shows that capital expenditure on education, health, agriculture, rural
development, environmental protection and water resources has positive relationship with human development
while the relationship between capital expenditure on energy and housing and human development is negative.
The positive correlation implies that as capital expenditure on education, health, agriculture, rural development,
environmental protection and water resources increases, human development also increases. Conversely, as
capital spending on energy and housing increases human development deceases. This implies that capital
spending on energy and housing are unproductive and therefore has a decreasing effect on human development.
The coefficient on the indicator of capital education (0.004), health (0.012), agriculture (0.06), rural
development (0.016), environmental protection (0.008) and water resources (0.002) is an indication that per
capital education, health, agriculture, rural development and environmental protection improves human
development. In relative terms, an increase in per capital spending on education, health, agriculture, rural development, environmental protection and water resources will improve human development by 0.004, 0.01,
0.06, 0.02 and 0.01 points while energy and housing capital expenditure reduces human development by 0.01
(approximately), respectively, although the coefficients are statistically insignificant. The positive relationship
between capital education, health, agriculture, rural development, environmental protection and water resources
expenditure and human development is in conformity with our theoretical expectation and collaborate earlier
studies such as Diamond (1990) and Chakraborthy (2003). Relative to capital expenditure on education health,
agriculture, rural development, environmental protection and water resources, capital spending on energy tends
to lower human development by 0.01 points approximately. Capital spending on housing has decreasing effect
Analyzing the Effects of Sectoral Public Spending On Human Development in Nigeria: Evidence from
www.iosrjournals.org 11 | Page
on human development as well. The result further suggests that capital expenditure on some sectors such as
energy and housing are important for building infrastructure, but they may not necessarily improve human
development directly since negative evidence was found according to our estimation. The cross-sectional
analysis indicates that capital spending is positively correlated while it is negatively correlated with human
development in some states and years under consideration. States with higher capital spending on education,
health, rural development and agriculture have higher human development index. Overall, the cross-state results
confirm the importance of capital expenditure in influencing human development. In terms of magnitude, it seems that a proportionate increase in capital spending relative to recurrent expenditure will lead to a significant
improvement in human development. Thus, a larger share of recurrent expenditure reduces human development
and a higher capital expenditure increases it. The result also provides evidence of the importance of education,
health, agriculture, rural development and environmental protection in improving human development.
V. Conclusion Using panel data of 20 states in Nigeria from 1999-2012, this study found that public spending on
education has the highest effect on human development, followed by health, agriculture, rural development and
energy, environmental protection, housing and water resources in descending order. Their specific coefficients, though positive, they are statistically insignificant; an indication that public expenditure has not impacted
significantly on human development. The effect of recurrent expenditure on human development was best
predicted using instrumental variables regression. The result reveals that recurrent expenditure on health,
energy, environmental protection and portable water resources has positive effect on human development while
recurrent rural development expenditure has negative effect. However, the cross-state and period estimation
depicts that recurrent expenditure has both positive and negative effects on human development. The panel
estimation of the relationship between capital spending and human development shows that capital spending has
both positive and negative correlation with human development across states and time. Most notably, education,
health, agriculture, rural development, environmental protection and water resources spending improves human
development, though it is not robust. Relative to capital spending on education, health, agriculture, rural
development and water resources expenditure, capital energy and housing spending tends to lower human development. The outcome suggests that such expenditure might help develop infrastructure, but they might not
help improve capabilities that fosters human development. An important policy implication of our analysis is
that if human development is to appreciate considerably across states in Nigeria, then it is portentous to stress
that spending on education, health, agriculture, rural development, energy, housing, environmental protection
and portable water resources must be further improved. The results, however do not suggest that spending on
energy, housing and environmental protection should be curtailed. Rather, the results do suggest that any further
increase in public expenditure on human development in the future should concentrate on education, health,
agriculture, rural development and portable water resources. However, any increase in human development
spending must emphasize the relative importance of capital spending compared to the current pattern of
allocating higher proportion to the recurrent component. For improvement in human development across states
in Nigeria, it is therefore imperative that a synergy of strategies and actions is required. In line with this, the
following recommendations are made: i). Firstly, human development expenditure by the states should be further improved and sustained. This is
because our analyses have shown that public expenditure has a positive functional relationship with human
development.
ii) Beside, such increases should focus more on education, health, agriculture, rural development and portable
water resources since they have positive marginal impact on human development rather than focusing more on
housing and energy. Despite increase in energy and housing, these sectors have not contributed significantly to
human development.
iii) Moreover, there should be a switching in expenditure from recurrent to capital expenditure; yet it is the
capital expenditure generates more productive resources that can improve human capabilities. Because of this,
recurrent expenditure has had a decreasing effect on the performance of capital expenditure on human
development. To increase the performance of capital expenditure o the provision of infrastructure needed to accelerate economic development, there is need to reduce drastically recurrent expenditure.
iv) It is further suggested that for human development to improve, capital expenditure should be further
improved. One of the assured means of doing this is to reduce the bulk of recurrent expenditure on
administration because such expenditure is corruptive in nature.
v) Consequently, there should be serious constitutional reforms in expenditure pattern in the country so that the
distributional impact of public expenditure on human development would be felt.
vi) Finally, states in Nigeria should work together to develop an enabling environment and framework for
equitable human development expenditure that would benefit all in the near future. This will go a long way in
ensuring consistency in achieving consistency in human development expenditure among the states in Nigeria.
Analyzing the Effects of Sectoral Public Spending On Human Development in Nigeria: Evidence from
www.iosrjournals.org 12 | Page
References [1]. Accountant Generals‟ Report (1999-2012), Various States:
a. Adrian, G and P.O Nadkami (2001), Protecting the Environment for Human Development, a four country study: Botswana, Ghana,
Honduras and Senegal. ESMAP Technical Paper, March
b. Alayande, B. A (2003), Determinant of Vulnerability to Poverty in Nigeria: A Probit Analysis. Consultant Report for the World
Bank /NPC Social Risk Assessment Exercise.
c. Alesine, A and D. Rodrick (1992), “Expenditure Distribution, Political Conflict and Human Development”. In: Cukierman, A
Hercowitz, Z and Leiderman (Eds). Political Economy, Growth and Business Cycle,Cambridge: MIT Press: 23-50
[2]. Anand, S and R1 Ravallion (1993), “Human Development in Poor Countries: On the Role of Private Income and Public Services”.
Journal of Economic Perspectives 7, (1) December: 135-150.
[3]. Anand, S. and R Kanbur (1991), “Public Policy and Basic Needs Provision. Iteration and Achievement in Developing Countries”.
In: Dreze and S (eds). The Political Economy of Hunger. Vol. 3 Oxford Claredun
[4]. Ardndt H. W (1998), Market Failure and Underdevelopment, World Development 16 (2)
[5]. Benerjee, A and A. Newman (1998), Human Welfare and the Process of Development. Journal of Political Economy 10(2): 274-298
[6]. Central Bank of Nigeria (1999-2012), Annual Report and Statement of Accounts, Abuja.
[7]. Central Bank of Nigeria (2010), “Nigeria‟s Development Prospect: Poverty Assessment and Alleviation study”. Central Bank
Nigeria Research Department.
[8]. Ceplan, P. (2004), Human Basic Needs: The Case of Sri Lanka”. World Development. Vol. 8 (3).
[9]. Chakraborty, Lekhas (2003), “Public Expenditure and Human Development: An Empirical Investigation”. Paper Presented at
International Conference on Inequality, Poverty and Human Well-Being, Helsinki, 30-31 May.
[10]. Desgupta, P. and M Weale (1992), On Measuring the Quality of Life. World Development 20 (1): 119-131
[11]. Demery, L. (2003), Analyzing the incidence of Public spending on Well-being”. In: Bourgugnon and L.A. Pereira da Silva (eds).
The impact of Economic policies on Poverty and Income Distribution: Evaluation Techniques and Tools, New York: the World
Bank and Oxford University Press: 41-68.
[12]. Douglas, B. and F. Willem (1996), “Rural Energy in Developing Countries: A Challenge for Human Development”. Annual Review
Energy Environment, 21: 499 – 539
[13]. Ekpo, A.H. (1996), Pattern of Public Expenditure in Nigeria 1960-1992. In: Economic Reform and Macroeconomic Management in
Nigeria, Ariyo (Ed) Ibadan University Press
[14]. Emini C.A. Fofack, (2004), “A Financial Social Accounting Matrix for the Integrated Macroeconomic for Poverty Analysis:
Application to Cameroon with a Fixed- Price Multiplier Analysis”. World Bank Policy Research Working Paper, 3210, February
[15]. Easterly, W and R. Levine (1994), Africa‟s growth strategy: Politics and ethnic Division. Quarterly Journal of Economics, 112 Fan,
S. Hazelland, P. and S. Throat (2000), “Linkage between Government Spending, Human Development and Poverty in Rural India”.
IFPRI Research Report, 110, Washington, D.C.
[16]. Fan, S. Zhang, L., and X. Zhang (2002),” Growth, Inequality and Poverty in Rural China: The Role of Public Expenditure”. IFPRI
Research Report, 125, Washington D.C.
[17]. Feyzioglu, T., V. Swaroop and M.Zhu (2000), “Modeling the Determinant of Humna development expenditure in Sub - Saharan
African Journal of African Economy 6, 29-58
[18]. Garcia, M, T. Osypuk, F. Werbel, A.I Meare, R. Coutler and B. Berkma (2004), “Housing Development and Human Degeneration”.
World Development, 28 (2)
[19]. Gbosh P Ked (1984), Third World Development: A Basic Need Approach Greenwood Press Connecticut
[20]. Gordon S (2008), Analyzing the Patterns of Government Expenditure in Canada. Canadian Public Administration: 101-120
[21]. Goulet, D (1971), “The Cruel choice: A New Concept in the Theory of Development” Atheum, New York
[22]. Grammy, A.S. and D. Assane (1996), Evidence of the Effect of Education Expenditure on Household Welfare. Applied Economic
Letters, 4: 121-124.
[23]. Gupta, S.B and M. Verhoeven (2001), The Efficiency of Government Expenditure: Evidence from Africa. Journnal of Policy
Modeling, 23(4): 433-467
[24]. Hao, E and J. Fan (2001), “Design and Implementation of the Vietnam Human Development Programmes- the „Poor‟ or the
„Shocked‟?” World Bank Policy Research Working Paper No 2436, Washington, D.C
[25]. Haq M.U. (1995), Reflections on Human Development. Oxford University Press, New York.
[26]. Harun, M. B Rashid and B. M Azali (2003), “Public Expenditure Impact on Income Distribution in Malaysia”. Singapore
Economic Review Vol.34 (2): 33-46.
[27]. Herbison, R. and T. Hanushek (1997), “Determinants of Government Expenditure: Evidence from Disaggregated Data”. Oxford
Bulletin of Economics and Statistics, 57
[28]. Hezelland, R and F. Thorat (2005), The impact of Government Expenditure on Human Development: A Welfare Analysis for India.
Journal of Policy Modeling, 13 (3).
[29]. Hicks N. (1980), “Economic Growth and Human Development” World Bank Working Paper No 408.
[30]. IMF (2006), “Nigeria, Options for Reforming Inter-governmental Fiscal Relations”. Fiscal Affairs Department. February
[31]. International Monetary Fund (IMF) (2000), Global Economic Outlook. Washington, D.C
[32]. International Institute of Sustainable Development (2004), “Seeing the Light, Adopting Climatic changes with Decentralized
renewable Energy in Developing Countries”. http:/www.iisdu.org
[33]. Jaff, M.B (2003), “Energy Sector Privatization in Africa: Perspectives from Rural Electrification”. http:/www.esi.africa.com
[34]. Jeff, M. (2007), “Breaking the Stranglehold on Growth. Why Policies Promoting Human Development offer a Better choice for the
U.S. Economy”. EPI Briefing Paper, 192, Washington D.C.
[35]. Jung, H. S. and E. Thorbecke (2003), “The Impact of Public Expenditure on Human Development and Poverty Reduction in
Tanzania and Zambia: A General equilibrium Approach”. Journal of Policy Modeling Vol. 25 (8): 701-725
[36]. McGillivary M. (1991), “The Human Development Index: Yet another Redundant Composition Development Indicator”. World
Development, 19
[37]. McGillivary M and H White (1993), “Measuring Development? The UNDP‟s Human Development Index”. Journal of
International Development 5: 183-192
[38]. Mundle, S (1998), “Financing Human Development: some Lesson from Advanced Asian Countries”. World Development, 26 (4):
659-672
[39]. Murray, H. (1993), “A Modified Human Development Index”, World Development, Vol. 26(3).
[40]. Musgrave, R. A and P.B Musgrave (1984), Public Finance in Theory and Practice, New York, McGraw-Hill.
Analyzing the Effects of Sectoral Public Spending On Human Development in Nigeria: Evidence from
www.iosrjournals.org 13 | Page
[41]. Musgrove Philip., Riadh Zeramdini and Guy Carrin (2000), “Basic Patterns in National Health Expenditure”. Bulletin of the World
Health Organization
[42]. Nasaruddin Arshad and Zulkifly Hj Mustapha (2000), “Malaysian Government Expenditure: An Analysis of Pattern and Probable
Distribution Impact”. Journal of Political Economy Analysis 3(1).
[43]. Noorbakhsh, R. (1998), “A Modified Human Development Index”. World Development, 26 (3): 51-528
[44]. Odusola, A.F. (1997), Poverty Appraisal in Nigeria: An Eclectian Appraisal. In: Poverty Alleviation in Nigeria. Selected Papers,
Annual Conference, NES.
[45]. Okojie, C.E.E. (1995), “Human Development for Productivity Growth in Nigeria”. Central Bank of Nigeria Economic and Financial
Review 1(1) June 45.
[46]. Orubu, C.O. (2004), “Measuring the Quality of Life: Evolution and the Need to Adjust Disaggregated Country Indexes to Reflect
Local Conditions”. In: Abdul-Ganiyu Garba, et al (Eds). Leading Issues in Macro-Economic Management and Development:
Ibadan, Nigerian Economic Society.
[47]. Pastmark, G (2006), Energy Sector Reform and the Pattern of the Poor: Energy use and supply of cross-country study. ESMAP
Technical Paper 95, March
[48]. Ranis, G, F. Stewart and A Ramirez (2000), “Economic Growth and Human Development” World Development. Vol. 28 (2): 1002-
1037.
[49]. Ranis, G. F and F. Stewart (2002), Strategies for Success in Human Development. Journal of Human Development Vol, 1 (7)
[50]. Ranjit, K.P, B. Dhritidyuti, B. Indranil and C. Jai (2006), Public Expenditure and Emerging Social Policy Scenario. Department of
Economic Analysis and Policy. Reserve Bank of India
[51]. Ravallion, M (2001), Growth, Inequality and Poverty: Looking Beyond Averages. African Economic Research Consortium Plenary
Paper, Nairobi, June
[52]. Ray, N.S and M.G Bhattacharaya (1992), An Appraisal of the Methodologies in Data Issues Relating to Human Development
Analysis. In: G. K and G.V.S.N Murthy (eds). Human Development in India: Data Base Issues. New Delhi, Vikas Publishing House
[53]. Saghir, J (2005), Energy and Poverty: Myths, Links and Policy Issues. Energy Working Note 4
[54]. Sahn, D. E. and S.Younger (1999), Social Sector Expenditures and Human Development in Africa. Working Paper 99/172. Fiscal
Affairs Department, International Monetary Fund.
[55]. Sen, A. K. (1981), Public Action and Quality of Life in Developing Countries. Oxford Bulletin of Economic and Statistics 43 (4):
287-319
[56]. Sen, A. K (1983), Development: Which Way Now? The Economic Journal 93, December.
[57]. Sen, A. K (1985), Well-Being, Agency and Freedom: The Dewey Lectures 1984, The Journal of Philosophy Vol. 82 (4): 169-221
[58]. Sen, A. K (1999), Development as Freedom, Oxford, Oxford University Press
[59]. Sen, A. K (2000), A Decade of Human Development. Journal of Human Development. Vol.1 (1)
[60]. Seers, D (1989), The Meaning of Development. In: Eleventh World Conference of the Society for International Development. New
Delhi
[61]. Strauss, J (1986), Does Better Nutrition Raise Farm Productivity? The Journal of Political Economy, Vol. 94 (2), 297-320
[62]. Strauss, J and D. Thomas (1998), Nutrition and Economic Development. Journal of Economic Literature, Vol. 36 (2), 766-817
[63]. Streeten, P. (1994), From Growth to Basic Needs. Finance and Development. Vol. 16(3).
[64]. Streeten, P (1995), “Human Development - means and ends” American Economic Review, Vol. 8 (2), 232-237.
[65]. The International Panel on Climate Change (IPCC, 2001)
[66]. Tilak, J.B.G (2002), “Elasticity of changes in Education expenditure on Household welfare in Rural India”. South Asia Economic
Journal, 3 (2)
[67]. Todaro, M.P. and S.C. Smith (2008), Economic Development (8th Ed). England. Pearson Education
[68]. UHCHS (HABITAT) (2001), Housing in a Globalizing World, An Urbanizing World: Global Report on Human Settlements.
London, Earthscan Publications
[69]. United Nations Centre for Human Settlement (2002), Strategies to Combact Homelessness. New York: Oxford University Press
[70]. UNDP (1990), Human Development Report, New York: Oxford University Press
[71]. UNDP (1994), Human Development Report, New York: Oxford University Press
[72]. UNDP(1996), Disaggregated Human Development index within Nigeria. Consultancy Report. UNDP, HDR Office, New York
[73]. UNDP (Various Issues), Human Development Report, New York: Oxford University Press
[74]. UNDP (2007), “Human Development Network- Measuring Country Performance in Health Selected Indicators for 115 Countries”
Washington, D.C: The World Bank Human Development Report, New York.
[75]. UNDP (2009), Human Development Report Nigeria (Growth with Equity), Abuja: Soma Prints Limited
[76]. United Nations (1954), Report of International Definition of Standard and Level of Living. United Nations, New York.
[77]. UNDP (2006), “Energizing Human Development: A Review of Energy–Human Development Nexus”. Human Development
Strategy Paper.
[78]. United Nations Research Institute for Social Development (UNRISD) (1972), Content and Measurement of Socio Economic
Development. Prager Publishers. New York.
[79]. Vaclcav, S. (2007), Energy and Sustainable Development. UNDP study on Energy, Working Paper
[80]. Wildlife Fund (2006), “Environmental Protection for the Millennium Development Goals”. Achieving the Millennium
Development Goals. Millennium Project
[81]. World Bank (1993), Federal Republic of Nigeria Social Sector Strategy Review. World Bank
[82]. World Bank (2000), Attacking Poverty. World Development Report. Washington: Oxford University Press
[83]. World Bank (2005), “Development in Practice: Private sector Development in Low- Income Countries”. Washington, D C.: World
Bank
[84]. World Bank (1993), “The Making of East Asian Miracle: World Bank Policy”. Research Bulletin (4), August- October.
[85]. World Bank (2006), Taking Action to Reduce Poverty in Sub-Saharan Africa. Washington, D.C. World Bank.
[86]. World Bank (1996), Trends in Developing Economics. Washington, D.C. World Bank.
[87]. World Bank (1996), Nigeria Poverty in the midst of Poverty: The Challenges of Growth with Inclusion. Washington DC, World
14733, May
[88]. World Bank (2003), “Nigeria Policy Option for Growth and Stability”. Report No. 26215-NGA June.
[89]. World Bank (2004), World Development Report, Washington, D.C. World Bank
[90]. World Bank (2006), “Fiscal Policy for Growth and Development”. A Draft Interim Report of the Development Committee, April.
[91]. Zuckman, S., J. Hadley and L. Lezzon (1994), Measuring Health Expenditure Efficiency with Frontier Cost Functions. Journal of
Economics, 13 (3): 255-280