Embed Size (px)
Citation preview

ANALYZING THE POTENTIAL FOR INCREASEDTRADE IN DAIRY PRODUCTS: A CANADIAN PERSPECTIVE
Karl Meilke, Rakhal Sarker and Danny Le Roy
INTRODUCTION
The U.S. and Canadian dairy industries have been protected from foreign competition
for decades. The Uruguay Round of multilateral trade liberalization forced Canada and the
United States to replace their very restrictive import quotas with tariffs. However, the tariffs
on dairy products are high enough to leave each countries complex milk marketing system
largely intact (Meilke and van Duren 1995, IATRC). The recent challenge to Canada's
tariffs, by the United States, on dairy and poultry products has the potential to upset the
current trading arrangement. The outcome of the challenge will not be known for several
months (Meilke; Martin).
Nonetheless, the warm winds of trade liberalization are gathering speed and the dairy
industries in Canada and the United States will not be able to lean against this wind
indefinitely. A first step towards increased market integration might be liberalized trade in
milk and/or dairy products within the current, or an expanded NAFTA agreement (Meilke
and van Duren 1996). Partial trade liberalization has several disadvantages from the
perspective of Canada. Dairy product prices in Canada and the United States are well above
world market levels and Canada's are significantly above those in the United States.
Continental free trade would reduce Canada's prices to U.S. levels. Canadian prices would
decrease because of the large size of the U.S. dairy industry compared to the North American
market. Moreover, North American trade liberalization would not provide the general
equilibrium price increases that would follow from multilateral trade liberalization (Graham,
et al.; Meilke and Larue; Roningen; Roningen and Dixit). As a result, adjustment costs in
Canada from free trade with the United States may be large. In fact, adjustment costs in
Canada may be larger than they would be from free trade with all industrial market
economies.
The purpose of this paper is to highlight the factors that determine the direction and
the size of trade flows in milk and dairy products between Canada and the United States,
with North American trade liberalization. By identifying the key economic factors, the

Proceedings
importance of various assumptions necessary in modelling the Canadian milk market areexposed. Free trade is analyzed with a static, nonspatial, partial equilibrium model. Themodel employs parameter estimates derived from a literature survey. The literature surveyis helpful in identifying several estimation problems and in providing a range of estimatesfor essential parameters. The results from the economic model and the literature surveyprovide a guide for future research.
BUILDING BLOCKS
Seven key building blocks are necessary for the construction of any economic modelof the Canadian dairy sector (Agriculture Canada 1980; Stonehouse and Kizito; Cozzarin).These building blocks include: 1) the marginal cost of producing milk; 2) the supplyelasticity of milk; 3) the shut-down price for milk production; 4) the demand elasticity forfluid milk; 5) the demand elasticity for industrial milk; 6) the difference between Canadianand U.S. processing margins; and 7) the landed price of U.S. milk and dairy products inCanada.
Marginal Cost of Producing Milk
Supply management involves setting a producer price, based on a cost of productionformula, and restricting the level of production to the quantity that is demanded at this price.Since the 1970s a number of key agricultural sectors (dairy, poultry, eggs) have beenregulated under Canada's supply management policies. The economic implications of supplymanagement are well known (Barichello, 1981); Stonehouse; Barichello and Cunningham-Dunlop; Forbes, Hughes and Warley; and Schmitz and Schmitz). Supply control policiesensure a sizeable income transfer from consumers to producers of these commodities. Thewelfare gains to producers, however, are outweighed by the welfare losses to consumers.
Figure 1 illustrates the net welfare loss due to Canadian dairy policy1. Without supplycontrol, the equilibrium price is Pe and the quantity demanded and supplied at this price isQe. However, supply control restricts output to Q, resulting in a demand price of Pd and asupply price (marginal cost) of Ps. The difference between the two prices (Pd - 1 ) is theannual rental rate for quota. The welfare loss is area ABC.
The departure from marginal cost pricing is a distinguishing feature of supplymanagement. The size of the departure from marginal cost pricing is a key element in 1)determining the size of the efficiency losses, and 2) determining the size of the impact oftrade liberalization. During the past 15 years many attempts have been made to measure the
Figure 1 has been simplified by assuming there is only one type of milk that fetchesonly one price.
242

Meilke, Sarker and Le Roy
departure from marginal cost pricing in the Canadian dairy industry. Some of these efforts
involve accounting procedures. Others involve the statistical estimation of cost relationships.
Each approach has strengths and weaknesses.
Figure 1. Price Determination with Supply Control
70
60
demand50
40
30 1 S- U
20
10
040.00 50.00 60.00 70.00 80.00 90.00 100.00
quantity (mhl)
The most direct approach, to obtain a value for marginal cost, is to use cost of
production survey data. Cost of production data is used to compute the average cost of milk
production. It is then assumed that an estimate of average variable cost provides a crude
approximation to marginal cost (Barichello 1981; Barichello and Stennes). Although the cost
of production approach is simple, it has several drawbacks. First, unit costs of production
vary considerably between farms due to variations in size, technology, and location. Second,
because average costs vary substantially by output level, it is important that sample farms be
representative and that the sample includes the largest firms in the industry. Third, the
opportunity costs of farm supplied inputs (family labour and returns to management and
equity capital) are unknown and difficult to proxy. Fourth, if farm production is
characterized by joint production of multiple outputs, using shared inputs, cost allocation
becomes arbitrary. Finally, under supply management, there is an incentive for farmers to
inflate input usage and reported costs, since these are used in determining their administered
price.
If there was a rental market for production quota then milk production would move
from inefficient producers to efficient producers, over time. The rental rate of quota also
would be directly observable. If the rental rate is known, a well behaved supply function can
be derived from the profit function (or restricted profit function in the short-run). Once the
supply function is estimated the departure from marginal cost at any output level can be
243

Proceedings
determined2 . However, there is no rental market for Canadian milk quota and the rental rateis not observed. Instead, dairy quotas are exchanged as capital assets and confer the right toproduce and market milk indefinitely. In this situation, two alternative strategies can bepursued to overcome the problem of estimating the milk supply function.
Another strategy to follow in determining marginal cost is to exploit the dualitybetween profit and cost functions. By using farm-level data it is possible to estimateeconometrically a joint cost function. The marginal and average cost of milk production canbe derived from the cost function and then used to determine the departure from marginalcost pricing. This approach does not require any information on quota rental rates.
Moschini (1988a) used the joint cost function approach to analyze aggregate supplyresponse with supply management. He also estimated a joint cost function for the Ontariodairy sector using farm-level cost data from 1980 to 1986 (Moschini 1988b). The departurefrom marginal cost was estimated as the difference between the farm level milk price andmarginal cost (and average cost) at the optimum long-run scale of production. At the optimaloutput level (which was about 5,000 hi of milk per year), the minimum value of average costwas estimated to be $26.10/hl. The average price of industrial and fluid milk during thestudy period were $30.70/hl and $36.90/hl, respectively. Thus, for industrial milk, thedeparture from marginal cost pricing was 15 percent. For fluid milk, the extent of departurewas over 29 percent (Moschini and Meilke).
Milk quota confers the permanent right to produce milk and to sell it at privilegedprices. The production rights provide a stream of annual returns to the producer. Accordingto the capital asset pricing model, the capitalized quota value is equal to the sum of thediscounted future returns. That is,
(1) Vo=R/i
where (V0) is the current capital value of the asset, (R) is the average annual return on theinvestment and (i) is the average discount rate.3 The return, R, can be interpreted as thedifference between price and marginal cost.
If two of the three variables in equation (1) are known, the value of the third variablecan be derived from the formula. Since the capitalized quota values (V0's) are observable,it is possible to recover from equation (1) the departure from marginal cost pricing (R) if thediscount rate is known. But what is the appropriate discount rate? In theory, the discountrate reflects the riskiness of the asset. In this case the major risk is that the right to producemilk at privileged prices might be lost (Lermer and Stanbury). Expected capital gains,expected nominal interest rates and the planning horizon will also affect the risk assessment.These factors are difficult to quantify and incorporate into the choice of a discount rate.
2 Babcock and Foster used this approach to determine the marginal cost of flu-curedtobacco production in North Carolina.
3 Note that this simple capitalization formula assumes an infinite planning horizon, nogrowth in asset value and zero covariance between the value of the asset and aggregateconsumption (Varian:368-386).
244

Meilke, Sarker and Le Royl
Consequently, discount rates as diverse as 0.14 (Veeman) and 0.32 (Barichello 1984) have
been considered appropriate to estimate the departure from marginal cost pricing. Even for
assets as closely related as fluid milk quota and industrial milk quota, estimated rates of
return vary considerably over time (Moschini and Meilke; Barichello 1995). A shortcoming
of the capital asset pricing model is that of the three variables contained in formula (1), only
one is known with certainty. The other two variables are equally difficult to estimate with
precision.
Barichello (1984) has proposed another method to determine marginal cost using the
capital asset pricing model. In Ontario, there are markets for two types of industrial milk
quota, used and unused. Exactly the same set of policies regulate both markets, but the per
unit values of the quotas are different. Note, that used quota bought in year (t) can be used
to ship milk beginning in year,(t+l). However, milk can be shipped under unused quota
immediately. The difference in value between used and unused quota can be considered a
return on investment in current milk production. Note that unlike imputed returns on
investment, the return on an investment in current quota (milk production) is market
determined. The rate of return reflects the riskiness of the asset, nominal interest rates and
the time horizon. The approach is analytically simple and empirically appealing. Obviously,the nominal discount rate retrieved in this way will vary over time. However, it is one of the
few ways to avoid the arbitrary choice of a discount factor.
Hickling used the Barichello approach to retrieve the annual rental rate of milk quota
and the marginal cost of milk production. He estimated the departure from marginal cost to
be 43 percent. Some experts have argued that a departure of 43 percent is too high (Halpem
et al.). Consequently, while this is an intuitively appealing approach to obtain the departure
from marginal cost pricing, it seems to generate unrealistically high values for the discount
rate. High discount rates produce implausibly low marginal cost estimates.
Chen and Meilke have proposed a dynamic variation on Barichello's approach. The
authors estimate the marginal cost of Ontario milk production from 1980 to 1991. The
estimated marginal costs are consistently higher than those obtained using Barichello's
method (in 1985-86 marginal cost were $22/hl vs. $12/hl)4 . Consequently, the estimated
departures from marginal cost pricing are consistently lower in Chen and Meilke's study than
similar estimates obtained using Barichello's approach.
The choice of any single marginal cost estimate is fraught with difficulties and is
bound to be controversial. However, for empirical analysis a point estimate is needed and
$33/hl is assumed to be the margin cost of producing the current quantity of milk. The
estimate of $33/hl is consistent with cost of production surveys. Furthermore, a $33/hl
marginal cost implies a discount rate of 20 percent, based on 1993 Ontario used industrial
milk quota values. A 20 percent discount rate is in the mid-range of discount rates estimated
by other economists.
4 Unless otherwise noted all dollar values are in Canadian currency.
245

Proceedings
Supply Elasticities
Information on the departure from marginal cost pricing provides one point on theunderlying supply function. It does not describe the shape of the supply function nor theresponsiveness of milk supply to free market price changes. Most Canadian studiesinvolving supply managed commodities borrow supply elasticity estimates from analysisconducted using U.S. data. Regulatory differences have introduced dissimilarities in theaverage size and capital structure of dairy farms in Canada and the United States (AgricultureCanada 1995a, USDA). Identical supply responses cannot be expected in the United Statesand Canada. Nonetheless, there are similarities in production practices and input prices inthe two countries. As a result, supply elasticities estimated using U.S. data are indicative ofthe responsiveness of the underlying Canadian supply function.
Estimated long-run supply elasticities for milk derived from several U.S. studies arepresented in Table 1. The estimated supply elasticities vary considerably across studiesdepending on the structural characteristics of the models, the data sets, the time period ofanalysis, and the expectations mechanism used. All of the estimated long-run supplyelasticities are greater than 0.5, except for the estimate obtained by Howard and Shumway.In four of the studies the estimated long-run supply elasticity is greater than one. TheAmerican Agricultural Economics Associations Task Force on Dairy Marketing Orders insummarizing their survey of milk supply elasticities came to the conclusion that... "quite highlong-run supply elasticity, say more than two, makes a good deal of economic sense givenmodem dairy production methods (p. 51)" which provides an argument against using a smallsupply elasticity in the Canadian context.
Table 1. Estimated Long-Run Supply Elasticities for Milk in the United States
Source Study Period Supply Elasticitya
Elterich and Masud 1966-78 2.8
Dahlgran 1953-83 1.0(6)-2.0(16)
Thraem and Hammond 1949-78 1.15
Chavas and Klemme 1960-82 0.89(5)-2.46(10)
LaFrance and de Gorter 1950-80 4.8-8.0
Kaiser et al. 1949-85 0.80 (5)
Howard and Shumway 1951-82 0.23
Helmberger and Chen 1966-90 0.58
a The numbers in the parentheses are the number of years allowed for the indicated supplyresponse.
246

Meilke, Sarker and Le Roy
Shut-Down Price
Most economists pay little attention to the price at which the production of a
commodity falls to zeros. Policy changes typically involve small price changes which
seldom push prices near the shut-down point. However, MacGregor, et al. did consider the
issue, in a mathematical programming context, when they analyzed changes to Canada's
subsidized rail freight rates. Fox, Roberts and Brinkman discuss a non-linear functional form,
for a supply curve, that allows for an explicit shut-down price without imposing an inelastic
supply response. In some situations the shut-down price can be important, especially if price
declines are expected to be large. Supply response must become very price elastic as prices
fall close to the shut-down price.
The only source of information about possible shut-down prices for milk production,
are the various cost-of-production surveys. Survey data suggest that for the more "efficient"
farms to produce a hectolitre of milk in 1993-1994, the variable cost was around $23-24/hl
(ODFAP; OMMB). The variable cost estimate included the variable cost of milk and crop
production plus the cost of hired labour. Therefore, a value of $22/hl was selected in this
study as the price at which Canadian milk production would go to zero, since some farms
have lower costs than the "average" figure.
Demand Elasticities for Fluid and Industrial Milk
Milk is consumed either in fluid form or as processed products made from industrial
milk (butter, cheese, yogurt, ice cream, and skim milk powder). The demand elasticity for
each product is different. By using observed retail prices, the demand elasticities for
Canadian dairy products can be estimated using standard econometric techniques.
Table 2 contains some direct price elasticities for fluid milk estimated for the most
part with Canadian data. The estimates for the United States are included for the purpose of
comparison. Table 2 shows that most of the elasticity estimates for Canada vary between
-0.20 and -0.40.
About 70 percent of the raw milk produced in Canada is used in processed dairy
products. Despite its large share of the raw milk market, few studies have estimated the price
elasticity of demand for Canadian industrial milk products. Goddard and Amuah found the
own-price elasticity of demand for butter during the 1973-86 period to be -0.78. Veeman and
Peng estimated the following direct price elasticities for various processed dairy products:
butter (-1.11), ice cream (-0.62), yogurt (-0.81), cottage cheese (-0.21), cheddar cheese
(-0.66) and other cheese (-1.22). Moschini and Moro report a matrix of own-price and
cross-price elasticities of demand for fluid milk, butter, cheese and other dairy products. The
elasticities estimated by Moschini and Moro are listed in Table 3.
5 Studies using linear supply curves with an inelastic supply response imply there is
positive output at a zero price.
247

Proceedings
Table 2. Estimates of the Own-Price Elasticity of Demand for Fluid Milk
Source Study Area & Period Price Elasticity
Kinnucan and Forker U.S. -0.04
Kinnucan Buffalo, U.S. -0.73
Thompson and Eiler U.S. -0.20
Goddard and Tielu Ontario: 1971-84 -0.25
Venkateswaren and Kinnucan Ontario: 1973-84 -0.19
Stonehouse and Kizito Canada: 1971-88 -0.01 (Stnd.)-0.31 (L-Fat)
Curtin et al. Canada: 1961-84 -0.24
Agriculture Canada 1980 Canada: 1970-80 -0.02 (Stnd.)-2.79 (L-Fat)
Goddard and McCutcheon Ontario: 1981-89 -0.24Quebec: 1981-89 -0.23
Goddard and Tielu Canada: 1977-94 -0.38
Moschini and Moro Canada: 1962-88 -0.34
Fang Ontario -0.11
Helmberger and Chen U.S.: 1966-90 -0.08 (Fluid)
Veeman and Peng Canada -0.59 (Stnd.)-0.11 (L-Fat)
Table 3. Price Elasticity of Demand for Milk and Milk Products in Canada.
Milk Butter Cheese Other Dairy
Milk -0.34 0.12 -0.14 0.10
Butter 0.35 -0.92 -0.19 0.46
Cheese -0.24 -0.11 -0.40 0.39
Other Dairy 0.15 0.24 0.35 -1.02
Source: Moschini and Moro (1993, p. 89).
248

Meilke, Sarker and Le Roy
Trade liberalization will affect the prices of all dairy products through a change in raw
milk price. The price of all dairy products will fall compared to prices of other goods. The
relative prices of dairy products will change slightly or not at all. Therefore, total elasticities
are required. An estimate of the "correct" elasticity can be obtained from Moschini and
Moro's results by adding the elasticities across the rows in Table 3. Doing this, the total
elasticity for fluid milk is -0.26 and for butter, cheese and other dairy products -0.30, -0.36
and -0.28 respectively.
Processing Margins
According to Industry Science and Technology Canada, Canadian processing costs
are similar to those in the United States when the higher cost of raw milk is excluded.
However, the guaranteed margin to dairy processors, in Canada, is considerably larger than
the one used in the United States to set support prices for butter and skim milk powder( de
Gorter). Therefore, with free trade, processor margins might get squeezed due to increasedcompetition. Reduced processor margins would be shared between consumers andproducers. Elasticities of supply and demand and arbitrage conditions would determine theextent of the margin squeeze and the shares allocated to consumers and processors. Little isknown about the competitive conditions in the Canadian milk processing industry.
Moreover, there is limited information on the supply and demand conditions for processeddairy products that would be traded under free market conditions (Rude). A careful analysis
of dairy product trade is well beyond the scope of this paper. However, the effect of
lowering the Canadian processing margin on dairy products is simulated.
U.S. Milk Prices
Table 4 shows that the nominal price of U.S. industrial milk has ranged between
US$11.03/cwt and US$12.57/cwt. Transfer costs between the United States and Canada are
assumed to equal US$ 1.00/cwt which is roughly consistent with the findings of de Gorter and
Agriculture Canada (1995b). Table 4 reveals that most of the variation in the landed value
of U.S. milk ($31.73/hl to $41.02/hl) has resulted from currency fluctuations. With the U.S.
dollar trading at $1.35-$1.40 the landed price of industrial milk from the United States is
about $40/hl.6 The price gap between Canadian producer returns and U.S. industrial milk
prices is $8-$10/hl, of which $5.43 is the direct federal subsidy. Consequently, Canada's
market prices for industrial milk are not much different from the current landed price of U.S.
milk. The price gap shown in Table 4 assumes that Canada would be in a net import
6 The price relationships in Table 4 and Table 5 should only be considered as indicative
of trading prices. Actual trade would take place between Canada and low cost producing pointsin the Northern United States. Especially for fluid milk, prices in the Northern United States arebelow those in the Southern Milk Marketing Orders.
249

250 Proceedings
position. If Canada is exporting milk and dairy products to the United States, industrial milkprices would have to fall to about $34/hl, ie. the U.S. price less transfer costs.
Table 4. A Comparison of Canadian and United States Prices for Industrial Milk,1980-1994.
US- Can- In- Producer Plant
Year Man. Transfer Exchange US-Man Target Quota Ontario_ Net Prodcer Direct Plant Gate Gate
Mkt. Price
Price Costs Rate Price Return Levy Fees Return Gap _Subsidy Price Gap Price Gapexcl. incl.
us$/cwt us$/cwt c$/us$ c$ c$/hI c $/hl c$/hl c$/hl c$/hl c$/hl c/h subsidy subsidy
[1] [2] [3] [4] [5] [6] [7] [8] [9] [10] [11] [12]
1980 $11.88 $1.00 1.19 $34.79 $35.55 $2.96 $0.48 $32.11 ($2.68) $6.03 $0.76 ($5.27)
1981 $12.57 $1.00 1.22 $37.58 $38.92 $3.27 $0.64 $35.01 ($2.57) $6.03 ($4.69)
1982 $12.49 $1.00 1.23 $37.67 $41.33 $4.68 $0.69 $35.96 ($1.70) $6.03 $3.66 ($2.37)
1983 $12.49 $1.00 1.26 $38.58 $43.24 $5.14 $0.73 $37.37 ($1.21) $6.03 $4.66 ($1.37)
1984 $12.29 $1.00 1.34 $40.43 $44.65 $6.17 $0.77 $37.71 ($2.71) $6.03 $4.22 ($1.81)
1985 $11.48 $1.00 1.38 $39.09 $45.64 $6.07 $0.84 $38.73 ($0.36) $6.03 $6.55 $0.52
1986 $11.30 $1.00 1.36 $37.97 $46.48 $5.35 $0.92 $40.21 $2.24 $6.03 $8.51 $2.48
1987 $11.23 $1.00 1.27 $35.26 $46.77 $4.11 $0.99 $41.68 $6.42 $6.03 $11.51 $5.48
1988 $11.03 $1.00 1.20 $32.77 $47.06 $3.08 $1.06 $42.93 $10.16 $6.03 $14.29 $8.26
1989 $12.37 $1.00 1.17 $35.51 $47.45 $2.91 $1.06 $43.49 $7.98 $6.03 $11.94 $5.91
1990 $12.21 $1.00 1.15 $34.48 $48.69 $3.40 $1.10 $44.19 $9.71 $6.03 $14.21 $8.18
1991 $11.05 $1.00 1.16 $31.73 $49.92 $3.38 $1.23 $45.32 $13.58 $6.03 $18.19 $12.16
1992 $11.88 $1.00 1.26 $36.84 $50.11 $2.10 $1.38 $46.64 $9.80 $6.03 $13.27 $7.24
1993 $11.80 $1.00 1.35 $39.23 $50.84 $1.90 $1.45 $47.49 $8.26 $5.43 $11.61 $6.18
1994 $12.00 $1.00 1.39 $41.02 $52.28 $2.18 $1.45 $48.65 $7.63 $5.43 $11.26 $5.83
[1] M-W Manufacturing grade milk, 3.5% fat, calendar year. Dairy Outlook. USDA.
[2] Assumed average transfer costs.
[3] Canadian dollars per United States dollar, calendar year. Medium Term Outlook. Agriculture Canada.
[4) United States price of manufactured milk landed in Canada, Canadian dollars per hectoliter, calendar year. Calculated as (1 +
2)*(3)*2.27.
[5] Canada target return for industrial milk, dairy year. Medium Term Outlook. Agriculture Canada.
[6] In-Quota levy on all milk, dairy year. Medium Term Outlook. Agriculture Canada.
[7] Ontario Milk Marketing Board marketing levy, dairy year. Dairy Statistical Handbook. OMMB.
[8] Canada net producer return for milk, dairy year, including direct federal subsidy. Calculated as (5-6-7).
[9] Gap between Canadian industrial milk producer returns, including the direct federal subsidy, and the M-W average manufactured milk
price.
Calculated as (8-4).
[10] Canada industrial milk direct federal subsidy, dairy year. Medium Term Outlook. Agriculture Canada.
[11] Gap between Canadian industrial milk price, plant gate, excluding the federal subsidy, and the M-W average manufactured milk price.
Calculated as (5-4).
[12] Gap between Can. industrial milk price, plant gate, including the federal subsidy, and the M-W average manufactured milk price.
Calculated as (5-10-4).

Meilke, Sarker and Le Roy 251
Table 5 lists the nominal prices of fluid milk in the United States. In this case, the
producer price gap is much larger, ranging from $12-$17/hl, in recent years. A reasonable
fluid milk import price is about $43/hl.
Table 5. A Comparison of Canadian and United States Prices for Fluid Milk, 1980-1994
In- Ontario Plant
Year US-Fluid Transfer Exchange US-Fluid Ontario Quota_ _Ontario__ _Fluid_ __Producer _Gate__
Fluid Mkt. Producer Price
Price Costs Rate Price Price Levy Fees Return Price Gap Gap
us$/cwt us$/cwt c$/us$ c$/hl c$/hl c$/hl c$/hl c$/hl c$/hl c$/hl
[1] [2] [31 [4] [5] [6] [7] [8] [9] [10]
1980 $13.23 $1.00 1.19 $38.44 $40.11 $0.48 $39.63 $1.19 $1.67
1981 $13.95 $1.00 1.22 $41.40 $43.36 $0.64 $42.72 $1.32 $1.96
1982 $13.80 $1.00 1.23 $41.32 $46.04 $0.69 $45.35 $4.03 $4.72
1983 $13.75 $1.00 1.26 $42.19 $48.23 $0.73 $47.50 $5.32 $6.04
1984 $13.61 $1.00 1.34 $44.44 $51.49 $0.77 $50.72 $6.28 $7.05
1985 $12.90 $1.00 1.38 $43.54 $52.51 $0.84 $51.67 $8.13 $8.97
1986 $12.62 $1.00 1.36 $42.05 $52.51 $0.92 $51.59 $9.54 $10.46
1987 $12.66 $1.00 1.27 $39.38 $52.51 $0.99 $51.53 $12.14 $13.13
1988 $12.36 $1.00 1.20 $36.39 $54.51 $1.06 $53.46 $17.06 $18.12
1989 $13.66 $1.00 1.17 $38.94 $54.45 $1.06 $53.40 $14.46 $15.51
1990 $13.89 $1.00 1.15 $38.87 $56.95 $1.10 $55.85 $16.98 $18.08
1991 $12.30 $1.00 1.16 $35.02 $56.95 $1.23 $55.73 $20.70 $21.93
1992 $13.16 $1.00 1.26 $40.50 $58.94 $1.38 $57.57 $17.06 $18.44
1993 $12.86 $1.00 1.35 $42.47 $59.08 $1.90 $1.45 $55.73 $13.26 $16.61
1994 $13.03 $1.00 1.39 $44.27 $59.83 $2.18 $1.45 $56.20 $11.93 $15.56
[1] Price of milk eligible for fluid market, calendar year, Dairy Outlook. USDA.
[2] Assumed average transfer costs.
[3] Canadian dollars per United States dollar, calendar year. Medium Term Outlook. AgricultureCanada.[4} United States price of fluid milk landed in Canada, Canadian dollars per hectoliter, calendar year.
Calculated as (1 + 2)*(3)*2.27.
[5] Ontario Class I price for milk, dairy year. Medium Term Outlook. Agriculture Canada.
[6] In-Quota levy on all milk, dairy year. Medium Term Outlook. Agriculture Canada.
[7] Ontario Milk Marketing Board marketing levy, dairy year. Dairy Statistical Handbook.OMMB.
[8] Return received by Ontario fluid milk producers, dairy year. Calculated as (5-6-7)
[9] Gap between average Ontario fluid milk producer returns and US average fluid milk prices. Calculated as
(8-4).
[10] Gap between average Ontario fluid milk prices, plant gate, and US average fluid milk prices. Calculated as
(5-4).

Proceedings
THE MODEL
To illustrate the importance of the economic variables mentioned above a simple two-good, synthetic economic model is constructed. The model depicts trade between Canadaand the United States in milk and dairy products. It is assumed that Canada is a small-country price-taker.
The model consists of two consumption goods: industrial milk products and fluidmilk, produced from a single raw milk input. While fluid milk would trade in its raw (fluid)form, industrial milk is more likely to be traded as processed dairy products (butter, skimmilk powder, cheese, ice cream, etc.). The model is calibrated in terms of the milkequivalent of processed product consumption, and constructed to reproduce the 1993/94Canadian dairy year.
Prices, quantities, and the assumed base values of parameters used for simulation, arelisted in Table 6 and Table 7. All Canadian prices and quantities are based on data, for thedairy year, except for exports of Canadian dairy products (milk equivalents) where data forcalender year 1993 is used. Similarly, the U.S. prices shown in Table 6 and Table 7 are fora calendar rather than a dairy year. The choice of the base parameter estimates has beenguided primarily by the literature review. A reader may disagree with the choice of the baseparameters. Therefore, a range of values are used in the sensitivity analysis to illustrate theimportance of various parameter choices (Table 7).
Model Specification
The simulation model consists of two linear demand functions and a non-linear supplyfunction calibrated to representative prices and quantities. The demand elasticities for fluidand industrial milk demand are set at -0.10 and -0.50. The industrial milk demand elasticityis slightly higher than the total elasticities estimated by Moschini and Moro but considerablylower than most Marshallian demand elasticities for individual processed dairy products.The elasticities should be calculated at the processing plant gate (wholesale) and not at retail,as are nearly all of the estimates in the literature. Under most conditions, demand elasticitieswill be lower at the wholesale rather than at the retail level. To capture all "reasonable"demand elasticities sensitivity analysis is conducted over the range -0.05 to -0.40 for fluidmilk and from -0.20 to -0.90 for industrial milk (Table 7). These elasticities are imposed ona linear demand curve at the 1993/94 price-quantity point.
The farm level supply elasticity for milk has been set at 1.0. Selecting a supplyelasticity also requires selecting a length of run to which it applies. A base period value of1.0, should be appropriate for the medium run. A range of values from 0.5 to 2.0 shouldcapture all expected supply responses beyond the very short run to the long run.
252

Meilke, Sarker and Le Roy 253
Table 6. 1993/1994 Dairy Year - Base Data
[1] Industrial target return ($/hl) $50.84
[2] minus within quota levy ($/hl) $1.90
[3] minus marketing board fees $1.45
minus domestic butter program
[4] costs $0.08
Producer Net Return for Industrial Milk ($/hl) $47.41
[5] minus direct subsidy $5.43
Producer Net Market Return for Industrial Milk ($/hl) $41.98
Industrial target return ($/hl) $50.84
minus direct subsidy ($/hl) $5.43
Price Paid by Processors for Industrial Milk ($/hl) $45.41
[6] plus processor margin $7.60
Price Guarantee to Processors $53.01
[7] Ontario Fluid Milk Price ($/hl) $59.08
less over quota levy $1.90
less marketing board fees $1.45
Producer Net Return for Fluid Milk $55.73
Ontario Fluid Milk Price ($/hl) $59.08
plus weighted average processing
[8] margin $0.63
Price Received by Fluid Processors $59.71
[9] Fluid Milk Deliveries (mhl) 30.73
[10] less skim off 8.16
[11] Fluid Milk Consumption 22.57
[12] Industrial Milk and Cream Deliveries (mhl) 43.27
plus skim off cream from fluid
sector (mhl) 8.16
Industrial Milk Supply, butterfat basis (mhl) 51.43
[13] Exports of Industrial Products, butterfat basis (mhl) 3.00
[14] Imports of Industrial Products, butterfat basis (mhl) 2.63
Net Exports of Industrial Products (mhl) 0.37
Domestic Consumption of Industrial Milk and
Cream Products, butterfat basis (mhl) 51.06
United States Milk Price + Transfer Costs
[15] Fluid Milk Price + transfer costs $42.47
Industrial Milk Price + transfer
[16] costs $39.23
United States Milk Price -Transfer Costs
[17] Fluid Milk Price -transfer costs $36.35
Industrial Milk Price -transfer
[18] costs $33.10
[1], [2], [5], [6], [7], [8], [9], [10], [11], [12] Medium Term Outlook. Agriculture Canada.
[3] Dairy Statistical Handbook. OMMB
[4] Dairy Facts and Figures. Dairy Farmer's of Canada.
[13], [14] Figures are for calendar year 1993. Dairy Facts and Figures. Dairy Farmer's of Canada.
[15], [17] See table 5.
[16], [18] See table 4.
Proceedings
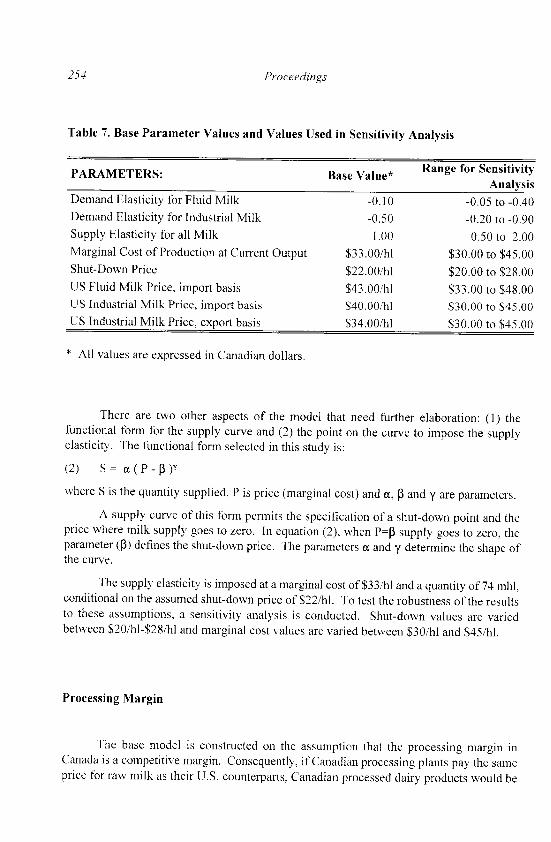
Table 7. Base Parameter Values and Values Used in Sensitivity Analysis
PARAMETERS: Base Value* Range for SensitivityAnalysis
Demand Elasticity for Fluid Milk -0.10 -0.05 to -0.40Demand Elasticity for Industrial Milk -0.50 -0.20 to -0.90Supply Elasticity for all Milk 1.00 0.50 to 2.00Marginal Cost of Production at Current Output $33.00/hl $30.00 to $45.00Shut-Down Price $22.00/hl $20.00 to $28.00US Fluid Milk Price, import basis $43.00/hl $33.00 to $48.00US Industrial Milk Price, import basis $40.00/hl $30.00 to $45.00US Industrial Milk Price, export basis $34.00/hl $30.00 to $45.00
* All values are expressed in Canadian dollars.
There are two other aspects of the model that need further elaboration: (1) thefunctional form for the supply curve and (2) the point on the curve to impose the supplyelasticity. The functional form selected in this study is:
(2) S= a( P- 3)
where S is the quantity supplied. P is price (marginal cost) and a, P and y are parameters.
A supply curve of this form permits the specification of a shut-down point and theprice where milk supply goes to zero. In equation (2), when P=P supply goes to zero, theparameter (p) defines the shut-down price. The parameters a and y determine the shape ofthe curve.
The supply elasticity is imposed at a marginal cost of $33/hl and a quantity of 74 mhl,conditional on the assumed shut-down price of $22/hl. To test the robustness of the resultsto these assumptions, a sensitivity analysis is conducted. Shut-down values are variedbetween $20/hl-$28/hl and marginal cost values are varied between $30/hl and $45/hl.
Processing Margin
The base model is constructed on the assumption that the processing margin inCanada is a competitive margin. Consequently, if Canadian processing plants pay the sameprice for raw milk as their U.S. counterparts, Canadian processed dairy products would be
254

Meilke, Sarker and Le Roy2
priced competitively with the processed product from the United States. To simulate the
possibility that Canadian processing margins might be reduced with trade liberalization, the
effect of reducing the Canadian processing margin from $7.60/hl to $3.80/hl is examined.
U.S. Milk Prices
Prices for fluid and industrial milk produced in the United States are needed to
simulate the model. With the U.S. dollar trading at $1.35-$1.40, the landed price of milk
produced in the United States is about $40/hl, the base value chosen for industrial milk. The
value selected for fluid milk is $3/hl higher at $43/hl. A drop in the American milk price to
$22.70/hl (US$10/cwt) plus a weaker U.S. dollar of $1.25, could push landed prices down
to $30/hl. Hence, a range of landed values for U.S. milk from $30/hl to $45/hl are simulated.
Values below $40/hl are the most probable. In all simulations it is assumed that Canada
could price fluid milk at the import competitive price of $43/hl, even when it is a net exporter
of dairy products.
THE RESULTS
Table 8 describes the consequences of freer trade under two alternative scenarios, and
compares these results to the current policy situation. Base 1 assumes that producers react
to the blend price in making their supply decisions. In Base 2, producers are assumed to
react to the industrial milk price - which is the marginal output price. Under both
assumptions Canadian milk output increases from the base level of 74 mhl. In Base 1 output
increases to 81.3 mhl (blend price scenario) and In Base 2 output rises to 79.1 mhl (industrial
milk price scenario). Output increases in both cases despite a producer price decline of 25-30
percent following the removal of supply restrictions. As a result of a reduced market price,
the demand for fluid milk increases by 2.7 percent and the demand for industrial milk
increases by about 10 percent.
In Base 1, Canada is a small net exporter of milk (1.53 mhl) and industrial milk prices
are pushed down to the export floor of $34/hl. The blend price in Base 1 is reduced to
$36.57/hl, compared to $49.95 under supply control. Under Base 2, Canada is self-sufficient
in milk production and net trade in milk products is zero. Autarky industrial and blend prices
rise from Base 1 levels to $35.41 and $37.64/hl.
255

Proceedings
Table 8. Current and Free Trade Policy Results: Base Period Variable and ParameterValues
FREE FREEVARIABLE UNITS CURRENT TRADE TRADE
POLICY BASE BASE 1 BASE 2
value value % change value % change
Fluid Milk Demand mhl 22.57 23.18 2.7 23.18 2.7
Industrial Milk Demand mhl 51.06 56.56 10.8 55.88 9.4
Total Domestic Milk Demand mhl 73.63 79.73 8.3 79.05 7.4
Total Milk Supply mhl 74.00 81.26 9.8 79.05 6.8
Net Exports of Milk Products mhl 0.37 1.53 313.5 0 -100.0
Fluid Milk Producer Price $/hl $55.73 $ 43.00 -22.8 $ 43.00 -22.8
Industrial Milk Producer Price $/hl $47.41 $ 34.00 -28.3 $ 35.41 -25.3
Producer Blend Milk Price $/hl $49.95 $ 36.57 -26.8 $ 37.64 -24.6
Price of Fluid Milk, plant gate $/hl $59.08 $ 43.00 -27.2 $ 43.00 -27.2
Price of Industrial Milk, plantgate $/hl $50.84 $ 34.00 -33.1 $ 35.41 -30.4
Wholesale Price of FluidMilk, ex plant $/hl $59.71 $ 43.63 -26.9 $ 43.63 -26.9
Wholesale price of IndustrialMilk Products, ex plant $/hl $53.01 $ 41.60 -21.5 $ 43.01 -18.9
US Fluid Milk Price, importbasis $/hl $43.00 $ 43.00 $ 43.00
US Industrial Milk Price,export basis $/hl $34.00 $ 34.00 $ 34.00
Gross Revenue from MilkSales mil. dol. $3,461.30 $ 2,971.68 -14.1 $ 2,975.44 -14.0
Rental Value of ProductionQuota mil. dol. $1,248.82 $ 0.00 $ 0.00
Gross Revenue less RentalValue of Quota mil. dol. $2,212.48 $ 2,971.68 34.3 $ 2,975.44 34.5
Gross revenue from milk sales, excluding the direct federal subsidy, is $3,461 millionunder the current policy. Gross revenue is estimated to fall by about 14 percent under freetrade to just under $3 billion. However, the annual rental value of production quota, underthe base assumptions is $1,249 million. Deducting the $1,249 million from gross revenueleaves about $2.2 billion to cover production costs and to provide a return to non-quotaassets. This "net" return is 34 percent less than under the free trade assumptions. Theopportunity cost of quota is not an out-of-pocket expense for all producers, but for newentrants the cost of quota is a major expense.
Historically, quota holders have benefitted from the rising value of quota. Over thepast 10 years, the value of Ontario's used industrial milk quota has increased at a compoundrate of 5.3 percent per year. At 1993 quota values, this represents a capital gain of $370million, or $5/hl. If capital gains are taken into account, the gross return to non-quota assetsrises to $2,582 million - still less than under free trade assumptions.
256

Meilke, Sarker and Le Roy
The results presented in Table 8 are contingent on the assumptions made about the
base parameters. In the remainder of this section, the sensitivity of the results to these
assumptions are examined. The focus of the sensitivity analysis is on three variables. The
first of the three variables is Canada's net exports of dairy products. Net exports captures
both supply and demand changes in a single indicator. In both Base scenarios and under the
current policy, net exports are close to zero. The other two variables reported are Canada's
industrial and blend milk prices. Industrial and blend milk prices show how the base
parameter assumptions influence the returns received by Canadian dairy producers. Under
the Base assumptions Canada's industrial milk price is either at, or close to, the export floor
price of $34/hl. Sensitivity analysis is conducted on six parameters: 1) the marginal cost of
production; 2) the shut-down price; 3) the milk supply elasticity; 4) the milk demand
elasticities; 5) the industrial milk processing margin; and 6) U.S. milk prices.
Sensitivity Analysis: Marginal Cost of Production
Figure 2 describes the effect of increasing marginal cost to $45/hl from $30/hl while
holding the shut-down price at $22/hl. This corresponds to a situation where "average"
production costs change, but the costs of the most efficient producers are held constant at a
low level. In all cases, the assumed marginal cost is imposed on the milk supply curve at 74
mhl.
Figure 2 illustrates that at marginal costs below $32/hl, Canada is a small net exporter
of dairy products. At marginal costs of production between $33/hl and $38/hl Canada is self
sufficient. Marginal costs above $38/hl imply that Canada begins to import dairy products.
If Canada's marginal cost, at 74 mhl, is as high as $45/hl then Canada would import 11.56
mhl of dairy products. An import level of 11.56 mhl of dairy products represents 15 percent
of domestic consumption. As a consequence of higher marginal costs, milk production in
Canada would drop to 65.3 mhl from 74 mhl (-11.8%).
Figure 2. Net Exports at Various Values for Canada's Marginal Cost: Holding
Shut-Down Price at $22/hl15.00
10.00
5.00
0.00 --- I . .
30 00 32.00 34.00 36.00 38.00 400 42.00 44.00 4600
-5.00
-10.00
-15.00
-20.00
marginal cost ($/hl)
257

Proceedings
Figure 3 shows the evolution of the industrial milk and blend milk prices as marginalcosts increase. The industrial milk price starts at the export floor price ($34/hl) and rises tothe import ceiling price($40/hl) by the time marginal costs reach $39/hl. The blend milkprice illustrates the effect of assuming that Canada always supplies the fluid milk market atthe import ceiling price of $43/hl.
Figure 3. Industrial and Blend Milk Price as Canada's Marginal Cost VariesBetween $30/hl and $45/hl
44
42
40
38
36
34
-2- industrial milk price32
30 I30.00 32.00 34.00 36.00 38.00
marginal cost ($/hl)
40.00 42.00 44.00 46.00
In the next scenario the $11/hi difference between the shut-down price and themarginal cost is maintained rather than holding the shut-down price at $22/hl, as in theprevious scenario. As marginal costs are increased from $30 to $45/hl the shut-down priceis increased to $34 from $19/hi. The outcome is illustrated in Figure 4 and Figure 5. In thissituation, Canada begins to import dairy products at a marginal cost of $39/hl and by the timemarginal costs reach $45/hl net imports equal 13 mhl, about 1.5 mhl more than in theprevious scenario, which maintained a lower shut-down price.
Figure 4. Net Exports at Various Values for Canada's Marginal Cost: Shut-DownPrice Eleven Dollars Less than Marginal Cost
15.00
10.00
5.00
0,00 * a * ; ~ -- I I I3000 32.00 34.00 36.00 38.00 " 40 42.00 44.00 46
-5.00
-10.00
-15.00
-20.00
marginal cost ($/hl)
I - blend price i
ExsW
258

Meilke, Sarker and Le Roy
Figure 5. Industrial Milk and Blend Price as Canada's Marginal Cost Varies
Between $30/hl and $45/hl and the Shut-Down Price from $19-$34/hl
44 I
42
- 38
36
34 i
32.00 34.00 36.00 38.00 40.00 42.00 44.00 46.00
marginal cost ($/hl)
In the final marginal cost scenario it is assumed the shut-down price is only six dollars
below the marginal cost instead of eleven dollars. Again, the shut-down price is allowed to
increase with the marginal cost, always remaining $6/hl below the illustrated value of
marginal cost in Figure 6 and Figure 7. By the time marginal cost reaches $45/hl and the
shut-down price $39/hl, Canada becomes a net importer of 18.6 mhl of dairy products. Milk
output declines to 58.3 mhl, a decline of 21.2 percent from current levels.
Figure 6. Net Exports at Various Values of Canada's Marginal Cost: Shut-Down
Price Six Dollars Less than Marginal Cost
15.00
10.00
5.00
0.003 00 32.00 34.00 36.00 38.00 4Q 42.00 44.00 4
-5.00
-10.00
-15.00
-20.00
marginal cost ($/hl)
blend price
industrial mk p * --
^^^--*^^^ ^^' ~~~industrial milk price
30 -30.C
_Nj__ I
I
I.· . ,
259
)O0
- --

Proceedings
Figure 7. Industrial Milk and Blend Price as Canada's Marginal Cost VariesBetween $30/hl and $45/hl and the Shut-Down Price from $24-$39/hl
44
blend price42
38^ ^^9^^ ~~~~industrial price
40
36
34
32
30
30.00 32.00 34.00 36.00 38.00 40.00 42.00 44.00 46
marginal cost ($/hl)
Sensitivity Analysis: Shut-Down Price
In this scenario, the shut-down price is varied from $20/hl to $28/hl while holding themarginal cost at $33/hl. Variations over this range maintain Canada's no trade position.Moreover, variations in the shut-down price have little effect on the industrial or blend milkprice. Total milk output varies from 79.1 mhl with a shut-down price of $20/hl, to 78.9 mhlwith a shut-down price of $28/hl. The small response of supply to the shut-down price is notsurprising since the supply inducing price is above the assumed marginal cost.
Sensitivity Analysis: Supply Elasticity
In Figure 8, the supply elasticity is varied from 0.5 to 2.0 holding the marginal costand shut-down price constant at the base values. The variation in the supply elasticity doesnot change Canada's no trade position, but it does influence the autarky industrial milk price.As the supply elasticity is increased, output expands. Production is 78.2 mhl when thesupply elasticity is 0.5, and increases to 79.6 mhl when the supply elasticity is 2.0. Theadditional output is enough to lower the equilibrium domestic price for industrial milk from$37.27/hl to $34.27/hl.
Sensitivity Analysis: Demand Elasticities
Figure 9 shows the effect on the equilibrium prices of industrial and blended milk asthe demand elasticities for industrial milk and fluid milk are varied. The demand elasticityfor industrial milk is varied from -0.20 to -0.90 (shown) while the elasticity of demand forfluid milk is increased simultaneously from -0.05 to -0.40 (not shown). Canada remains ina no trade situation as quantity demanded increases from 76.1 mhl at low demand elasticities,
.00O
260

Meilke, Sarker and Le Roy 261
to 82.9 mhl with large price elasticities. Over the simulated range of demand elasticities,
the equilibrium industrial milk price rises from $34.00/hl to $37.48/hl.
Figure 8. Industrial and Blend Milk Price at Various Domestic Supply Elasticities
40
39
38 » blend price
37 -industrial p e
36
35
340.00 0.20 0.40 0.60 0.80 1.00
elasticity of suppl)
Figure 9. Industrial and BlendElasticities
1.20 1.40 1.60 1.80 2.00
Milk Price with Various Domestic Demand
30.00 !
0.1 0.2 0.3 0.4 0.5 0.6 0.7 0.8 0.9
price elasticity, industrial milk, absolute value
Sensitivity Analysis: Processing Margin
The result of lowering Canada's assumed processing margin to $3.80 from $7.60 is
shown in Table 9 where they are compared to the current policy base and to Base 2. The
lower processing margin increases Canada's demand for processed dairy products. The
lower processing margin also raises the industrial milk price received by producers to $36.17,

Proceedings
from $35.41 in Base 2. Industrial milk demand and milk production both increase about 1.5mhl in comparison with Base 2 and Canada remains in a no trade situation.
Table 9. Current, Free Trade Base 2 and Industrial Processing Margin Reduced to 50Percent of Current Level
VARIABLE
Fluid Milk Demand mhl
Industrial Milk Demand mhl
Total Domestic Milk
Demand mhl
Total Milk Supply mhl
Net Exports of Milk
Products mll
Fluid Milk Producer Price $/hl $
Industrial Milk ProducerPrice $/hl $
Producer Blend Milk Price $/hl $
Price of Fluid Milk, plantgate
Price of Industrial Milk,plant gate
Wholesale Price of FluidMilk, ex plant
Wholesale price ofIndustrial Milk Products, explant
US Fluid Milk Price, importbasis
POLICY
BASE BASE 2
value value % change
22.57 23.18 2.7
51.06 55.88 9.4
73.63
74.00
79.05 7.4
79.05 6.8
0.37 0 -100.0
55.73 $ 43.00 -22.8 $
47.41 $ 35.41 -25.3 $
49.95 $ 37.64 -24.6 $
$/hl $ 59.08 $ 43.00 -27.2 $
$/hl $
$/hl $
50.84 $ 35.41 -30.4 $
59.71 $ 43.63 -26.9 $
$/hl $ 53.01 $ 43.01
$/hl $ 43.00 $ 43.00
FREETRADE
50 % Lower
ProcessingMargin
value % change
23.18 2.7
57.34 12.3
80.52
80.52
9.4
8.8
0 -100.0
43.00 -22.8
36.17 -23.7
38.14 -23.6
43.00 -27.2
36.17 -28.9
43.63 -26.9
-18.9 $ 39.97 -24.6
0.0 $ 43.00US Industrial Milk Price,
export basis $/hi $ 34.00 $ 34.00 0.0 $Gross Revenue from Milk mil.Sales dol. $ 3,461.30 $ 2,975.44 -14.0 $Rental Value of Production mil.Quota dol. $ 1,248.82 $ 0.00 -100.0 $Gross Revenue less Rental mil.Value of Quota dol. $ 2,212.48 $ 2,975.44 34.5 $
0.0
34.00 0.0
3,071.03 -11.3
0.00
3.071.03 38.83071.03 38.8
Sensitivity Analysis: U.S. Milk Prices
Figure 10 illustrates the effect on Canada's net exports of dairy products as the U.S.industrial milk price increases from $30/hl (US$9.50/cwt) to $45/hl (US$14.25/cwt). Thefluid milk price remains $3/hl higher. At U.S. prices below $38/hl (US$12.00/cwt) Canada
FREEUNITS CURRENT TRADE
-
262

Meilke, Sarker and Le Roy
is either self-sufficient or a small net exporter. If the U.S. price increases to $45/hl Canada
would export 14.7 mhl of dairy products and produce 90.3 mhl, 22 percent more than current
output. Over the range of U.S. industrial milk prices from $33/hl (US$10.45/cwt) to
$38.00/hl (US$12.00/cwt) Canada would be self-sufficient in milk production. The effects
on prices are shown in Figure 11.
Figure 10. Industrial Milk and Blend Price as Canada's Marginal Cost Varies
Between $30/hl and 45/hl and the Shut-Down Price from $24-$39/hl
$44
$42
$40
$38
$36
$34
$32
$30
$30 $32 $34 $36 $38
marginal cost ($/hl)
$40 $42 $44 $46
Summary of Sensitivity Analysis
The most striking feature of the sensitivity analysis is the robustness of a small or no
trade solution. Only when Canada's marginal cost of milk production is quite high relative
to the U.S. market price, does Canada become a significant net importer of milk and dairy
products. Likewise, Canada only becomes a significant exporter when U.S. prices rise
sharply relative to Canada's marginal cost of production. The results also indicate the
importance of taking into account Canada's output restrictions. Even though Canadian milk
prices fall from current levels in nearly all of the simulations, Canada's milk production often
expands, or contracts only modestly.
263

Proceedings
Figure 11. Industrial and Blend Price as the Shut-Down Price Varies from $20-$28/hlHolding Marginal Cost at $33/hl
$40
$39
$38blend price
$37
$36
$35
$34 i$20 $21 $22 $23 $24 $25 $
shut-down price (S/hl)
26 $27 $28 $29 $30
It is impossible to capture all of the subtleties of interregional trade in a non-spatialpartial equilibrium model. In the next section three studies of the North American dairymarket are reviewed. Two of these models are spatial equilibrium models that provide anindication of the potential sources and destinations of product. In addition, the importanceof assumptions in reaching the conclusions taken from the papers are highlighted.
THE RESULTS FROM OTHER STUDIES OF TRADE LIBERALIZATION
Hallberg and Baker use a spatial equilibrium model of the U.S. and Canadian dairymarkets to estimate the impact of freer trade7. The static analysis used by the authors is astandard approach to assess trade policy alternatives. Unfortunately, a fundamental error inthe specification of the supply side of the Canadian market leads the authors to drawerroneous conclusions from their analysis. The problem lies in the specification of Canada's
7 In preparing this review the authors have benefitted from unpublished comments onHallberg and Baker and Bromfield et al. prepared by Don McClatchy, Agriculture Canada.
industrial price
l I
264

Meilke, Sarker and Le Roy
raw milk supply curve based on observed price and quantity data8. Production quotas have
the effect of reducing the amount of milk produced at administered prices. The removal of
tariff barriers would lower Canada's milk prices but, with the removal of output controls,
milk production might increase. The possibility of lower prices and higher output is easily
seen in Figure 1.
Hallberg and Baker's results also rely on the assumption that dairy processing must
occur in the region where the milk is produced. The assumption that raw milk for
manufacturing purposes cannot move between regions maybe be realistic under current U.S.
regulations but it is less realistic under free trade assumptions. Processing costs can vary
across regions and over time. As a result, it may be advantageous for processing to be
located in some regions but not in others.
Bromfield, et al. estimate the impact on Canada's supply managed sectors of free
trade with the United States9. The effects on farmers, input suppliers, processors and further
processors are considered. The study predicts the economic impact of the elimination of
import tariffs on milk, milk products, poultry and eggs as of January 1, 1996. The impacts
are analyzed over the five-year period from 1996 to 2000 to allow for a separation between
transitional and longer-run effects.
The authors make several important assumptions. For milk and dairy products,
assumed price and production impacts are taken directly from the work of Hallberg and
Baker. Based on these results, Bromfield, et al. argue that free trade in milk and dairy
products would reduce Canada's producer prices by 25 percent, and milk output by at least
15 percent. While the estimated price decline seems reasonable, if the federal direct subsidy
is eliminated, it takes very pessimistic assumptions about Canada's marginal cost of
producing milk to generate significant output declines. Without significant declines in
Canada's milk output there is no way for U.S. dairy imports to fill 20 percent of Canadian
domestic consumption as argued by Bromfield, et al.
The results of Bromfield, et al. reinforce the notion that producers and processors in
all provinces would be adversely affected by free trade in milk and dairy products. The
annual average loss to the agricultural and food processing sectors, over the five years, was
estimated to be $3.2 billion. The annual loss in government revenues over the same period
was estimated at $3.6 billion. These loss estimates are based on the assumption that the
resources (capital, labour and land) currently used to produce milk and dairy products would
remain totally idle under trade liberalization. Roberts has revealed the unrealistic nature of
this assumption in anything other than the very short run. In addition, the consumer gains
which would offset the losses to producers and processors are not discussed fully. Hallberg
and Baker, and Doyon, Pratt and Novakovic argue that with freer trade, milk and dairy
8 The high price of milk production quota indicates that the quota is binding and
producers are not producing where marginal cost equals the market price of milk.
9 A NAFTA panel ruling in favour of the United States would require that Canada move
more quickly towards freer trade in dairy products but not necessarily to free trade. An adverse
panel ruling would be followed by further negotiations (Meilke).
265

Proceedings
products may move in both directions across the border. However, Bromfield et al. assumeunilateral trade in dairy products.
Doyon, Pratt, and Novakovic investigate the effects of two dairy trade scenariosbetween Quebec, Ontario, and the Northeast United States. In the first scenario, tradeconditions are changed to permit the United States to export yogurt and frozen desserts toCanada. The second scenario allows for an entirely free trade environment. A competitive,static, partial equilibrium, multicommodity, and multi-region linear programming model isused to determine the effects of the two trade liberalization policies. The model includesseven dairy products (fluid milk, frozen desserts, specialty cheese, dry and condensed milk,butter, yogurt, and cheddar cheese), 296 supply points, 184 consumption points, and 307processing points. The solution to the model depends only on marketing costs (transportationand processing costs). Economic agents are not allowed to react to variations in output orconsumption prices.
Two fundamental assumptions drive the results from this model. First, the quantitiesof raw milk consumed and produced in each region are fixed. Second, the costs associatedwith assembly, processing, and distribution, although different in each region, are fixed inthe assessment of the two alternative trade scenarios.
The results of policy changes on trade patterns are evaluated by comparison to a basesimulation. The base scenario reflects trade conditions that existed before the NAFTA andGATT'94 agreements. With only yogurt and frozen desserts exported to Canada in the firstsimulation, Quebec was adversely affected in all categories of dairy products except fluidmilk. Ontario's yogurt and ice cream sectors were also negatively affected. However,Ontario became a net exporter of specialty cheese.
The results of the second simulation (free trade) suggest there would be no significantmovement of fluid milk across international borders. Quebec relinquishes market share forall dairy products except cheddar cheese and ice cream. Ontario improves its trade positionfor all dairy products except yogurt and specialty cheese. The spatial equilibrium modeldocuments the source-destination trade flows.
The authors conclude that if trade restrictions are lifted on only some dairy products,new distortions are created which may cause more adjustment problems than if all traderestrictions were lifted simultaneously.
These three papers illustrate how the initial assumptions made in analyzing a probleminfluence the conclusions. In Hallberg and Baker, the assumptions of: 1) a sharp drop inCanadian milk production, and 2) that processing must occur only in the producing region,drive the result that the U.S. exports significant quantities of dairy products to Canada.Bromfield et al., relying largely on the price and output predictions of Hallberg and Bakerconclude that free trade would significantly reduce the welfare of Canada's milk producersand processors. Finally, Doyon et al. conclusions rest on their two initial assumptions: 1)fixed quantities of raw milk demanded and supplied, and 2) that the costs associated withassembly, processing, and distribution of milk and dairy products are fixed. Theseassumptions sharply limit the extent of adjustments in milk and dairy product trade, but do
266

Meilke, Sarker and Le Roy
illustrate how a fixed quantity of milk would be processed and transferred to minimize these
costs.
CONCLUSIONS
Trade flows in milk and dairy products between Canada and United States, with trade
liberalization, are likely to be small. In fact, no trade is a real possibility. For large ranges
of the key parameters driving dairy product trade - no trade was the estimated outcome. The
no trade finding is largely unaffected by changes in demand and supply elasticities for fluid
and industrial milk, changes in milk producers shut-down price and Canadian processing
margins for milk products. However, if the marginal cost of milk production in Canada is
above the landed price of dairy products from the United States, then Canada could become
a significant importer. Therefore, future research should focus on: 1) generating reliable
farm-level information on marginal cost by farm size, and 2) the effects of regulation on
average farm size and cost structures . It should be emphasized that while no net trade in
milk and dairy products between Canada and the United States is a possibility, there could
be significant intra-industry trade in differentiated milk and dairy products with trade
liberalization.
The base line results indicate that Canada's gross revenues from milk sales, excluding
the direct federal subsidy, decrease from $3,461 million to just under $3 billion with free
trade. However, the gross revenue under the current policy includes the opportunity cost of
milk quotas worth more than $0.8 million, even after allowing for the expected capital gains
on quota purchases. Since the existing production quotas would disappear with trade
liberalization, a pertinent policy question is: should dairy farmers be compensated for the loss
in quota value? Compensation to Canadian dairy farmers is an equity issue which the
Canadian government and taxpayers will have to confront.
Finally, several recent studies of trade liberalization in milk and dairy products
between Canada and the United States paint a rather gloomy picture for the Canadian dairy
industry in a free trade world. The gloom is, to a large extent, driven by unrealistic
assumptions about the dairy industry in Canada. Predictions made on the basis of more
reasonable assumptions suggest that net trade in dairy products between Canada and the
United States is likely to be small following North American trade liberalization.
REFERENCES
Agriculture Canada. 1980. Food and Agriculture Regional Model (FARM). Policy,
Planning and Economics Branch, Agriculture Canada, Ottawa.
267
Proceedings
Agriculture Canada. 1995a. The Canadian Dairy Sector. Structure, Performance andPolicies. Background paper for the Canada-U.S. Dairy Workshop, Economic andPolicy Analysis Directorate, Ottawa, September.
Agriculture Canada. 1995b. Medium Term Outlook. Ottawa.
American Agricultural Economics Associations. No date. Federal Milk Marketing Orders.A Review of Research on Their Economic Consequences. Task Force on DairyMarketing Orders.
Babcock, B. and W. Foster. 1992. "Economic Rents Under Supply Controls withMarketable Quota." American Journal of Agricultural Economics 74(3): 630-637.
Barichello, R.R. 1984. Analyzing an Agricultural Marketing Quota. Centre DiscussionPaper No. 454, Economic Growth Centre, Yale University, New Haven, Connecticut.
Barichello, R.R. 1981. The Economics of Canadian Dairy Industry Regulation. EconomicCouncil of Canada Technical Report No. E/12, Ottawa, Ontario.
Barichello, R. R. 1995. "Capitalizing Government Program Benefits: Evidence of the RiskAssociated with Holding Farm Quotas." J. M. Antle and D. A. Sumner, eds. TheEconomics of Agriculture Volume 2. Papers in Honor of D. Gale Johnson.University of Chicago Price, 1996, 283-299.
Barichello, R.R. and C. Cunningham-Dunlop. 1987. Quota Allocation and TransferSchemes in Canada. Working Paper No. 8/87, Policy Branch, Agriculture Canada,Ottawa.
Barichello, R. R. and B. K. Stennes. 1994. Cost Competitiveness of the Canadian DairyIndustry. A Farm Level Analysis. Working Paper 94-6, Department Of AgriculturalEconomics, University of British Columbia, June.
Bromfield, Geoff, Robert Jenness, and Martha Justus. 1995. NAFTA TRA Panel - EconomicImpact Analysis. Informetrica Limited, Ottawa, October.
Chavas, J.-P. and R. Klemme. 1986. "Aggregate Milk Supply Response and InvestmentBehaviour of U.S. Dairy Farms." American Journal of Agricultural Economics68(1):55-66.
Chen, K. and K. Meilke. 1995. The Simple Analytic of Transferable Production Quota.Implications for the Marginal Cost of Ontario Milk Production. Paper presented atthe CAEFMS Annual Meeting, Ottawa.
Cozzarin, B. 1993. The Dairy Component of the Farm Model in EXCEL SpreadsheetFormat. Technical Report 3/93. Policy Branch, Agriculture Canada. August.
Curtin, L., D. Theoret and M. Zaferiou. 1987. Demandfor Foods in Canada. RecentEstimates. Working Paper No. 13/87, Policy Branch, Agriculture Canada, Ottawa.
268

Meilke, Sarker and Le Roy
Dahlgran, R.A. 1985. "A Synthesis of Microeconomic Duality Theory and Distributed Lag
Modeling with Implications for U.S. Dairy Policy." North Central Journal of
Agricultural Economics 7(1): 132-144.
Dairy Farmers of Canada. 1995. Dairy Facts and Figures at a Glance. Ottawa.
de Gorter, H. 1992. The Measurement of Supply Management Regulations for Net Benefit
Calculations. Report prepared for the Agricultural Stabilization Board, Agriculture
Canada, Ottawa.
Diewert, E. 1984. "The Measurement of Deadweight Loss in an Open Economy."
Economica 51(1): 23-42.
Doyon, Maurice A., James E. Pratt, and Andrew M. Novakovic. 1996. Regional Impact of
Change in Dairy Trade Policies on the Northeast U.S. and Central Canada Dairy
Sectors. Paper presented at the American Agricultural Economics Association annual
meeting, 28-31 July, San Antonio, Texas.
Elterich, G. J. and S. Masud. 1980. "Milk Supply Response in Delaware." Northeastern
Journal of Agricultural Economics 9(1): 41-45.
Fang, C. 1996. Dynamic Optimal Producer Advertising and Research Investment Decisions
The Case of Milk in Canada. Unpublished analysis. Department of Agricultural
Economics and Business, University of Guelph, Ontario.
Forbes, J. D., D. R. Hughes and T. K. Warley. 1982. Economic Intervention and Regulation
in Canadian Agriculture. Department of Supply and Services for the Economic
Council of Canada, Ottawa.
Fox, G., B. Roberts and G. Brinkman. 1992. "Canadian Dairy Policy and the Returns to
Federal Dairy Cattle Research." Agricultural Economics 6(2):267-285.
Goddard, E. and A. Tielu. 1995. Investment in Advertising and Research in the Canadian
Dairy Industry. Paper presented at the Western Canadian Dairy Seminar, Red Deer,
Alberta.
Goddard, E. and A. Amuah. 1989. "The Demand for Canadian Fats and Oils: A Case Study
of Advertising Effectiveness." American Journal of Agricultural Economics 71(3):
741-749.
Goddard, E. and A. Tielu. 1988. "Assessing the Effectiveness of Fluid Milk Advertising in
Ontario." Canadian Journal of Agricultural Economics 36(2):261-278.
Goddard, E. and M.L. McCutcheon. 1993. "Optimal Producer Investment in Generic
Advertising-The Case of Fluid Milk in Ontario and Quebec." Canadian Journal of
Agricultural Economics 41(3):329-348.
Graham, J., B. Stennes, R. MacGregor, K. Meilke and G. Moschini. 1990. The Effects of
Trade Liberalization on the Canadian Dairy and Poultry Sectors. Working Paper No.
3/90, Policy Branch, Agriculture Canada, Ottawa.
269

Proceedings
Hallberg, M. C. and A. Derek Baker. 1994. Consequences of Free Trade in Dairy ProductsBetween Canada and the United States. Staff Paper 267. Department of AgriculturalEconomics and Rural Sociology, Pennsylvania State University, October.
Halpern, P., K. Meilke. W. Miner and R. Romain. 1991. The Competitiveness of theCanadian Dairy Industry. An Evaluation of the Dairy Industry Studies. Reportprepared for Industry, Science and Technology and the Task Force on National DairyPolicy, Ottawa.
Helmberger, P. and Y.-H., Chen. 1994. "Economic Effects of U.S. Dairy Programs."Journal of Agricultural and Resource Economics 19(2):225-238.
Hickling Management Consultants. 1990. International Competitiveness of Dairy FoodProcessing in Ontario and Quebec. Report prepared for Industry, Science andTechnology Canada, Food Policy Task Force and Subsidy Analysis Branch, Ottawa.
Howard, W.H. and C.R. Shumway. 1988. "Dynamic Adjustment in the U.S. DairyIndustry." American Journal of Agricultural Economics 70(4):837-847.
Industry, Science and Technology Canada. 1991. Canada's Food Processing Industry. ACompetitiveness Analysis of Principal Industrial Milk Products. Ottawa.
International Agricultural Trade Research Consortium. 1994. The Uruguay RoundAgreement on Agriculture. An Evaluation. Commissioned Paper No. 9. St. Paul,MN., July.
Kaiser, H.M., D.H. Streeter and D.J. Liu. 1988. "Welfare Comparisons of U.S. DairyPolicies with and without Mandatory Supply Control." American Journal ofAgricultural Economics 70(4):848-858.
Kinnucan, H. 1987. "The Effects of Generic Advertising on Milk Demand: The Case of theBuffalo, N.Y., Market." Canadian Journal ofAgricultural Economics 35(1): 181-196.
Kinnucan, H., and O. Forker. 1986. "Seasonality in the Consumer Response to MilkAdvertising with Implications for Milk Promotion Policy." American Journal ofAgricultural Economics 68(3):562-571.
LaFrance, J. and H. de Gorter. 1985. "Regulation in a Dynamic Market: The U.S. DairyIndustry." American Journal of Agricultural Economics 67(4):821-832.
Lermer, G. and W. Stanbury. 1985. "Measuring the Cost of Redistributing Income by meansof Direct Regulation." Canadian Journal of Economics 18(1): 190-207.
MacGregor, R. J., B. Junkins, D. Barber. 1994. Changing the Method of Payment of theWestern Grain Transportation Subsidy: Regional Impact Analysis. Paper preparedfor the Producer Payment Panel. Agriculture and Agri-Food Canada, Policy Branch,Ottawa, April.
Martin, L. J. 1995. The Coming Clash over Canada's Dairy and Poultry Tariffs. SpecialReport, George Morris Centre, Guelph, July.
270
Meilke, Sarker and Le Roy
Meilke, K. D. 1995. "Sizing Up the Canada-U.S. Dairy and Poultry Dispute." Policy Options
16(9):15-18.
Meilke, K. D. and Ema van Duren. 1995. "The Status Quo is a Definite Possibility." Ceres
27(1):35-38.
Meilke, K. D. And Ema van Duren. 1996. "The North American Free Trade Agreement and
the Agrifood Sector: A Canadian Perspective." Canadian Journal of Agricultural
Economics (Forthcoming).
Meilke, K. D. and B. Larue. 1989. "An Quantitative Assessment of the Impacts of Trade
Liberalization on Canadian Agriculture." Agriculture in the Uruguay Round of GATT
Negotiations: Implications for Canada's and Ontario's Agrifood System. AEB 89/6,
Department of Agricultural Economics and Business, University of Guelph, July,
46-74.
Moschini, G. 1988a. "A Model of Production with Supply Management for the Canadian
Agricultural Sector." American Journal ofAgricultural Economics 70(2):318-329.
Moschini, G. 1988b. "The Cost Structure of Ontario Dairy Farms: A Microeconometric
Analysis." Canadian Journal of Agricultural Economics 36(2):187-206.
Moschini, G. and K. Meilke. 1988. "Sustainable Rates of Return for Milk Quotas in
Ontario." Canadian Journal of Agricultural Economics 36(1): 119-126.
Moschini, G. and D. Moro. 1993. A Food Demand System for Canada. Technical Report
No. 1/93, Policy Branch, Agriculture Canada, Ottawa.
Ontario Dairy Farm Accounting Project 1994. 1995. Ontario Ministry of Agriculture, Food
and Rural Affairs. Toronto.
Ontario Milk Marketing Board. 1995. Dairy Statistical Handbook 1993-1994. 10th ed.,
Toronto.
Ontario Ministry of Agriculture, Food and Rural Affairs. 1993. Ontario Farm Management
Analysis Project 1993. Toronto.
Roberts, R. D. 1994. The Choice. A Fable of Free Trade and Protectionism. Prentice-Hall,
New Jersey.
Roningen, V. O. 1993. Managing Free Trade for Agriculture. Washington, D. C.: National
Center for Food and Agricultural Policy.
Roningen, V. 0. and P. M. Dixit. 1989. Economic Implications of Agricultural Policy
Reforms in Industrial Market Economies. Staff Report AGES 89-36, Agriculture and
Trade Analysis Division, Economic Research Service, U. S. Department of
Agriculture, August.
Rude, J. 1992. The Impact of Trade Liberalization on the Canadian Dairy Processing
Industry. Ph.D. thesis. Department of Agricultural Economics and Business,
University of Guelph.
271

Proceedings
Schmitz, A. and T. Schmitz. 1994. "Supply Management: The Past and Future." Can. J. Agr.Econ. 42(2):125-48.
Stonehouse, D.P. 1987. A Profile of the Canadian Dairy Industry and Government Policies.Working Paper No. 4/87, Policy Branch, Agriculture Canada, Ottawa.
Stonehouse, D.P. and E. Kizito. 1990. A Quarterly Econometric Model of the CanadianDairy Industry. Working Paper No. 4/90, Policy Branch, Agriculture Canada,Ottawa.
Thompson, S. and D. Eiler. 1977. "Determinants of Milk Advertising Effectiveness."American Journal ofAgricultural Economics 59(2):330-335.
Thraem, C. and J.W. Hammond. 1983. Price Supports, Risk Aversion, and US. DairyPolicy. Economic Report #83-9. Department of Agr. and Applied Economics,University of Minnesota.
U. S. Dept. Of Agriculture. 1996. The U. S. Dairy Industry. Background paper for theCanada-U.S. Dairy Policy Workshop. Economic Research Service, January.
Varian, H. 1992. Microeconomic Analysis. 3rd ed. New York: W.W. Norton and Company,Inc.
Veeman, M. 1984. "Social Costs of Supply-Restricting Marketing Boards." CanadianJournal ofAgricultural Economics 30(1):21-36.
Veeman, M. And Y. Peng. 1995. Canadian Dairy Demand. Department of RuralEconomy, University of Alberta, October.
Venkateswaran, M. and H. Kinnucan. 1990. "Evaluating Fluid Milk Advertising in Ontario:The Importance of Functional Form." Canadian Journal ofAgricultural Economics38(3):471-488.
272