Embed Size (px)
Citation preview
391
ANALYZING THE TRAVEL PATTERNS OF
CONSTRUCTION WORKERS
Jochen Teizer, Ph.D., Assistant Professor
Uday Mantripragada, M.S. Student
Manu Venugopal, Ph.D. Student
School of Civil and Environmental Engineering
Georgia Institute of Technology
790 Atlantic Dr. N.W., Atlanta, GA 30332, U.S.A.
Phone: +1-404-894-8269, Fax: +1-404-894-2278
E-Mail: [email protected]
ABSTRACT
This paper describes a new framework and its algorithms of using frequent positioning data to entitle rapid learning among
construction site managers and workers for safety. If collected accurately and in real-time, the location, speed, and
trajectory of construction resources (e.g., workers, equipment, materials) can lead to important information regarding travel
patterns. This information can then be shared among project stakeholders to improve work practices, e.g. the preconditions
for safe construction operations. Additionally, the overall analyses of travel patterns on construction sites can help in the
process of allocating resources more effectively to overall increase productivity and safety. Tracking and analyzing the
paths of construction resources has multiple applications in construction and is not limited to important tasks such as
monitoring the idle time of machines to reduce inefficiencies, tracking the path and location of materials to reduce search
times, or signalling hazardous zones to workers to improve work zone safety.
KEYWORDS
Obstacle Detection and Avoidance, Path Planning, Safety, Tracking, Ultra Wideband, Work Zone
1. INTRODUCTION
In the period from 1995 to 2002, 802 workers in the
United States’ construction industry were fatally
injured when struck by a vehicle or mobile
equipment. 258 of these deaths were caused by the
following construction vehicle types: Dump truck
(41%), grading/surfacing machine (14.3%),
excavation machine (6.5%), semi-truck (6%), other
truck (14%), other machine (10.4%), and other
vehicles/sources (7.7%) [1]. These statistics are
alarming, since many passive safety tools (e.g.,
precautions and interventions such as jersey barriers
and Internal Traffic Control Plans (ITCP)) and
active safety tools (e.g., Proximity Warning Systems
(PWS)) exist and aim to protect construction
workers.
To solve this safety problem, the use of semi-
automated and automated real-time project safety
control in construction is not an illusionary vision
any more. As far as the availability of technologies
for measuring project performance indicators is
concerned, a number of advanced technologies that
are appropriate for onsite measurement are maturing,
their accuracy and integrity are improving, and their

392
costs are declining [2]. Among them are: Global
Positioning Systems (GPS), Laser Detection and
Ranging (LADAR), Vision Camera, Audio
Technology, Radio Detection and Ranging
(RADAR), Radio Frequency Identification (RFID),
Ultra Wideband (UWB), and infrared heat and
magnetic sensors. A more detailed technical
discussion on the benefits and limitations can be
found in Navon and Sacks [3]. Teizer et al. [4] has
conducted experiments using Ultra Wideband
(UWB) technology in the object cluttered
construction environment.
This paper presents preliminary research efforts
using emerging technology and data processing to
improve safety training and education, and provide
workers and safety personnel with the tools to
prevent incidents pro-actively.
2. BACKGROUND
In a review of scientific literature and relevant
Fatality Assessment and Control Evaluation (FACE)
investigations, safety data analysis demonstrate that
“road construction workers were as likely to be
struck by a construction vehicle (48% of cases) as by
a passing motorist” [5]. Contributing factors include:
Lack of knowledge about specific risk factors,
insufficient evaluation and adaptation of intervention
technologies and newly developed approaches used
in other industries, lack of adequate guidelines,
particularly for controlling vehicle and worker
movements inside the work zone, and lack of
educational and training resources for non-English
speaking workers. For these reasons, research
objectives have been identified to coordinate
vehicle/equipment movement inside the work zone
and to develop measures for preventing workers-on-
foot from being struck by motor vehicles and
equipment:
• Focus on blind areas around construction
vehicles and equipment, e.g., area around a
vehicle or piece of construction equipment that
is not visible to the operators, either by direct
line-of-sight or indirectly by use of internal and
external mirrors.
• Limit exposure of workers-on-foot to
construction traffic.
• Reduce hazards for equipment operators, e.g.,
running over people, materials, striking other
equipment and vehicles, rollovers, and contact
with utilities.
• Develop exposure monitoring system(s), e.g.,
evaluating peed control, night work.
• Evaluate injury prevention measures.
3. METHODOLOGY
It is commonly known that the overall safety culture
of a company depends on the executive
commitment, a formal and informal safety system,
operation personnel, and safety best practices and
methods in place to prevent mishaps. Accident
investigations integrated with the science of human
behaviour and the identification of specific
contributing factors involved demonstrate a
significant lack of real data that often prevents valid
assessment of human error causes. In advance of
human factors, investigators receiving training in the
science of human behaviour before joining an
investigating team, it might become essential to
assist existing practices in place with the following
methodology [6]:
• Use of existing and emerging technology as
neutral data collection tool designed within a
human error analysis process.
• Automate validation, and interpretation of
employee baseline capabilities to assess
supervisors’ or workers’ behaviours, in addition
to cognitive skills, in areas of critical thinking,
leadership, and problem solving.
• Develop pro-active technology for real-time
hazard warning.
• Improve training, educational tools, and
methods within a framework of human error
principles.
As a result of today’s practices, this research tries
collecting unrecorded data, processing and analyzing
data, visualizing information to all stakeholders
(workers, supervisors, managers, etc.), and
implementing new knowledge into the training
procedure. Frequent positioning data of construction
resources (worker’s path) is collected and processed
using the following algorithms. Although obstacles
can be detected by many technologies, safe travel
paths may depend on accurate historical data of
393
previously recorded safe paths. These safer paths
can then be used to allow for the continuous
detection of obstacles and of safe routes.
4. ALGORITHMS
Detecting construction obstacles automatically is a
major challenge and is critical for the safety of
workers on a construction site. An intelligent
method is presented that allows for the detection of
obstacles based upon the path the construction
resources take. Once obstacles are detected safer
routes can be planned.
A lot of work has been accomplished in the field of
path planning. Pendragon and While proposed the
safe navigation of robots through the tessellation of
obstacles [7]. By growing a virtual bubble around
each obstacle, a robot can always keep a safe distance
to the obstacle(s). Since this technique does not help
further in identifying the shortest path between two
points, different techniques based on artificial
intelligence for path planning were identified. Morad
et al. identified the travel path by defining the
environment as a collection of complex states which
can be solved using a set of operations [8]. Although
these “out-of-sequence” modelling technique can
avoid obstacles, it does not identify shortest paths.
Similarly, many literature sources pre-identify
obstacles for planning robot routes. For obstacle
avoidance, many algorithms find convex hulls that
are computationally intensive and use recursion to
identify holes/hulls within the given distribution [9].
In Dehne et al., a randomized convex hull detection
algorithm is introduced that operates successfully in
a three-dimensional (3D) space [10].
To find the shortest path in a given plane, Dijkstra’s
single-source shortest path algorithm for graphs can
be applied.
A combination of the two discussed approaches
(convex hull algorithm to identify the obstacles in
the path; shortest path algorithm to identify the
shortest path between two points) has been
developed. The following paragraphs will describe
the developed algorithm in mite detail. Experiments
and results will be presented for obstacle detection,
identification, and avoidance using UWB
positioning data.
5. EXPERIMENTS AND RESULTS
Different sensors exist to collect positioning data
[3,4]. Experiments with UWB technology collected
real-time (up to 60Hz) three-dimensional location
data of workers, their tag ID, and time stamp. The
goal of the experiments was to validate the
developed obstacle detection, avoidance, and path
planning algorithms.
Step 1: Considering construction resources (incl.
workers) navigate in 3D, the space is divided into an
occupancy grid with cube sizes of 0.1m x 0.1m x
0.1m [6].
Step 2: A counter in each cube records the number
of times a tag ID was present in the particular cube.
For example, each time a worker and his/her UWB
tag enter the same cube, the counter increments by 1.
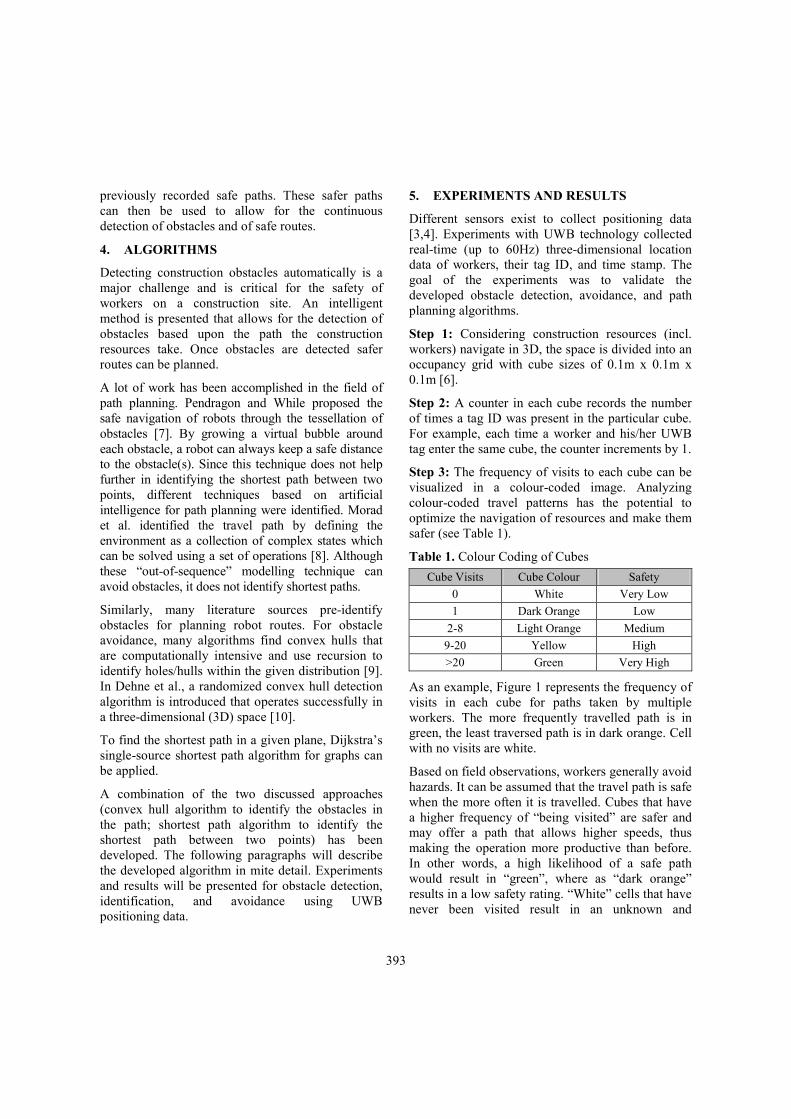
Step 3: The frequency of visits to each cube can be
visualized in a colour-coded image. Analyzing
colour-coded travel patterns has the potential to
optimize the navigation of resources and make them
safer (see Table 1).
Table 1. Colour Coding of Cubes
Cube Visits Cube Colour Safety
0 White Very Low
1 Dark Orange Low
2-8 Light Orange Medium
9-20 Yellow High
>20 Green Very High
As an example, Figure 1 represents the frequency of
visits in each cube for paths taken by multiple
workers. The more frequently travelled path is in
green, the least traversed path is in dark orange. Cell
with no visits are white.
Based on field observations, workers generally avoid
hazards. It can be assumed that the travel path is safe
when the more often it is travelled. Cubes that have
a higher frequency of “being visited” are safer and
may offer a path that allows higher speeds, thus
making the operation more productive than before.
In other words, a high likelihood of a safe path
would result in “green”, where as “dark orange”
results in a low safety rating. “White” cells that have
never been visited result in an unknown and
394
potentially hazardous area. As a result, the frequency
of cube visits can become a safety indicator.
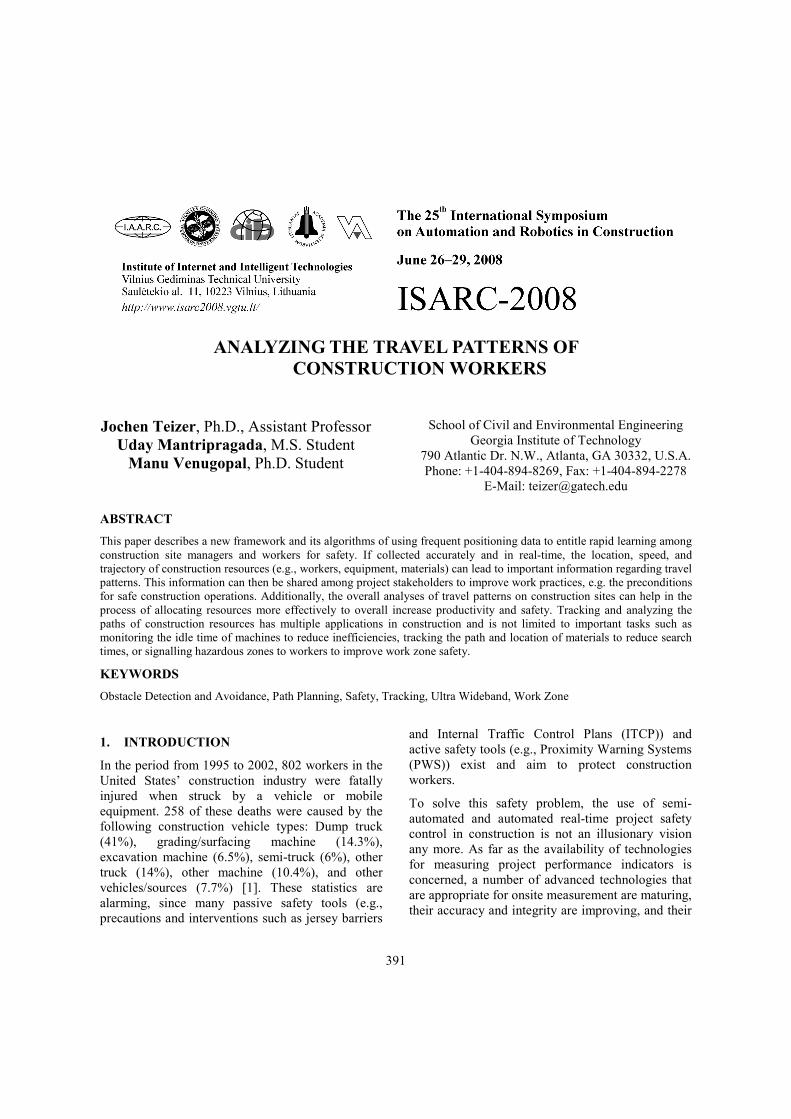
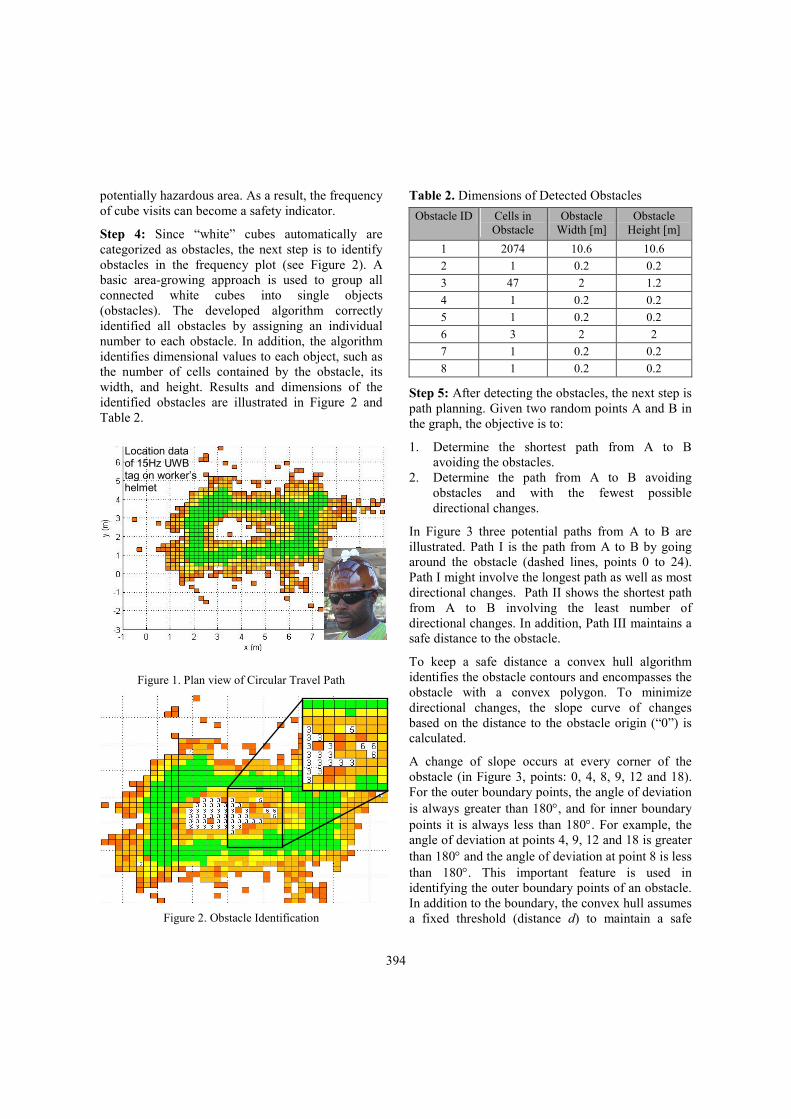
Step 4: Since “white” cubes automatically are
categorized as obstacles, the next step is to identify
obstacles in the frequency plot (see Figure 2). A
basic area-growing approach is used to group all
connected white cubes into single objects
(obstacles). The developed algorithm correctly
identified all obstacles by assigning an individual
number to each obstacle. In addition, the algorithm
identifies dimensional values to each object, such as
the number of cells contained by the obstacle, its
width, and height. Results and dimensions of the
identified obstacles are illustrated in Figure 2 and
Table 2.
Figure 1. Plan view of Circular Travel Path
Figure 2. Obstacle Identification
Table 2. Dimensions of Detected Obstacles
Obstacle ID Cells in
Obstacle
Obstacle
Width [m]
Obstacle
Height [m]
1 2074 10.6 10.6
2 1 0.2 0.2
3 47 2 1.2
4 1 0.2 0.2
5 1 0.2 0.2
6 3 2 2
7 1 0.2 0.2
8 1 0.2 0.2
Step 5: After detecting the obstacles, the next step is
path planning. Given two random points A and B in
the graph, the objective is to:
1. Determine the shortest path from A to B
avoiding the obstacles.
2. Determine the path from A to B avoiding
obstacles and with the fewest possible
directional changes.
In Figure 3 three potential paths from A to B are
illustrated. Path I is the path from A to B by going
around the obstacle (dashed lines, points 0 to 24).
Path I might involve the longest path as well as most
directional changes. Path II shows the shortest path
from A to B involving the least number of
directional changes. In addition, Path III maintains a
safe distance to the obstacle.
To keep a safe distance a convex hull algorithm
identifies the obstacle contours and encompasses the
obstacle with a convex polygon. To minimize
directional changes, the slope curve of changes
based on the distance to the obstacle origin (“0”) is
calculated.
A change of slope occurs at every corner of the
obstacle (in Figure 3, points: 0, 4, 8, 9, 12 and 18).
For the outer boundary points, the angle of deviation
is always greater than 180°, and for inner boundary
points it is always less than 180°. For example, the
angle of deviation at points 4, 9, 12 and 18 is greater
than 180° and the angle of deviation at point 8 is less
than 180°. This important feature is used in
identifying the outer boundary points of an obstacle.
In addition to the boundary, the convex hull assumes
a fixed threshold (distance d) to maintain a safe
Location data of 15Hz UWB tag on worker’s helmet

395
distance to each object. The blue boundaries in
Figure 6 demonstrate that all eight objects have been
classified and displayed using polygonal shaped
boundaries (with obstacle one being the large white
area surrounding the worker’s travel path).
The developed algorithms have been verified in
other data sets where the path of the worker varied.
Results to a worker walking in an “Eight” are
illustrated in Figures 6 and 7. Dimensional results
are presented in Table 3.
Figure 3. Path Planning
Figure 4. Slope Changes
Figure 5. Outer boundaries of obstacles
Figure 6. Path of a worker in the experiment
Figure 7. Outer boundaries of obstacles
Table 3. Dimensions of detected obstacles
Obstacle ID Cells in
Obstacle
Obstacle
Width [m]
Obstacle
Height [m]
1 2438 10.6 10.6
2 127 2.8 3
3 51 1.2 2.6
6. CONCLUSIONS
Emerging Ultra Wideband technology allowed
collecting spatial data of the trajectory of
construction workers. The presented and developed
algorithms are capable of locating and identifying
obstacles, and determining their dimensional values.
This new information can be used for safe path
planning efforts. Multiple application areas in
construction can benefit from this approach and in
particular the envisioned semi- or automated
navigation of robots. Future research will go beyond
analyzing the travel patterns of workers and will

396
focus on identifying work patterns among
construction resources (workers, machines, and
materials) to overall increase efficacy and safety.
7. ACKNOWLEDGMENT
This research is supported by the United States of
America National Science Foundation (NSF).
REFERENCES
[1] NIOSH (2007). Goal 1: Reduce the major risks
associated with traumatic injuries and fatalities in
construction. http://www.cdc.gov/niosh/
nas/construction (Accessed Dec. 1, 2007).
[2] Deng, Z. et al. (2001). An application of the
Internet-based project management system,
Automation in Constr., 10(2), 239–246.
[3] Navon, R. and Sacks, R. (2007). Assessing research
issues in Automated Project Performance Control
(APPC). Automation in Constr. 16, 474–484.
[4] Teizer, J., Lao, D., and Sofer, M. (2007). Rapid
Automated Monitoring of Construction Site
Activities using Ultra-Wideband. 24th ISARC,
Kochi, India, 23-28.
[5] Pratt S.G., Fosbroke D.E., and Marsh S.M. (2001).
Building safer highway work zones: measures to
prevent worker injuries from vehicles and equipment.
DHHS (NIOSH) Publication No. 2001-128.
[6] Teizer, J., Caldas C.H., and Haas, C.T. (2007). Real-
Time Three-Dimensional Occupancy Grid Modeling
for the Detection and Tracking of Construction
Resources. J. Constr. Eng. Mngmt, 133(11), 880-
888.
[7] Pendragon, T. and While, L. (2003) Path-planning
by tessellation of obstacles, Proceedings of the 26th
Australian Computer Science Conference, Adelaide,
Australia, 2003.
[8] Morad, A.A., Cleveland, A.B., Beliveau, Y.J.,
Fransisco, V.D., and Dixit, S.S. (1992) Path-Finder:
AI-Based Path Planning System, Journal of
Computing in Civil Engineering, Vol. 6, No. 2, 114-
128.
[9] Barber, C.B., Dobkin, D.P., and Huhdanpaa, H.
(1996) The quickhull algorithm for convex hulls,
ACM Transactions on Mathematical Software, Vol.
22, No.4.
[10] Dehne, F., Deng, X., Dymond, P., Fabri, A., and
Khokhar, A.A. (1995) A randomized parallel 3D
convex hull algorithm for coarse grained
multicomputers, Proceedings of the 7th Annual
ACM symposium on Parallel Algorithms and
Architectures, Santa Barbara, California.