Embed Size (px)
Citation preview
ANALYZING THE USE OF AN ADVANCE BOOKINGCURVE IN FORECASTING HOTEL RESERVATIONS
Tony Sze Ming TseYiu Tung Poon
ABSTRACT. Although there is considerable interest in the advance bookings model as a forecastingmethod in the hotel industry, there has been little research analyzing the use of an advance bookingcurve in forecasting hotel reservations. The mainstream of advance booking models reviewed in theliterature uses only the bookings-on-hand data on a certain day and ignores the previous booking data.This empirical study analyzes the entire booking data set for one year provided by the Hotel ICON inHong Kong, and identifies the trends and patterns in the data. The analysis demonstrates the use of anadvance booking curve in forecasting hotel reservations at property level.
KEYWORDS. Advance bookings model, revenue management, forecasting, booking curve
INTRODUCTION
Revenue management (RM) in the hospital-ity sector is concerned with revenue maximiza-tion through the manipulation of room ratesoffered to customers (Sanchez & Satir, 2005).Implicit in managing revenue is the pricing ofdifferent room types, inventory control, alloca-tion of stock to different distribution channels,and forecasting demand. It is widely acceptedthat RM is inextricably associated with forecast-ing room demand (Andrew, Cranage, & Lee,1990; Anderson & Xie, 2010; Cranage, 2003;Cross, 1997; Cross, Higbie, & Cross, 2009;Helsel & Cullen, 2006; Kiely, 2008; Law,1998, 2004; Orkin, 1998; Schwartz & Cohen,2004; Upchurch, Ellis, & Seo, 2004;Weatherford, Kimes, & Scott, 2001; Yuksel,2007) and the development of a good
forecasting system is vitally important for suc-cessful RM implementation (Talluri & Ryzin,2005).
Forecast of future demand is important becausethe forecast helps make important decisions inRM. Many studies have developed algorithmsbased on some kind of correlation (usually nega-tive) between price and quantity demanded to helpmake decisions regarding the acceptance (or rejec-tion) of bookings by guests, and room rates offeredby hotels (Badinelli, 2000; Baker & Collier, 1999,2003; Bitran & Mondschein, 1995; Choi & Cho,2000; Lai & Ng, 2005; Rest & Harris, 2008).Obviously, the appropriateness of such decisionsdepends on the accuracy of demand forecasting.
As illustrated by Weatherford and Kimes(2003), many of the forecasting studies in hotelRM have their origin in the airline industry, suchas those by Sa (1987) and Lee (1990). Lee (1990),
Tony SzeMing Tse, PhD, School of Hotel and TourismManagement, The HongKong Polytechnic University,17 Science Museum Road, TST East, Kowloon, Hong Kong SAR, China (E‑mail: [email protected]).
Yiu Tung Poon, PhD, Department of Mathematics, Iowa State University, 100 Enrollment Services Center,Ames, IA 50011, USA (E‑mail: [email protected]).
Address correspondence to: Tony S.M. Tse, School of Hotel and Tourism Management, The Hong KongPolytechnic University, 17 Science Museum Road, TST East, Kowloon, Hong Kong SAR, China(E‑mail: [email protected]).
Journal of Travel & Tourism Marketing, 2015© 2015 Taylor & FrancisISSN: 1054-8408 print / 1540-7306 onlineDOI: 10.1080/10548408.2015.1063826
1
Dow
nloa
ded
by [
Iow
a St
ate
Uni
vers
ity]
at 1
3:39
28
Sept
embe
r 20
15
for example, differentiates between historicalbookings model and advance bookings model inthe airline industry, which later serve as the basisof much discussion in hotel forecasting.
In the historical bookings model, the focus ison the final bookings of a particular flight atvarious points in the past. Researchers study thedata which represent final bookings on flightdays in the past, assuming that such data revealcyclical trends and seasonal variations over aperiod of time. The past behavior of a timeseries is examined in order to infer somethingabout its future behavior. The historical book-ings model uses time series analysis to forecastfinal bookings for a particular flight on a parti-cular day (or week or month) in the future.
In the advance bookings model, researchersconsider the bookings already made on the par-ticular flight for which a forecast of bookings isrequired. For departed flights, the booking dataare already complete; whereas for flights sched-uled in the future, the booking data are onlypartially complete. In trying to predict theincomplete portions of future bookings for aparticular flight, the advance bookings modeluses the bookings-on-hand on a certain daybefore departure and uses a sample of bookingdata from previous departures of the same flightnumber to estimate the bookings-to-come.
While the application of the advance bookingsmodel in the airline industry is well developed, itsapplication in the hotel industry is limited. Thisstudy investigates the analysis and application ofthe advance bookings model in the hotel industry.Specifically, the advance bookings data of theHotel ICON for one year are analyzed, and thepurpose of the study is to identify and examinethe booking patterns and trends, use the advancebookings curve to forecast hotel reservations, andprovide insights into the application of theadvance bookings model in the hotel industry.
LITERATURE REVIEW
Forecasting in the Airline Industry
This literature review focuses on bookingdata based on forecasting in the airline industry.Adams and Vodicka (as cited in Weatherford &
Kimes, 2003) developed short-term forecastsfor just one week before departure using fairlysimple estimates and an average of segmentclass reservations in the airline business.L’Heureux (as cited in Weatherford & Kimes,2003) discusses the classical “pickup” methodto determine the average of reservations pickedup between different reading days for departedflights for a particular day of the week to fore-cast the future pickup between the same readingdays for the same flight number on the sameday of the week in the future. Sa’s (1987) studyexamines distribution plots of reservations inairline by fare class. The first reservation dataretrieved for any flight refers to a period thatcorresponds to 28 days before departure. Fromthere on, snapshots are taken for every sevendays. That is to say, each flight will be analyzedin five 7-day periods, from day 28 to boardingday. Analyses are made in terms of reservationsup to a particular period (or bookings-on-hand)and the expected number of reservations still tocome (or bookings-to-come). The studyobserves these two related but distinct variablesin terms of shape, means, and standard devia-tion, and finds that bookings-on-hand do notexhibit good explanatory power when forecast-ing final bookings via bookings-to-come.
Lee (1990) studies the available booking dataof a typical airline database and differentiatesbetween historical bookings model and advancebookings modeling. Based on current and pastdata-on-hand, the researcher estimates a statis-tical model and fits a model to the known pastobservations. Once a model is fitted to the data,the researcher predicts future (unknown) valuesgiven the current data-on-hand. Producing anaccurate forecast requires the use of estimationmodeling and intelligent extrapolation. Thereare two types of modeling. The first type isthe synthetic booking curve model, whichattempts to describe the shape of the bookingcurve based on a sample of advance bookingdata from previous departures of the same flightnumber. The booking curve is synthesized froman approximation to its shape and other exogen-ous factors. The second type of advance book-ings model is the time series of advancebookings model, which expresses total bookingsa certain number of days before departure as a
2 JOURNAL OF TRAVEL & TOURISM MARKETING
Dow
nloa
ded
by [
Iow
a St
ate
Uni
vers
ity]
at 1
3:39
28
Sept
embe
r 20
15
time series of total bookings at earlier points inthe booking history of all flights with the sameflight number and exogenous factors.
Forecasting in the Hotel Industry
From its origin in the airline industry nearly60 years ago, RM has expanded to other hospi-tality industries, notably lodging (Anderson &Xie, 2010). Researchers in hotel RM have fol-lowed the line of thought in airline RM in thelast 25 years. Relihan (1989) and Kimes (1989)were among the earliest researchers in hotel RMto treat booking data as booking curves orthreshold curves. Threshold curves representreservations-on-hand that a hotel expects inrelation to the number of days before arrival.If the current reservations-on-hand fall outsidethe stated range, then the hotel should adjust theroom rates either upwards or downwards tomaximize revenue.
Weatherford and Kimes (2003) describeseven forecasting methods, and test and com-pare them using reservations data from ChoiceHotels and Marriott Hotels. The seven forecast-ing methods are simple exponential smoothing;moving average methods; linear regression;logarithmic linear regression; additive method;multiplicative method; and Holt’s double expo-nential smoothing. They conclude that the bestforecasting method varies according to property,rate category, and length of stay, and that pickupmethods and regression produced the lowesterror, while the booking curve and combinationforecasts produced fairly inaccurate results.Schwartz (2006) argues that hotel booking isremarkably different from what is described bythe traditional approach to modeling consu-mers’ purchase cycle because of the advance-booking nature, and an in-depth understandingof the process and its determinants is essentialin sustaining the effectiveness of an RM system.Schwartz (2008) further notes that with theonline booking revolution the advance-bookingbehavior characteristics are not yet fully under-stood, and the author demonstrates how theshape and pattern of the time-before-the-date-of-stay determines the forecasting model predic-tions. The implications of consumers making
last-minute travel arrangements on marketingstrategy and RM are also discussed by Dacko(2004).
Of particular interest to this study is theadvance booking method. Schwartz andHiemstra (1997) developed an extrapolativeforecasting model by focusing on the shapeof past booking curves, and compare fourmodels of forecasting. Chen and Kachani(2007) continue with advance bookings mod-eling and find that using exponential smooth-ing, eight weeks of history provide forecastsof the lowest error, while four weeks of his-tory provide the best expected revenue fromoptimization. Phumchusri and Mongkolkul(2012) use actual booking data to show thatbooking information and the date of stay areessential in predicting final room demand.Their regression model yields the lowest fore-cast error, especially for the short-term fore-casting, when compared with traditionalforecasting methods.
Rajopadhye, Ghalia, Wang, Baker, and Eister(2001), on the other hand, simulate the processof hotel reservation requests using a Poissondistribution to forecast occupancy. They applythe Holt–Winters smoothing method to thesimulated booking data and forecast the demandfor rooms for each arrival day. The forecast isbased on past observations, with recent obser-vations being given more weight and observa-tions further in the past given less weight. Thelimitation of the study is that it relies on simu-lated arrivals and simulated cancelations for theanalysis, and the model is not supported byempirical study. It is noted that Rajopadhyeet al. (2001) forecast unconstrained hotel roomdemand, which is the number of rooms that canbe sold if there are no capacity or pricing con-straints. The assumption of unconstrained hotelroom demand probably has its origin in theairline industry. It is reasonable and functionalfor an airline to forecast unconstrained demandbecause it has the option and flexibility tochange the number of flights and type of aircraftto match demand. It is, however, questionableto make such assumptions in the context of thehotel industry. In the case of room demand andsupply, a hotel does not have much leeway tochange the room inventory to match demand,
Tony Sze Ming Tse and Yiu Tung Poon 3
Dow
nloa
ded
by [
Iow
a St
ate
Uni
vers
ity]
at 1
3:39
28
Sept
embe
r 20
15
therefore forecasting unconstrained demand inthe hotel industry is not as meaningful as in thecase of the airline industry.
In fact, the hotel industry believes thatbooking pickup is one of the most acc-urate prognosticators of future performance(Rubicon, 2010), and it has been reported thatthe average hotel reservation lead time is36 days for leisure travel and 21 days forbusiness travel (HotelNewsNow, 2012).According to the American Hotel & LodgingAssociation (AHLA, 2006), knowing the typi-cal percentage of business that books in acertain window prior to arrival is importantbecause appreciating when business actuallystarts to book will assist in determining howfar in advance of the day of arrival restrictionsshould be placed. Furthermore, today’s trave-lers are increasingly booking their itinerariesdays in advance, not weeks or months ahead,and the industry is most interested in how tobeat the incredible shrinking hotel bookingwindow (Mourier, 2011).
While it seems that there is considerableinterest in the advance bookings modelamong academics and the industry, there hasbeen little research analyzing booking data indetail and making use of the model for fore-casting (Zakhary, Gayar, & Atiya, 2008). Thisis partly due to the fact that (airline) reserva-tions data are confidential (Sa, 1987), and thesame can be said of hotel booking data.Discussion with industry practitioners alsoreveals that common practice in forecastinginvolves the use of only current bookings-on-hand and tends to ignore previous bookingdata. This could be due to the use of highlycomplex algorithms in some advance bookingsmodeling and the belief that the past bookingpattern has little relationship with the futurebooking pattern.
This study analyzes the trends and patterns inthe booking data made available by the HotelICON, and explores how the findings can beused in forecasting. The researchers understandthat the trends and patterns identified are uniqueto a particular hotel, and the findings cannot begeneralized. Nonetheless, the analysis demon-strates a more in-depth understanding ofadvance bookings modeling, and explores a
forecasting method which is based entirely onbookings-on-hand data.
ADVANCE BOOKINGS MODEL
Defining Booking Data
The advance bookings model is based onbooking data of a hotel. Hotel booking dataare the number of rooms reserved by guestsover a period of time, for example, 90 days or60 days before a certain day, and we call thisDay 0. In a normal situation, reservationsincrease as the hotel approaches Day 0. Thereservations pickup rate varies from hotel tohotel, and from period to period, depending onmacro factors and micro factors. If macro fac-tors such as the economy in a particular sourcemarket and its exchange rate are favorable, thebookings by guests from that source market arelikely to be strong. If micro factors such as hotelpricing and promotions are effective, the book-ings received are likely to increase quickly. Inother words, the bookings-on-hand are a goodindicator or reflection of all the macro andmicro factors. Therefore it can be argued thatthe bookings-on-hand subsume all the factorsaffecting room occupancy, and such effectswill carry through over the entire booking per-iod. If a booking trend based on the advancebookings-on-hand can be estimated or estab-lished, it could be a good indicator of finalroom occupancy.
A characteristic of using booking trend as anindicator of final room occupancy is that theresulting forecast is specific to a particularhotel, and not the total demand for all hotelsin a destination. Of course one can aggregatethe forecasts of all hotels to arrive at totaldemand in a destination if needed.
Advance Bookings Modeling
The advance bookings model considers theincrease in the number of reservations over a rela-tively short period of time, usually days, for aparticular day in a hotel. Researchers assume thatthe number of reservations in a hotel increasesgradually and use additive or multiplicativemodels
4 JOURNAL OF TRAVEL & TOURISM MARKETING
Dow
nloa
ded
by [
Iow
a St
ate
Uni
vers
ity]
at 1
3:39
28
Sept
embe
r 20
15
to forecast room occupancy in the future. Thefollowing methods have been applied in advancebookings models (Weatherford & Kimes, 2003):
● Linear regression methods assume thatthere is a correlation between the currentnumber of reservations-on-hand (Day n)and the final number of reservations(Day 0):
Forecast@Day 0 ¼ aþ b
� bookings@Day n
● Logarithmic linear regression methodsalso assume a different relation betweenthe current number of reservations-on-hand (Day n) and the final number ofreservations (Day 0):
Log Forecast@Day 0ð Þ ¼ aþ b
� Log bookings@Day nð Þ
● The additive method adds the current book-ings to the average historical pickup in book-ings from the reading day (Day n) to theactual night of the stay (Day 0):
Forecast@Day 0 ¼ bookings@Day n
þ average pickup Day n to Day 0ð Þ
● The multiplicative method multiplies thecurrent bookings by the average historicalpickup ratio in bookings from the readingday (Day n) to the actual night of the stay(Day 0):
Forecast@Day 0 ¼ bookings@Day n
� average pickup ratio Day n to Day 0ð Þ
We note that all of the above methods useonly the bookings-on-hand on a certain day(bookings@Day n) and ignore the bookingdata before Day n, and try to estimate the book-ings-to-come based on some other historicaldata. This practice assumes that future bookingson a particular day depend only on the currentnumber of bookings-on-hand, not on how thebookings-on-hand were generated. In statistics,
this is known as the Markov property, whichstates that the probability of any particularfuture behavior of the process, given its cur-rent state, is not altered by additional knowl-edge concerning its past behavior (Lee, 1990).The practice of assuming the Markov propertyin advance bookings modeling has its originin the airline industry (Bertsimas & Boer,2005; Haerian, Homem-de-Mello, & Mount-Campbell, 2006; Lee, 1990; Littlewood,1972). Haerian et al. (2006), for example,developed a booking process model whichassumes that requests for seat reservationsfollow a homogeneous Poisson process,meaning that the Poisson parameter is con-stant and therefore time independent.
This study analyzes the empirical bookingdata of a hotel, identifies the trends and pat-terns identified in the booking data, and usesits advance bookings curve to forecast hotelreservations.
RESEARCH DATA AND METHOD
Research Data
Hotel ICON is a 262-room teaching andresearch hotel owned by The Hong KongPolytechnic University, Hong Kong, operatedon a commercial basis (Tse, 2012). The book-ing data provided by the hotel covers the 12-month period September 1, 2011–August 31,2012. There are 366 days during the 12-months period, and for each day, there are 91data corresponding to final occupancy (on Day0) and the number of rooms reserved rangingfrom 1 day to 90 days prior to arrival.Mathematica is the software used to analyzethe data.
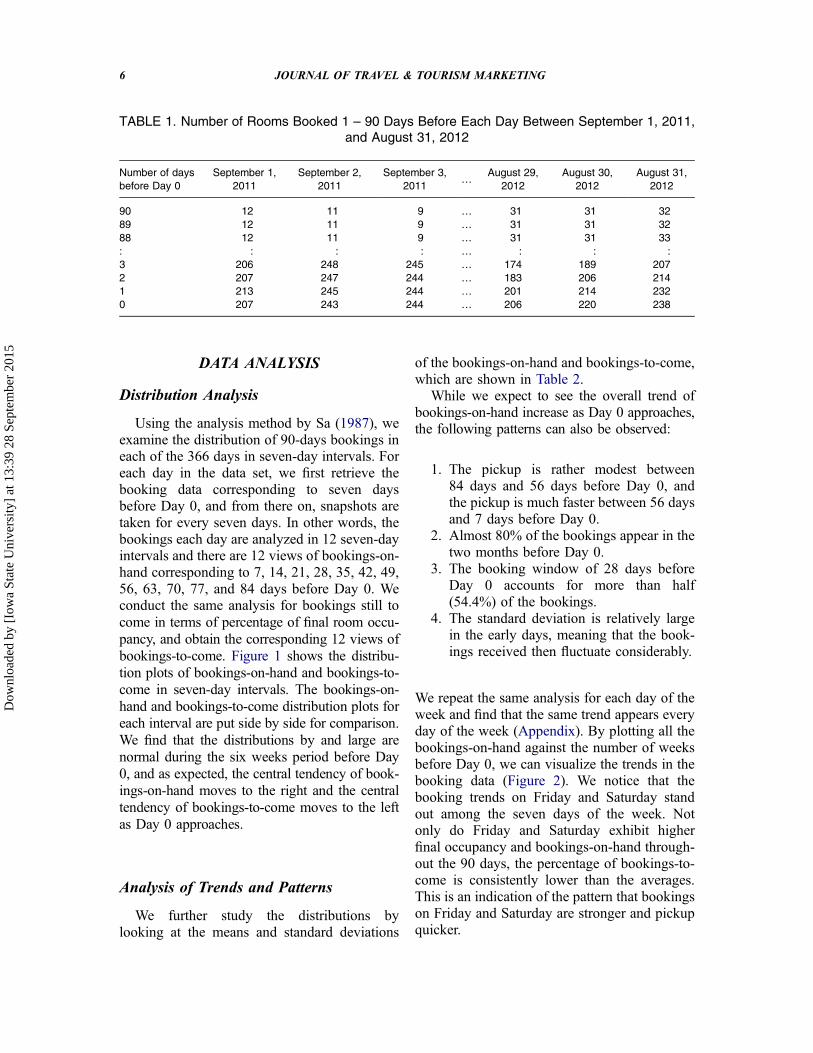
Table 1 presents the set of data made avail-able to the researchers. The figures in row 90are the reservations 90 days before Day 0, thefigures in row 3 are the reservations 3 daysbefore Day 0, and the figures in row 0 are thefinal occupancies. For example, for August31, 2012, the number of rooms reserved90 days out is 32, the number of roomsreserved 3 days out is 207, and the finaloccupancy is 238.
Tony Sze Ming Tse and Yiu Tung Poon 5
Dow
nloa
ded
by [
Iow
a St
ate
Uni
vers
ity]
at 1
3:39
28
Sept
embe
r 20
15
DATA ANALYSIS
Distribution Analysis
Using the analysis method by Sa (1987), weexamine the distribution of 90-days bookings ineach of the 366 days in seven-day intervals. Foreach day in the data set, we first retrieve thebooking data corresponding to seven daysbefore Day 0, and from there on, snapshots aretaken for every seven days. In other words, thebookings each day are analyzed in 12 seven-dayintervals and there are 12 views of bookings-on-hand corresponding to 7, 14, 21, 28, 35, 42, 49,56, 63, 70, 77, and 84 days before Day 0. Weconduct the same analysis for bookings still tocome in terms of percentage of final room occu-pancy, and obtain the corresponding 12 views ofbookings-to-come. Figure 1 shows the distribu-tion plots of bookings-on-hand and bookings-to-come in seven-day intervals. The bookings-on-hand and bookings-to-come distribution plots foreach interval are put side by side for comparison.We find that the distributions by and large arenormal during the six weeks period before Day0, and as expected, the central tendency of book-ings-on-hand moves to the right and the centraltendency of bookings-to-come moves to the leftas Day 0 approaches.
Analysis of Trends and Patterns
We further study the distributions bylooking at the means and standard deviations
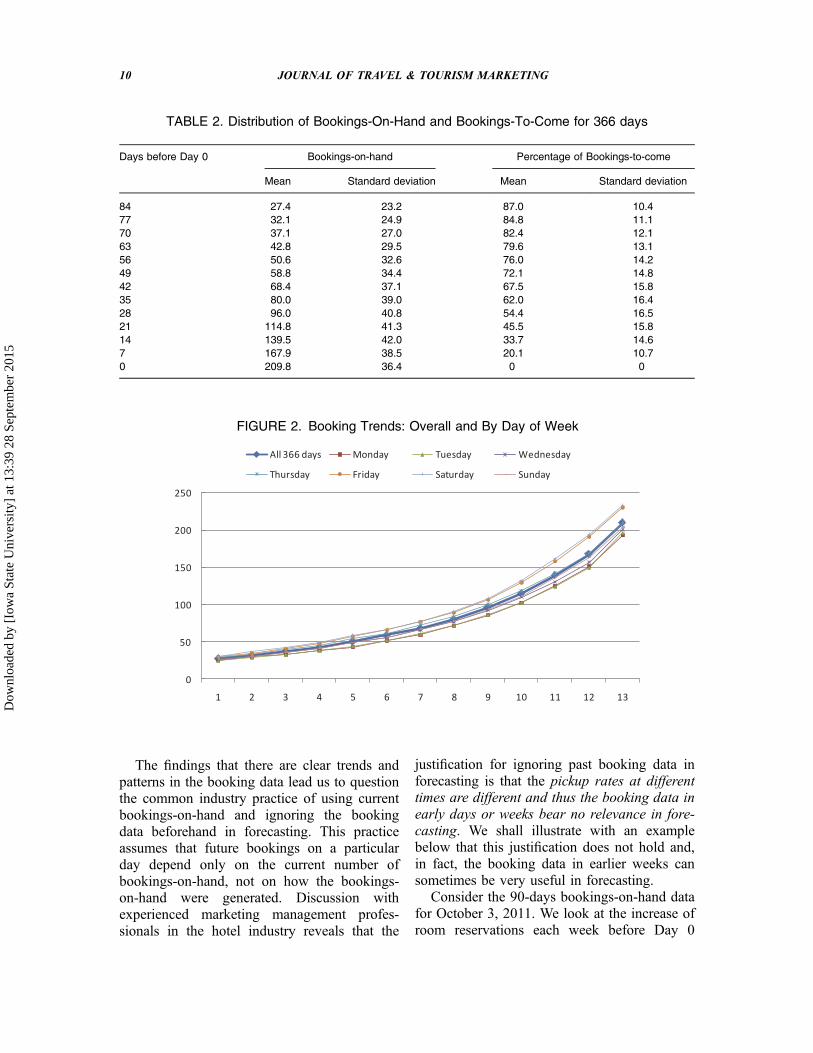
of the bookings-on-hand and bookings-to-come,which are shown in Table 2.
While we expect to see the overall trend ofbookings-on-hand increase as Day 0 approaches,the following patterns can also be observed:
1. The pickup is rather modest between84 days and 56 days before Day 0, andthe pickup is much faster between 56 daysand 7 days before Day 0.
2. Almost 80% of the bookings appear in thetwo months before Day 0.
3. The booking window of 28 days beforeDay 0 accounts for more than half(54.4%) of the bookings.
4. The standard deviation is relatively largein the early days, meaning that the book-ings received then fluctuate considerably.
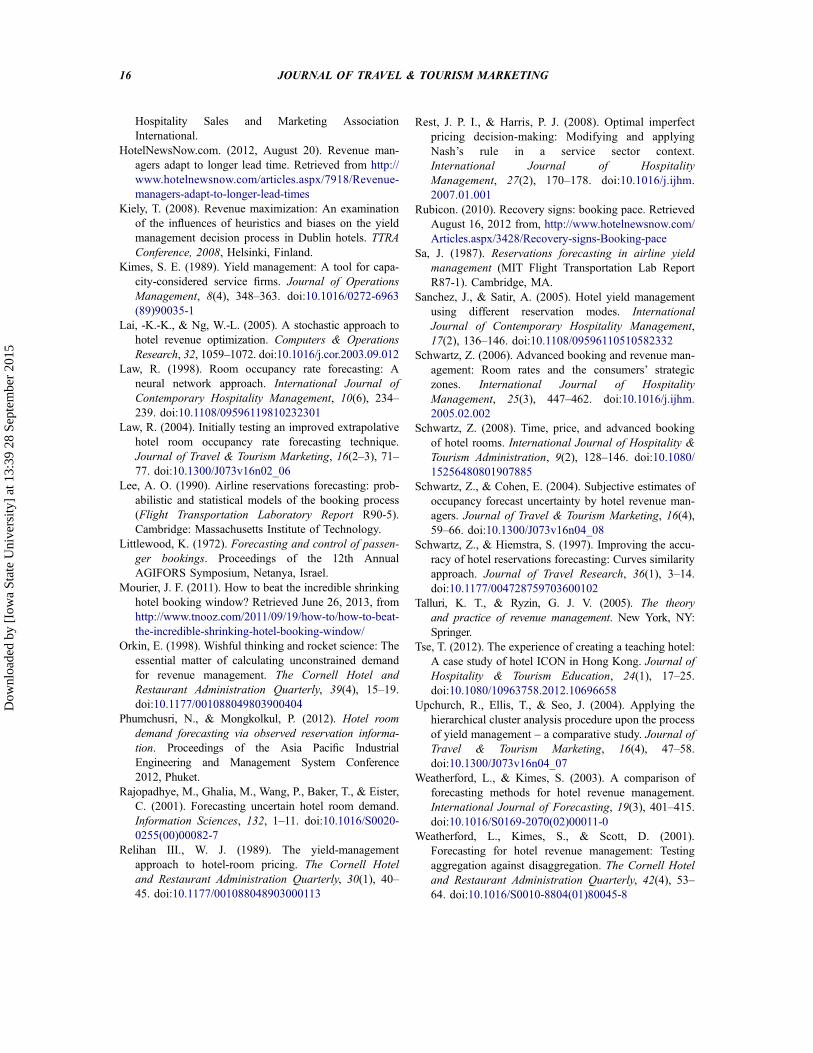
We repeat the same analysis for each day of theweek and find that the same trend appears everyday of the week (Appendix). By plotting all thebookings-on-hand against the number of weeksbefore Day 0, we can visualize the trends in thebooking data (Figure 2). We notice that thebooking trends on Friday and Saturday standout among the seven days of the week. Notonly do Friday and Saturday exhibit higherfinal occupancy and bookings-on-hand through-out the 90 days, the percentage of bookings-to-come is consistently lower than the averages.This is an indication of the pattern that bookingson Friday and Saturday are stronger and pickupquicker.
TABLE 1. Number of Rooms Booked 1 – 90 Days Before Each Day Between September 1, 2011,and August 31, 2012
Number of daysbefore Day 0
September 1,2011
September 2,2011
September 3,2011
…August 29,
2012August 30,
2012August 31,
2012
90 12 11 9 … 31 31 3289 12 11 9 … 31 31 3288 12 11 9 … 31 31 33: : : : … : : :3 206 248 245 … 174 189 2072 207 247 244 … 183 206 2141 213 245 244 … 201 214 2320 207 243 244 … 206 220 238
6 JOURNAL OF TRAVEL & TOURISM MARKETING
Dow
nloa
ded
by [
Iow
a St
ate
Uni
vers
ity]
at 1
3:39
28
Sept
embe
r 20
15
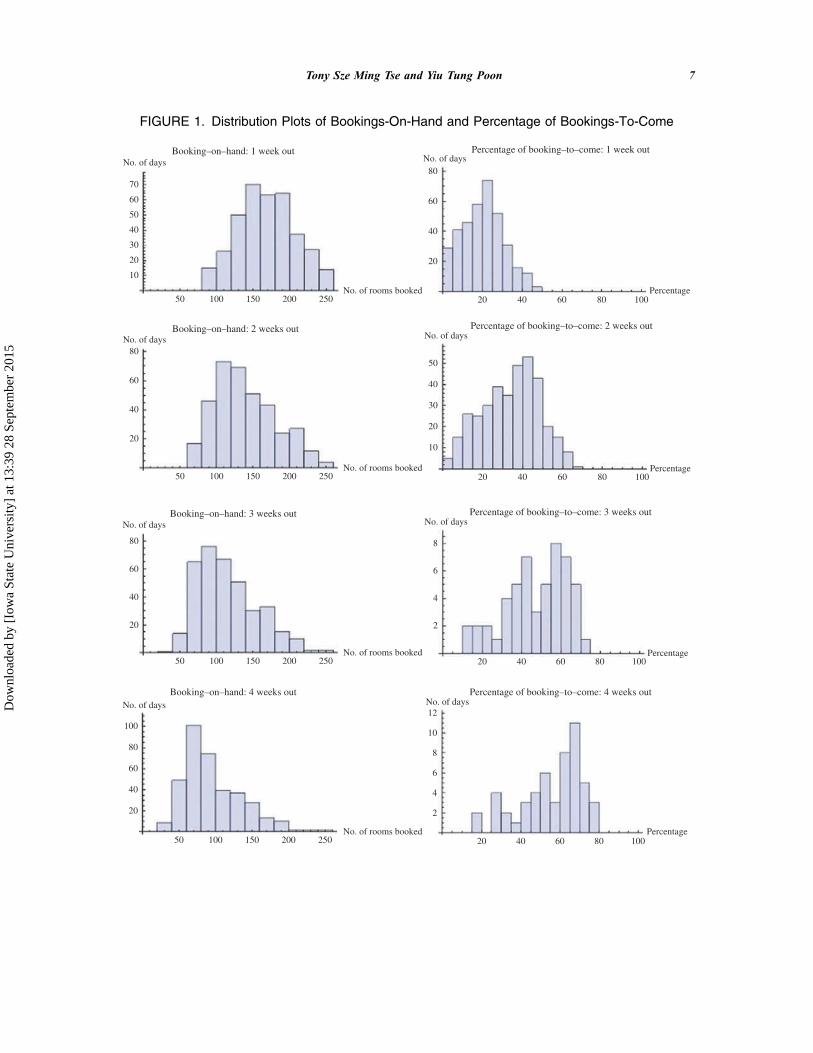
FIGURE 1. Distribution Plots of Bookings-On-Hand and Percentage of Bookings-To-Come
70
80
60
40
20
20 40 60 80 100
60
50
40
30
20
10
8050
8
12
10
8
6
4
2
6
4
2
40
30
20
10
60
40
20
50 20 40 60 80 100100 150 200 250
50 100 150
Booking–on–hand: 1 week out Percentage of booking–to–come: 1 week out
Percentage of booking–to–come: 2 weeks out
Percentage of booking–to–come: 3 weeks out
Percentage of booking–to–come: 4 weeks out
Booking–on–hand: 2 weeks out
Booking–on–hand: 3 weeks out
Booking–on–hand: 4 weeks out
200 250No. of rooms booked
No. of rooms booked
No. of rooms booked
No. of rooms booked
Percentage
Percentage
Percentage
Percentage
No. of days
No. of days
80
60
40
20
100
80
60
40
20
50 20 40 60 80 100
20 40 60 80 100
100 150 200 250
50 100 150 200 250
No. of days
No. of days
No. of days
No. of days
No. of days
No. of days
Tony Sze Ming Tse and Yiu Tung Poon 7
Dow
nloa
ded
by [
Iow
a St
ate
Uni
vers
ity]
at 1
3:39
28
Sept
embe
r 20
15
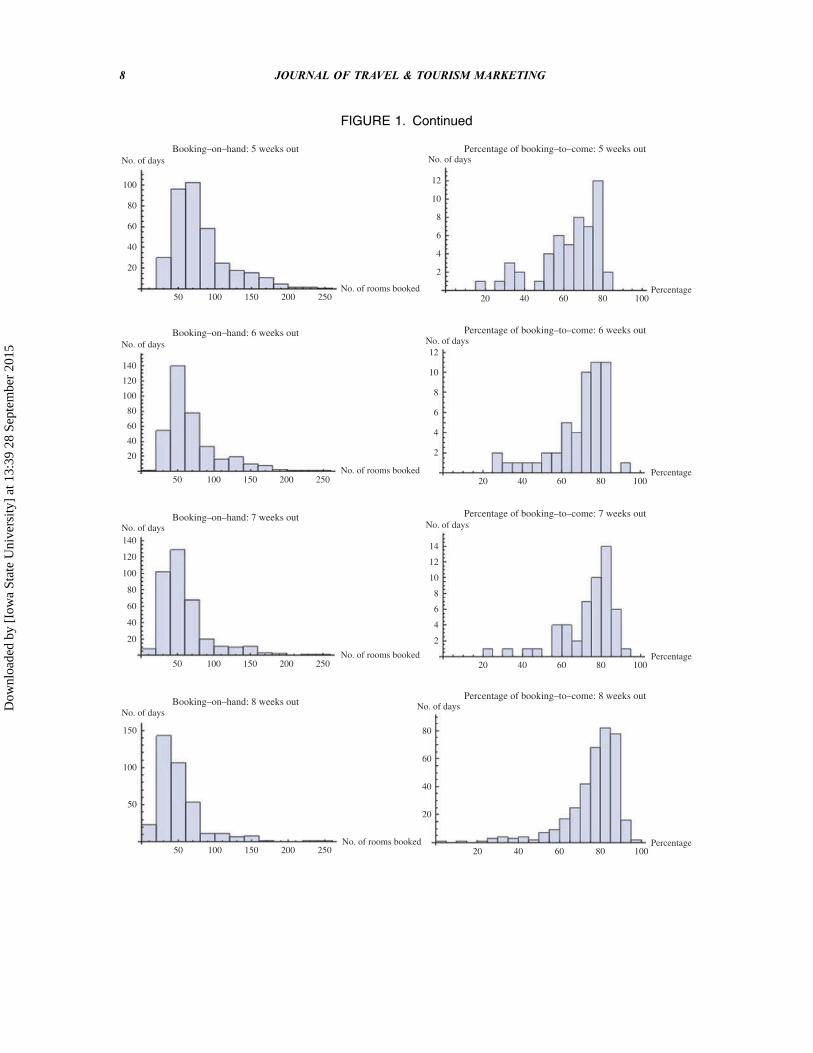
FIGURE 1. Continued
140
120
100
80
60
40
20
140
150
100
50
120
100
80
60
40
20
80
100
60
40
20
50 100 150 200 250No. of rooms booked
No. of days
50 100 150 200 250No. of rooms booked
20
12
10
8
6
4
2
12
10
8
6
4
2
14
12
10
8
80
60
40
20
6
4
2
40 60 80 100
No. of days No. of days
Percentage
20 40 60 80 100
No. of days
Percentage
20 40 60 80 100
No. of days
Percentage
20 40 60 80 100
No. of days
Percentage
Booking–on–hand: 5 weeks out Percentage of booking–to–come: 5 weeks out
Percentage of booking–to–come: 6 weeks out
Percentage of booking–to–come: 7 weeks out
Percentage of booking–to–come: 8 weeks out
Booking–on–hand: 6 weeks out
Booking–on–hand: 7 weeks out
Booking–on–hand: 8 weeks out
50 100 150 200 250No. of rooms booked
No. of days
50 100 150 200 250No. of rooms booked
No. of days
8 JOURNAL OF TRAVEL & TOURISM MARKETING
Dow
nloa
ded
by [
Iow
a St
ate
Uni
vers
ity]
at 1
3:39
28
Sept
embe
r 20
15
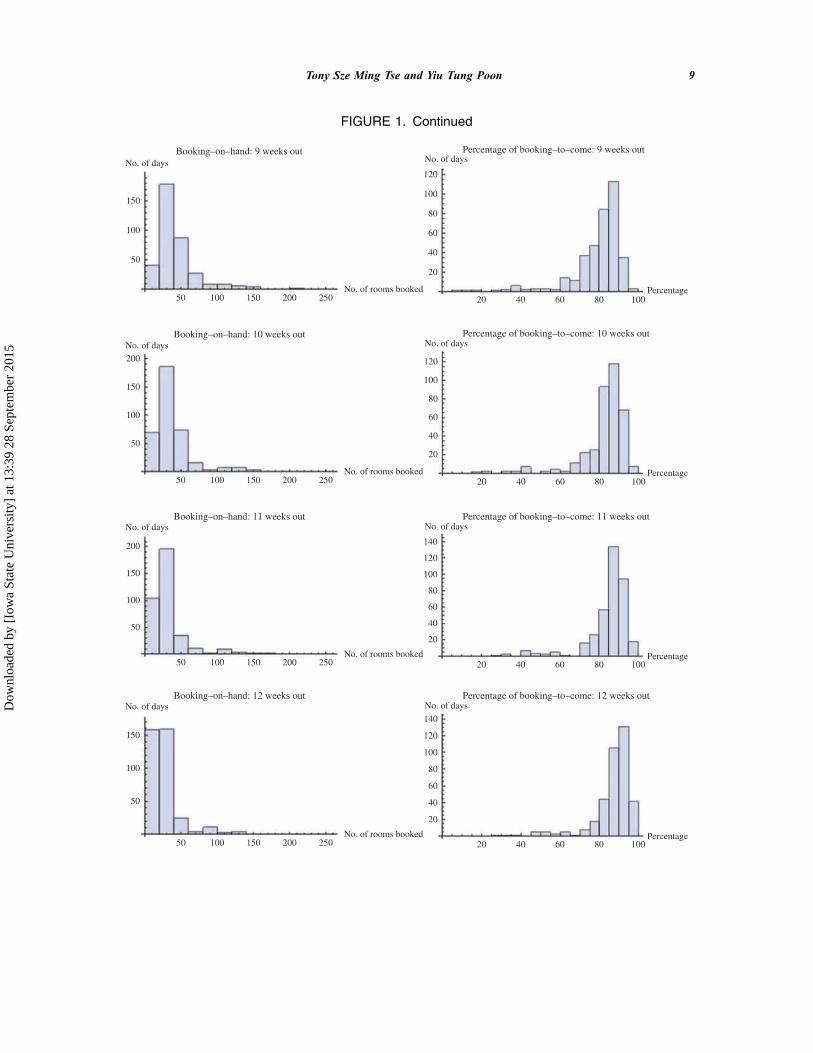
FIGURE 1. Continued
No. of rooms booked
No. of days
150
200
200
150
100
50
150
100
50
150
100
50
100
50
Booking–on–hand: 9 weeks out
Booking–on–hand: 10 weeks out
Booking–on–hand: 11 weeks out
Booking–on–hand: 12 weeks out
50 100 150 200 250
No. of rooms booked
No. of days
50 100 150 200 250
No. of rooms booked
No. of days
50 100 150 200 250
No. of rooms booked
No. of days
50 100 150 200 250
20 40 60 80 100
20 40 60 80 100
No. of days
No. of days
No. of days
Percentage
Percentage
20 40 60 80 100Percentage
20 40 60 80 100Percentage
Percentage of booking–to–come: 9 weeks out
Percentage of booking–to–come: 10 weeks out
Percentage of booking–to–come: 11 weeks out
Percentage of booking–to–come: 12 weeks out
120
100
80
60
40
20
120
100
80
60
40
20
120
140
100
80
60
40
20
No. of days
120
140
100
80
60
40
20
Tony Sze Ming Tse and Yiu Tung Poon 9
Dow
nloa
ded
by [
Iow
a St
ate
Uni
vers
ity]
at 1
3:39
28
Sept
embe
r 20
15
The findings that there are clear trends andpatterns in the booking data lead us to questionthe common industry practice of using currentbookings-on-hand and ignoring the bookingdata beforehand in forecasting. This practiceassumes that future bookings on a particularday depend only on the current number ofbookings-on-hand, not on how the bookings-on-hand were generated. Discussion withexperienced marketing management profes-sionals in the hotel industry reveals that the
justification for ignoring past booking data inforecasting is that the pickup rates at differenttimes are different and thus the booking data inearly days or weeks bear no relevance in fore-casting. We shall illustrate with an examplebelow that this justification does not hold and,in fact, the booking data in earlier weeks cansometimes be very useful in forecasting.
Consider the 90-days bookings-on-hand datafor October 3, 2011. We look at the increase ofroom reservations each week before Day 0
TABLE 2. Distribution of Bookings-On-Hand and Bookings-To-Come for 366 days
Days before Day 0 Bookings-on-hand Percentage of Bookings-to-come
Mean Standard deviation Mean Standard deviation
84 27.4 23.2 87.0 10.477 32.1 24.9 84.8 11.170 37.1 27.0 82.4 12.163 42.8 29.5 79.6 13.156 50.6 32.6 76.0 14.249 58.8 34.4 72.1 14.842 68.4 37.1 67.5 15.835 80.0 39.0 62.0 16.428 96.0 40.8 54.4 16.521 114.8 41.3 45.5 15.814 139.5 42.0 33.7 14.67 167.9 38.5 20.1 10.70 209.8 36.4 0 0
FIGURE 2. Booking Trends: Overall and By Day of Week
0
50
100
150
200
250
1 2 3 4 5 6 7 8 9 10 11 12 13
All 366 days Monday Tuesday Wednesday
Thursday Friday Saturday Sunday
10 JOURNAL OF TRAVEL & TOURISM MARKETING
Dow
nloa
ded
by [
Iow
a St
ate
Uni
vers
ity]
at 1
3:39
28
Sept
embe
r 20
15
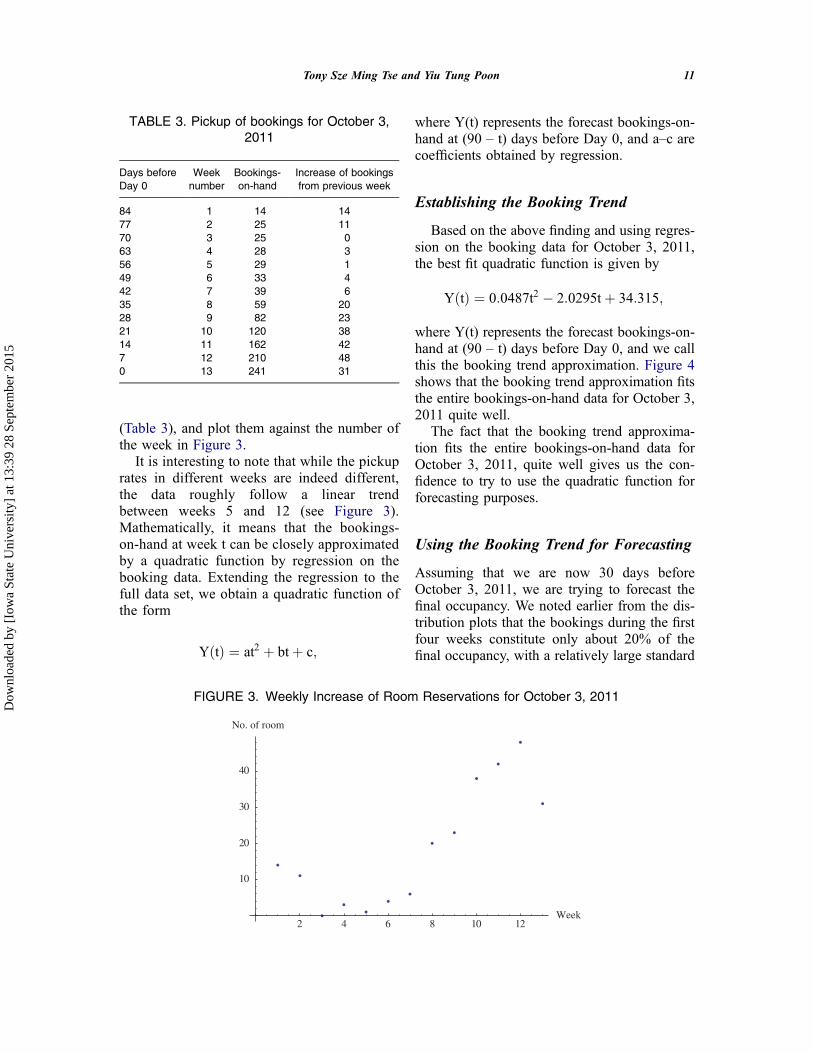
(Table 3), and plot them against the number ofthe week in Figure 3.
It is interesting to note that while the pickuprates in different weeks are indeed different,the data roughly follow a linear trendbetween weeks 5 and 12 (see Figure 3).Mathematically, it means that the bookings-on-hand at week t can be closely approximatedby a quadratic function by regression on thebooking data. Extending the regression to thefull data set, we obtain a quadratic function ofthe form
Y tð Þ ¼ at2 þ btþ c;
where Y(t) represents the forecast bookings-on-hand at (90 – t) days before Day 0, and a–c arecoefficients obtained by regression.
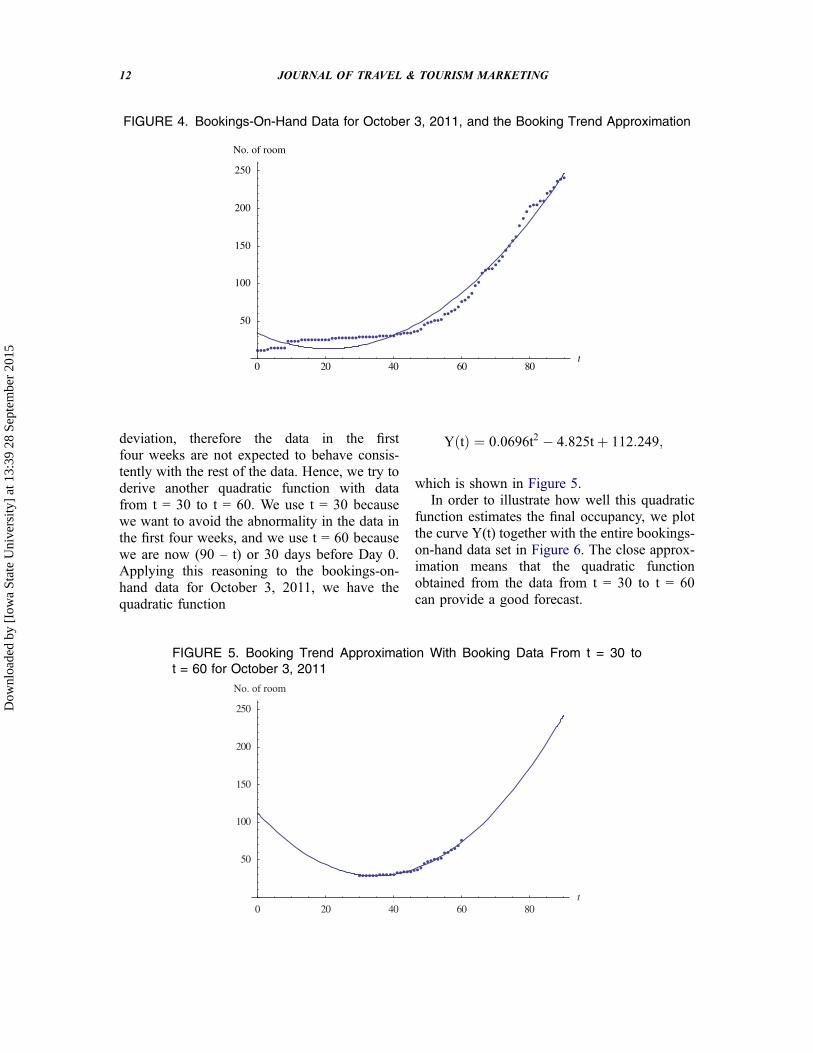
Establishing the Booking Trend
Based on the above finding and using regres-sion on the booking data for October 3, 2011,the best fit quadratic function is given by
Y tð Þ ¼ 0:0487t2 � 2:0295tþ 34:315;
where Y(t) represents the forecast bookings-on-hand at (90 – t) days before Day 0, and we callthis the booking trend approximation. Figure 4shows that the booking trend approximation fitsthe entire bookings-on-hand data for October 3,2011 quite well.
The fact that the booking trend approxima-tion fits the entire bookings-on-hand data forOctober 3, 2011, quite well gives us the con-fidence to try to use the quadratic function forforecasting purposes.
Using the Booking Trend for Forecasting
Assuming that we are now 30 days beforeOctober 3, 2011, we are trying to forecast thefinal occupancy. We noted earlier from the dis-tribution plots that the bookings during the firstfour weeks constitute only about 20% of thefinal occupancy, with a relatively large standard
FIGURE 3. Weekly Increase of Room Reservations for October 3, 2011
2 4 6 8 10 12Week
10
20
30
40
No. of room
TABLE 3. Pickup of bookings for October 3,2011
Days beforeDay 0
Weeknumber
Bookings-on-hand
Increase of bookingsfrom previous week
84 1 14 1477 2 25 1170 3 25 063 4 28 356 5 29 149 6 33 442 7 39 635 8 59 2028 9 82 2321 10 120 3814 11 162 427 12 210 480 13 241 31
Tony Sze Ming Tse and Yiu Tung Poon 11
Dow
nloa
ded
by [
Iow
a St
ate
Uni
vers
ity]
at 1
3:39
28
Sept
embe
r 20
15
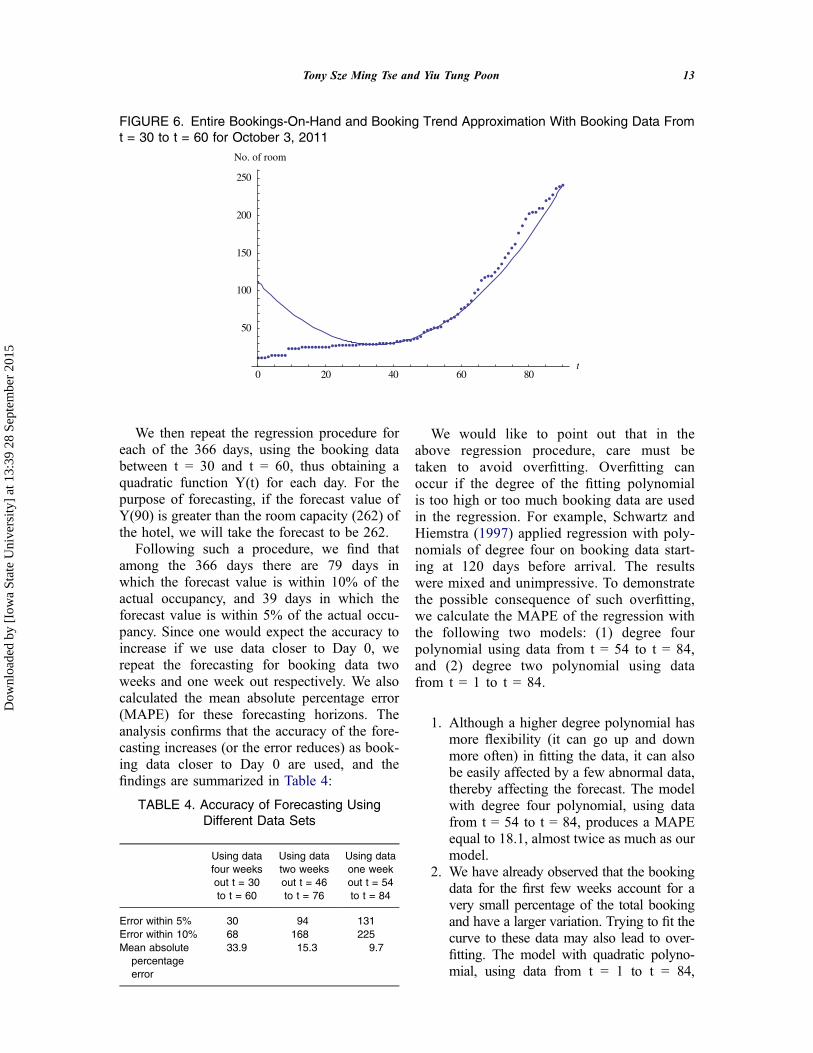
deviation, therefore the data in the firstfour weeks are not expected to behave consis-tently with the rest of the data. Hence, we try toderive another quadratic function with datafrom t = 30 to t = 60. We use t = 30 becausewe want to avoid the abnormality in the data inthe first four weeks, and we use t = 60 becausewe are now (90 – t) or 30 days before Day 0.Applying this reasoning to the bookings-on-hand data for October 3, 2011, we have thequadratic function
Y tð Þ ¼ 0:0696t2 � 4:825tþ 112:249;
which is shown in Figure 5.In order to illustrate how well this quadratic
function estimates the final occupancy, we plotthe curve Y(t) together with the entire bookings-on-hand data set in Figure 6. The close approx-imation means that the quadratic functionobtained from the data from t = 30 to t = 60can provide a good forecast.
FIGURE 4. Bookings-On-Hand Data for October 3, 2011, and the Booking Trend Approximation
0 20 40 60 80t
50
100
150
200
250
No. of room
FIGURE 5. Booking Trend Approximation With Booking Data From t = 30 tot = 60 for October 3, 2011
0 20 40 60 80t
50
100
150
200
250
No. of room
12 JOURNAL OF TRAVEL & TOURISM MARKETING
Dow
nloa
ded
by [
Iow
a St
ate
Uni
vers
ity]
at 1
3:39
28
Sept
embe
r 20
15
We then repeat the regression procedure foreach of the 366 days, using the booking databetween t = 30 and t = 60, thus obtaining aquadratic function Y(t) for each day. For thepurpose of forecasting, if the forecast value ofY(90) is greater than the room capacity (262) ofthe hotel, we will take the forecast to be 262.
Following such a procedure, we find thatamong the 366 days there are 79 days inwhich the forecast value is within 10% of theactual occupancy, and 39 days in which theforecast value is within 5% of the actual occu-pancy. Since one would expect the accuracy toincrease if we use data closer to Day 0, werepeat the forecasting for booking data twoweeks and one week out respectively. We alsocalculated the mean absolute percentage error(MAPE) for these forecasting horizons. Theanalysis confirms that the accuracy of the fore-casting increases (or the error reduces) as book-ing data closer to Day 0 are used, and thefindings are summarized in Table 4:
We would like to point out that in theabove regression procedure, care must betaken to avoid overfitting. Overfitting canoccur if the degree of the fitting polynomialis too high or too much booking data are usedin the regression. For example, Schwartz andHiemstra (1997) applied regression with poly-nomials of degree four on booking data start-ing at 120 days before arrival. The resultswere mixed and unimpressive. To demonstratethe possible consequence of such overfitting,we calculate the MAPE of the regression withthe following two models: (1) degree fourpolynomial using data from t = 54 to t = 84,and (2) degree two polynomial using datafrom t = 1 to t = 84.
1. Although a higher degree polynomial hasmore flexibility (it can go up and downmore often) in fitting the data, it can alsobe easily affected by a few abnormal data,thereby affecting the forecast. The modelwith degree four polynomial, using datafrom t = 54 to t = 84, produces a MAPEequal to 18.1, almost twice as much as ourmodel.
2. We have already observed that the bookingdata for the first few weeks account for avery small percentage of the total bookingand have a larger variation. Trying to fit thecurve to these data may also lead to over-fitting. The model with quadratic polyno-mial, using data from t = 1 to t = 84,
FIGURE 6. Entire Bookings-On-Hand and Booking Trend Approximation With Booking Data Fromt = 30 to t = 60 for October 3, 2011
0 20 40 60 80t
50
100
150
200
250
No. of room
TABLE 4. Accuracy of Forecasting UsingDifferent Data Sets
Using datafour weeksout t = 30to t = 60
Using datatwo weeksout t = 46to t = 76
Using dataone weekout t = 54to t = 84
Error within 5% 30 94 131Error within 10% 68 168 225Mean absolute
percentageerror
33.9 15.3 9.7
Tony Sze Ming Tse and Yiu Tung Poon 13
Dow
nloa
ded
by [
Iow
a St
ate
Uni
vers
ity]
at 1
3:39
28
Sept
embe
r 20
15
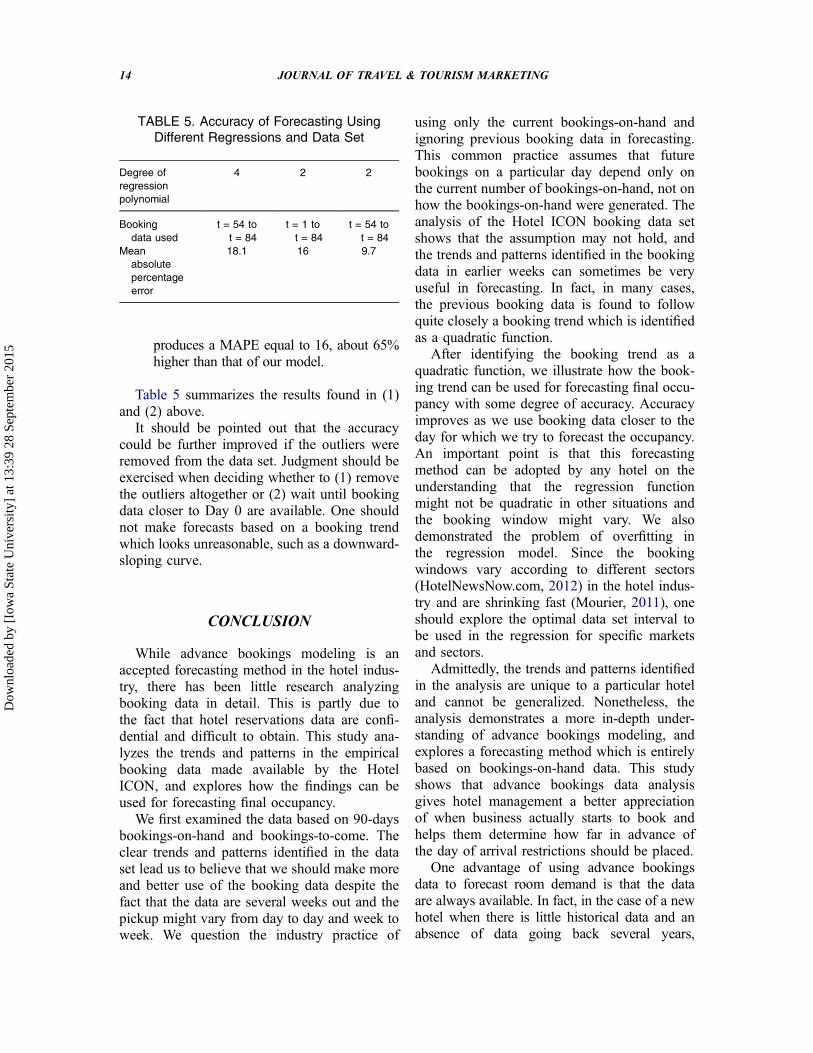
produces a MAPE equal to 16, about 65%higher than that of our model.
Table 5 summarizes the results found in (1)and (2) above.
It should be pointed out that the accuracycould be further improved if the outliers wereremoved from the data set. Judgment should beexercised when deciding whether to (1) removethe outliers altogether or (2) wait until bookingdata closer to Day 0 are available. One shouldnot make forecasts based on a booking trendwhich looks unreasonable, such as a downward-sloping curve.
CONCLUSION
While advance bookings modeling is anaccepted forecasting method in the hotel indus-try, there has been little research analyzingbooking data in detail. This is partly due tothe fact that hotel reservations data are confi-dential and difficult to obtain. This study ana-lyzes the trends and patterns in the empiricalbooking data made available by the HotelICON, and explores how the findings can beused for forecasting final occupancy.
We first examined the data based on 90-daysbookings-on-hand and bookings-to-come. Theclear trends and patterns identified in the dataset lead us to believe that we should make moreand better use of the booking data despite thefact that the data are several weeks out and thepickup might vary from day to day and week toweek. We question the industry practice of
using only the current bookings-on-hand andignoring previous booking data in forecasting.This common practice assumes that futurebookings on a particular day depend only onthe current number of bookings-on-hand, not onhow the bookings-on-hand were generated. Theanalysis of the Hotel ICON booking data setshows that the assumption may not hold, andthe trends and patterns identified in the bookingdata in earlier weeks can sometimes be veryuseful in forecasting. In fact, in many cases,the previous booking data is found to followquite closely a booking trend which is identifiedas a quadratic function.
After identifying the booking trend as aquadratic function, we illustrate how the book-ing trend can be used for forecasting final occu-pancy with some degree of accuracy. Accuracyimproves as we use booking data closer to theday for which we try to forecast the occupancy.An important point is that this forecastingmethod can be adopted by any hotel on theunderstanding that the regression functionmight not be quadratic in other situations andthe booking window might vary. We alsodemonstrated the problem of overfitting inthe regression model. Since the bookingwindows vary according to different sectors(HotelNewsNow.com, 2012) in the hotel indus-try and are shrinking fast (Mourier, 2011), oneshould explore the optimal data set interval tobe used in the regression for specific marketsand sectors.
Admittedly, the trends and patterns identifiedin the analysis are unique to a particular hoteland cannot be generalized. Nonetheless, theanalysis demonstrates a more in-depth under-standing of advance bookings modeling, andexplores a forecasting method which is entirelybased on bookings-on-hand data. This studyshows that advance bookings data analysisgives hotel management a better appreciationof when business actually starts to book andhelps them determine how far in advance ofthe day of arrival restrictions should be placed.
One advantage of using advance bookingsdata to forecast room demand is that the dataare always available. In fact, in the case of a newhotel when there is little historical data and anabsence of data going back several years,
TABLE 5. Accuracy of Forecasting UsingDifferent Regressions and Data Set
Degree ofregressionpolynomial
4 2 2
Bookingdata used
t = 54 tot = 84
t = 1 tot = 84
t = 54 tot = 84
Meanabsolutepercentageerror
18.1 16 9.7
14 JOURNAL OF TRAVEL & TOURISM MARKETING
Dow
nloa
ded
by [
Iow
a St
ate
Uni
vers
ity]
at 1
3:39
28
Sept
embe
r 20
15
booking data such as 60 days out and 90 daysout are the only reliable data available. It is up tothe hotel to capture the reservations pickup data,conduct the analysis, and make its own forecast.Anderson and Xie (2010) stress the need forfurther development in the application of prop-erty-level RM and pricing, and this study, to acertain extent, has addressed this need.
With the convenience and competitive pri-cing information made available by theInternet, more consumers tend to wait andmake their booking decisions at the last minute.This behavior has made booking windows nar-rower and the ability to read advance bookingdata accurately is more important than ever. Theforecasting method explored in this study doesnot replace conventional methods but supple-ments them by contributing to the understand-ing of the changing behavior of booking data,particularly within a relatively narrow bookingwindow. We intend to compare the new methodwith conventional methods in advance bookingsmodeling when more data are made available.In the future, we intend to study the behavior ofadvance booking data by room type and book-ing channel. We believe that analyzing the databy room type would help differentiate the beha-vior of different types of guest, and analyzingthe data by booking channel would help tounderstand online distribution, which hasbecome increasingly important.
FUNDING
The work described in this paper was fully supported bySHTM’s Hotel ICON Research Fund of The Hong KongPolytechnic University (Project Account Code: Z0G5).
REFERENCES
AHLA, 2006. Revenue management. American Hotel &Lodging Association. Retrieved February 1, 2013 from,http://www.ahla.com/uploadedFiles/AHLA/Members_Only/_Common/technology_primers_pdf/88119NEI02ENGE.pdf.
Anderson, C. K., & Xie, X. (2010). Improving hospitalityindustry sales: Twenty-Five years of revenue manage-ment. Cornell Hospitality Quarterly, 51(1), 53–67.doi:10.1177/1938965509354697
Andrew, W. P., Cranage, D. A., & Lee, C. K. (1990).Forecasting hotel occupancy rates with time seriesmodels: An empirical analysis. Journal of Hospitalityand Tourism Research, 14(2), 173–181.
Badinelli, R. (2000). An optimal, dynamic policy for hotelyield management. European Journal of OperationalResearch, 121, 476–503. doi:10.1016/S0377-2217(99)00046-6
Baker, T., & Collier, D. (1999). A comparative revenueanalysis of hotel yield management heuristics. DecisionSciences, 30(1), 239–263. doi:10.1111/deci.1999.30.issue-1
Baker, T., & Collier, D. (2003). The benefits of optimizingprices to manage demand in hotel revenue managementsystems. Production and Operations Management, 12(4), 502–518. doi:10.1111/j.1937-5956.2003.tb00217.x
Bertsimas, D., & Boer, S. (2005). Simulation-based book-ing limits for airline revenue management. OperationsResearch, 53(1), 90–106. doi:10.1287/opre.1040.0164
Bitran, G., & Mondschein, S. (1995). An application ofyield management to the hotel industry consideringmultiple day stays. Operations Research, 43(3), 427–443. doi:10.1287/opre.43.3.427
Chen, C., & Kachani, S. (2007). Forecasting and optimisa-tion for hotel revenue management. Journal of Revenueand Pricing Management, 6(3), 163–174. doi:10.1057/palgrave.rpm.5160082
Choi, T. Y., & Cho, V. (2000). Towards a knowledgediscovery framework for yield management in theHong Kong hotel industry. International Journal ofHospitality Management, 19(1), 17–31. doi:10.1016/S0278-4319(99)00053-5
Cranage, D. (2003). Practical time series forecasting forthe hospitality manager. International Journal ofContemporary Hospitality Management, 15(2), 86–93.doi:10.1108/09596110310462931
Cross, R. (1997). Launching the revenue rocket: Howrevenue management can work for your business. TheCornell Hotel and Restaurant AdministrationQuarterly, 38(2), 32–43.
Cross, R., Higbie, J., & Cross, D. (2009). Revenue manage-ment’s renaissance: A rebirth of the art and science ofprofitable revenue generation. Cornell HospitalityQuarterly, 50(1), 56–81. doi:10.1177/1938965508328716
Dacko, S. (2004). Marketing strategies for last-minutetravel and tourism: Profitability and revenue manage-ment implications. Journal of Travel & TourismMarketing, 16(4), 7–20. doi:10.1300/J073v16n04_04
Haerian, L., Homem-de-Mello, T., & Mount-Campbell, C.(2006). Modeling revenue yield of reservation systemsthat use nested capacity protection strategies.International Journal of Production Economics, 104,340–353. doi:10.1016/j.ijpe.2006.02.006
Helsel, C., & Cullen, K. (2006). Defining revenue man-agement: Top line to bottom line. McLean, VA:
Tony Sze Ming Tse and Yiu Tung Poon 15
Dow
nloa
ded
by [
Iow
a St
ate
Uni
vers
ity]
at 1
3:39
28
Sept
embe
r 20
15
Hospitality Sales and Marketing AssociationInternational.
HotelNewsNow.com. (2012, August 20). Revenue man-agers adapt to longer lead time. Retrieved from http://www.hotelnewsnow.com/articles.aspx/7918/Revenue-managers-adapt-to-longer-lead-times
Kiely, T. (2008). Revenue maximization: An examinationof the influences of heuristics and biases on the yieldmanagement decision process in Dublin hotels. TTRAConference, 2008, Helsinki, Finland.
Kimes, S. E. (1989). Yield management: A tool for capa-city-considered service firms. Journal of OperationsManagement, 8(4), 348–363. doi:10.1016/0272-6963(89)90035-1
Lai, -K.-K., & Ng, W.-L. (2005). A stochastic approach tohotel revenue optimization. Computers & OperationsResearch, 32, 1059–1072. doi:10.1016/j.cor.2003.09.012
Law, R. (1998). Room occupancy rate forecasting: Aneural network approach. International Journal ofContemporary Hospitality Management, 10(6), 234–239. doi:10.1108/09596119810232301
Law, R. (2004). Initially testing an improved extrapolativehotel room occupancy rate forecasting technique.Journal of Travel & Tourism Marketing, 16(2–3), 71–77. doi:10.1300/J073v16n02_06
Lee, A. O. (1990). Airline reservations forecasting: prob-abilistic and statistical models of the booking process(Flight Transportation Laboratory Report R90-5).Cambridge: Massachusetts Institute of Technology.
Littlewood, K. (1972). Forecasting and control of passen-ger bookings. Proceedings of the 12th AnnualAGIFORS Symposium, Netanya, Israel.
Mourier, J. F. (2011). How to beat the incredible shrinkinghotel booking window? Retrieved June 26, 2013, fromhttp://www.tnooz.com/2011/09/19/how-to/how-to-beat-the-incredible-shrinking-hotel-booking-window/
Orkin, E. (1998). Wishful thinking and rocket science: Theessential matter of calculating unconstrained demandfor revenue management. The Cornell Hotel andRestaurant Administration Quarterly, 39(4), 15–19.doi:10.1177/001088049803900404
Phumchusri, N., & Mongkolkul, P. (2012). Hotel roomdemand forecasting via observed reservation informa-tion. Proceedings of the Asia Pacific IndustrialEngineering and Management System Conference2012, Phuket.
Rajopadhye, M., Ghalia, M., Wang, P., Baker, T., & Eister,C. (2001). Forecasting uncertain hotel room demand.Information Sciences, 132, 1–11. doi:10.1016/S0020-0255(00)00082-7
Relihan III., W. J. (1989). The yield-managementapproach to hotel-room pricing. The Cornell Hoteland Restaurant Administration Quarterly, 30(1), 40–45. doi:10.1177/001088048903000113
Rest, J. P. I., & Harris, P. J. (2008). Optimal imperfectpricing decision-making: Modifying and applyingNash’s rule in a service sector context.International Journal of HospitalityManagement, 27(2), 170–178. doi:10.1016/j.ijhm.2007.01.001
Rubicon. (2010). Recovery signs: booking pace. RetrievedAugust 16, 2012 from, http://www.hotelnewsnow.com/Articles.aspx/3428/Recovery-signs-Booking-pace
Sa, J. (1987). Reservations forecasting in airline yieldmanagement (MIT Flight Transportation Lab ReportR87-1). Cambridge, MA.
Sanchez, J., & Satir, A. (2005). Hotel yield managementusing different reservation modes. InternationalJournal of Contemporary Hospitality Management,17(2), 136–146. doi:10.1108/09596110510582332
Schwartz, Z. (2006). Advanced booking and revenue man-agement: Room rates and the consumers’ strategiczones. International Journal of HospitalityManagement, 25(3), 447–462. doi:10.1016/j.ijhm.2005.02.002
Schwartz, Z. (2008). Time, price, and advanced bookingof hotel rooms. International Journal of Hospitality &Tourism Administration, 9(2), 128–146. doi:10.1080/15256480801907885
Schwartz, Z., & Cohen, E. (2004). Subjective estimates ofoccupancy forecast uncertainty by hotel revenue man-agers. Journal of Travel & Tourism Marketing, 16(4),59–66. doi:10.1300/J073v16n04_08
Schwartz, Z., & Hiemstra, S. (1997). Improving the accu-racy of hotel reservations forecasting: Curves similarityapproach. Journal of Travel Research, 36(1), 3–14.doi:10.1177/004728759703600102
Talluri, K. T., & Ryzin, G. J. V. (2005). The theoryand practice of revenue management. New York, NY:Springer.
Tse, T. (2012). The experience of creating a teaching hotel:A case study of hotel ICON in Hong Kong. Journal ofHospitality & Tourism Education, 24(1), 17–25.doi:10.1080/10963758.2012.10696658
Upchurch, R., Ellis, T., & Seo, J. (2004). Applying thehierarchical cluster analysis procedure upon the processof yield management – a comparative study. Journal ofTravel & Tourism Marketing, 16(4), 47–58.doi:10.1300/J073v16n04_07
Weatherford, L., & Kimes, S. (2003). A comparison offorecasting methods for hotel revenue management.International Journal of Forecasting, 19(3), 401–415.doi:10.1016/S0169-2070(02)00011-0
Weatherford, L., Kimes, S., & Scott, D. (2001).Forecasting for hotel revenue management: Testingaggregation against disaggregation. The Cornell Hoteland Restaurant Administration Quarterly, 42(4), 53–64. doi:10.1016/S0010-8804(01)80045-8
16 JOURNAL OF TRAVEL & TOURISM MARKETING
Dow
nloa
ded
by [
Iow
a St
ate
Uni
vers
ity]
at 1
3:39
28
Sept
embe
r 20
15
Yuksel, S. (2007). An integrated forecasting approachto hotel demand. Mathematical and ComputerModelling, 46(7–8), 1063–1070. doi:10.1016/j.mcm.2007.03.008
Zakhary, A., Gayar, N., & Atiya, A. (2008). A compara-tive study of the pickup method and its variations usinga simulated hotel reservation data. The InternationalJournal of Artificial Intelligence and MachineLearning, 8(special issue), 15–21.
SUBMITTED: July 18, 2013FINAL REVISION SUBMITTED:
June 19, 2014ACCEPTED: June 26, 2014
REFEREED ANONYMOUSLY
APPENDIX
Bookings-on-hand and bookings-to-come forMonday
Days beforeDay 0
Bookings-on-hand Percentage ofbookings-to-come
Mean Standarddeviation
Mean(%)
Standarddeviation
84 25.3 20.9 86.9 10.077 29.4 21.8 84.8 10.470 33.1 23.6 82.8 11.663 38.0 24.9 80.2 12.456 43.3 25.6 77.4 12.749 51.6 27.7 73.1 14.042 59.7 29.7 68.7 15.135 71.4 31.9 62.9 15.628 86.0 34.6 55.5 16.121 102.0 35.7 47.2 15.514 125.1 37.2 35.3 14.57 151.3 34.6 21.6 11.30 193.2 35.0 0 0
Bookings-on-hand and bookings-to-come forTuesday
Days beforeDay 0
Bookings-on-hand Percentage ofbookings-to-come
Mean Standarddeviation
Mean(%)
Standarddeviation
84 24.6 22.0 87.4 10.177 29.2 24.2 85.1 11.270 32.9 25.6 83.2 12.163 38.3 27.6 80.4 12.856 44.5 29.5 77.2 13.749 52.4 32.4 73.1 15.042 60.9 35.5 68.7 16.335 71.8 36.8 63.2 16.528 86.3 39. 1 55.9 16.821 102.2 39.8 47.6 16.314 124.1 41.5 36.6 14.97 149.1 36.9 23.6 10.80 195.9 41.7 0 0
Bookings-on-hand and bookings-to-come forWednesday
Days beforeDay 0
Bookings-on-hand Percentage ofbookings-to-come
Mean Standarddeviation
Mean(%)
Standarddeviation
84 26.2 20.8 86.9 9.577 31.1 23.9 84.6 10.970 35.9 25.1 82.1 11.563 42.2 27.5 79.0 12.456 48.9 30.6 75.7 13.649 56.3 32.3 72.0 14.042 66.0 36.3 67.2 15.435 76.6 37.9 61.9 16.028 92.1 40.3 54.3 16.321 109.1 40.9 45.7 15.714 130.4 42.7 34.9 15.27 156.3 37.3 21.7 11.40 200.4 40.0 0 0
Tony Sze Ming Tse and Yiu Tung Poon 17
Dow
nloa
ded
by [
Iow
a St
ate
Uni
vers
ity]
at 1
3:39
28
Sept
embe
r 20
15
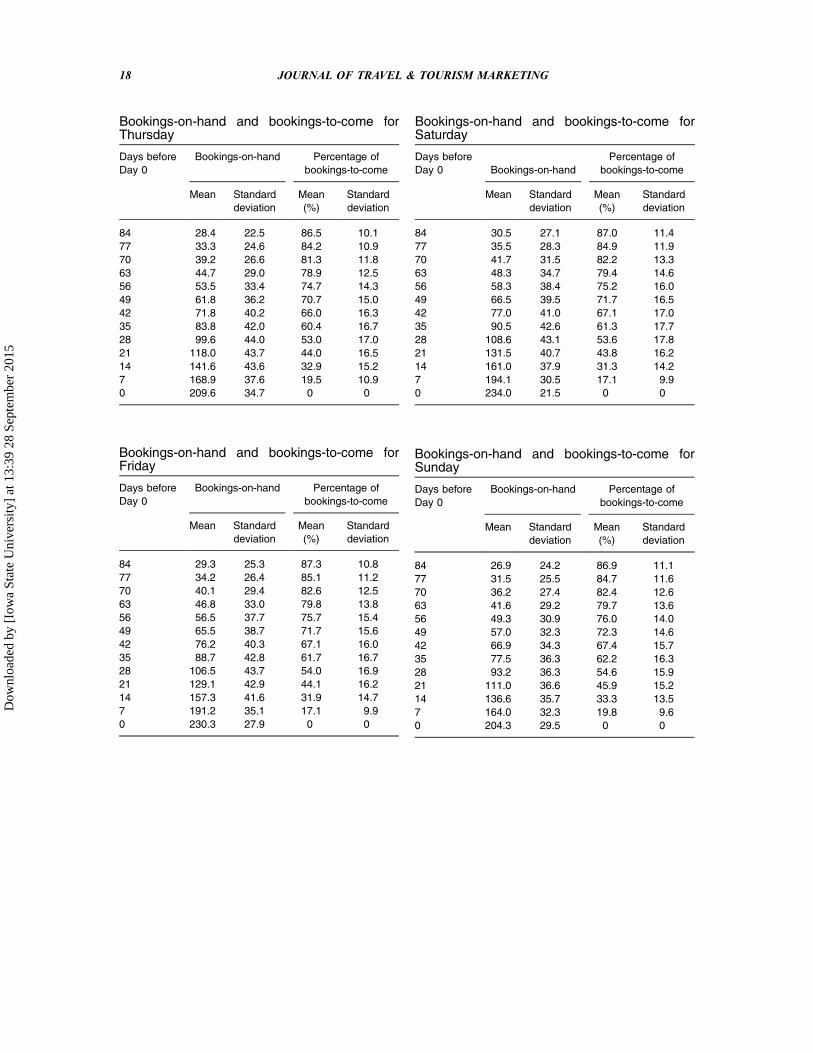
Bookings-on-hand and bookings-to-come forThursday
Days beforeDay 0
Bookings-on-hand Percentage ofbookings-to-come
Mean Standarddeviation
Mean(%)
Standarddeviation
84 28.4 22.5 86.5 10.177 33.3 24.6 84.2 10.970 39.2 26.6 81.3 11.863 44.7 29.0 78.9 12.556 53.5 33.4 74.7 14.349 61.8 36.2 70.7 15.042 71.8 40.2 66.0 16.335 83.8 42.0 60.4 16.728 99.6 44.0 53.0 17.021 118.0 43.7 44.0 16.514 141.6 43.6 32.9 15.27 168.9 37.6 19.5 10.90 209.6 34.7 0 0
Bookings-on-hand and bookings-to-come forFriday
Days beforeDay 0
Bookings-on-hand Percentage ofbookings-to-come
Mean Standarddeviation
Mean(%)
Standarddeviation
84 29.3 25.3 87.3 10.877 34.2 26.4 85.1 11.270 40.1 29.4 82.6 12.563 46.8 33.0 79.8 13.856 56.5 37.7 75.7 15.449 65.5 38.7 71.7 15.642 76.2 40.3 67.1 16.035 88.7 42.8 61.7 16.728 106.5 43.7 54.0 16.921 129.1 42.9 44.1 16.214 157.3 41.6 31.9 14.77 191.2 35.1 17.1 9.90 230.3 27.9 0 0
Bookings-on-hand and bookings-to-come forSaturday
Days beforeDay 0 Bookings-on-hand
Percentage ofbookings-to-come
Mean Standarddeviation
Mean(%)
Standarddeviation
84 30.5 27.1 87.0 11.477 35.5 28.3 84.9 11.970 41.7 31.5 82.2 13.363 48.3 34.7 79.4 14.656 58.3 38.4 75.2 16.049 66.5 39.5 71.7 16.542 77.0 41.0 67.1 17.035 90.5 42.6 61.3 17.728 108.6 43.1 53.6 17.821 131.5 40.7 43.8 16.214 161.0 37.9 31.3 14.27 194.1 30.5 17.1 9.90 234.0 21.5 0 0
Bookings-on-hand and bookings-to-come forSunday
Days beforeDay 0
Bookings-on-hand Percentage ofbookings-to-come
Mean Standarddeviation
Mean(%)
Standarddeviation
84 26.9 24.2 86.9 11.177 31.5 25.5 84.7 11.670 36.2 27.4 82.4 12.663 41.6 29.2 79.7 13.656 49.3 30.9 76.0 14.049 57.0 32.3 72.3 14.642 66.9 34.3 67.4 15.735 77.5 36.3 62.2 16.328 93.2 36.3 54.6 15.921 111.0 36.6 45.9 15.214 136.6 35.7 33.3 13.57 164.0 32.3 19.8 9.60 204.3 29.5 0 0
18 JOURNAL OF TRAVEL & TOURISM MARKETING
Dow
nloa
ded
by [
Iow
a St
ate
Uni
vers
ity]
at 1
3:39
28
Sept
embe
r 20
15


![Home [] · 2021. 2. 24. · samsung samsung samsung samsung samsung advance advance advance advance advance advance advance advance advance advance 223sw 2233sw 2233sw 2233sw 933sn](https://img.pdfslide.net/doc/110x75/613cd1974c23507cb6359ff0/home-2021-2-24-samsung-samsung-samsung-samsung-samsung-advance-advance.jpg)